

Introduction
Investigation of heavy metals in snow and ice in central Greenland, Antarctica and the European Alps has proved that atmospheric pollution by heavy metals has increased since the industrial revolution, and pronounced enhancement of heavy metals is observed during recent decades (Reference Murozumi, Chow and PattersonMurozumi and others, 1969; Reference Boutron and LoriusBoutron and Lorius, 1979; Reference Boutron and PattersonBoutron and Patterson, 1983; Reference Görlach and BoutronGärlach and Boutron, 1992; Reference Boutron, Candelone and HongBoutron and others, 1995; Reference Candelone, Hong, Pellone and BoutronCandelone and others, 1995; Reference BarbanteBarbante and others, 1999, Reference Barbante2004; Reference Van de VeldeVan de Velde and others, 1999, Reference Van de Velde2000a, b; Reference Wolff, Suttie and PeelWolff and others, 1999; Reference PlanchonPlanchon and others, 2002; Reference HongHong and others, 2004; Reference SchwikowskiSchwikowski and others, 2004).
Although there are some data on the occurrence of heavy metals in snow and ice from the Tibetan Plateau over the last few years, the data are mainly from a few surface snow samples and ice cores, and include only a few metals such as Cd and Pb (Reference Xiao, Qin, Yao, Ren and LiXiao and others, 2001; Reference Li, Yao and WangLi and others, 2002). This lack of data is surprising since these heavy metals in snow and ice located in high-elevation regions of the Tibetan Plateau provide a good opportunity to reconstruct past changes in atmospheric trace metals in central Asia.
Here we present the results of recent advances in trace metal analysis, including Al, Ba, Mn, Rb, Sr, Cs, Sb and Bi, from various sections of a 41 m ice core dated from 1955 to 2000 from a high-elevation site (7010m) in the east Pamirs of the western Tibetan Plateau, central Asia. The data enable us to assess recent changes in atmospheric heavy metals on a regional scale in mid-latitude areas in central Asia. In addition, the results from this study provide heavy-metal data from the highest-elevation ice core yet reported, which will help us to understand the background levels of heavy metals in the atmosphere in high-elevation regions of central Asia.
Methods
Sampling
In the summer of 2003, a 41.6 m firn/ice core with a diameter of 9.4–9.5 cm was drilled at 7010 ma.s.l. on a gentle slope of Muztagh Ata glacier (Fig. 1) located in the east Pamirs. The firn/ice core was transported frozen to the Key Laboratory of Cryosphere and Environment, Chinese Academy of Sciences, Lanzhou, and was kept in a cold room. A quarter cross-section of the 41.6m firn/ice core was selected for heavy-metal analysis. The quarter-section of the firn/ice core was cut into successive subsections 10–25cm in length, and 101 sections were selected for trace metal analysis. Because the core can potentially be contaminated in the field or during transport, it was necessary to decontaminate the outer sections. We designed a low-density polyethylene (LDPE) lathe for decontaminating firn/ice core samples, adapted from Reference Candelone, Hong and BoutronCandelone and others (1994). Modifications were made mainly on the mobile LDPE pillar and both tumblers, as well as the base plate of the lathe. It is suitable not only for full-section cylindrical cores, but also for quarter-cores and half-cores. Although the upper part of the Muztagh Ata core is firn, it is very firm, enabling us to use this method.
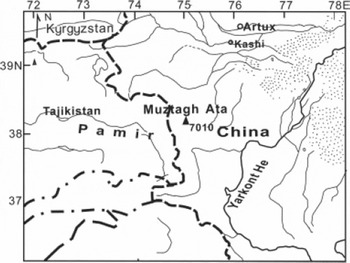
Fig. 1. Location of a high-elevation firn/ice core drilled on the Muztagh Ata peak in east Pamirs, central Asia. The drilling site is shown as a solid triangle.
Scalpels pre-cleaned with Milli-Q element water were used for manually scraping the outside of all subsections. Three successive ∼0.45 cm thick layers were scraped during decontamination inside a class 100 laminar-flow clean bench in a cold room with a temperature of −15˚C. In addition, 1−2 cm of both ends of the subsections was also removed. Some longer subsections were cut into two parts using an acid pre-cleaned stainless-steel chisel. All the scraped samples were collected into pre-cleaned LDPE bottles and stored frozen.
The LDPE bottles, containers, tongs, etc., were pre-cleaned, combining cleaning procedures employed by Reference BoutronBoutron (1990) and Reference Hong, Lluberas and RodriguezHong and others (2000). However, 0.1% HNO3 diluted from 65% Merk ‘Suprapur’ was used instead of 60% Merk ‘Ultrapur’ in the last two acid baths. Finally, all items were rinsed with Milli-Q element ultrapure water and dried just before use. Samples were melted at room temperature inside a class 100 laminar-flow clean bench located in a class 1000 clean room and acidified with 60% HNO3 (1+200, ‘Ultrapur’, Merk). After 3−5 hours acidified samples were frozen; the samples were melted again just before analysis. The total procedural blank was determined by processing an artificial ice core made by freezing Milli-Q ultrapure water. A quarter of the artificial ice core was scraped from outside to inside to make sure that the innermost part of the quarter-core was free from contamination.
Figure 2 illustrates the decontamination procedure. The procedural blanks are as follows: 2.43 ng mL−1 for Al, 61 pg mL−1 for Mn, 55 pgmL−1 for Sr, 0.4 pg mL−1 for Cs, 1 pg mL−1 for Sb and 0.7 pg mL−1 for Bi. Thus the blank values need to be subtracted from all data. Changes of heavy metals from the outside to the inside of some quarter subsections were also investigated. Typical outside–inside concentration profiles are shown in Figure 3. The results indicate that the decontamination procedure is sufficient and concentrations of metals in the central core represent the genuine values of metals.

Fig. 2. Change in selected metal concentrations from the center outward as measured in a quarter cross-section of an artificial ice core.

Fig. 3. Change in Al, Sr, Ba, Mn, Sb and Bi concentrations from the center outward as measured in a quarter cross-section of the Muztagh Ata ice core between 24.58 and 24.76 m. Although slight changes in metal concentrations can be found in the center samples, they are within the range of each metal’s standard deviation.
Analytical procedures
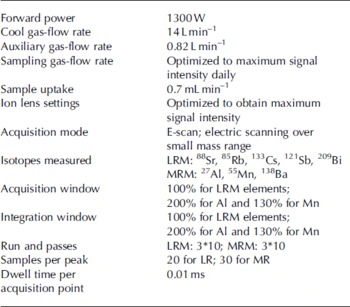
All the measurements were performed using a Finnigan MAT Element (Finnigan MAT, Bremen, Germany) inductively coupled plasma sector-field mass spectrometer (ICP-SFMS), which is located in a class 1000 clean room with a class 100 analysis area and a class 100 workbench. The instrument conditions and measurement parameters used throughout this work are reported in Table 1.
Table 1. Instrument settings and measurement parameters for the Finnigan MAT Element ICP-SFMS
External calibration curves were used for quantification; no internal standard was added in the analysis, in order to avoid instrument contamination. Standard solutions were prepared through successive dilution of a 100 μg mL−1 single-element stock solution from the National Research Center for Standard Reference Material, China. Ranges of element concentrations in the standard solutions are as follows: 0.01–10 ng mL−1 for Ba, Sr and Cs; 5–100 pg mL−1 for Sb and Bi; and 1–100ngmL−1 for Al and Mn. We selected the range of standards for the calibration curves based on the concentration of metals in the samples. For the lower metal concentrations in the samples, we used a lower range of standard points in the curve, and for higher metal concentrations the curve included higher concentration standards.
Detection limits for heavy metals were determined by measuring a 1 % HNO3 solution ten times, and were calculated as three times the standard deviation of the ten measurements. The detection limits obtained are (in pg mL−1): 472 for Al; 23.4 for Ba, 6.7 for Mn; 0.34 for Rb; 2.7 for Sr; 0.61 for Cs; 0.27 for Sb; and 0.34 for Bi. The precision of the measurements in terms of relative standard deviation was obtained from one ice section, and based on four consecutive measurements: Al 215 ng mL−1 (4.0%), Ba 6.0 ngmL−1 (11.1%), Mn 24.6 ng mL−1 (1.2%), Rb 0.59 ngmL−1 (1.5%), Sr 6.4 ngmL−1 (2.2%), Cs 51 pgmL−1 (3.5%), Sb 19 pg mL−1 (22.6%) and Bi 6 pg mL−1 (8.9%).
Standard reference material 1640 (trace elements in natural water, National Institute of Standards and Technology, USA) was used for evaluating the accuracy of the method. The standard reference water was diluted 50 times with 1 % HNO3 before analysis. The results obtained for selected metals, together with certified values, are reported in Table 2. Our data agree well with certified values for selected metals.
Table 2. Concentrations of selected heavy metals of NIST-1640 determined by a double-focusing ICP-SFMS

Ice-core dating
The firn/ice core was dated using seasonal variations in δ18O, and a peak in gross beta radioactivity from the atmospheric nuclear weapons tests between 37.24 and 37.89m verifies the dating in 1963. The dating shows that the ice at 41.6 m corresponds to 1955. The top 1.5 m of the core was lost, so the uppermost section of the core corresponds to the year 2000.
Results and Discussion
Data statistics
Statistics for concentrations of trace metals are summarized in Table 3. There are pronounced variations from minimum concentrations to maximum concentrations for different metals. For example, the highest concentration (329 ng mL−1) of Al is almost 28 times greater than the lowest concentration (11.7 ng mL−1). The highest concentrations of Sb (51 pg mL−1) and Bi (31 pg mL−1) are almost 30 times greater than the corresponding lowest concentrations of each metal.
Table 3. Statistics for elemental concentrations of 101 firn/ice-core samples in the Muztagh Ata peak determined by ICP-SFMS

Trends from the mid-1950s to 2000
Figure 4 illustrates changes in Al, Mn, Ba, Sr, Sb and Bi concentrations as a function of age. To our knowledge, these are the first published heavy-metal time series for snow and ice from the Tibetan Plateau and central Asia. Although the concentration profiles are not complete due to lack of data in some years, it is clear that there are relatively large variations in the concentrations, indicating significant interannual variations of metals input to Muztagh Ata glacier from the mid-1950s to 2000. It should be noted that due to varying sampling resolutions, some samples may largely be from summer or winter layers. Thus, some of the variability may be due to seasonal variations.

Fig. 4. A l , Sr, Ba, Mn, Sb and Bi concentrations in the Muztagh Ata firn/ice core from the mid-1950s to 2000. The data shown are mean annual values; however, the samples are not evenly spaced during the year. For example, there are no samples for 1957, 1958, 1960, 1964; only one sample for 1955, 1956, 1959, 1961, 1962, 1963, 1972, 1977, 1986, 1992, 1999 and 2000; only two samples for 1966, 1967, 1971, 1974, 1975, 1982, 1989, 1990, 1991 and 1995; and three to six samples for the other years. Therefore, seasonal variations cannot be determined. The thicker line is a 5 year running mean.
It is shown that there is a slight increase for Al, Ba, Mn and Sr from the mid-1960s to the early 1990s, with fluctuations. Concentrations increased from the early 1980s to their highest values in the early 1990s, and decreased afterwards. Different changes can be observed for Sb, which increased steadily from the mid-1950s to the early 1990s. The highest concentration of Bi occurred in the mid-1990s, which is later than that of the other metals. Additionally, for all metals, concentrations are lower in the mid-1950s and the mid-1960s. Higher concentrations of most metals occur in 1959.
Contribution from natural sources
Natural sources of heavy metals include rock and soil dust, sea-salt spray, marine biogenic activities, volcanic activities, continental bioactivities and wild forest fires (Reference NriaguNriagu, 1989; Reference Hinkley, Lamothe, Wilson, Finnegan and GerlachHinkley and others, 1999). Central Asia is dominated by an extremely continental climate, and arid and semi-arid regions are expanding. Because of increasing aridity, rock and soil dust are the primary natural sources of heavy metals in the Muztagh Ata firn/ice core.
In order to better evaluate the importance of the rock- and soil-dust contribution to metals in the Muztagh Ata firn/ice during the studied period, the crustal enrichment factors (EFc) of heavy metals are calculated. EFc is defined as the concentration ratio of a given metal to that of Al (which is generally regarded as a good proxy of rock and soil dust), normalized to the same concentration ratio of the upper continental crust given by Reference WedepohlWedepohl (1995). For example, the EFc for Sb is:
Table 4 lists the EFc values of metals in the Muztagh Ata firn/ ice core. Figure 5 also illustrates changes of EFc values during the period covered by the core. The EFc values in the range 0.1–10 indicate a dominant input from rock and soil dust, whereas EFc values greater than 10 indicate a non-crustal source, potentially including anthropogenic sources (Reference FerrariFerrari and others, 2001). EFc values for Rb, Sr, Ba and Cs are below 10 and close to 10 for Mn, and do not vary greatly during the period covered by the core, especially that of Ba, which remains nearly constant. Excluding the highest EFc value of Cs (20) in one sample from 1974, which is discussed later, our results suggest that these five metals mainly originated from the crust. Highest EFc values of Bi (435) and Cs (20), together with higher EFc value of Sb (111), occurred in one sample from 1974. For this sample, concentrations of the three metals do not significantly differ from the mean concentrations of each metal. The high EFc values are likely due to particularly low Al (24.6 ng mL−1) in the sample. In addition, higher concentrations of most metals occurred in 1959, but EFc values of metals were lower. We speculate that the enhancement of metals in 1959 may be linked with a natural event, rather than anthropogenic pollution.
Table 4. Statistics for EFc values of heavy metals in the Muztagh Ata firn/ice core

Fig. 5. Crustal enrichment factors for Rb, Sr, Cs, Ba, Sb and Bi as a function of age in the Muztagh Ata firn/ice core. The data are mean annual EFc values. The solid lines are 5 year running mean.
EFc values of Sb and Bi are significantly higher than 10. Furthermore, both show a clear increasing trend, especially for the recent period of the record, if the high values of Sb (111) and Bi (435) from the sample from 1974 are excluded. This suggests that a large fraction of both metals in Muztagh Ata originate from other natural and/or anthropogenic sources.
Sea-salt spray is probably a negligible source of Sb and Bi to the glacier because of the remoteness of Muztagh Ata peak from the ocean, and the elevation of the core site. Volcanism, which is also a potential natural source of Sb and Bi, would not contribute more of these metals than rock and soil dust, and is therefore probably not the cause of the high EFc values observed for both metals. Based on previous work (Reference NriaguNriagu, 1989), contributions of Sb and Bi from other natural sources including continental bioactivity, wild forest fires and marine bioactivity can also be considered negligible. Thus natural sources of heavy metals do not appear to explain the high excess of Sb and Bi in the ice core, and the observed excesses are most likely due to anthropogenic inputs.
Contribution from anthropogenic sources
As mentioned above, high EFc values of both Sb and Bi indicate potential sources from anthropogenic activities. Thus the following discussion mainly focuses on both Sb and Bi. Possible anthropogenic sources of Sb and Bi include fossil fuel combustion, non-ferrous metal mining and smelting, aluminum and ferro-manganese plant production, and waste disposal (Reference Nriagu and PacynaNriagu and Pacyna, 1988; Reference FerrariFerrari and others, 2000; Reference Pacyna and PacynaPacyna and Pacyna 2001). Because atmospheric circulation at Muztagh Ata is mainly influenced by the westerly jet, the occurrence of heavy metals in the Muztagh Ata firn/ice core probably reflects atmospheric pollution by heavy metals in regions west of China. The only available regional data with which our results can be compared are the Sb production-history data from the Kadamjai antimony plant in southern Kyrgyzstan (Reference Bogdetsky, Stavinkiy, Shukurov and SuyunbaevBogdetsky and others, 2001), which borders China to the west. The Kadamjai Sb production shows a steady increasing trend from the mid-1950s to the beginning of the 1990s, after which Sb production decreases. Our Sb data also display a clear increasing trend from the mid-1950s to the beginning of the 1990s and then Sb concentrations decrease (Fig. 6). The similar trends in Sb concentrations from the Muztagh Ata firn/ice core and the Kadamjai antimony plant over the study period indicate that our Sb data are a good proxy for Sb production in Kyrgyzstan, and that the emission of Sb to the atmosphere by human activities increased steadily in central Asia from the mid-1950s onwards, followed by a reduction in anthropogenic activities during the 1990s. The increased EFc values of Sb confirm the increased anthropogenic activities from the mid-1960s to the early 1990s (Fig. 5). However, the trend of Sb EFc values slightly differs from that of Sb production after 1990. The Sb EFc increases until the mid-1990s, then decreases. The difference in the trends of Sb and Sb EFc may be due to the low concentrations of Al in corresponding samples during the 1990s. Additionally, Sb deposited at Muztagh Ata likely has sources in addition to the Kyrgyzstan Sb plant, which may explain the differences in the records during the 1990s.

Fig. 6. Change in Sb concentrations in Muztagh Ata firn/ice core compared to the Sb production of Kadamjai antimony plant in Kyrgyzstan. Years without sample (e.g. 1957, 1958, 1960 and 1964) were eliminated; the solid line for Sb concentrations is 5 year running mean.
For Bi, we were unable to find a comprehensive time series of anthropogenic emissions to the atmosphere in central Asia. However, the EFc values of Bi also display an increasing trend during the study period (Fig. 5), supporting the possibility that anthropogenic sources of Bi also increased during this period.
Conclusions
This study presents the first snow/ice time series for Al and other heavy metals, including Ba, Sr, Mn, Cs, Sb and Bi, from Muztagh Ata glacier. Records of these metals in central Asia during recent decades are of great environmental interest, and the data presented here provide insight into regional-scale changes in atmospheric pollution from the mid-1950s to 2000. An in-depth study of seasonal changes in these heavy metals will help to further clarify the transport mechanisms and sources of metals to the region, and a longer time series of heavy metals from the Muztagh Ata ice core will be produced in the future. Additionally, it will be of interest to expand this study to include other heavy metals such as Pb, Cu, Zn, Cd, V, Cr, Ni , Mo, Ag, Pt, Tl and U.
Acknowledgements
This research was supported by the National Nature Science Foundation of China (40121101), Century Program of Chinese Academy of Science (2004401), the Knowledge Innovation Project of the Chinese Academy of Sciences (KZCX3-SW-339), and the Science and Technology Department Foundation of China (2001CCB00300). We thank members of the 2003 Muztagh Ata peak glaciological expedition for their hard work in the field. We also thank three anonymous reviewers for their valuable suggestions for improving the paper, S. Kaspari for help and revisions, and T. Mashiotta and E. Mosley-Thompson for kind advice.


