

Increasing the intake of folate or folic acid during preconception and early in pregnancy can significantly reduce the risk of neural tube defects (NTD) in newborns(Reference Czeizel and Dudas1, 2). Increased intake may also reduce the risk of myocardial infarction (MI) and colon cancer(Reference Bazzano, Reynolds, Holder and He3–Reference Wald, Wald, Morris and Law16) and increase the risk that symptoms of vitamin B12 deficiency are masked(Reference Bentley, Ferrini and Hill4, Reference Dickinson5, Reference Koehler, Pareo-Tubbeh, Romero, Baumgartner and Garry7, Reference Tucker, Mahnken, Wilson, Jacques and Selhub12), thereby allowing the neurological manifestations of the disease to progress(Reference Bentley, Ferrini and Hill4).
In 1998, the US Food and Drug Administration mandated that manufacturers add 140 μg of folic acid per 100 g of enriched cereal-grain product(11, 13, 14), and several studies have shown that such fortification provides substantial health and economic benefits(Reference Erickson6, Reference Mathews, Honein and Erickson8, 9, 13, 14, Reference Williams, Mai, Edmonds, Shaw, Kirby, Hobbs, Sever, Miller, Meaney and Levitt17–Reference Grosse, Waitzman, Romano and Mulinare21). However, the potential economic and health effects of this and alternative fortification policies have not been evaluated using national post-policy data adjusted for measurement error, while considering all four relevant health outcomes among population subgroups.
Accordingly, the present analysis quantifies the projected health and economic outcomes for NTD, MI, colon cancers and B12 maskings associated with the changes in folic acid consumption following fortification in the USA, as well as for alternative fortification levels.
Methods
Overview
Population-wide disease burden and the associated costs and quality-adjusted life years (QALY) were projected under four scenarios: no fortification, or fortification with 140, 350 or 700 μg of folic acid per 100 g enriched grain. The no-fortification strategy reflects the pre-fortification levels of folate intake, the 140 μg strategy reflects the current post-fortification intake in the USA, and fortifying with 350 and 700 μg are hypothetical scenarios(13, Reference Romano, Waitzman, Scheffler and Pi19, 20). The four scenarios differ only in terms of the distribution of folate intake in the population, which we model in four categories: ≤200, 201–300, 301–400 and >400 μg/d.
For each scenario, we projected the steady-state number of NTD, MI, colon cancers and B12 maskings among a US population of non-institutionalised, non-Hispanic white (heretofore referred to as ‘white’), non-Hispanic black (‘black’) and Mexican-American persons aged 15 years or older. Other racial/ethnic subgroups were not included because of insufficient sample size on which to base folate intake estimates. For each folate intake category, we estimated age-, gender- and race/ethnicity-specific risks of developing each of the four health outcomes. We then assigned lifetime QALY losses and disease-related net costs for each health outcome, using either published estimates or a Markov modelling approach, to calculate the population-wide impact of each strategy.
Folate intake distributions
Estimates of population-based folate intake distributions were previously derived using food and dietary supplement data from two periods of the National Health and Nutrition Examination Surveys (NHANES)(Reference Bentley, Willett, Weinstein and Kuntz22). Briefly, data from NHANES III (1988–1994) were used to estimate pre-fortification food folate intake, and those from NHANES 1999–2000 were used to estimate both dietary supplement intake and post-fortification food folate intake. Because nutrient intake data are based primarily on one 24h dietary recall measure, which does not represent an individual’s average long-term daily intake, population distribution estimates of dietary folate intake were corrected for measurement error using a sub-sample of NHANES III subjects who had provided two 24 h recalls. Total folate intake distributions before and after the fortification policy, corrected for measurement error, are shown in Fig. 1 and in the Appendix. Folate intake for the two hypothetical scenarios was estimated as the product of the pre–post differences in corrected food folate intake and the ratio of the higher to the current levels (e.g. 350/140 for the 350 μg strategy), plus the post-fortification supplement intake.
Daily total folate intake distributions pre- v. -post fortification by gender and race/ethnicity, corrected for measurement error (![]() , pre;
, pre; ![]() , post). Reprinted with permission from the American Public Health Association from Bentley TGK, Willett WC, Weinstein WC and Kuntz KM. Population-level changes in folate intake by age, gender, and race/ethnicity after folic acid fortification(Reference Bentley, Willett, Weinstein and Kuntz22)
, post). Reprinted with permission from the American Public Health Association from Bentley TGK, Willett WC, Weinstein WC and Kuntz KM. Population-level changes in folate intake by age, gender, and race/ethnicity after folic acid fortification(Reference Bentley, Willett, Weinstein and Kuntz22)

Disease incidence
Annual incidence of the four disease outcomes prior to fortification was estimated as a function of age range, gender and race/ethnicity (Table 1). When data were not available for the Mexican-American population, the rates for the Hispanic population were used.
Estimates of annual disease risk per 100 000 personsFootnote *

* Some age categories have been combined for ease of presentation.
† Non-Hispanic white and non-Hispanic black.
‡ Annual rate of vitamin B12 masking and pernicious anaemia and total folate intake >1000 μg/d.
All women between the ages of 15 and 44 years(23–Reference Petrini, Damus, Johnston and Mattison26) were considered at risk for an NTD-affected pregnancy. NTD incidence as a function of race/ethnicity was based on estimates from the Centers for Disease Control and Prevention (CDC) of 10·6 cases of spina bifida and anencephaly per 10 000 live births(9, Reference Williams, Rasmussen, Flores, Kirby and Edmonds27). Live birth rates from the National Center for Health Statistics(Reference Hamilton, Sutton and Ventura28) were used to calculate NTD incidence per 100 000 women aged 15–44 years.
MI incidence was based on calculations by gender and age from the Framingham Risk Equations(Reference Anderson, Odell, Wilson and Kannel29). The relative racial/ethnic distribution of MI incidence was assumed to be the same as that of CHD-specific death among each age and gender-specific subgroup(30). Subgroup-specific annual colon cancer incidence rates were derived from the Surveillance, Epidemiology, and End Results Program (SEER) of the National Cancer Institute(31–33).
Vitamin B12 masking was defined as the delayed diagnosis of B12 deficiency followed by the development of neurological complications. Estimates of masking risk incorporated the probability of consuming greater than 1000 μg folate/d(Reference Bentley, Willett, Weinstein and Kuntz22) – the ‘tolerable upper intake level’ for folic acid(10, 11) – and the risk of pernicious anaemia (PA) – a common cause of B12 deficiency(Reference Romano, Waitzman, Scheffler and Pi19, Reference Borch and Liedberg34, Reference Pedersen and Mosbech35).
Folate-specific incidence of each disease was calculated by using data on the percentage of the population in each folate intake category (Fig. 1) and the relative risks of disease by folate intake to split out the subgroup-specific disease rates. The risk of NTD was reduced by 50 % for women with folate intake levels of greater than 400 μg/d(Reference Czeizel and Dudas1, 2, 13, 14, Reference Romano, Waitzman, Scheffler and Pi19, 20), and the relative reduction of MI risk for individuals with folate intake greater than 400 μg/d was 24 %(Reference Rimm, Willett, Hu, Sampson, Colditz, Manson, Hennekens and Stampfer36). The risk ratios for colon cancer diagnosis by folate intake were 0.92, 0·79 and 0·69 for 201–300, 301–400 and >400 μg/d, respectively, compared with ≤200 μg/d(Reference Giovannucci, Stampfer, Colditz, Hunter, Fuchs, Rosner, Speizer and Willett37). Relative risks for MI and colon cancer were assumed to be the same for men and women.
Valuing outcomes
The number of disease events associated with each strategy were estimated as the product of incidence and national population estimates for each subgroup(38). The numbers of events were multiplied by the associated QALY lost and net costs per event (Table 2) to estimate the net health and economic impact of each fortification strategy. All QALY and cost estimates were discounted by 3 % per year.
Net costs incurred and QALY lost associated with NTD, MI, colon cancer and vitamin B12 masking eventsFootnote *

QALY, quality-adjusted life years; NTD, neural tube defects; MI, myocardial infarctions; CC, colon cancer; B12, vitamin B12 masking.
* Assuming a 3 % discount rate.
Health related quality-of-life
Estimates of QALY lost for NTD and B12 masking outcomes were based on a CDC cost-effectiveness analysis(20) that used the Quality of Well-Being Index(Reference Kaplan and Anderson39). To estimate the QALY lost associated with MI and colon cancer we used a Markov modelling approach in which we incorporated disease-specific mortality, health-related quality-of-life weights and mortality from other causes(Reference Abby, Harris and Harris40–42). For MI, we assumed the same utility for patients with coronary artery disease (CAD) of 0·84, calculated from previous analyses as the mean of mild and severe angina, weighted by the proportion of angina patients with CAD(Reference Cohen, Taira, Berezin, Cox, Morice, Stone and Grines43–Reference Kuntz, Fleischmann, Hunink and Douglas45). For colon cancer, life expectancy after diagnosis was weighted by stage-specific mortality and we assumed a stage-weighted utility of 0·76(Reference Ness, Holmes, Klein and Dittus46).
Costs
All costs were adjusted to 2005 dollars using the Consumer Price Index. For costs incurred with NTD, estimates from a published analysis(Reference Grosse, Waitzman, Romano and Mulinare21) were used, weighted for relative proportions of spina bifida and anencephaly(9). Costs incurred with MI events incorporated short-term care(Reference Cohen, Taira, Berezin, Cox, Morice, Stone and Grines43) as well as annual outpatient, medications and diagnostic costs for a typical CAD patient(Reference Kuntz, Fleischmann, Hunink and Douglas45, Reference Wong, Sonnenberg, Salem and Pauker47, Reference Stinnett, Mittleman and Weinstein48), which were assumed to be applicable to MI patients. Costs incurred with colon cancer incorporated stage-weighted estimates from the Institute of Medicine(Reference Frazier, Colditz, Fuchs and Kuntz49–Reference Wagner, Tunis, Brown, Ching and Almeida56), and those associated with cases of masked B12 deficiency were based on calculations by the CDC(20). Estimates of annual fortification costs for the 140 μg fortification strategy ($3·3 million) were based on those used by Grosse and colleagues(Reference Grosse, Waitzman, Romano and Mulinare21), and those for the two hypothetical scenarios ($6·0 and $10·6 million for 350 μg and 700 μg fortification strategies, respectively) incorporated the fixed cost estimates from Grosse et al. and the CDC’s estimates of bulk folic acid costs, adjusted for cost declines since 1996(20, Reference Grosse, Waitzman, Romano and Mulinare21). The fortification costs were doubled in sensitivity analysis.
Results
Incidence
Figure 2 shows the projected per cent decline in annual disease incidence for NTD, MI and colon cancer, comparing the post-fortification scenarios with pre-fortification.
(a) Per cent decline in annual incidence of neural tube defects, (b) myocardial infarctions and (c) colon cancers, after folic acid fortification, by age, gender, race/ethnicity and fortification strategy (▒, white; ▪, black; ░, Mexican-American)

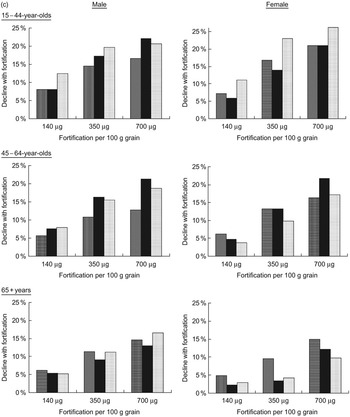
For NTD-affected pregnancies, average annual incidence for all racial/ethnic groups was predicted to decrease by 5 %, 24 % and 39 % for the 140, 350 and 700 μg/100 g fortification scenarios, respectively. Mexican-Americans were consistently projected to have the largest per cent declines and blacks the lowest. Average annual MI incidence was predicted to decrease by 2 %, 8 % and 14 % for the lowest-to-highest post-fortification levels, while projected declines of colon cancer were 2 %, 11 % and 15 %. The racial/ethnic subgroups with the greatest predicted benefit were those with the largest post-fortification increases in per cent reaching the risk-reduction folate intake thresholds for each disease outcome. Among older females, for example, whites were estimated to experience the largest increases in per cent consuming greater than 400 μg total folate/d, and were predicted to experience the greatest declines in disease incidence. On the other hand, older black females were predicted to experience a 0–1 % increase in MI incidence, due to a decrease in the proportion consuming more than 400 μg/d.
Table 3 shows the projected total annual number of events averted, QALY gained and costs incurred for the US population. The model predicted that the greatest benefits would be in MI prevention, with 16 862 cases averted per year at the 140 μg fortification level and 88 172 at the highest fortification level. Between 6261 and 38 805 annual cases of colon cancer and 182 and 1423 annual NTD would be prevented, while 15–820 new annual cases of B12 masking would be caused.
Annual QALY and costs associated with US folic acid fortification, by fortification strategy and outcome

QALY, quality-adjusted life years; NTD, neural tube defects; MI, myocardial infarctions; CC, colon cancer; B12, vitamin B12 masking.
*Strategies labelled by amount of fortification in μg of folic acid added per 100 g of enriched grain product.
†Disease-specific costs do not include fortification costs.
Quality-of-life and cost measures
Fortification was predicted to be cost-saving and to provide positive net QALY gains at all fortification levels, and the 700 μg/100 g strategy was projected to have the largest health gain and cost savings, with over 320 000 QALY gained and over $4 billion saved per year (Table 3). The predicted annual gains of over 26 000 QALY and savings of over $263 million from NTD prevention alone far outweighed the QALY lost and costs incurred from B12 masking and fortification itself, which combined were predicted to result in annual losses of fewer than 260 QALY and $15 million even at the highest fortification level. QALY gains and cost savings due to MI and colon cancers averted each year would be even greater, with MI prevention alone predicted to save 184 000 QALY and $3 billion annually at the 700 μg level.
The model predicted the 700 μg fortification level to yield the greatest net QALY gains and cost savings for all age, gender and racial/ethnic subgroups (Table 4). Benefits were projected to increase with age, with males predicted to benefit more than females in most populations. At all fortification levels, the highest gains were expected in white males aged 65 years and older, with predicted annual gains of over 13 000 QALY and $190 million at the currently enacted level and over 59 000 QALY and $888 million at the 700 μg level. Among racial/ethnic categories, whites were projected to experience the greatest gains and Mexican-Americans the fewest.
Annual QALY and costs (millions of dollars) associated with US folic acid fortification, by gender, age and race/ethnicity

QALY, quality-adjusted life years.
*Strategies labelled by amount of fortification in μg of folic acid added per 100 g of enriched grain product.
Sensitivity analyses
This analysis projected substantial fortification benefits despite predicting at the currently enacted fortification level a 5 % reduction in NTD rates, which is far less than the 20–30 % declines estimated from observed data(Reference Erickson6, Reference Mathews, Honein and Erickson8, 9, Reference Williams, Mai, Edmonds, Shaw, Kirby, Hobbs, Sever, Miller, Meaney and Levitt17). Due to lack of adequate dose–response data, the model allows only for reduced NTD risk at folate consumption of >400 μg/d, yet there may be benefits in NTD risk-reduction at lower levels.
To evaluate the effect of this possibility, three additional NTD dose–response assumptions were tested (Fig. 3a), allowing women to benefit from folate intake over 200 μg/d(Reference Werler, Shapiro and Mitchell57–Reference Wald, Law, Morris and Wald60). Curve A assumes a dose–response gradient similar to that of colon cancer – albeit through different mechanisms – while B and C were calculated by decreasing the risk ratios of function A by 25 % and 50 %, respectively. All three functions maintained the base-case assumption of a 50 % reduced risk for intake >400 μg/d compared with ≤400 μg/d. Given the use of a similar 400 μg/d threshold for reducing the risk of MI by folate intake and evidence of potential benefit at lower levels without a threshold effect(Reference Drogan, Klipstein-Grobusch, Dierkes, Weikert and Boeing61), an analogous sensitivity analysis on this dose–response function was performed (Fig. 3b).
Dose–response assumptions used in sensitivity analyses for (a) neural tube defects (NTD) and (b) myocardial infarctions (MI). Risk is relative to an average folate intake of <200 μg per day (![]() , base case;
, base case; ![]() , A;
, A; ![]() , B;
, B; ![]() , C)
, C)

When risk reduction benefits for NTD and MI were allowed at lower folate intakes, the model predicted that more events would be prevented and there would be greater reductions in disease incidence. The use of NTD function B predicted at the 140 μg level a 23 % risk reduction, the closest approximation to observed data. When applying these functions for both NTD and MI dose–response, the 700 μg strategy was predicted to save 370 000 QALY and $5 billion, compared with 320 000 QALY and $4 billion in the base case (Table 5).
QALY and costs (millions of dollars) associated with folic acid fortification, using alternative NTD and MI dose-response functionsFootnote *

QALY, quality-adjusted life years; NTD, neural tube defects; MI, myocardial infarctions; CC, colon cancer; B12, vitamin B12 masking.
* NTD dose-response function assumes the following relative risks of NTD-affected pregnancy: 0·36; 0·50 and 0·65 for maternal folate intake of >400, 301–400 and 201–300 μg/d, respectively, compared to ≤200 μg/d. MI dose-response function assumes the following relative risks of MI: 0·59; 0·63 and 0·70 for folate intake of >400, 301–400 and 201–300 μg/d, respectively, compared to ≤200μg/d.
† Strategies labelled by amount of fortification in μg of folic acid added per 100 g of enriched grain product.
To evaluate the effect of the model’s other assumptions, a range of estimates were applied for QALY and costs (Table 2), relative risk of NTD-affected pregnancy (10 % and 90 %), masking risk (30–200 % of base case), female PA risk (150 % of base case)(Reference Borch and Liedberg34, Reference Pedersen and Mosbech35, Reference Carmel62), and discount rate (0 % and 5 %). Even with extreme estimates that would bias results away from fortification, none of these variations – applied individually or concurrently – changed the rankings between strategies or the conclusion that QALY gains and cost savings would result from fortification up to the highest level considered. When biasing against fortification overall, the conclusions remained the same, even though the predicted QALY gained and costs saved were smaller: for all subgroups, fortification would remain cost saving, and the 700 μg strategy would provide the greatest total QALY gains, with $486 million saved and over 196 000 QALY gained.
Discussion
It was predicted for three post-fortification strategies that the projected health and economic benefits gained from preventing NTD, MI and colon cancers in the US population far exceeded those lost due to fortification itself and increased B12 masking risk, with significant variations by age, gender and race/ethnicity. For all health outcomes, the QALY and cost benefits to whites were projected to be significantly greater than those to blacks and Mexican-Americans. With predicted population benefits of 322 940 QALY gained and $4·4 billion saved, fortifying at 700 μg/100 g enriched grain product – the highest level considered in this analysis – strongly dominated all other scenarios. The benefits of higher fortification levels were predicted to far outweigh the associated risks for all populations, and in all sensitivity analyses.
The substantial racial/ethnic differences predicted in disease outcomes were caused primarily by differences in total folate intake. Although disease incidence was not projected to decrease among all populations, this effect was caused by the unrealistic discontinuous risk functions used to avoid interpolating the epidemiological data analysed in risk strata. Targeted supplement-use interventions may be necessary to further mitigate disparities and reduce disease prevalence, and future research should aim to identify racial/ethnic differences in intake of fortified and non-fortified foods.
The results of the present analysis provide evidence for recommending that fortification be increased to at least 700 μg of folic acid per 100 g of enriched grain product, corroborating prior research that predicted greater economic gains at higher fortification levels(20). The analysis demonstrates that the benefits of higher fortification would exceed the risks even in the most unfavourable subgroups. It also addresses other important considerations by using estimates of folate intake that are national, subgroup-specific, and corrected for the bias caused by the use of 1d dietary intake data.
There are several limitations to consider when interpreting these results. The use of limited data on the dose–response relationships between folate intake and disease risk may have underestimated the post-fortification health benefits. However, even when using more realistically continuous – albeit uncertain – dose–response assumptions for both NTD and MI, the conclusions of positive benefit–risk trade-offs for all subgroups – and of greater benefit at higher fortification levels – did not change, and the model predicted that more NTD and MI would be prevented and that the NTD reduction would be consistent with that observed post-policy(Reference Erickson6, Reference Mathews, Honein and Erickson8, 9, Reference Williams, Mai, Edmonds, Shaw, Kirby, Hobbs, Sever, Miller, Meaney and Levitt17).
A related source of uncertainty is that synthetic folic acid is more bioavailable to absorption by the human body than is naturally occurring folate. While this factor can be incorporated using dietary folate equivalents (DFE) – a measure that adjusts intake estimates for these absorption differences – we were unable to include DFE in our analysis due to data limitations. With fortification resulting in greater proportions of intake from synthetic folic acid, the model’s use of total folate may thus have caused the benefits of fortification to be underestimated, and the risks to be overestimated. Conversely, because this factor was not considered in estimating folate-specific risks of MI and colon cancer, the benefits for dietary sources of folate may be overstated. The model’s projected cost savings associated with fortification may have been underestimated, as lifetime caregiving costs of NTD-affected individuals were not included, reduced costs associated with the proportion of NTD ending in a terminated pregnancy were excluded, and MI costs were used that may not consider the increased costs of today’s standards of care. By the same token, we may have overestimated QALY losses due to MI because survival has been improved by today’s standards of care. Taken as a whole, it is unlikely that any such positive or negative effects would substantially impact the results of the analysis, or alter the conclusions of overall benefit.
Given the suggestion of possible insignificant or even adverse effects of increased folate intake on MI risk and on colorectal cancer progression among individuals with pre-existing disease(Reference Bazzano, Reynolds, Holder and He3, Reference Novakovic, Stempak, Sohn and Kim63–Reference Bonaa, Njolstad, Ueland, Schirmer, Tverdal, Steigen, Wang, Nordrehaug, Arnesen and Rasmussen67), the benefits to MI as well as to colon cancer could be less than predicted by our model. However, recent evidence also indicates a positive folate–stroke association(Reference Carlsson68–Reference Toole, Malinow, Chambless, Spence, Pettigrew, Howard, Sides, Wang and Stampfer70) and an overall cardiovascular benefit(Reference Wald, Wald, Morris and Law16), and our results may thus underestimate benefits. The potential risk to colorectal cancer progression may appear to be supported by recent published research indicating a possible temporary delay in the ongoing decline in colorectal cancer incidence(Reference Mason, Dickstein, Jacques, Haggarty, Selhub, Dallal and Rosenberg71), but this could be in part an artefact of increased use of colonoscopy. In addition, a recent report from the National Cancer Institute indicates that not only is incidence still decreasing at 2 % per year, but also mortality – which one would expect to increase if fortification were accelerating growth of existing tumours – is also declining at an annual rate of close to 4 %(72). This analysis is thus important for motivating further trials among people without existing disease, while simultaneously suggesting caution among policymakers who may be considering potential fortification increases.
By not formally allowing competing risks between disease outcomes while allocating benefit for each disease event averted, the model may have double-counted some of the benefits gained because multiple events may be occurring per individual. The analysis did not incorporate potential associations of folic acid intake with increased twinning(Reference Czeizel, Metneki and Dudas73–Reference Kucik and Correa76), with other cancers(Reference Kim77–Reference Larsson, Giovannucci and Wolk79), or with cognitive decline(Reference Durga, van Boxtel, Schouten, Kok, Jolles, Katan and Verhoef80). Given the lack of consistent evidence for such outcomes, it is unclear in which direction their inclusion may impact results, yet the strength of the findings from our analysis suggests that the conclusion of overall benefit associated with increased folate intake would not be changed.
While these benefit–risk estimates assume a steady state, in reality fortification’s effect on NTD and B12 maskings would be relatively immediate, while that for MI and colon cancer could take up to 5(Reference Rimm, Willett, Hu, Sampson, Colditz, Manson, Hennekens and Stampfer36) and 15 years(Reference Giovannucci, Stampfer, Colditz, Hunter, Fuchs, Rosner, Speizer and Willett37), respectively. However, not only were fortification’s benefits for NTD alone predicted to outweigh the potential B12 masking risk, this risk may in fact have been overestimated given our use of a conservative risk threshold of 1000 μg/d despite no evidence of harm below 5000 μg/d(10). It is also important to note that while there is conflicting evidence regarding whether masking has increased since fortification(Reference Mills, Von Kohorn, Conley, Zeller, Cox, Williamson and Dufour81–Reference Ray, Vermeulen, Langman, Boss and Cole83), current medical knowledge regarding appropriate screening measures for B12 deficiency suggests that the fear of delayed diagnosis by physicians may not in fact be realised. The risk, however, may be that symptom improvement due to masking could reduce patients’ likelihood of seeking medical advice until after neurological complications have occurred(Reference Brouwer and Verhoef84). Nevertheless, with the low prevalence of potential masking – estimated at 0·09 % in older women before fortification and 0·61 % after(Reference Ray, Vermeulen, Langman, Boss and Cole83) – even with conservative estimates our model predicted that this risk would be outweighed by the benefits.
Given the uncertainty involved, future research should clarify the dose–response relationships and benefit–risk associations between folate intake and disease risk. This is especially important for outcomes such as MI, colon cancer, stroke, cognitive decline and B12 masking, for which causality has not yet been established; there has been conflicting evidence on potential risks, in particular among individuals with pre-existing disease; or there remains debate over the validity of the evidence(Reference Bazzano, Reynolds, Holder and He3, Reference Wald, Wald, Morris and Law16, Reference Bonaa, Njolstad, Ueland, Schirmer, Tverdal, Steigen, Wang, Nordrehaug, Arnesen and Rasmussen67–Reference Toole, Malinow, Chambless, Spence, Pettigrew, Howard, Sides, Wang and Stampfer70, Reference Mills, Von Kohorn, Conley, Zeller, Cox, Williamson and Dufour81–Reference Powers88). In addition, future policy decisions may consider B12 co-fortification or a more stringent screen for B12 deficiency to offset the potentially elevated B12 masking risks due to higher fortification, and may evaluate a broader range of fortification levels to better determine the optimal fortification strategy.
In summary, folic acid fortification was implemented in the USA in 1998 to reduce the chance of NTD in newborns. While there are potential risks of increased folate intake to populations with vitamin B12 deficiency, there may also be benefits in preventing MI and colon cancer. Overall, in considering the benefit–risk trade-offs of folic acid fortification, the present study suggests that the health and economic gains may outweigh the losses for the US population as a whole, and that additional studies on the potential benefits and hazards associated with folate intake – as well as an in-depth evaluation of the level of fortification – deserve further consideration in order to maximise net gains among all racial/ethnic, age and gender-specific subgroups.
Acknowledgements
Conflict of interest:There are no conflicts of interest.
Funding source:This study was supported by the Dana-Farber/Harvard Cancer Center Program in Cancer Outcomes Research Training, National Cancer Institute training grant # R25 CA92203, and by CISNET, National Cancer Institute grant # UOI CA88204. The work of all authors is independent of these funders.
Authorship responsibilities:All authors were involved in the study design and concept. K.M.K. and T.G.K.B. obtained funding. T.G.K.B. acquired all data, drafted the manuscript, and conducted all analyses. K.M.K. supervised study implementation. All authors were involved in interpretation of data and analyses, offered critical revisions to the manuscript, and approved the final version. T.G.K.B. is the guarantor. Ethical approval was not required for this analysis.
Appendix: Population total folate consumption by age, gender, race/ethnicity and folic acid fortification level

*Folate intake categories defined by total average folate intake in μg/d.
†Strategies labelled by amount of fortification in μg of folic acid added per 100 g of enriched grain product.


