


Introduction
Anorexia nervosa (AN) involves severe caloric restriction, intense fear of weight gain, and body-image disturbance, with medical sequelae, including malnutrition, cardiac complications, and osteoporosis. Lifetime prevalence is up to 1.4% in females and 0.2% in males [Reference Zipfel, Giel, Bulik, Hay and Schmidt1–4]. Bulimia nervosa (BN) affects up to 1.9% of females and 0.6% of males and is marked by recurrent loss-of-control overeating with compensatory behaviors (e.g., vomiting, laxatives) [Reference Castillo and KeskiWeiselberg5]. Binge eating disorder (BED) has a lifetime prevalence of 2.8% in females and 1.0% in males [Reference Erskine and Whiteford6, Reference Keski-Rahkonen7], featuring binge episodes without compensatory behaviors, associations with obesity, and reduced quality of life [Reference Hilbert8–Reference Giel, Bulik, Fernandez-Aranda, Hay, Keski-Rahkonen and Schag10]. Diagnostic revisions in DSM-5 and ICD-11 improved case capture and specificity, reclassifying many mixed eating disorders (ED) presentations and affecting prevalence estimates and treatment planning [11–13].
Standard care combines psychotherapy and nutrition. For adolescent AN, family-based therapy (FBT) is first-line. In adults, specialized cognitive–behavioral therapy for ED (CBT-ED), extended CBT (CBT-E), the Maudsley Anorexia Nervosa Treatment for Adults (MANTRA), and the Specialist Supportive Care Management (SSCM) have supportive evidence [Reference Crone, Fochtmann, Attia, Boland, Escobar and Fornari14, Reference Austin, Anderson, Lee, Vander Steen, Savard and Bergmann15]. For BN, CBT-E and CBT-ED are first-line with interpersonal therapy (IPT) as an alternative [Reference Matheson16]. For BED, CBT-E, guided self-help CBT, and IPT are best supported [Reference Grilo and Juarascio17]. Current authoritative guidelines converge on a conservative, adjunctive role for medication in the treatment of EDs. The National Institute for Clinical Excellence (NICE) recommends against using medication as the only treatment [18]. The American Psychiatric Association (APA) prioritizes nutrition and psychotherapy across diagnoses, suggesting the use of medication for comorbidities and medical risks [Reference Crone, Fochtmann, Attia, Boland, Escobar and Fornari14], but the World Federation of Societies for Biological Psychiatry (WFSBP) 2023 update further recommends olanzapine for AN [Reference Himmerich, Lewis, Conti, Mutwalli, Karwautz and Sjögren19]. The APA recommends fluoxetine for BN and lisdexamphetamine for adult BED alongside psychotherapies [4]. It could safely be concluded, therefore, that rather than being recommended as primary treatments, medications are considered adjunct to psychological and nutritional care in EDs.
In AN, habits can sustain restriction after acute starvation. While hyperactive top-down control (dorsal anterior cingulate cortex [dACC], prefrontal cortex [PFC], frontostriatal loops) and altered default mode network (DMN), central executive network (CEN), and emotion regulation network (ERN) connectivity support excessive self-focus, rigidity, and body-image distortion, decreased bottom-up reward and interoceptive signaling (nucleus accumbens [NAcc], ventral tegmental area [VTA], anterior insula) reduces hunger-driven motivation [Reference Bronleigh, Baumann and Stapleton20–Reference Steward, Menchon, Jiménez-Murcia, Soriano-Mas and Fernandez-Aranda23]. In BN, subcortical reward valuation is heightened while dorsolateral prefrontal cortex (DLPFC) and ACC control are blunted. Anterior insula responses to gastric distension and taste are reduced, likely affecting motivation to disrupt binge–purge cycles. Indeed, dorsal versus ventral anterior insula may dissociate cognitive versus affective control [Reference Berner and Marsh24–Reference Li, Wang, Wang, Wang, Liu and Chen27]. BN and BED show abnormalities in the medial PFC within the DMN and the dorsal ACC within the salience network, but there are also connectivity differences between them [Reference Stopyra, Simon, Skunde, Walther, Bendszus and Herzog28]. The mesolimbic dopamine circuitry (amygdala, orbitofrontal cortex [OFC], NAcc), crucial in BED, shows decreased ventral–striatal activity compared to healthy controls and people with obesity. The OFC overvalues food rewards, and connectivity changes reflect increased reward sensitivity, reduced control, and altered affect and stress responding [Reference Balodis, Kober, Worhunsky, White, Stevens and Pearlson29–Reference Hartogsveld, Quaedflieg, van Ruitenbeek and Smeets32].
In AN, there is evidence supporting a neurobiological progression, such that different interventions, matched to the stage of the illness, may optimize patient benefit [Reference Treasure, Stein and Maguire33]. Thus, incorporating neuromodulation techniques into specialized ED treatments, guided by connectivity dysregulation findings, may offer promise for alleviating symptoms, facilitating recovery, aligning with clinical language, and ultimately instilling hope for recovery [Reference Bauschka and O’Melia34].
Neuromodulation modalities include electroconvulsive therapy (ECT), repetitive transcranial magnetic stimulation (rTMS), deep TMS, iTBS, transcranial direct current stimulation (tDCS), and deep brain stimulation (DBS) (Table 1). All can influence synaptic plasticity and network connectivity. Selection should consider efficacy, safety, target circuits, and implementation specifics.
Neuromodulation techniques used in EDs

This systematic review aims to evaluate the effects of neuromodulation in AN, BN, and BED compared with healthy controls, sham, or active comparators, summarizing clinical outcomes, mechanistic signals, safety, and study quality.
Methods
The research question was formulated using the PICO (Participants, Interventions, Comparisons, and Outcomes) framework. The review adhered to the Preferred Reporting Items for Systematic Reviews and Meta-Analyses (PRISMA) guidelines [Reference Page, McKenzie, Bossuyt, Boutron, Hoffmann and Mulrow45]. The research protocol was registered with the International Prospective Register of Systematic Reviews (PROSPERO, registration identifier CRD42024559700) and can be accessed at https://www.crd.york.ac.uk/PROSPERO/view/CRD42024559700.
A comprehensive literature search was conducted, covering publications from inception up to August 31, 2025, in the PubMed/MedLine, EMBASE, PsychINFO, Cochrane, and clinicaltrials.gov databases. We searched for the following terms: (“bulimia nervosa” OR “bulimic” OR “bulimia” OR “eating disorder*” OR “anorexia nervosa” OR “anorexia” OR “anorexic” OR “binge eating disorder” OR “binge eating”) AND (“deep brain stimulation” OR “transcranial direct current stimulation” OR “neuromodulation” OR “transcranial magnetic stimulation” OR “repetitive transcranial magnetic stimulation” OR “electroconvulsive therapy” OR “neurostimulation” OR “brain stimulation”). Inclusion criteria for the systematic review were: (1) English language, (2) human subjects, (3) participants with AN, BN, or BED, (4) participants who had undergone DBS, tDCS, TMS, or ECT, and (5) studies reporting neuromodulation effects on patients’ eating behaviors. Exclusion criteria were: (1) review articles, (2) meta-analyses, (3) case reports of single cases, (4) editorials, (5) commentaries, (6) study protocols, (7) conference abstracts, and (8) book chapters.
After duplicate removal, titles and abstracts of all retrieved studies were screened to identify papers meeting inclusion criteria. The full study manuscript was reviewed if its relevance was in doubt based on the title and abstract. A PRISMA flow diagram shows the overall study selection process [Reference Page, McKenzie, Bossuyt, Boutron, Hoffmann and Mulrow45]. Study screening and selection were performed by three reviewers (EK, MT). Any discrepancies were resolved through discussion between them and a further two review team members (EMT, KNF) until a consensus was reached. In addition, the review team reran the searches (AK, EK, EMT) before the final analysis to ensure that the included studies were up to date.
Data extraction from eligible studies included details about authors, country of origin, study design, diagnostic criteria, total sample size, and subgroup sample sizes, sex, mean age, body mass index (BMI), and illness duration of participants, type of intervention, and number of sessions, target brain region(s), primary and secondary outcome measures, and final study outcomes. Two researchers (EK, AP) independently conducted quality assessments using the Cochrane Risk of Bias 2 (RoB2) tool for the randomized controlled trials (RCTs) and the second version of the Risk of Bias in Non-Randomized Studies of Interventions (ROBINS-I V2) tool to evaluate various bias parameters and potential threats to the validity of the included studies [Reference Sterne, Hernán, Reeves, Savović, Berkman and Viswanathan46, Reference Sterne, Savović, Page, Elbers, Blencowe and Boutron47]. A comorbidity table and a safety and tolerability table, including dropout, adverse event, and lost-to-follow-up participant numbers, were also compiled for each diagnosis in question.
Following removal of overlapping cohorts, baseline descriptive data (n, mean, standard deviation [SD]) were extracted for each unique sample for age, illness duration, and BMI. For studies reporting weight and height, BMI was calculated as kg/m2 using the delta method to estimate its SD from the reported SDs of weight and height before inclusion in the pooled calculations. Units were harmonized, medians and interquartile ranges (IQRs) or ranges were approximated to means [Reference Luo, Wan, Liu and Tong48] and SDs [Reference Wan, Wang, Liu and Tong49]. Pooled means (computed as n-weighted averages) and pooled SDs (derived from the total pooled variance) were tabulated separately for each diagnosis.
We opted for a narrative analysis to describe the various interventions and measured outcomes. This approach was considered more appropriate due to the heterogeneity of the included reports in study design, populations, and outcomes, given the inconsistency detected in reporting data.
Results
The search yielded 3403 records. After removing 851 duplicates, we screened 2552 abstracts, 169 full texts were assessed, 111 excluded, leaving 58 studies to include in this review (Figure 1).
PRISMA flow chart for inclusion of studies.

Sex distribution was driven by diagnosis, not modality. AN cohorts totaled 312 participants with unique data on sex, of which 5 (1.6%) were male (Tables 2, 3). In BN trials, there were 156 unique BN participants, of which 7 (4.5%) were male, (Tables 4, 5). Across independent BED studies, the overall combined sample consisted of 312 participants, of whom 39 (12.5%) were male (Tables 6, 7). Thus, AN came first for female predominance, followed by BN, and BED came last, aligning with epidemiology [Reference Udo and Grilo107, Reference Capuano, Ruocco, Scazzocchio, Zanchi, Lombardo and Silenzi108].
Neuromodulation controlled clinical trials in AN
Abbreviations: ADs, antidepressants; AEs, adverse events; a-tDCS, anodal transcranial direct current stimulation; AN, anorexia nervosa; AN-BP, anorexia nervosa binge eating/purge subtype; AN-R, anorexia nervosa restricting type; BA40, Brodmann area 40; BDI-II, Beck Depression Inventory-II; BMI, body mass index; BN, bulimia nervosa; BSQ-34, The Body Shape Questionnaire; BULIT, bulimia test; CBF, cerebral blood flow; CIA, clinical impairment assessment; CGI-I, Clinical Global Impressions-Improvement; DASS-21, Depression, Anxiety and Stress Scale, 21-item; DEXA, dual energy X-ray absorptiometry; DLPFC, dorsolateral prefrontal cortex; DSM 5, Diagnostic and Statistical Manual of Mental Disorders, 5th edition; EAT-40 & EAT-26, eating attitude tests; EDA-5, eating disorder assessment for DSM-5; ED, eating disorder; EDDS, Eating Disorder Diagnostic Scale; EDE-Q, Eating Disorder Examination Questionnaire; EDI-3, Eating Disorder Inventory-3; EDNOS, eating disorders not otherwise specified; f-MRI, functional magnetic resonance imaging; FBT, family-based therapy; FU, follow up; HARS, Hamilton Anxiety Rating Scale; HDRS, Hamilton Depression Rating Scale; HF, high frequency; IATs, implicit association tests; IQR, interquartile range; mPFC, medial prefrontal cortex; PSS-10, The Perceived Stress Scale; RAND, randomized; RCT, randomized controlled trial; rEBA, right extrastriate body area; rTMS, repetitive transcranial magnetic stimulation; SCL-90-R, Symptom Checklist Questionnaire-90-Revised; SE-AN, severe enduring anorexia nervosa; SES, The Rosenberg Self-Esteem Scale; STAI, State–Trait Anxiety Inventory; TAU, treatment as usual; TD, temporal discounting; tDCS, transcranial direct current stimulation; VAS, visual analog scales; WHO-QOL, World Health Organization Quality of Life; ZUNG, Zung Self-Rating Depression Scale.
Neuromodulation studies in AN – open trials and case series
Abbreviations: AC gyrus, anterior cingulate gyrus; AEs, adverse events; ALIC, anterior limb of the interna capsula; AN, anorexia nervosa; AN-BP, anorexia nervosa binge eating/purge subtype; AN-R/RES, anorexia nervosa restricting type; BAI, Beck Anxiety Inventory; BDI-II, Beck Depression Inventory-II; BIS-11, Barratt Impulsiveness Scale 11; BMI (RV), body mass index (reference value); BN, bulimia nervosa; BP, blood pressure; BSQ-34, Body Shape Questionnaire; C-SSRS, The Columbia-Suicide Severity Rating Scale; CIA, clinical impairment assessment; CGI-S, Clinical Global Impression Severity; DASS-21, Depression, Anxiety, and Stress Scales, 21-item; DBS, deep brain stimulation; DERS, Dysfunction in Emotional Regulation Scale; DLPFC, dorsolateral prefrontal cortex; dmPFC, dorsomedial prefrontal cortex; DSM-IV-TR/5, Diagnostic and Statistical Manual of Mental Disorders, 4th edition/5th edition; (d)TMS, (deep) transcranial magnetic stimulation; EAT, eating attitudes test; ECT, electroconvulsive therapy; ED, eating disorder; ED-QOL, eating disorder–quality of life; EDE, eating disorder examination; EDE-Q, Eating Disorder Examination Questionnaire; EDI, Eating Disorder Inventory; EDS-R, Exercise Dependent Scale Revised; EEG, electroencephalography; f-MRI, functional magnetic resonance imaging; FU, follow up; GAF, global assessment of functioning; HAM-A/HARS, Hamilton Anxiety Scale; HAM-D/HDRS – 17, Hamilton depression rating scale – 17 items; H-coil, Hesed coil; MAIA, multidimensional assessment of interoceptive awareness; MDD, major depressive disorder; MEG, magnetoencephalography; MINI, Mini International Neuropsychiatric Interview for Mental Disorders; MMSE, Mini-Mental State Examination; MOCA, Montreal Cognitive Assessment; MOCI, The Maudsley Obsessive–Compulsive Inventory; NAcc, nucleus accumbens; OCD, obsessive–compulsive disorder; PET, positron emission tomography; QOL, quality of life; RCT, randomized controlled trial; RMT, resting motor threshold; rTMS, repetitive transcranial magnetic stimulation; SC gyrus, subcallosal gyrus; SCC, subcallosal cingulate; SCID-5, Structured Clinical Interview for DSM-5; SCID-I/P, Structured Clinical Interview for DSM-IV Axis I disorders (patient edition); SDSS, Social Disability Screening Schedule; SF36, Short Form Health Survey; SHAPS, Snaith–Hamilton Pleasure Scale; tDCS, transcranial direct current stimulation; TMS, transcranial magnetic stimulation; tx, treatment; VAS, visual analog scales; WAIS, Wechsler Adult Intelligence Scale; WMS, Wechsler Memory Scale; WHO-QOL-Psych, World Health Organization Quality of Life Psychological Subscale; WSAS, Work and Social Adjustment Scale; YBC-EDS, Yale–Brown–Cornell Eating Disorder Scale (P) = preoccupations, (R) = rituals; YBOCS, Yale–Brown Obsessive–Compulsive Scale; YMRS, Young Mania Rating Scale.
Neuromodulation studies in BN – controlled trials
Αbbreviations: a-tDCS, anodal transcranial direct current stimulation; AL/CR, anterior left/caudal right; AN, anorexia nervosa; AR/CL, anterior right/caudal left; BDI, Beck Depression Index; BIS-11, Barratt Impulsiveness Scale-11; BMI, body mass index; BN, bulimia nervosa; DLPFC, dorsolateral prefrontal cortex; DSM-IV/DSM-V, Diagnostic and Statistical Manual of Mental Disorders, 4th/5th edition; EDI-3, Eating Disorder Inventory-3; EDNOS, eating disorders not otherwise specified; EDs, eating disorders; FCQ-S, Food Craving Questionnaire–State; FCT, Food Challenge Task; HADS, Hospital Anxiety and Depression Scale; HDRS, Hamilton Depression Rating Scale; HPA, Hypothalamic–Pituitary–Adrenal axis; IATs, Implicit Association Tests; IGT, Iowa Gambling Task; MADRS, Montgomery–Åsberg Depression Rating Scale; MEDCQ-R, Mizes Eating Disorder Cognition Questionnaire–Revised; mPFC, medial prefrontal cortex; NB, nucleus basalis; PANAS, Positive and Negative Affect Schedule; POMS, Profile of Mood States; RCT: randomized control trial; rEBA, right extrastriate body area; rTMS, repetitive transcranial magnetic stimulation; SCL-90-R, Symptom Checklist-90–Revised; SSRI, selective serotonin reuptake inhibitor; TD task, temporal discounting task; tDCS, transcranial direct current stimulation; VAS, visual analog scale; YBOCS, Yale–Brown Obsessive–Compulsive Scale.
Neuromodulation studies in BN – open label studies
Abbreviations: AN-BP, anorexia nervosa binge/purse type; BAI, Beck Anxiety Inventory; BDI-II, Beck Depression Index–II; BIT, bulimic investigatory test; BMI, body mass index; BN, bulimia nervosa; CGI-S, Clinical Global Impression–Severity; dACC, dorsal anterior cingulate cortex; DLPFC, dorsolateral prefrontal cortex; dmPFC, dorsomedial prefrontal cortex; DSM-IV-TR/DSM-5, Diagnostic and Statistical Manual of Mental Disorders, 4th ed. Text Revision/5th ed.; ED, eating disorder; EDE-Q, Eating Disorder Examination–Questionnaire; EDE, eating disorder examination; EDI-2, Eating Disorder Inventory–2; FC, functional connectivity; fMRI, functional magnetic resonance imaging; FCQ-S, Food Craving Questionnaire–State; GAF, Global Assessment of Functioning; HADS, Hospital Anxiety and Depression Scale; HAMD-17, Hamilton Depression Rating Scale (17 items); IFG, Inferior Frontal Gyrus; OFC, orbitofrontal cortex; rTMS, repetitive transcranial magnetic stimulation; VS, ventral striatum.
Neuromodulation studies in BED – controlled trials
Abbreviations: a-tDCS, anodal transcranial direct current stimulation; ABMT, attention bias modification training; AL/CR, anterior left/caudal right; AR/CL, anterior right/caudal left; BDNF, brain-derived neurotrophic factor; BED, binge eating disorder; BES, Binge Eating Scale; BE, binge eating; BEE, binge eating episodes; BDI-II, Beck Depression Inventory-II; BIS-15, Barrat Impulsiveness Scale-15; BP-CSI, Brazilian Portuguese-Central Sensitization Inventory; BMI, body mass index; CFI, Cognitive Flexibility Inventory; CIA, Clinical Impairment Assessment; CES-D, Center for Epidemiological Studies–Depression Scale; DEBQ-R, Dutch Eating Behavior Questionnaire–Restraint Subscale; DERS, Difficulties in Emotion Regulation Scale; DASS-21, Depression, Anxiety and Stress Scale, 21-item; DLPFC, dorsolateral prefrontal cortex; DSM-5, Diagnostic and Statistical Manual of Mental Disorders, 5th edition; EEG, electroencephalography; EDE, Eating Disorder Examination; EDE-Q, Eating Disorder Examination Questionnaire; ERPs, event-related potentials; ERN, error-related negativity; FCQ-T, Food Cravings Questionnaire-Trait; FU, follow up; GHQ, General Health Questionnaire; MINI, Mini International Neuropsychiatric Interview; NR, not reported; NCT, Nutritional Counseling Therapy; OBEs, objective binge eating episodes; PEMS, Palatable Eating Motives Scale; PSQI, Pittsburgh Sleep Quality Index; QoL, quality of life; RCT, randomized control trial; rTMS, repetitive transcranial magnetic stimulation; SCID-5-CV, Structured Clinical Interview for DSM-5-Clinical Version; SCID-I, Structured Clinical Interview for DSM-IV Axis I Disorders; SICI, short-interval intracortical inhibition; STAI, State–Trait Anxiety Inventory; s-tDCS, sham transcranial direct current stimulation; tDCS, transcranial direct current stimulation; TMS, transcranial magnetic stimulation; TFEQ, Three-Factor Eating Questionnaire; UPPS, UPPS Impulsive Behavior Scale; VAS, visual analog scale; VR, virtual reality; WHO-5, Well-being Questionnaire.
Neuromodulation studies in BED – case series
Abbreviations: BD-II, bipolar disorder type II; BED, binge eating disorder; BMI, body mass index; DLPFC, dorsolateral prefrontal cortex; DSM-5, Diagnostic and Statistical Manual of Mental Disorders, 5th edition; ELOCS, Eating Loss of Control Scale; FU, follow up; HAM-D, Hamilton Depression Rating Scale; iTBS, intermittent theta burst stimulation; MADRS, Montgomery–Åsberg Depression Rating Scale; NR, not reported; rDBS, responsive deep brain stimulation; YMRS, Young Mania Rating Scale.
Age at entry varied by disorder and modality (Tables 8–11). AN spanned the widest range, with noninvasive trials including young adults and adolescents (tDCS RCTs), whereas DBS and rTMS open study cohorts were older. BN samples were composed largely by young adults (Tables 4, 5, 10). BED cohorts were the oldest, with early DBS and iTBS reports including even older participants (Tables 6, 7, 11). Noninvasive methods spanned adolescence through adulthood especially in AN, while invasive approaches concentrated in older, more chronic cases.
AN-controlled trials pooled means and pooled SDs calculated by n-weighted mean across groups and pooled variance including within- and between-group data
Abbreviations: AN, anorexia nervosa; BMI, body mass index; BN, bulimia nervosa; EDNOS, eating disorders not otherwise specified; IQR, interquartile range; RCTs, randomized controlled trials; rTMS, repetitive transcranial magnetic stimulation; tDCS, transcranial direct current stimulation.
Note: Mattavelli et al. [Reference Mattavelli, Gallucci, Schiena, D’Agostino, Sassetti and Bonora58] recruited a mixed sample of participants including patients with AN, BN, and EDNOS, but does not report on each subgroup per diagnosis separately, so data cannot be used. Dalton et al. [Reference Dalton, Foerde, Bartholdy, McClelland, Kekic and Grycuk52–Reference Dalton, McClelland, Bartholdy, Kekic, Campbell and Schmidt54] cohorts overlap with the Dalton et al. [Reference Costanzo, Menghini, Maritato, Castiglioni, Mereu and Varuzza57] parent trial, so only the latter is used for calculating pooled data.
a Data were converted from median (IQR or range) to mean (SD) according to previously described methodology [Reference Luo, Wan, Liu and Tong48, Reference Wan, Wang, Liu and Tong49].
AN open trials pooled means and pooled SDs calculated by n-weighted mean across groups and pooled variance including within- and between-group data
Abbreviations: AN, anorexia nervosa; BMI, body mass index; DBS, deep brain stimulation; ECT, electroconvulsive therapy; IQR, interquartile range; RCT, randomized control trial; rTMS, repetitive transcranial magnetic stimulation; tDCS, transcranial direct current stimulation.
Note: Excluded DBS studies from this analysis, with reasons: (i) the Zhang et al. [Reference Zhang, Li, Zhao, Guan, Sun and Zuo64] reports on a DBS subgroup which is the same as in Wu et al. [Reference Wu, Van Dyck-Lippens, Santegoeds, van Kuyck, Gabriëls and Lin63]; (ii) the Lipsman et al. [Reference Lipsman, Woodside, Giacobbe, Hamani, Carter and Norwood61] is a pilot study, followed by the methodological and tractography study by Hayes et al. [Reference Hayes, Lipsman, Chen, Woodside, Davis and Lozano65], and the De Vloo et al. [Reference De Vloo, Lam, Elias, Boutet, Sutandar and Giacobbe69], the latter being a long-term extension of the Lipsman et al. [Reference Lipsman, Woodside, Giacobbe, Hamani, Carter and Norwood61] pilot; (iii) Oudijn et al. [Reference Oudijn, Linders, Lok, Schuurman, van den Munckhof and van Elburg71, Reference Oudijn, Sargent, Lok, Schuurman, van den Munckhof and van Elburg75] report on the same four patients; (iv) Perez et al. [Reference Pérez, Villalba-Martínez, Elices, Manero, Salgado and Ginés73] uses the same cohort as the Villalba-Martinez et al. [Reference Villalba Martínez, Justicia, Salgado, Ginés, Guardiola and Cedrón68] study; and Braeutigam et al. [Reference Braeutigam, Scaife, Aziz and Park72] reports on the same sample as Scaife et al. [Reference Scaife, Eraifej, Green, Petric, Aziz and Park74]. The second tDCS open study (Strumila et al. [Reference Strumila, Thiebaut, Jaussent, Seneque, Attal and Courtet80]), including 10 participants, did not report on age, illness duration, or BMI, so it was not used to calculate pooled values. Regarding excluded rTMS studies, the study by Dunlop et al. [Reference Dunlop, Woodside, Lam, Olmsted, Colton and Giacobbe83] is a mixed diagnosis study that includes an AN subgroup, but data are only presented for the total sample, and the Dalton et al. [Reference Dalton, Lewis, Bartholdy, Kekic, McClelland and Campbell86] study is the open follow-up of the Dalton et al. RCT [Reference McClelland, Kekic, Bozhilova, Nestler, Dew and Van Den Eynde50].
a Data were converted from median (IQR or range) to mean (SD) according to previously described methodology [Reference Luo, Wan, Liu and Tong48, Reference Wan, Wang, Liu and Tong49].
BN-controlled trials and case series pooled means and pooled SDs calculated by n-weighted mean across groups and pooled variance including within- and between-group data

Abbreviations: AN, anorexia nervosa; AN-BP, anorexia nervosa – binge/purge type; BN, bulimia nervosa; BMI, body mass index; EDNOS, eating disorders not otherwise specified; IQR, interquartile range; RCT, randomized controlled trial; rTMS, repetitive transcranial magnetic stimulation; tDCS, transcranial direct current stimulation.
Note: Excluded studies, with reasons: (i) Claudino et al. [Reference Claudino, Van Den Eynde, Stahl, Dew, Andiappan and Kalthoff90], Van den Eynden et al. [Reference Van den Eynde, Broadbent, Guillaume, Claudino, Campbell and Schmidt91], the right-handed participants, all seem to come from the same Van den Eynded et al. [Reference Van den Eynde, Claudino, Mogg, Horrell, Stahl and Ribeiro89] cohort; (ii) Guillaume et al. [Reference Guillaume, Gay, Jaussent, Sigaud, Billard and Attal94] is an ancillary study of the RCT reported in Gay et al. [Reference Gay, Jaussent, Sigaud, Billard, Attal and Seneque92], so participants overlap; (iii) Mattavelli et al. [Reference Mattavelli, Gallucci, Schiena, D’Agostino, Sassetti and Bonora58] includes a mixed AN, BN, and EDNOS sample, and reports data for the total rather than per subgroup; (iv) the Dunlop et al. [Reference Dunlop, Woodside, Lam, Olmsted, Colton and Giacobbe83] is a mixed sample study, including AN-BP and BN participants, but does not report separately for each diagnosis subgroup.
a Crossover trial, participants counted once.
b Data were converted from median (IQR or range) to mean (SD) according to described methodology [Reference Luo, Wan, Liu and Tong48, Reference Wan, Wang, Liu and Tong49].
BED-controlled trials and case series pooled means and pooled SDs calculated by n-weighted mean across groups and pooled variance including within- and between-group data

Abbreviations: BED, binge eating disorder; BMI, body mass index; iTBS, intermittent theta burst stimulation; RCT, randomized controlled trial; rDBS: rTMS, repetitive transcranial magnetic stimulation; rDBS, responsive deep brain stimulation; tDCS, transcranial direct current stimulation.
Note: Excluded studies, with reasons: (i) the Max et al. [Reference Max, Schag, Giel and Plewnia101] is a virtual reality study recruiting from the same RCT as Giel et al. [Reference Giel, Schag, Max, Martus, Zipfel and Fallgatter100], and Max et al. [Reference Max, Giel, Plewnia, Lossa, Zipfel and Schag104] is a secondary analysis of the RCT cohort reported in Giel et al. [Reference Giel, Schag, Max, Martus, Zipfel and Fallgatter100]; (ii) Ince et al. [Reference Ince, Max, Plewnia, Leehr, Zipfel and Giel98] explicitly states that its participants are a subgroup of the sample recruited by Max et al. [Reference Max, Plewnia, Zipfel, Giel and Schag99].
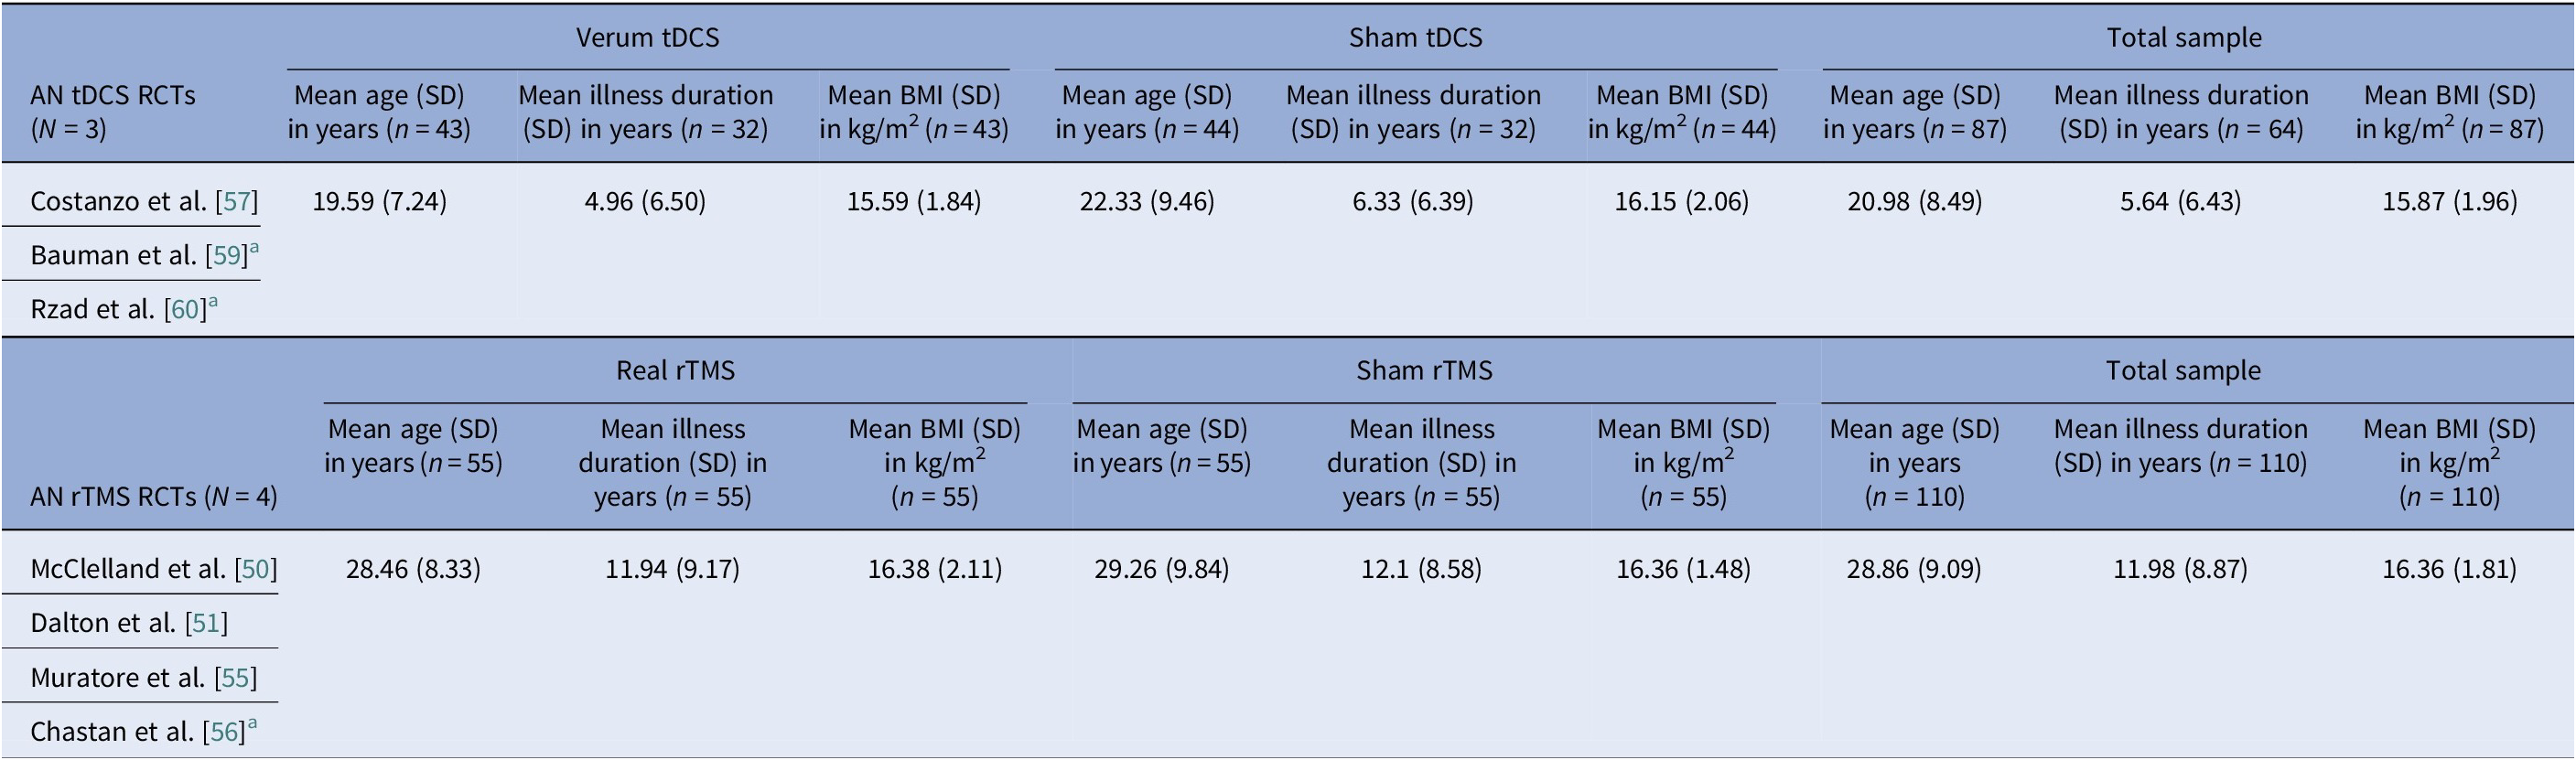
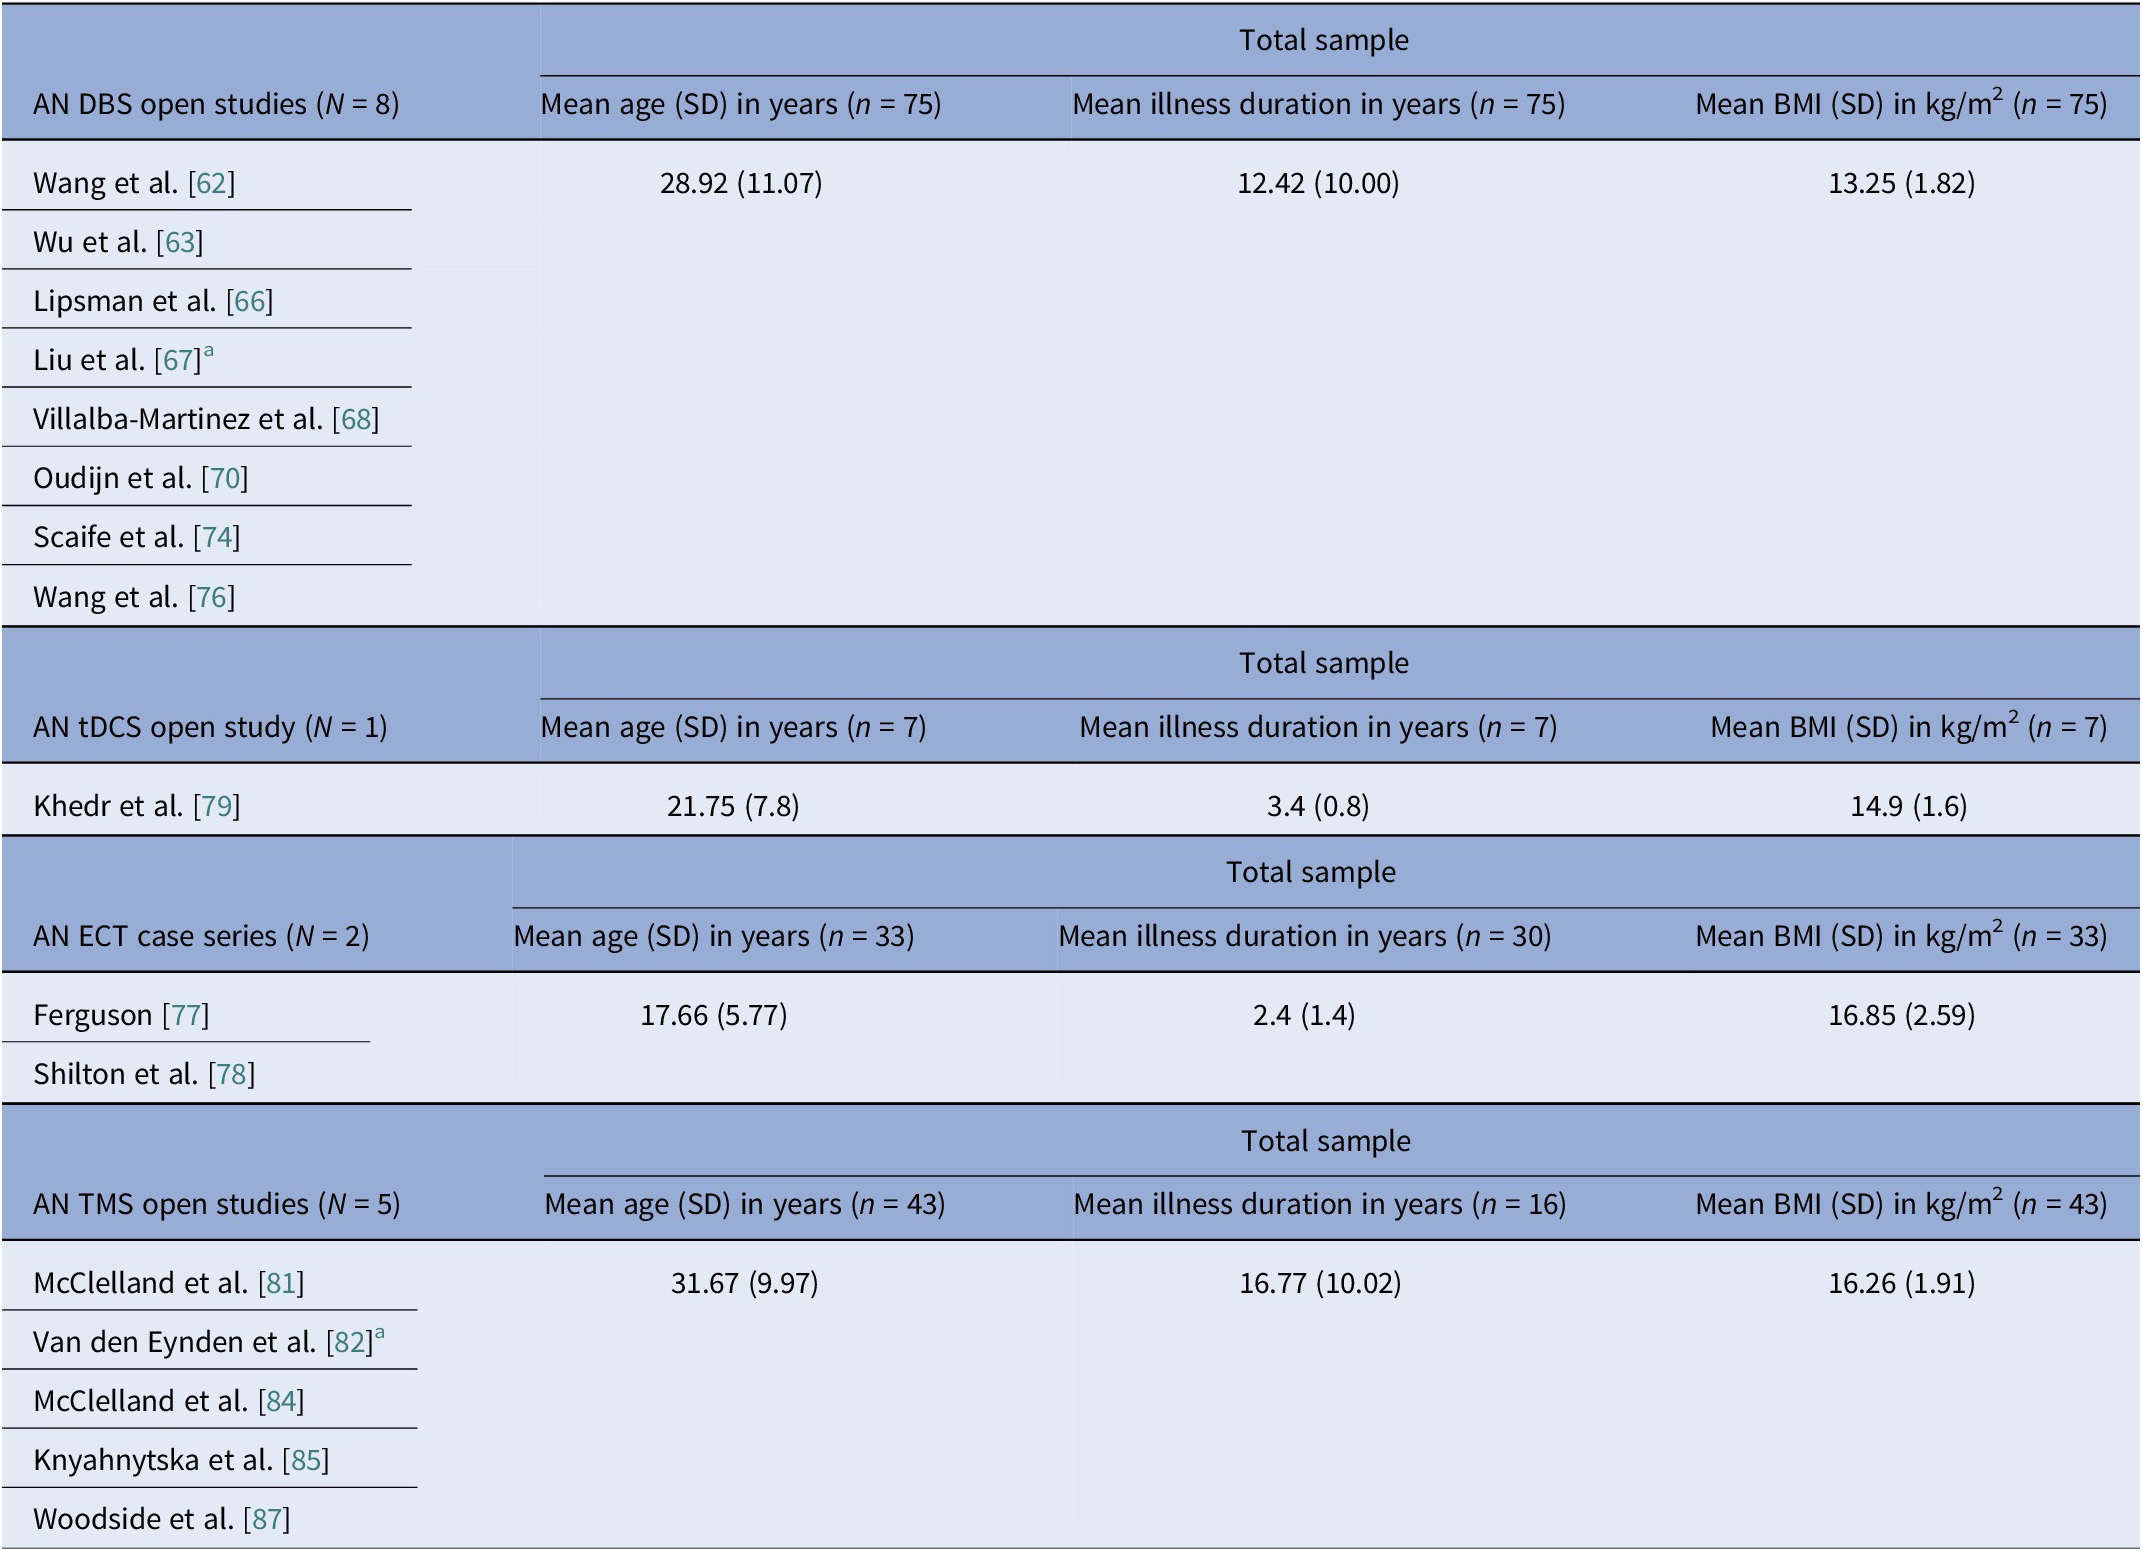
Baseline BMI clustered by diagnosis and, within AN, by modality. AN pooled rTMS RCT BMI mean (SD) was 15.9 (1.96) kg/m2, pooled tDCS RCT BMI mean (SD) was 16.4 (1.81) kg/m2, but AN DBS cohorts had a much lower calculated pooled BMI mean (SD) of 13.3 (1.82) kg/m2 (Tables 8, 9). BN trials enrolled near-normal or normal BMI across modalities (Tables 4, 5, 10). However, BED studies involved obesity, with controlled tDCS and rTMS pooled BMI means (SD) reaching 35.8 (7.96) kg/m2 and 38.9 (2.71) kg/m2, respectively, and DBS feasibility cases up to 46.5 kg/m2 (Table 11). Thus, BMI primarily reflected diagnosis, with AN-DBS the lowest.
Illness duration also tracked severity and modality. AN rTMS RCTs calculated pooled mean (SD) was 5.6 (6.43) years (Table 8). The AN DBS series recruited more chronic, refractory cases, with a pooled mean (SD) duration of illness at 12.4 (10.00) years (Table 9). BN controlled trials showed shorter durations, with the pooled mean (SD) for tDCS RCTs at 9.2 (7.97) years and for rTMS RCTs 7.9 (5.14) years (Table 10). In BED controlled trials and case series, BMI and binge frequency were emphasized, but illness duration was not reported (Tables 6, 7).
Anorexia nervosa controlled trials
We identified 11 controlled trials, four tDCS [Reference Costanzo, Menghini, Maritato, Castiglioni, Mereu and Varuzza57–Reference Rząd, Rog, Kajka, Seweryn, Patyk and Karakuła-Juchnowicz60], seven rTMS [Reference McClelland, Kekic, Bozhilova, Nestler, Dew and Van Den Eynde50–Reference Chastan, Achamrah, Etard, Nathou, Piquet and Guillaume56], and no DBS (Table 2). Transcranial DCS trials showed more consistent gains in BMI and ED psychopathology, especially in adolescents [Reference Costanzo, Menghini, Maritato, Castiglioni, Mereu and Varuzza57] and a small adult RCT [Reference Rząd, Rog, Kajka, Seweryn, Patyk and Karakuła-Juchnowicz60]. Repetitive TMS findings were mixed, showing benefits in symptoms and decision making [Reference McClelland, Kekic, Bozhilova, Nestler, Dew and Van Den Eynde50, Reference Dalton, Bartholdy, McClelland, Kekic, Rennalls and Werthmann51] versus null results [Reference Chastan, Achamrah, Etard, Nathou, Piquet and Guillaume56], with one study suggesting sustained weight gain at follow-up [Reference Dalton, McClelland, Bartholdy, Kekic, Campbell and Schmidt54]. Across tDCS RCTs, 43 received active [Reference Costanzo, Menghini, Maritato, Castiglioni, Mereu and Varuzza57, Reference Baumann, Mareš, Albrecht, Anders, Vochosková and Hill59], 31 sham, and 12 adolescents received family therapy as an active comparator. A fourth trial used a within-subject sham control group (n = 21), not adding to RCT totals [Reference Mattavelli, Gallucci, Schiena, D’Agostino, Sassetti and Bonora58]. Three rTMS papers [Reference Dalton, Foerde, Bartholdy, McClelland, Kekic and Grycuk52–Reference Dalton, McClelland, Bartholdy, Kekic, Campbell and Schmidt54] probably share a 34-participant core sample (TIARA RCT [Reference Dalton, Foerde, Bartholdy, McClelland, Kekic and Grycuk52], fMRI substudy n = 26 [Reference Dalton, Maloney, Rennalls, Bartholdy, Kekic and McClelland53], secondary analysis n = 26 [Reference Dalton, McClelland, Bartholdy, Kekic, Campbell and Schmidt54]). Excluding overlap, three unique RCTs remained [Reference McClelland, Kekic, Bozhilova, Nestler, Dew and Van Den Eynde50, Reference Dalton, Foerde, Bartholdy, McClelland, Kekic and Grycuk52, Reference Chastan, Achamrah, Etard, Nathou, Piquet and Guillaume56] in addition to a crossover trial [Reference Muratore, Bershad, Steinglass, Foerde, Gianini and Broft55], including a total of 55 participants in the active rTMS group and 55 in the sham.
Regarding stimulation dosing, tDCS had the highest cumulative exposure as it was applied during multiple sessions, usually 10–30, lasting 20–30 min [Reference Costanzo, Menghini, Maritato, Castiglioni, Mereu and Varuzza57, Reference Rząd, Rog, Kajka, Seweryn, Patyk and Karakuła-Juchnowicz60]. Repetitive TMS varied from single session to 10–20 session trials [Reference McClelland, Kekic, Bozhilova, Nestler, Dew and Van Den Eynde50, Reference Dalton, Bartholdy, McClelland, Kekic, Rennalls and Werthmann51].
Targets per modality included the DLPFC, the OFC, the mPFC, and the right extrastriate body area (rEBA) for tDCS, and the left DLPFC, the right DLPFC, and the right IPL for rTMS. DLPFC stimulation was associated with short-term BMI and ED gains in adolescents [Reference Costanzo, Menghini, Maritato, Castiglioni, Mereu and Varuzza57, Reference Rząd, Rog, Kajka, Seweryn, Patyk and Karakuła-Juchnowicz60] and with cognitive change in adults [Reference McClelland, Kekic, Bozhilova, Nestler, Dew and Van Den Eynde50, Reference Dalton, Foerde, Bartholdy, McClelland, Kekic and Grycuk52, Reference Muratore, Bershad, Steinglass, Foerde, Gianini and Broft55]. Repetitive TMS targeting the DLPFC reduced amygdala perfusion, which correlated with sustained weight gain, possibly secondary to limbic regulation [Reference Dalton, Maloney, Rennalls, Bartholdy, Kekic and McClelland53]. Targeting the mPFC and the rEBA [Reference Mattavelli, Gallucci, Schiena, D’Agostino, Sassetti and Bonora58] as well as the right inferior parietal lobule (rIPL) [Reference Chastan, Achamrah, Etard, Nathou, Piquet and Guillaume56] shifted implicit food and body attitudes with less consistent clinical impact.
Anorexia nervosa open trials and case series
We identified 16 DBS open-label studies [Reference Lipsman, Woodside, Giacobbe, Hamani, Carter and Norwood61–Reference Wang, Liu, Paerhati, Lin, Ye and Dai76], seven TMS (six rTMS [Reference McClelland, Bozhilova, Nestler, Campbell, Jacob and Johnson-Sabine81–Reference McClelland, Kekic, Campbell and Schmidt84, Reference Dalton, Lewis, Bartholdy, Kekic, McClelland and Campbell86, Reference Woodside, Dunlop, Sathi, Lam, McDonald and Downar87], one dTMS [Reference Knyahnytska, Blumberger, Daskalakis, Zomorrodi and Kaplan85]), two ECT [Reference Ferguson77, Reference Shilton, Enoch-Levy, Giron, Yaroslavsky, Amiaz and Gothelf78], and two tDCS [Reference Khedr, Elfetoh, Ali and Noamany79, Reference Strumila, Thiebaut, Jaussent, Seneque, Attal and Courtet80] studies (Table 3). DBS consistently improved BMI for chronic and refractory AN, TMS improved mood and anxiety with BMI typically unchanged, and tDCS suggested ED pathology and mood gains. We calculated 75 unique DBS participants across eight programs (Table 9): Toronto [Reference Lipsman, Woodside, Giacobbe, Hamani, Carter and Norwood61, Reference Hayes, Lipsman, Chen, Woodside, Davis and Lozano65, Reference Lipsman, Lam, Volpini, Sutandar, Twose and Giacobbe66, Reference De Vloo, Lam, Elias, Boutet, Sutandar and Giacobbe69]; China [Reference Wang, Chang, Geng, Wang and Gao62–Reference Zhang, Li, Zhao, Guan, Sun and Zuo64, Reference Liu, Zhan, Li, Lin, Zhang and Wang67]; the Netherlands [Reference Oudijn, Mocking, Wijnker, Lok, Schuurman and van den Munckhof70, Reference Oudijn, Linders, Lok, Schuurman, van den Munckhof and van Elburg71, Reference Oudijn, Sargent, Lok, Schuurman, van den Munckhof and van Elburg75]; UK [Reference Braeutigam, Scaife, Aziz and Park72, Reference Scaife, Eraifej, Green, Petric, Aziz and Park74]; Spain [Reference Villalba Martínez, Justicia, Salgado, Ginés, Guardiola and Cedrón68, Reference Pérez, Villalba-Martínez, Elices, Manero, Salgado and Ginés73]; and another China [Reference Wang, Liu, Paerhati, Lin, Ye and Dai76]. There were 33 unique participants in the ECT case series [Reference Ferguson77, Reference Shilton, Enoch-Levy, Giron, Yaroslavsky, Amiaz and Gothelf78]. Five TMS open studies seemed to be pooling from three London rTMS cohorts [Reference McClelland, Bozhilova, Nestler, Campbell, Jacob and Johnson-Sabine81, Reference Van den Eynde, Guillaume, Broadbent, Campbell and Schmidt82, Reference McClelland, Kekic, Campbell and Schmidt84], one Canadian rTMS [Reference Woodside, Dunlop, Sathi, Lam, McDonald and Downar87], and one further dTMS study from Canada [Reference Knyahnytska, Blumberger, Daskalakis, Zomorrodi and Kaplan85], totaling 43 unique TMS participants (Table 9). The study by Dunlop et al. reported on a mixed AN-binge/purge (BP) and BN population [Reference Dunlop, Woodside, Lam, Olmsted, Colton and Giacobbe83].
Considering stimulation dosing, DBS was continuous, and rTMS was typically applied in 20–30 sessions at 10 Hz, with approximately 110% of the resting motor threshold (RMT) and 1000–3000 pulses per session (single-session probe [Reference Van den Eynde, Guillaume, Broadbent, Campbell and Schmidt82]). The dTMS study included 42 sessions at 20 Hz [Reference Dunlop, Woodside, Lam, Olmsted, Colton and Giacobbe83] and the tDCS study involved 2 mA per session over 10 sessions. ECT sessions included 6–12 sessions, held 2–3 times per week.
DBS targets included the SCC, which is part of the frontolimbic circuit [Reference Abellaneda-Pérez, Delgado-Martínez, Salgado, Ginés, Guardiola and Vaqué-Alcázar109], the NAcc and ventral striatum (reward links to the OFC and the VTA) [Reference Wang, Chang, Geng, Wang and Gao62, Reference Zhang, Li, Zhao, Guan, Sun and Zuo64, Reference Liu, Zhan, Li, Lin, Zhang and Wang67], and the vALIC (cortico-striato-thalamic) areas [Reference De Vloo, Lam, Elias, Boutet, Sutandar and Giacobbe69, Reference Braeutigam, Scaife, Aziz and Park72, Reference Scaife, Eraifej, Green, Petric, Aziz and Park74, Reference Oudijn, Sargent, Lok, Schuurman, van den Munckhof and van Elburg75]. The rTMS targeted the left DLPFC [Reference Van den Eynde, Guillaume, Broadbent, Campbell and Schmidt82, Reference McClelland, Kekic, Campbell and Schmidt84, Reference Dalton, Lewis, Bartholdy, Kekic, McClelland and Campbell86, Reference Woodside, Dunlop, Sathi, Lam, McDonald and Downar87]. The Toronto group also targeted the dmPFC [Reference Dunlop, Woodside, Lam, Olmsted, Colton and Giacobbe83, Reference Woodside, Dunlop, Sathi, Lam, McDonald and Downar87] and the dTMS trial, the insula [Reference Knyahnytska, Blumberger, Daskalakis, Zomorrodi and Kaplan85]. Regarding tDCS, the anode was placed on the left DLPFC and the cathode on the right supraorbital area [Reference Khedr, Elfetoh, Ali and Noamany79, Reference Strumila, Thiebaut, Jaussent, Seneque, Attal and Courtet80]. Finally, ECT produced broad corticolimbic modulation [Reference Ferguson77, Reference Shilton, Enoch-Levy, Giron, Yaroslavsky, Amiaz and Gothelf78]. Moreover, DBS studies reported on 39 cases of AN-R and 32 AN-BP, but AN-subtype reporting varied in TMS studies [Reference Dunlop, Woodside, Lam, Olmsted, Colton and Giacobbe83, Reference Dalton, Lewis, Bartholdy, Kekic, McClelland and Campbell86], and no such stratification was reported in tDCS studies. ECT reports included balanced subtypes (Table 3).
Bulimia nervosa controlled and open trials
Eight controlled BN trials (Table 4) were identified. Six rTMS [Reference Walpoth, Hoertnagl, Mangweth-Matzek, Kemmler, Hinterhölzl and Conca88–Reference Gay, Jaussent, Sigaud, Billard, Attal and Seneque92, Reference Guillaume, Gay, Jaussent, Sigaud, Billard and Attal94] and two tDCS [Reference Mattavelli, Gallucci, Schiena, D’Agostino, Sassetti and Bonora58, Reference Kekic, McClelland, Bartholdy, Boysen, Musiat and Dalton93], as well as an additional two open-label rTMS studies [Reference Dunlop, Woodside, Lam, Olmsted, Colton and Giacobbe83, Reference Sutoh, Koga, Kimura, Kanahara, Numata and Hirano95] (Table 5). Accounting for known cohort overlaps (excluding the King’s/Institute of Psychiatry, Psychology and Neuroscience [IoPPN] single-session series with probable overlap) [Reference Van den Eynde, Claudino, Mogg, Horrell, Stahl and Ribeiro89–Reference Van den Eynde, Broadbent, Guillaume, Claudino, Campbell and Schmidt91], across controlled and case studies (Table 10).
Single-session rTMS over the left DLPFC reduced cue-induced craving and 24-h binges acutely but not durably [Reference Van den Eynde, Claudino, Mogg, Horrell, Stahl and Ribeiro89–Reference Van den Eynde, Broadbent, Guillaume, Claudino, Campbell and Schmidt91]. Multisession rTMS (15–20 sessions) showed no superiority to sham for binge/purge frequency [Reference Walpoth, Hoertnagl, Mangweth-Matzek, Kemmler, Hinterhölzl and Conca88, Reference Gay, Jaussent, Sigaud, Billard, Attal and Seneque92, Reference Guillaume, Gay, Jaussent, Sigaud, Billard and Attal94], though cognitive control and decision making improved and sometimes persisted, with eating symptoms paralleling sham. For tDCS, both active and sham dmPFC stimulation transiently reduced urge-to-binge and improved self-regulation [Reference Kekic, McClelland, Bartholdy, Boysen, Musiat and Dalton93]. Mattavelli et al. concluded that tDCS over the mPFC and the rEBA shifted implicit food and body-image attitudes without testing durable symptom change [Reference Mattavelli, Gallucci, Schiena, D’Agostino, Sassetti and Bonora58].
The open-label rTMS included 20–30 sessions in the dmPFC [Reference Dunlop, Woodside, Lam, Olmsted, Colton and Giacobbe83] and a single session in the left DLPFC [Reference Sutoh, Koga, Kimura, Kanahara, Numata and Hirano95]. Stimulation to the dmPFC reduced purging in responders and improved frontostriatal and salience connectivity. Binge outcomes, however, were heterogeneous and effects lasted for weeks [Reference Dunlop, Woodside, Lam, Olmsted, Colton and Giacobbe83]. The single-session DLPFC study showed reduced oxygenation, lower craving, improved self-regulation, and mild mood gains acutely [Reference Sutoh, Koga, Kimura, Kanahara, Numata and Hirano95]. Overall, DLPFC stimulation, whether by rTMS or tDCS, enhanced top-down control and reduced acute craving, yet weekly eating outcomes seldom beat sham. Targeting the dmPFC was also shown to reduce purging in a subset of responders [Reference Dunlop, Woodside, Lam, Olmsted, Colton and Giacobbe83].
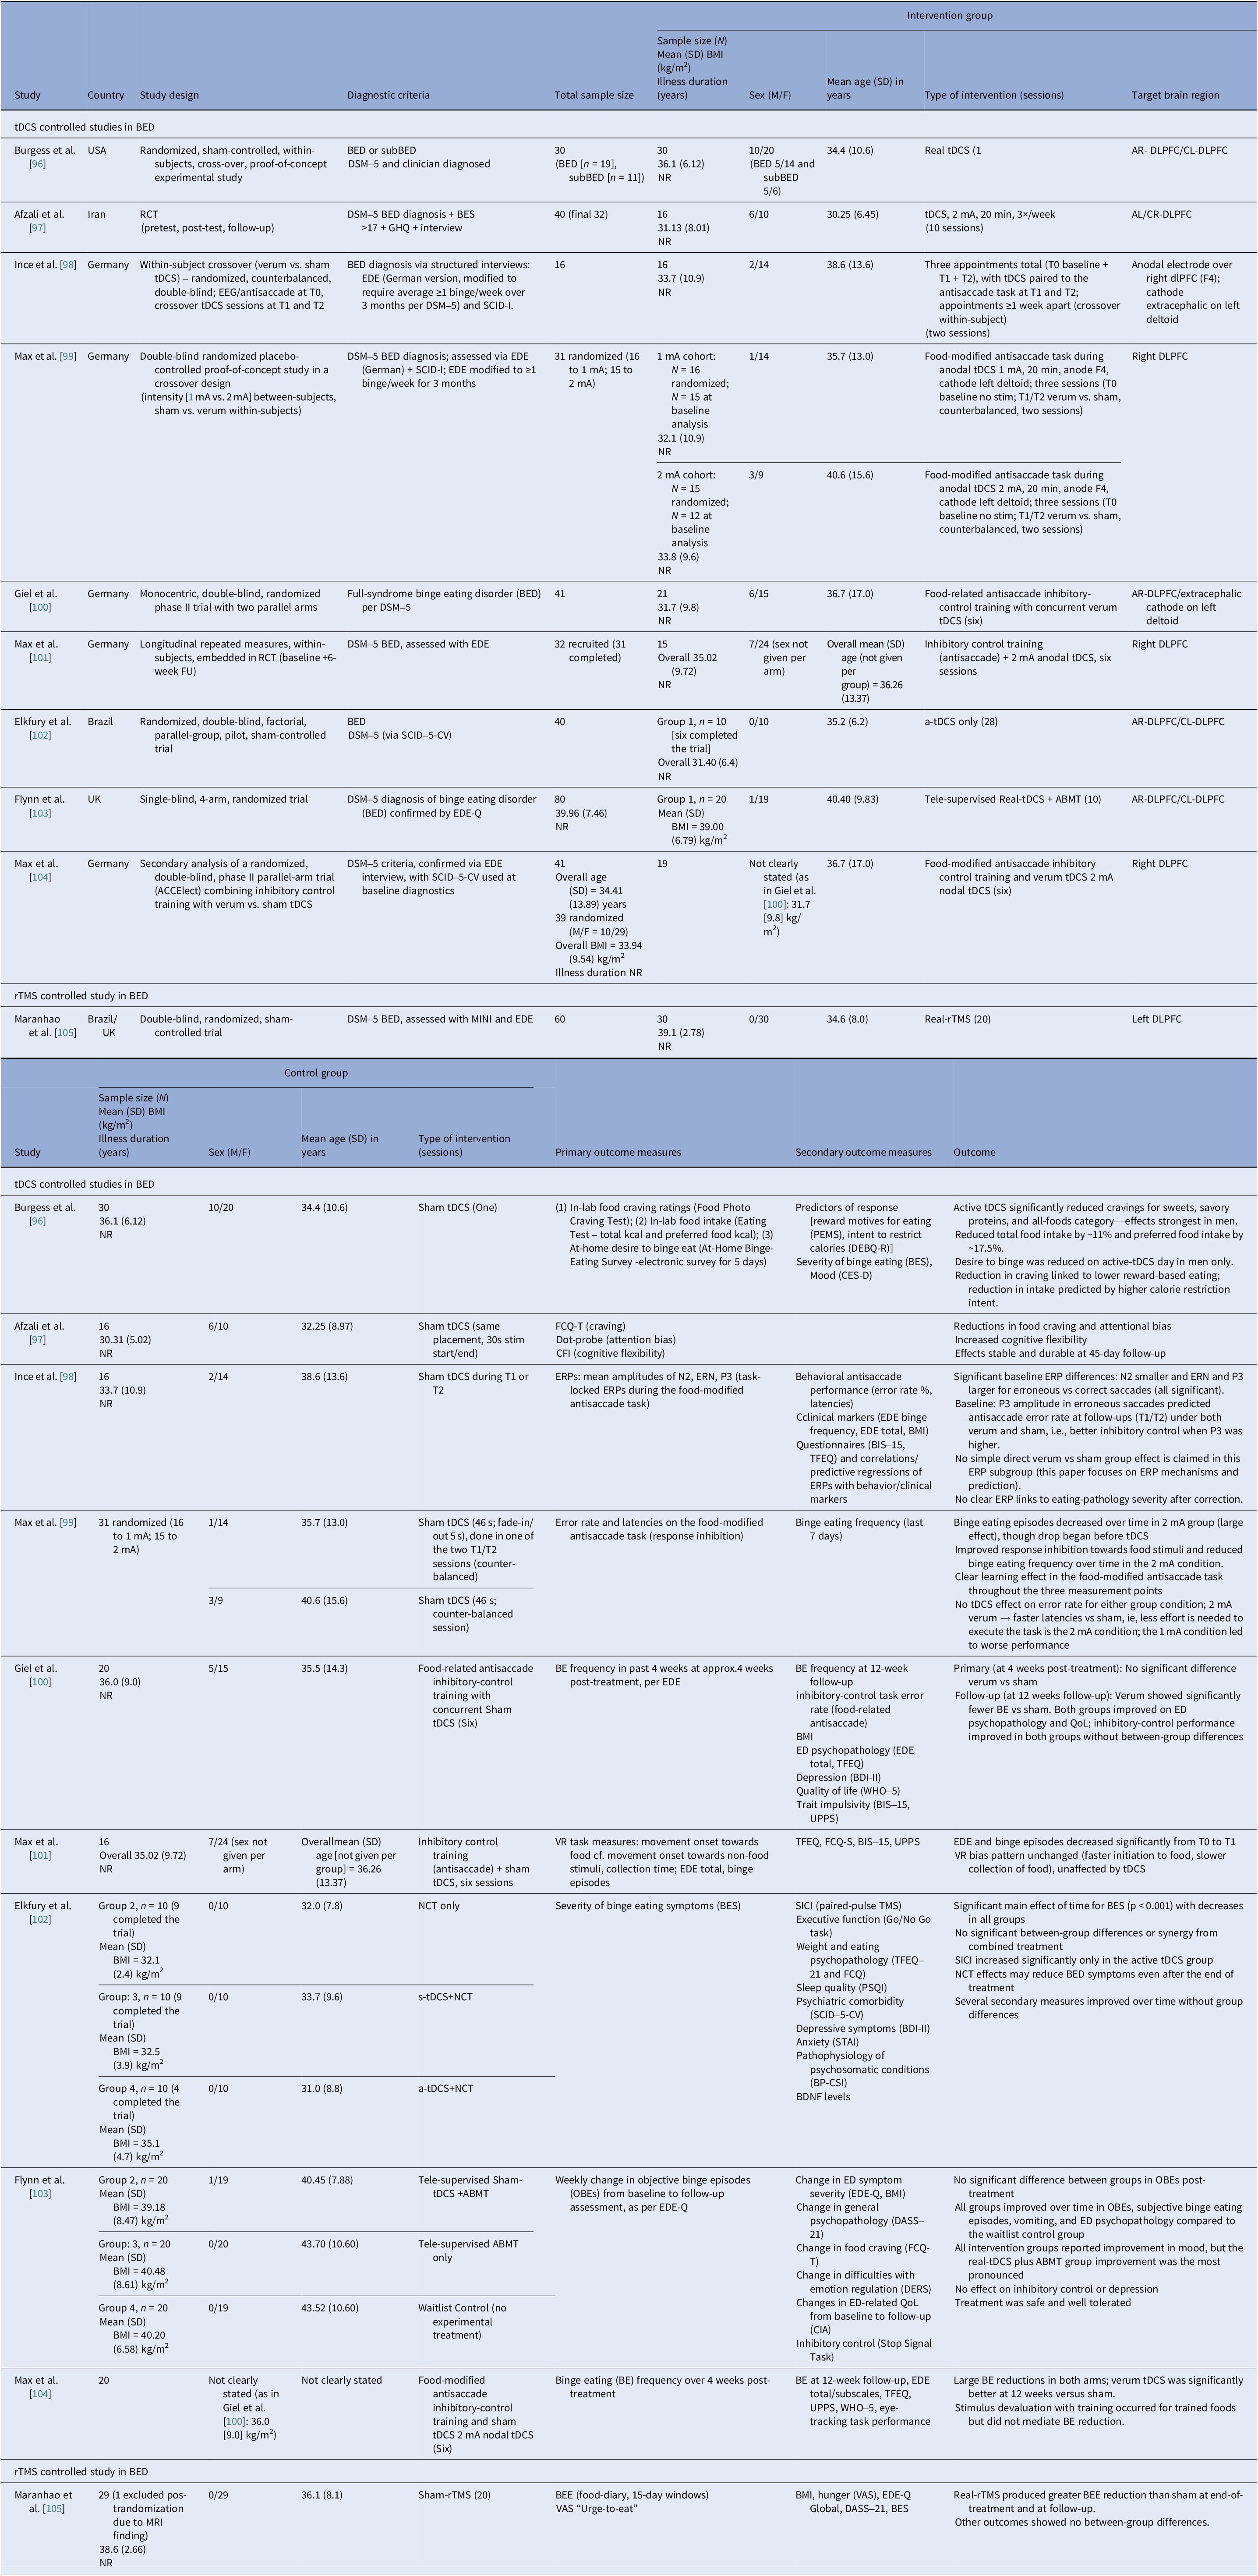
Binge eating disorder controlled and open trials
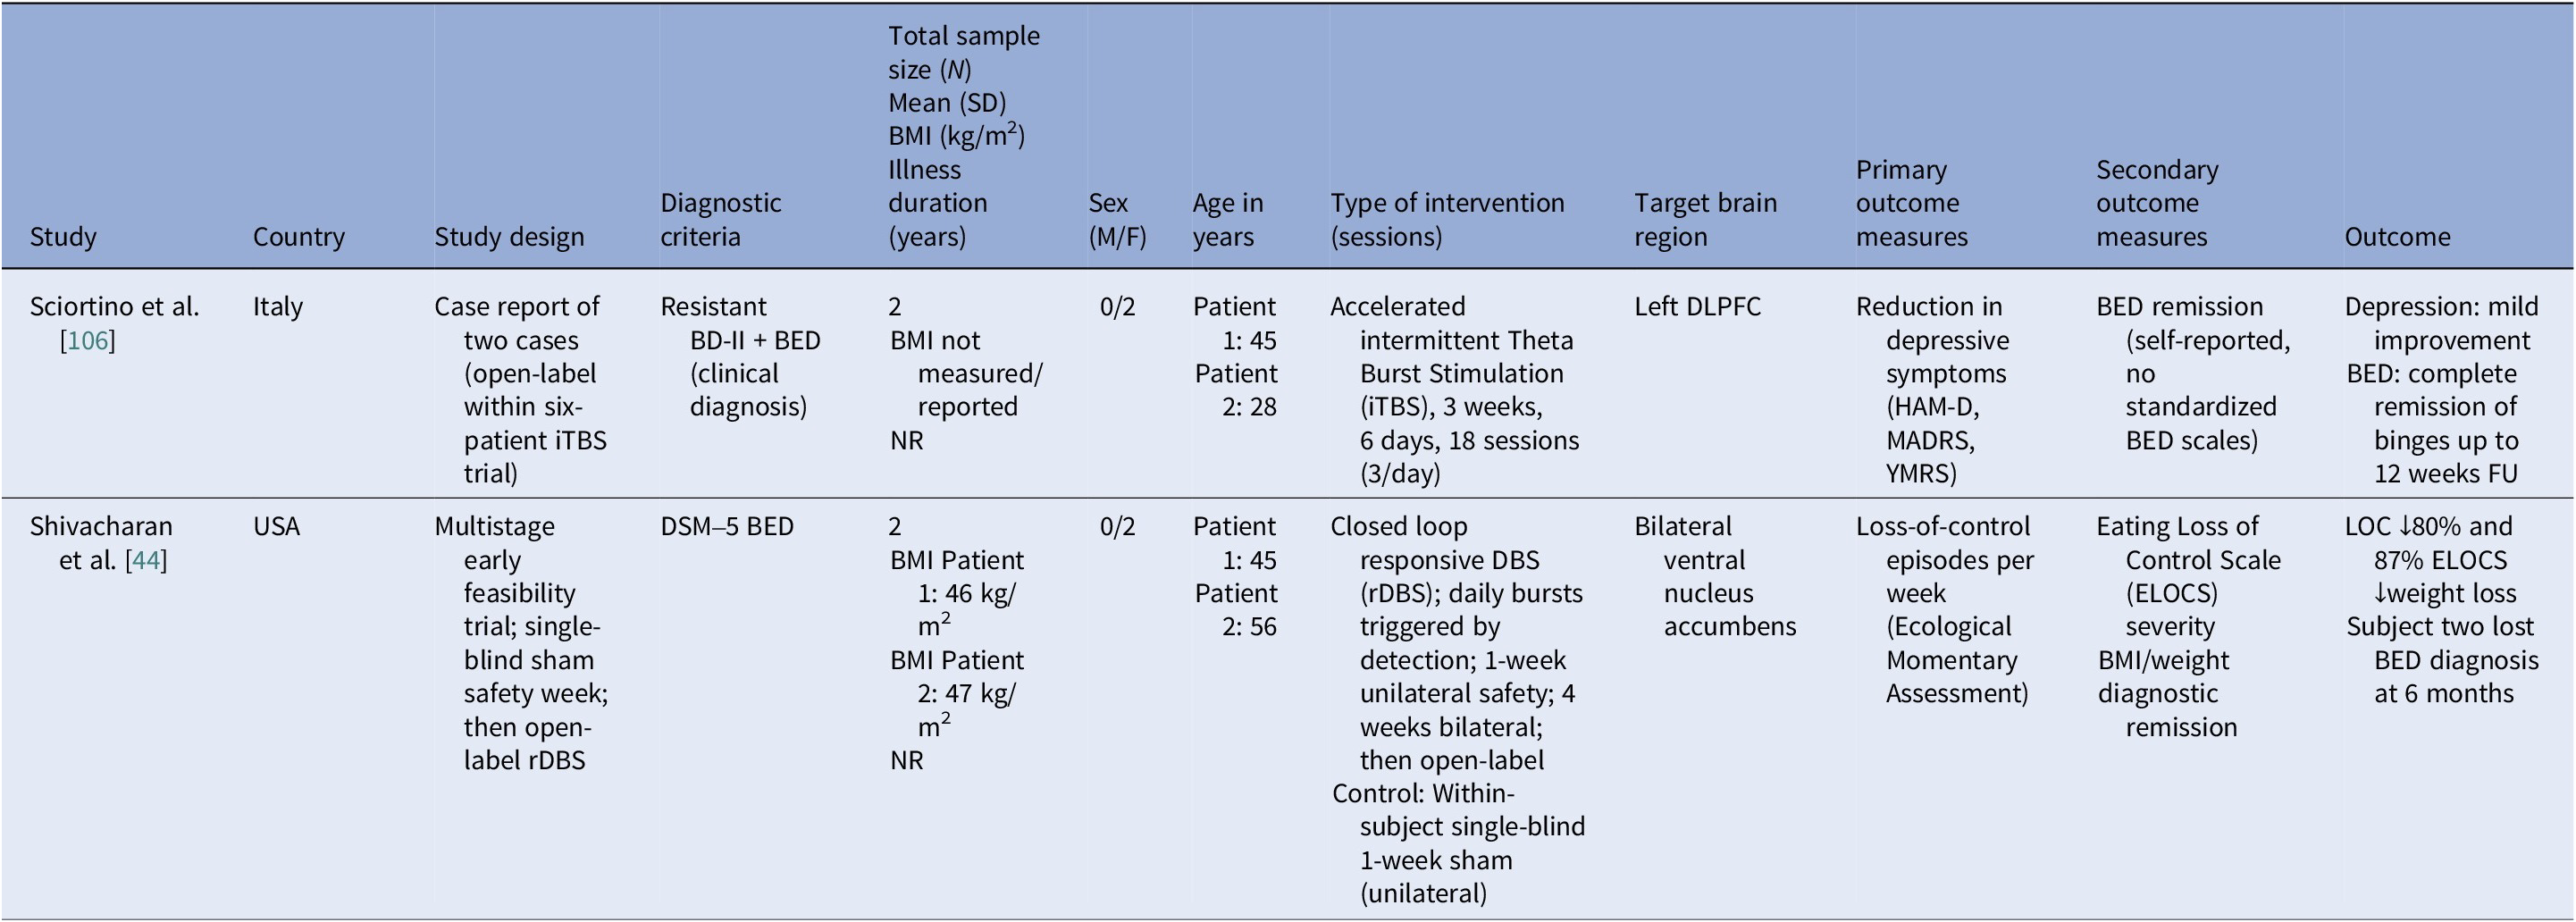
We identified ten controlled BED trials (Table 6). Nine tDCS [Reference Burgess, Sylvester, Morse, Amthor, Mrug and Lokken96–Reference Max, Giel, Plewnia, Lossa, Zipfel and Schag104] and one rTMS [Reference Maranhão, Estella, Cury, Schmidt, Campbell and Claudino105], in addition to a case report of iTBS to the left DLPFC [Reference Sciortino, Schiena, Cantù, Maggioni and Brambilla106] and one of rDBS to the bilateral ventral NAcc [Reference Shivacharan, Rolle, Barbosa, Cunningham, Feng and Johnson44] (Table 7). The ACCElect trial [Reference Giel, Schag, Max, Martus, Zipfel and Fallgatter100] is the parent for the Max et al. (2023, 2025) trials [Reference Max, Schag, Giel and Plewnia101, Reference Max, Giel, Plewnia, Lossa, Zipfel and Schag104].
Protocols ranged from single-session tDCS [Reference Burgess, Sylvester, Morse, Amthor, Mrug and Lokken96, Reference Ince, Max, Plewnia, Leehr, Zipfel and Giel98, Reference Max, Plewnia, Zipfel, Giel and Schag99] to 6–10 tDCS sessions, often with cognitive training [Reference Giel, Schag, Max, Martus, Zipfel and Fallgatter100, Reference Flynn, Campbell and Schmidt103] and 20 rTMS sessions [Reference Maranhão, Estella, Cury, Schmidt, Campbell and Claudino105], primarily engaging the DLPFC control networks. Reported cases targeted the ventral–striatal reward circuitry (rDBS study) [Reference Maranhão, Estella, Cury, Schmidt, Campbell and Claudino105]. A single 2 mA right-DLPFC tDCS reduced craving and lab intake and briefly reduced urge to binge [Reference Burgess, Sylvester, Morse, Amthor, Mrug and Lokken96]. It also improved inhibitory control, as measured by ERP and antisaccade tasks [Reference Ince, Max, Plewnia, Leehr, Zipfel and Giel98]. The dose effect favored the 2 mA over the 1 mA for inhibitory speed and binge reduction [Reference Max, Plewnia, Zipfel, Giel and Schag99]. Multisession tDCS plus training was shown to delay verum versus sham separation at 12 weeks on binge frequency [Reference Giel, Schag, Max, Martus, Zipfel and Fallgatter100]. Home-based tDCS plus attention bias modification training (ABMT) yielded the largest objective binge episode and mood gains [Reference Flynn, Campbell and Schmidt103]. With 28 high-dose sessions and nutrition counseling, groups improved without between-group differences in clinical outcomes, though cortical inhibition increased only with active tDCS [Reference Elkfury, Antunes, Tocchetto, Menegassi, Sanches and Pereira102]. Twenty 10 Hz rTMS sessions to the left-DLPFC outperformed sham in reducing binge episodes at the end of treatment and at follow-up [Reference Maranhão, Estella, Cury, Schmidt, Campbell and Claudino105]. Regarding case report evidence, rDBS to the NAcc resulted in sustained reduction of loss of control and weight loss over 6 months [Reference Shivacharan, Rolle, Barbosa, Cunningham, Feng and Johnson44], and 18 sessions of iTBS led to complete binge remission at 12 weeks [Reference Sciortino, Schiena, Cantù, Maggioni and Brambilla106].
Comorbidities
Reporting varied by diagnosis and modality. In AN rTMS RCTs, scales and medication status served as proxies to reporting comorbidities (Table 12). Muratore et al. excluded most comorbidities, allowing only SSRIs and SNRIs [Reference Muratore, Bershad, Steinglass, Foerde, Gianini and Broft55]. A mixed picture emerged among tDCS studies, ranging from studies that detailed comorbidity and medication by arm [Reference Baumann, Mareš, Albrecht, Anders, Vochosková and Hill59] and those reporting only specific scale scores [Reference Mattavelli, Gallucci, Schiena, D’Agostino, Sassetti and Bonora58], to those excluding major comorbidity without specifying the disorders [Reference Costanzo, Menghini, Maritato, Castiglioni, Mereu and Varuzza57] or enrolling a “comorbidity-clean” sample [Reference Rząd, Rog, Kajka, Seweryn, Patyk and Karakuła-Juchnowicz60]. AN open-label studies carried the heaviest burden, reporting frequent MDD, PTSD, OCD, personality disorders, and high psychotropic use, whereas ECT cohorts reported high suicidality and self-harm (Table 13). In BN, comorbidity was intermediate, with MDD and anxiety predominating (Table 14). Many used SSRIs with or without antipsychotics and benzodiazepines. PTSD and OCD were also noted [Reference Dunlop, Woodside, Lam, Olmsted, Colton and Giacobbe83]. BN tDCS studies favored dimensional measures over diagnoses [Reference Kekic, McClelland, Bartholdy, Boysen, Musiat and Dalton93]. In BED, controlled tDCS relied on exclusions rather than tabulating comorbidity (Table 15). Where reported, burden was substantial both from psychiatric and medical comorbidities [Reference Giel, Schag, Max, Martus, Zipfel and Fallgatter100, Reference Flynn, Campbell and Schmidt103]. The BED rTMS RCT minimized comorbidities, largely disallowing psychotropics except stable antidepressants [Reference Maranhão, Estella, Cury, Schmidt, Campbell and Claudino105]. Regarding case reports, the iTBS study reported on patients with bipolar II on stable meds [Reference Sciortino, Schiena, Cantù, Maggioni and Brambilla106] and the rDBS study examined patients with extensive somatic comorbidity and migraine [Reference Shivacharan, Rolle, Barbosa, Cunningham, Feng and Johnson44].
Neuromodulation controlled trials in AN – comorbidities

Abbreviations: AN, anorexia nervosa; AN-R, anorexia nervosa–restricting type; AN-BP, anorexia nervosa–binge/purge type; BN, bulimia nervosa; BMI, body mass index; DASS-21, Depression, Anxiety, and Stress Scales, 21-item; DSM-5, Diagnostic and Statistical Manual of Mental Disorders, 5th edition; ED, eating disorder; EDA-5, Eating Disorder Assessment for DSM-5; EDDS, Eating Disorder Diagnostic Scale; EDNOS, eating disorders not otherwise specified; FBT, family-based therapy; fMRI, functional magnetic resonance imaging; RCT, randomized controlled trial; rTMS, repetitive transcranial magnetic stimulation; SCL-90, Symptom Checklist Questionnaire-90; SE-AN, severe enduring anorexia nervosa; SNRI, serotonin-norepinephrine reuptake inhibitors; SSRI, selective serotonin reuptake inhibitors; TAU, treatment as usual; tDCS, transcranial direct current stimulation.
Neuromodulation open trials and case series in AN – comorbidities
Abbreviations: AN, anorexia nervosa; AN-BP, anorexia nervosa binge eating/purge subtype; AN-R, anorexia nervosa restricting type; BIS-11, Barrat Impulsivity Scale 11; BDI, Beck Depression Inventory; BMI, body mass index; CBT, cognitive behavioral therapy; DBS, deep brain stimulation; DSM-IV-TR/5, Diagnostic and Statistical Manual of Mental Disorders, 4th edition/5th edition; DASS, Depression, Anxiety, and Stress Scales; EEG, electroencephalography; ECT, electroconvulsive therapy; ED, eating disorder; fMRI, functional magnetic resonance imaging; GAF, Global Assessment of Functioning; GAD, generalized anxiety disorder; GIT, gastrointestinal tract; HAM-A, Hamilton Anxiety Scale; HAM-D, Hamilton Depression Rating Scale; HC, healthy controls; LFTs, liver function tests; MDD, major depressive disorder; NAcc, nucleus accumbens; OCD, obsessive–compulsive disorder; OCDP, obsessive–compulsive personality disorder; PD, personality disorder; PET, positron emission tomography; PTSD, post-traumatic stress disorder; RCT, randomized controlled trial; rTMS, repetitive transcranial magnetic stimulation; SCID-I/P, Structured Clinical Interview for DSM-IV Axis I disorders (patient edition); SCID-5, Structured Clinical Interview for DSM-5; SNRI, serotonin-norepinephrine reuptake inhibitors; SSRIs, selective serotonin reuptake inhibitors; SUD, substance use disorder; tDCS, transcranial direct current stimulation; TMS, transcranial magnetic stimulation; Y-BOCS, Yale–Brown Obsessive–Compulsive Scale.
Neuromodulation studies in BN – comorbidities

Abbreviations: AN-BP, anorexia nervosa binge/purge type; AN, anorexia nervosa; BN, bulimia nervosa; cf., compared with; DASS-21, Depression Anxiety and Stress Scales; DSM-IV/DSM-5, Diagnostic and Statistical Manual of Mental Disorders, 4th/5th ed.; EDNOS, eating disorders not otherwise specified; EDs, eating disorders; HADS, Hospital Anxiety and Depression Scale; HDRS, Hamilton Depression Rating Scale; MADRS, Montgomery–Åsberg Depression Rating Scale; MDD, major depressive disorder; OCD, obsessive–compulsive disorder; PTSD, post-traumatic stress disorder; RCT, randomized control trial; rTMS, repetitive transcranial magnetic stimulation; SCID, Structured Clinical Interview for DSM-IV; SCL-90-R, Symptom Checklist-90–Revised; SNRI, serotonin noradrenaline reuptake inhibitor; SSRI, selective serotonin reuptake inhibitor; tDCS, transcranial Direct Current Stimulation.
Neuromodulation studies in BED – comorbidities

Abbreviations: ADHD, attention deficit/hyperactivity disorder; AN, anorexia nervosa; BD-II, bipolar disorder type II; BDI-II, Beck Depression Inventory-II; BED, binge eating disorder; BES, Binge Eating Scale; BN, bulimia nervosa; BP-CSI, Brazilian Portuguese-Central Sensitization Inventory; DSM-5, Diagnostic and Statistical Manual of Mental Disorders 5th edition; EDE, Eating Disorder Examination; EDE-Q, Eating Disorder Examination Questionnaire; GHQ, General Health Questionnaire; iTBS, intermittent theta burst stimulation; MINI, Mini International Neuropsychiatric Interview; PSQI, Pittsburgh Sleep Quality Index; RCT, randomized controlled trial; rDBS, responsive deep brain stimulation; rTMS, repetitive transcranial magnetic stimulation; SCID-5-CV, Structured Clinical Interview for DSM-5; SCID-I, Structured Clinical Interview for DSM-IV Axis I Disorders; SSRI, serotonin selective reuptake inhibitor; SNRI, serotonin norepinephrine reuptake inhibitor; STAI, State–Trait Anxiety Inventory; tDCS, transcranial direct current stimulation.
Safety and tolerability
Safety and tolerability were overall favorable. In AN-controlled trials (Table 16), most tDCS and rTMS adverse events (AEs) were mild and transient, including headache, scalp discomfort, tingling, dizziness, and fatigue. One rTMS-IPL study noted malnutrition and suicide attempts, but attribution was unclear [Reference Chastan, Achamrah, Etard, Nathou, Piquet and Guillaume56]. Hypomania and new-onset diabetes were also reported [Reference Baumann, Mareš, Albrecht, Anders, Vochosková and Hill59]. In AN open studies, DBS had the highest AE load, yet many serious AEs reflected illness severity. Retention rate was reasonable, though long-term dropouts occurred (Table 17). TMS and dTMS were well tolerated, and tDCS gave mainly local skin effects. ECT showed the expected cognitive and systemic effects. Serious AEs reflected high baseline risk [Reference Shilton, Enoch-Levy, Giron, Yaroslavsky, Amiaz and Gothelf78], leading to earlier discontinuation due to cognitive decline [Reference Ferguson77]. Regarding BN, studies reported mild AEs and no serious device-related events (Table 18). There were a few logistical or unrelated withdrawals [Reference Van den Eynde, Claudino, Mogg, Horrell, Stahl and Ribeiro89, Reference Claudino, Van Den Eynde, Stahl, Dew, Andiappan and Kalthoff90, Reference Gay, Jaussent, Sigaud, Billard, Attal and Seneque92, Reference Guillaume, Gay, Jaussent, Sigaud, Billard and Attal94], and tDCS demonstrated high acceptability [Reference Mattavelli, Gallucci, Schiena, D’Agostino, Sassetti and Bonora58, Reference Kekic, McClelland, Bartholdy, Boysen, Musiat and Dalton93]. There were no serious AEs in the BED studies (Table 19). Adherence was good, and attrition was primarily unrelated to AEs [Reference Burgess, Sylvester, Morse, Amthor, Mrug and Lokken96, Reference Ince, Max, Plewnia, Leehr, Zipfel and Giel98–Reference Giel, Schag, Max, Martus, Zipfel and Fallgatter100, Reference Flynn, Campbell and Schmidt103, Reference Maranhão, Estella, Cury, Schmidt, Campbell and Claudino105].
Neuromodulation clinical trials in AN – safety

Abbreviations: AN, Anorexia Nervosa; S-AEs, Serious-Adverse Events; AMA, Against Medical Advice; BA-40, Brodmann Area 40; DLPFC, Dorsolateral Prefrontal Cortex; rTMS, Repetitive Transcranial Magnetic Stimulation; SE-AN, Severe Enduring Anorexia Nervosa; tDCS, Transcranial Direct Current Stimulation.
Neuromodulation open trials and case series in AN – safety

Abbreviations: AN, anorexia nervosa; AN-BP, anorexia nervosa binge eating/purge subtype; AN-RP, anorexia nervosa restricting type; ALIC, anterior limb of the internal capsule; BDS, bodily distress syndrome; BMI, body mass index; DBS, deep brain stimulation; dTMS, deep transcranial magnetic stimulation; DLPFC, dorsolateral prefrontal cortex; dmPFC, dorsomedial prefrontal cortex; ECT, electroconvulsive therapy; FU, follow up; H-Coil: Hesed coil; LFTs, liver function tests; NAcc, nucleus accumbens; NG, nasogastric; rTMS, repetitive transcranial magnetic stimulation; S-AEs, serious-adverse events; SCC, subcallosal cingulate cortex; SIB, self-injurious behavior; tDCS, transcranial direct current stimulation; TMS, transcranial magnetic stimulation; tx, treatment; vALIC, ventral anterior limb of the internal capsule.
Neuromodulation studies in BN – safety

Abbreviations: AL/CR, anterior left/caudal right; AR/CL, anterior right/caudal left; BN, bulimia nervosa; DLPFC, dorsolateral prefrontal cortex; dmPFC, dorsomedial prefrontal cortex; mPFC, medial-prefrontal cortex; NIRS, near-infrared spectroscopy; rEBA, right extrastriate body area; rTMS, repetitive transcranial magnetic stimulation; tDCS, transcranial direct current stimulation.
Neuromodulation studies in BED – safety

Abbreviations: AEs, adverse events; AR, anterior right; ABMT, attention bias modification training; BED, binge eating disorder; DBS, deep brain stimulation; DLPFC, dorsolateral prefrontal cortex; EEG, electroencephalogram; fMRI, functional magnetic resonance imaging; FU, follow up; iTBS, intermittent theta burst stimulation; NCT, nutritional counseling therapy; RCT, randomized control trial; rDBS, responsive deep brain stimulation; rTMS, repetitive transcranial magnetic stimulation; tDCS, transcranial direct current stimulation.
Quality assessment
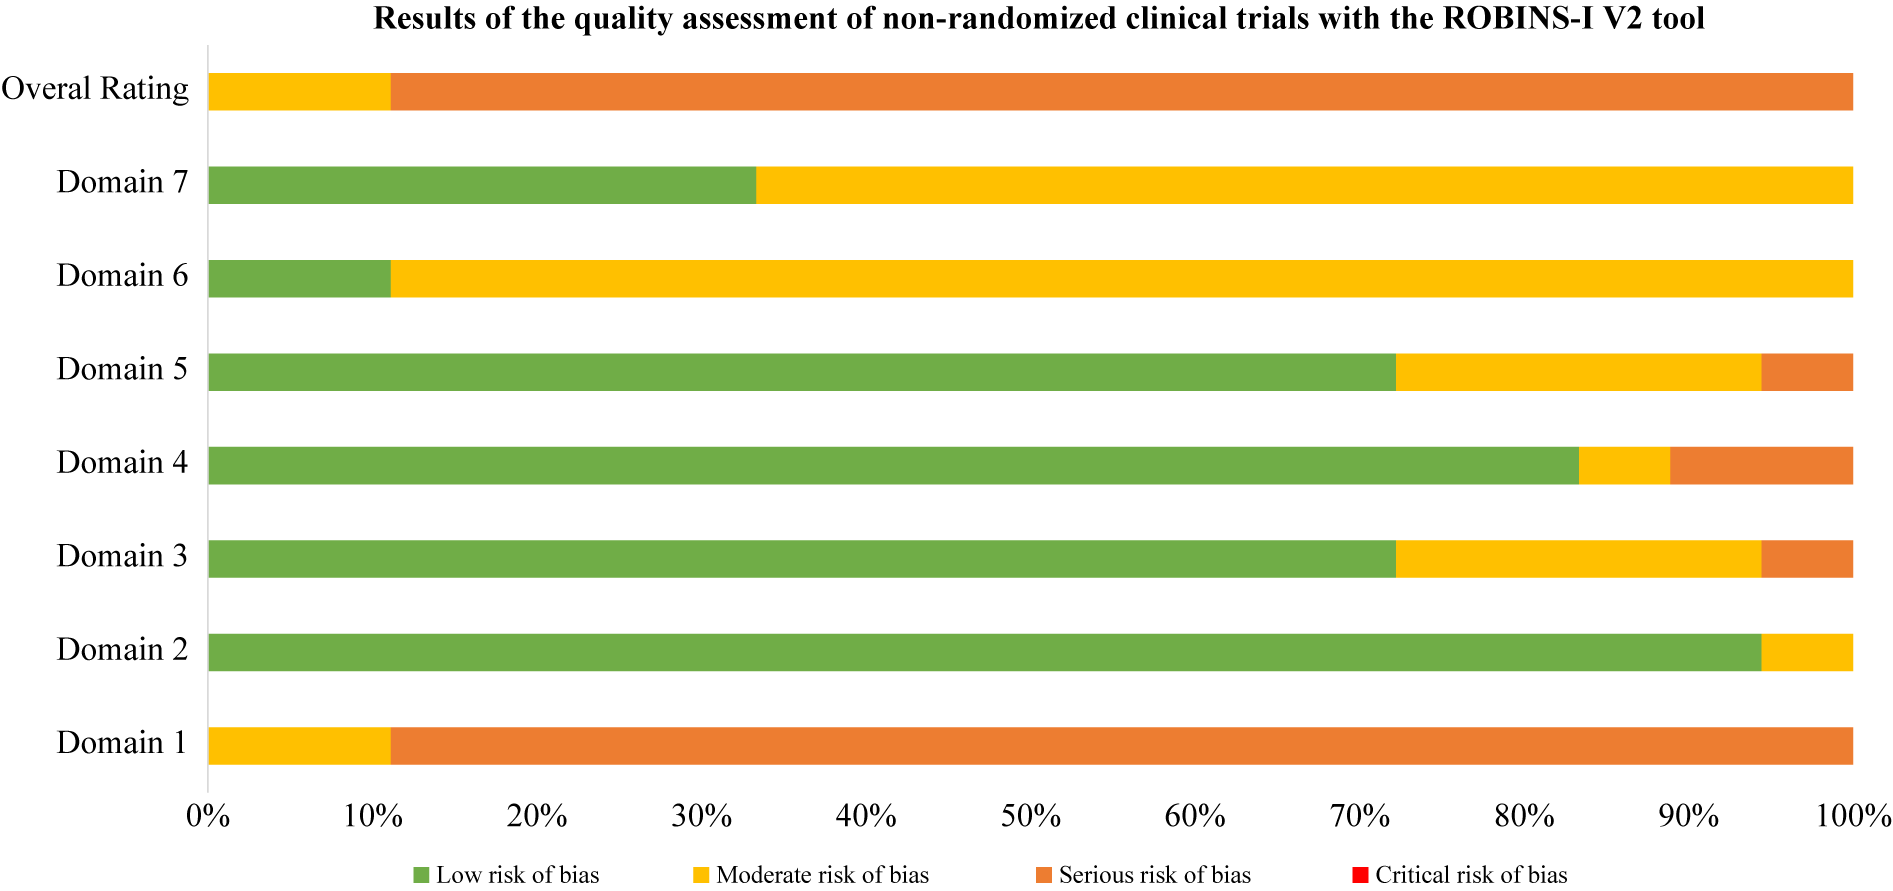
Using RoB2 for RCTs [Reference Sterne, Savović, Page, Elbers, Blencowe and Boutron47], all were high overall risk (Table 20, Figure 2), driven by Domains 2, 3, and 5. Domain 4 typically reflected low risk, with fewer concerns in Domain 1. ROBINS-I V2 [Reference Sterne, Hernán, Reeves, Savović, Berkman and Viswanathan46] rated the majority of nonrandomized and open studies as having a serious overall risk (Table 21, Figure 3), primarily due to confounding (Domain 1) and variable selection or deviation risks.
Results of the quality assessments of RCTs with the RoB 2 tool

Note: Domain 1: Bias arising from the randomization process. Domain 2: Bias due to deviations from intended interventions. Domain 3: Bias due to missing outcome data. Domain 4: Bias in measurement of the outcome. Domain 5: Bias in selection of the reported result.
RoB results. Domain 1: Bias arising from the randomization process. Domain 2: Bias due to deviations from intended interventions. Domain 3: Bias due to missing outcome data. Domain 4: Bias in measurement of the outcome. Domain 5: Bias in selection of the reported result.

Results of the quality assessment of non-randomized clinical trials with the ROBINS-I V2 tool

Note: Domain 1: Risk of bias due to confounding. Domain 2: Risk of bias in classification of interventions. Domain 3: Risk of bias in selection of participants into the study (or into the analysis). Domain 4: Risk of bias due to deviations from intended interventions. Domain 5: Risk of bias due to missing data. Domain 6: Risk of bias arising from measurement of the outcome. Domain 7: Risk of bias in selection of the reported result.
ROBINS-I V2 open trials results. Domain 1: Risk of bias due to confounding. Domain 2: Risk of bias in classification of interventions. Domain 3: Risk of bias in selection of participants into the study (or into the analysis). Domain 4: Risk of bias due to deviations from intended interventions. Domain 5: Risk of bias due to missing data. Domain 6: Risk of bias arising from measurement of the outcome. Domain 7: Risk of bias in selection of the reported result.

Discussion
The studies reviewed here collectively highlight the promise and limitations of rTMS, tDCS, DBS, and ECT in AN, BN, and BED, despite their diverse methodologies and clinical foci. We replicated results of recent reviews and meta-analyses [Reference Pacilio, Livingston and Gordon110–Reference Longo, Bevione, Lacidogna, Lavalle, Abbate Daga and Preti121], concluding that noninvasive rTMS and tDCS reliably reduce craving and urge to binge and improve self-control and mood in BN and BED. On the contrary, invasive treatments like DBS demonstrated the most potent effects on weight restoration, especially in AN, but remain restricted to small, highly selected samples, bearing a higher burden of AEs. This review contributes novel findings on pooled, sample-size-weighted descriptive statistics following clarification of overlapping cohorts, as well as explicit circuit-to-outcome mapping across ED diagnoses.
A transdiagnostic pattern of neuronal circuit mapping to symptoms appears to emerge. Engagement of the DLPFC and the frontoparietal control network enhances executive control across disorders. In AN, this relates to short-term gains in BMI and ED psychopathology in adolescents and to cognitive improvement in adults [Reference McClelland, Kekic, Bozhilova, Nestler, Dew and Van Den Eynde50, Reference Costanzo, Menghini, Maritato, Castiglioni, Mereu and Varuzza57]. In BN and BED, it relates to reduced cue reactivity and lower binge frequency when dosing is adequate or paired with cognitive training [Reference Dunlop, Woodside, Lam, Olmsted, Colton and Giacobbe83, Reference Flynn, Campbell and Schmidt103]. Recruitment of the dmPFC and connected ACC, insula, and striatum supports cognitive-affective control in all three diagnoses. Clinically, this manifests as better impulse control, improved decision making, and reduced negative affect, with a reduction in purging in a subset of BN participants [Reference Dunlop, Woodside, Lam, Olmsted, Colton and Giacobbe83, Reference Woodside, Dunlop, Sathi, Lam, McDonald and Downar87, Reference Kekic, McClelland, Bartholdy, Boysen, Musiat and Dalton93]. Modulation of the limbic and reward systems shows partially shared relevance, aligning with previous reports [Reference Wu, Lo, Cavaleri, Bergosh, Ipe and Briggs122]. Downregulation of amygdala activity during DLPFC stimulation aligns with sustained weight gain in a subset of AN, while direct engagement of ventral striatal circuitry by rDBS reduces loss-of-control eating in BED and supports motivational re-engagement with food [Reference Shivacharan, Rolle, Barbosa, Cunningham, Feng and Johnson44]. Visual valuation and body image networks, including the mPFC and rEBA, appear salient for cognitive–attitudinal shifts in AN, with less durable clinical impact to date [Reference Mattavelli, Gallucci, Schiena, D’Agostino, Sassetti and Bonora58]. Together, these overlaps support a staged, circuit-informed approach prioritizing control networks for all diagnoses, adding affective control targets when impulse dysregulation predominates, and reserving direct reward system modulation for refractory motivational or binge-driven presentations.
Age and illness duration clustered by diagnosis rather than by stimulation modality. The percentage of female participants was highest in AN studies but progressively decreased across BN and BED studies. Furthermore, BMI patterns were, as expected, correlated with clinical profiles, such that AN BMIs were in the underweight range, BN BMIs were normal, and BED BMIs were in the obese range. Baseline BMI differed by stimulation modality within AN studies, with higher values observed in the noninvasive rTMS and tDCS trials, and lower values in the DBS cohorts. This difference reflects the selection of patients with more severe medical comorbidity and refractoriness for invasive stimulation. Comorbidity profiles also differed by diagnosis, with heavier psychiatric and medical burden in AN open cohorts and variable, but substantial mood and anxiety comorbid disorders in BN and BED. Regarding safety, the overall profile was favorable, though the risk of bias remained high.
Limitations
Several limitations, including a high risk of bias, female preponderance, and small sample sizes, constrain our findings. Furthermore, key methodological aspects lacked standardization. For example, even when the same target was used, stimulation intensity, frequency, and duration differed widely. Outcomes ranged from objective indices such as BMI or binge frequency to self-reports, hindering comparability. Follow-up was typically brief, with only a few studies extending beyond 6 months, leaving durability and maintenance uncertain. Comorbidity seemed to influence response to treatment and the emergence of AEs, leading to limited direct comparability across studies.
We did not perform a meta-analysis due to heterogeneity across studies. In AN, trials varied from single-session to multisession courses, used multiple targets, employed mixed designs, and featured divergent primary outcomes. In BN, single-session cue or cognitive paradigms were combined with multisession symptom trials using incompatible endpoints. In BED, trials varied by design, were paired with diverse tasks and nonaligned follow-up points, and often did not report on harmonizable variance data. Internal inconsistencies between tables and text further complicated data extraction in several reports.
Future research
These limitations argue for cautious causal inference and for subsequent studies to use prospective, personalized protocols for target optimization and for individualization of intensity, frequency, site, session number, stimulation dose, follow-up, and integration of neuroimaging or blood biomarkers, while augmenting psychotherapy, rigorously reporting on safety, and accounting for baseline standardized comorbidity. Tracking ongoing trials and conducting large, well-powered RCTs testing core ED behaviors with harmonized stimulation parameters and validated outcomes and exploring additional neurostimulation modalities [Reference Melis, Apicella, Macario, Dozio, Bentivoglio and Mendolicchio123] is likely to benefit this field.
Conclusion
This review shows that in EDs, neuromodulation is advancing alongside improved circuit models and data-driven targeting. As therapeutics move increasingly into treatment individualization, neuromodulation presents a valuable, viable, and safe option, which, when implemented at the right illness progression stage [Reference Treasure, Stein and Maguire33, Reference Marcolini, Ravaglia, Tempia Valenta, Bosco, Marconi and De Ronchi124], promises to contribute toward avoiding coercion and delaying compulsory treatment of severe ED cases [Reference Touyz, Aouad, Carney, Ong, Yager and Newton125].
Data availability statement
Not relevant, all data are shared in the tables accompanying the manuscript.
Author contribution
Evangelia Maria Tsapakis oversaw research coordination and organized, managed, and analyzed the result database. She was the primary author of the manuscript and orchestrated and contributed to the intellectual conceptualization of the perspective paper. Evangelia Maria Tsapakis, Michael Carl Treiber, and Efi Karakosta performed the initial screening and data extraction for study tabulation and edited the manuscript. Anysia Papazoglou ran the risk of bias analyses, tabulated relevant data and edited the manuscript. Konstantinos N. Fountoulakis contributed to the writing and editing of this manuscript. The corresponding author had full access to all the data in the study and had final responsibility for the decision to submit for publication. The manuscript has been read and approved by all authors.
Financial support
This research received no specific grant from any funding agency, commercial or not-for-profit sectors.
Competing interests
The authors declare none.


 Open access
Comments
No Comments have been published for this article.