

Introduction
Lichens are classical symbiotic associations (holobionts) that result in complex organisms with specific biological organization (Chapman & Margulis Reference Chapman and Margulis1998). Such associations involve at least two very different organisms, a heterotrophic fungus (mycobiont) and a photosynthetic organism (photobiont). Photobionts can be cyanobacteria (cyanobionts) or green microalgae (phycobionts). The presence of microalgal communities, lichen-associated filamentous fungi, bacteria and yeasts highlight the intrathalline complexity of lichen thalli (Arnold et al. Reference Arnold, Miadlikowska, Higgins, Sarvate, Gugger, Way, Hofstetter, Kauff and Lutzoni2009; U’Ren et al. Reference U’Ren, Lutzoni, Miadlikowska and Arnold2010, Reference U’Ren, Lutzoni, Miadlikowska, Laetsch and Arnold2012; Park et al. Reference Park, Kim, Elvebakk, Kim, Jeong and Hong2015; Aschenbrenner et al. Reference Aschenbrenner, Cernava, Berg and Grube2016; Muggia et al. 2016 Reference Muggia, Fleischhacker, Kopun and Grubea ; Spribille et al. Reference Spribille, Tuovinen, Resl, Vanderpool, Wolinski, Aime, Schneider, Stabentheiner, Toome-Heller and Thor2016; Moya et al. Reference Moya, Molins, Martínez-Alberola, Muggia and Barreno2017).
Lichen literature has reported the occurrence of different phycobiont lineages inside the thalli in several lichen species (Blaha et al. Reference Blaha, Baloch and Grube2006; Ohmura et al. Reference Ohmura, Kawachi, Kasai, Watanabe and Takeshita2006; Piercey-Normore Reference Piercey-Normore2006; Muggia et al. Reference Muggia, Zellnig, Rabensteiner and Grube2010, Reference Muggia, Pérez-Ortega, Kopun, Zellnig and Grube2014; Schmull et al. Reference Schmull, Miadlikowska, Pelzer, Stocker-Wörgötter, Hofstetter, Fraker, Hodkinson, Reeb, Kukwa and Lumbsch2011; Molins et al. Reference Molins, García-Breijo, Reig-Armiñana, del Campo, Casano and Barreno2013; Leavitt et al. Reference Leavitt, Kraichak, Nelsen, Altermann, Divakar, Alors, Esslinger, Crespo and Lumbsch2015). The lichen Ramalina farinacea has proved to be a suitable model to study the multiplicity of microalgae in lichen thalli due to the recurrent coexistence of Trebouxia sp. TR9 and T. jamesii in distant populations (del Campo et al. Reference del Campo, Gimeno, De Nova, Casano, Gasulla, García-Breijo, Reig-Armiñana and Barreno2010; Casano et al. Reference Casano, del Campo, García-Breijo, Reig-Armiñana, Gasulla, del Hoyo, Guéra and Barreno2011). Moreover, a recent study using a deep sequencing technique revealed a much higher microalgal diversity associated with a single lichen thallus of R. farinacea (22 operational taxonomic units (OTUs); Moya et al. Reference Moya, Molins, Martínez-Alberola, Muggia and Barreno2017).
In order to understand the functions of microalgal communities in lichen thalli, phycobiont isolation is a key step in the experimental design. The isolation and culture of symbiotic organisms offers an opportunity to understand the mechanisms underlying the selection of partners in symbiotic interactions (Yoshimura et al. Reference Yoshimura, Yamamoto, Nakano and Finnie2002). Cultures of lichen microalgae involve time-consuming techniques necessary for the successful propagation of these symbionts (Rafat et al. Reference Rafat, Ridgway, Cruickshank and Buckley2015). However, phycobiont isolation is an essential procedure to study lichen physiology, perform morphological characterization and obtain pure material for molecular identification.
Studies dealing with phycobiont diversity in lichen thalli are primarily based on Sanger sequencing. However, this technique could underestimate phycobiont diversity in some lichen species (del Campo et al. Reference del Campo, Gimeno, De Nova, Casano, Gasulla, García-Breijo, Reig-Armiñana and Barreno2010; Molins et al. Reference Molins, García-Breijo, Reig-Armiñana, del Campo, Casano and Barreno2013). There has been an increase in the use of deep sequencing techniques to analyze the diversity of microalgal communities (Bates et al. Reference Bates, Berg-Lyons, Lauber, Walters, Knight and Fierer2012; Park et al. Reference Park, Kim, Elvebakk, Kim, Jeong and Hong2015) because these techniques allow for the detection of a vast number of genotypes that would otherwise remain underestimated in conventional PCR amplifications (Stewart & Cavanaugh Reference Stewart and Cavanaugh2009).
To understand the hidden intrathalline phycobiont diversity and the role of each phycobiont type in a symbiotic relationship, multi-tool and multidisciplinary approaches are needed to obtain comparative results (Catalá et al. Reference Catalá, del Campo, Barreno, García-Breijo, Reig-Armiñana and Casano2015). In particular, we focused on three specific aims: 1) to upgrade a methodology to propagate phycobionts that, coupled with fast molecular identification, will significantly reduce the time needed to complete the process; 2) to evaluate the phycobiont diversity using Sanger sequencing, 454-pyrosequencing and isolation; and 3) to compare the ultrastructural characterization between lichenized phycobionts and microalgae isolated in culture, and to correlate these ultrastructural traits using molecular analyses. To achieve these objectives, we selected Circinaria hispida (Mereschk.) A. Nordin et al. and Flavoparmelia soredians (Nyl.) Hale, two lichen species that occur in different ecosystems.
Materials and Methods
Lichen material
The Circinaria hispida specimen was collected from Zaorejas (Guadalajara, Spain) (40°46''02''N, 2°11'40''W, 1105 m), and the Flavoparmelia soredians specimen was collected on Quercus suber cork from Chóvar (Castellón, Spain) (39°51'13·68''N, 0°19'09·60''W). Samples were dried for one day and then stored at −20°C until their processing.
Experimental design
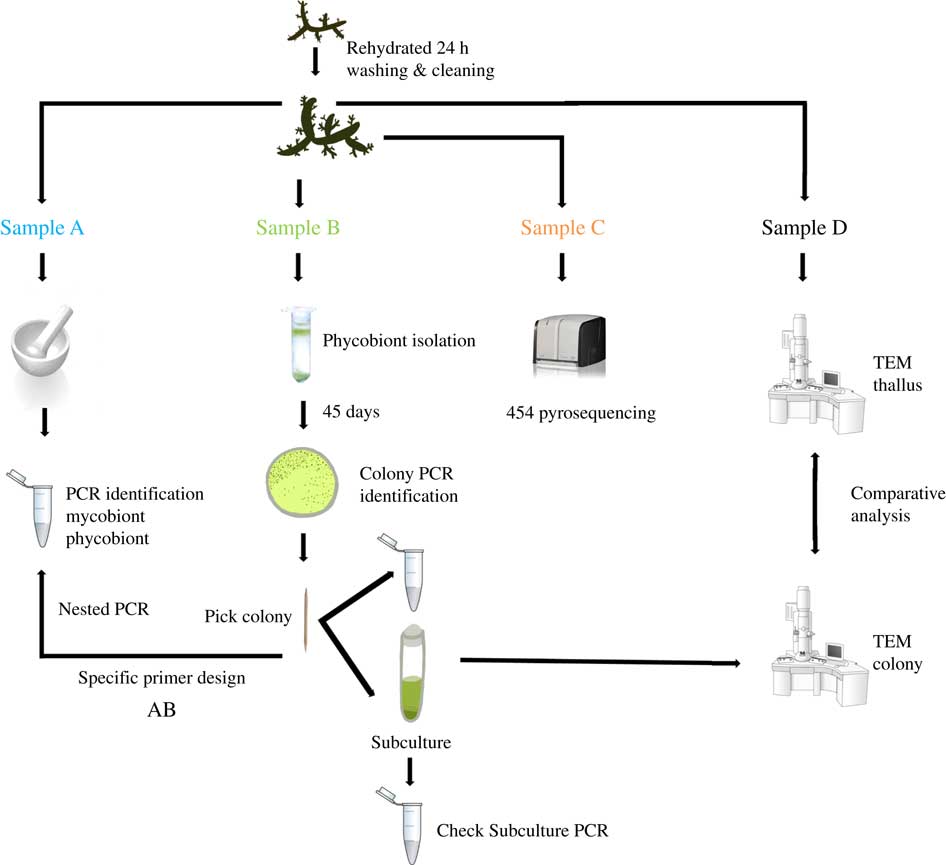
Two lichen thalli (one per species) were examined under a stereomicroscope to exclude surface contamination. Samples were rehydrated with Milli-Q sterile water one day before being processed and stored in a growth chamber at 21°C under a 12/12 h light/dark cycle (lighting conditions: 15 μmol m−2 s−1). Lichen thalli were vortexed three times for 5 min at 2000 rpm with Milli-Q sterile water. Fragments from different parts of each thallus were randomly excised and homogenized together into a single pool per species, and each pool was divided into four samples labelled as A, B, C or D. The mycobiont and primary phycobiont were identified by Sanger sequencing from sample A. The isolation protocol and Sanger identification were performed for sample B. Sample C was analyzed by 454-pyrosequencing. Phycobionts in sample D were characterized by transmission electron microscopy (TEM) to visualize ultrastructure (Fig. 1).
Experimental design for this study. Two thalli of Circinaria hispida and Flavoparmelia soredians were used. After rehydration and cleaning, several parts of the thallus were randomly selected and mixed giving samples A–D. Sample A: DNA extraction and nrITS DNA PCR used to identify the mycobiont and primary phycobiont by Sanger sequencing. Sample B: phycobiont isolation following the protocol in Gasulla et al. (Reference Gasulla, Guéra and Barreno2010). Direct PCR was performed on well-developed colonies which were then propagated by introducing them into liquid medium (BBM). A second PCR was performed to check this subculture as well as TEM examination. Sample C: 454-pyrosequencing. Sample D: Thallus and isolated phycobionts were compared with TEM. AB: specific PCR primers were designed from the cultured strains sequenced in sample B to detect different lineages using the DNA template from pool A. More details of this procedure can be found in Materials and Methods. In colour online.
DNA extraction, amplification and sequencing (A)
Total genomic DNA from sample A was isolated and purified using the DNeasy Plant Mini Kit (Qiagen, Hilden, Germany) following the manufacturer’s instructions (Fig. 1, Sample A). The phycobiont locus encoding the nrITS DNA (internal transcribed spacer) was amplified using the primer pair nr-SSU-1780 (Piercey-Normore & DePriest Reference Piercey-Normore and DePriest2001) and ITS4 (White et al. Reference White, Burns, Lee and Taylor1990). Fungal nrITS DNA was amplified using the primer pair ITS1F (Gardes & Bruns Reference Gardes and Bruns1993) and ITS4 (White et al. Reference White, Burns, Lee and Taylor1990). PCR reactions were performed in 50 µl using the EmeraldAmp GT PCR Master Mix (Takara, Shiga, Japan), which required the addition of the template DNA, specific primers and water.
The PCR program for amplification was comprised of an initial denaturation cycle at 941°C for 2 min, followed by 30 cycles at 94°C for 30 s, 56°C for 45 s and 72°C for 1 min, and finally an elongation cycle at 72°C for 5 min. Amplifications were carried out using a 96-well SensoQuest Labcycler (Progen Scientific Ltd., South Yorkshire, UK). The PCR products were visualized on 2% agarose gels and purified using the Gel Band Purification Kit (GE Healthcare Life Science, Buckinghamshire, England). The amplified PCR products were sequenced with an ABI 3100 Genetic Analyzer using the ABI BigDye Terminator Cycle Sequencing Ready Reaction Kit (Applied Biosystems, Foster City, California).
Isolation and culture conditions, fast identification and propagation (B)
Isolation procedure. Phycobionts were isolated from sample B using the micromethod described by Gasulla et al. (Reference Gasulla, Guéra and Barreno2010). Samples were homogenized with a pestle and mortar in an isotonic buffer (0·3 M sorbitol, 50 mM HEPES, pH 7·5) and filtered through muslin. Isolation was carried out by a gradient centrifugation method using Percoll® (Fig. 1, Sample B).
Culture conditions. The algal suspension was diluted with sterile water for both lichen species and 10 μl was spread using the streak method on sterile 1·5% agar Bold’s Basal Medium (BBM) Petri dishes (Bold Reference Bold1949; Bischoff & Bold Reference Bischoff and Bold1963). The isolated algae were maintained under a photosynthetic photon flux density (PPFD) of 15 μmol m−2 s−1 with a 12 h photoperiod at 21°C; colonies began to develop under these conditions after 25–30 days.
Fast phycobiont identification and propagation. To perform a fast microalgae identification, PCR was performed directly from the well-developed colonies that were selected under the stereomicroscope without carrying out DNA extraction. Algal colonies were collected using a sterile toothpick and introduced directly into the PCR mixture. Subsequently, the colonies were propagated directly by introducing this toothpick into a liquid medium (BBM). To check the subculture, a second PCR was performed on day 15 of cultivation without DNA extraction. All the PCRs were performed under the same conditions as the PCR for sample A. The strains of isolated phycobionts were retained in our culture collection at the University of Valencia.
Specific primer design (AB)
From the cultured strains sequenced in sample B, we designed specific forward primers (T1–T4, corresponding to the four isolated lineages; see the Results section). The primers were based on nrITS DNA differences among lineages which allowed the PCR to discriminate between the different isolated lineages (Fig. 1). The sequences of the primers were as follows:
-
∙ T1: 5´ TCACATTAAGCAATCAATTCTGAAGGCAGATCTACT 3´
-
∙ T2: 5´ CCACTTTTAAGCAATCAATTCTGAAGGCAGATTTACA 3´
-
∙ T3: 5´ TACCAGTCGGACTCACCTTGCCTTTG 3´
-
∙ T4: 5´ ATCTATAGGCTGGCTATGCTGGCTGTAGT 3´
Semi-nested PCR was performed using the DNA template extracted from the thallus in sample A. We first used nr-SSU-1780/ITS4, followed by a nested reaction with the newly developed specific internal primers (T1–T4) and the reverse primer ITS4 (following the PCR conditions described for sample A).
Phylogenetic analysis of sequences obtained by Sanger sequencing
Two multiple alignments were prepared using Clustal W (Thompson et al. Reference Thompson, Gibson, Plewniak, Jeanmougin and Higgins1997), one per species. They included: 1) the newly determined algal nrITS DNA from the lichen thalli and from the colonies (KU318574 to KU318627 for F. soredians and KU318629 to KU318666 for C. hispida); 2) some sequences of Trebouxia spp. retrieved from GenBank (AJ249572 and KJ754251 for C. hispida and in the case of F. soredians KR914022 to KR914025, EU717918, JQ004553, JQ004570, JQ004571, JQ004578 and FJ792802); 3) selected sequences described by Leavitt et al. (Reference Leavitt, Kraichak, Nelsen, Altermann, Divakar, Alors, Esslinger, Crespo and Lumbsch2015) with 98%–99% identity and 100% coverage; 4) a selection of Trebouxia species available from the Culture Collection of Algae at Goettingen University (SAG), species from the Culture Collection of Algae at the University of Texas (UTEX) and Trebouxia sp. TR9 (FJ418565). Variable and parsimony-informative characters were analyzed with MEGA v5.0 (Tamura et al. Reference Tamura, Peterson, Peterson, Stecher, Nei and Kumar2011). We used jModelTest v2.1.4 (Posada Reference Posada2009) with the Akaike Information Criterion (Akaike Reference Akaike1974) to select the most appropriate model of nucleotide substitution (TVM+I+G in both alignments).
The phylogenetic relationships were estimated using Bayesian (BI) and maximum likelihood (ML) inferences. Two parallel Markov chain Monte Carlo (B/MCMC) runs were carried out using MrBayes v3.1.2 (Huelsenbeck & Ronquist Reference Huelsenbeck and Ronquist2003; Ronquist et al. Reference Ronquist, Huelsenbeck and van der Mark2005); each run used six chains simultaneously, was initiated with a random tree and was carried out for 10 million generations. The trees were sampled every 100th generation for a total sample of 200 000 trees.
ML trees were built in PhyML v3.1 (Guindon et al. Reference Guindon, Dufayard, Lefort, Anisimova, Hordijk and Gascuel2010) with 1000 bootstrap replicates. Only clades that received posterior probabilities ≥95% in BI analyses and bootstrap support above 70% in ML analyses were considered as supported. The phylogenetic trees were visualized in TreeView (Page Reference Page1996) and MEGA v5.0 (Tamura et al. Reference Tamura, Peterson, Peterson, Stecher, Nei and Kumar2011).
To circumscribe OTUs that represent candidate lineages, we used the Automatic Barcode Gap Discovery (ABGD) (Puillandre et al. Reference Puillandre, Lambert, Brouillet and Achaz2012). We followed the conditions for Trebouxia spp. that were reported by Leavitt et al. (Reference Leavitt, Kraichak, Nelsen, Altermann, Divakar, Alors, Esslinger, Crespo and Lumbsch2015). The ABGD program employs a genetic distance-based approach to detect OTUs that represent candidate species.
454-pyrosequencing analyses (C)
Over-amplification (Mathieu-Daudé et al. Reference Mathieu-Daudé, Welsh, Vogt and McClelland1996) of the primary phycobiont was circumvented by performing RT-PCR. Rather than using a fixed PCR cycle number for all samples, the appropriate PCR cycle number for the 454-pyrosequencing assay was set based on the cycle threshold (Ct) (Moya et al. Reference Moya, Molins, Martínez-Alberola, Muggia and Barreno2017). A first RT-PCR (RT-PCR I) and a first PCR (PCR I) were performed using the genomic DNA from sample C as a template and nr-SSU-1780/5.8S 2R primers (5.8S 2R; Moya et al. Reference Moya, Molins, Martínez-Alberola, Muggia and Barreno2017) (Fig. 1, Sample C). The number of cycles of PCR I (24 cycles for C. hispida and 23 for F. soredians) was determined by the average Ct of the RT-PCR I. We then performed a second RT-PCR (RT-PCR II) and a second PCR (PCR II) using 1 μl of the PCR I as a template and the fusion primers designed following the GS Junior System Guidelines for Amplicon Experimental Design (Roche, Branford, USA). The specific cycle number for the PCR II (10 cycles for C. hispida and 11 for F. soredians) was determined by the average Ct from the RT-PCR II.
The RT-PCRs (20 μl) contained 10 μl of SYBR premix ExTaq (Takara, Shiga, Japan), 0·8 μM of each primer, 0·4 μl of ROX reference, 1 μl of template DNA and sterile Milli-Q water to volume. Each run contained quadruplicate samples using the following thermal cycle conditions: 30 s at 95°C, followed by 40 cycles of 5 s at 95°C and 30 s at 60°C. In this analysis, the ABI StepOnePlus (Applied Biosystems, Foster City, CA, USA) was used; Ct values were determined using the StepOne software v2.1 package (Applied Biosystems) and were based on fluorescence data recorded during each RT-PCR run.
The PCRs (25 μl) contained 2·5 μl of buffer 10×, 0·4 μM of each primer, 0·2 mM of dNTPs, 0·6 u/μl of ExTaq (Takara, Shiga, Japan) and sterile Milli-Q water to volume. The PCR conditions were one cycle of 95°C for 2 min; x number of cycles (24–23 PCR I, 10–11 PCR II) of 94°C for 30 s, 56°C for 45 s, and 72°C for 1 min; and a final extension of 72°C for 5 min. PCRs were performed in triplicate to prepare the amplicon generation libraries. The three PCR products from each sample were pooled together.
The amplicons were double purified using the Agencourt AMPure XP Bead PCR Purification protocol (Beckman Coulter Genomics, MA, USA). After purification, the amplicons were visualized in a Bioanalyzer 2100 and quantified by fluorometry using a Qubit dsDNA BR Assay Kit (Invitrogen Molecular Probes, Eugene, Oregon, USA).
Algal nrITS DNA sequences were determined using a GS Junior 454 system (Roche 454 Life Sciences, Branford, CT, USA) following the Roche Amplicon Lib-L protocol at the Genomics Core Facility at the University of Valencia (Spain). Reads were processed for Trebouxia as described in Moya et al. (Reference Moya, Molins, Martínez-Alberola, Muggia and Barreno2017) and clustered based on 99% score coverage threshold (-S 99) and 90% length coverage threshold (-L 0·9) criteria. The consensus sequences of the OTUs were identified using the BLAST tool in the GenBank database (Altschul et al. Reference Altschul, Gish, Miller, Myers and Lipman1990).
Phylogenetic analysis of sequences obtained by 454-pyrosequencing
Two multiple alignments were prepared. They included: 1) the consensus sequence OTUs obtained by 454-pyrosequencing analysis; 2) a representative sequence of each of the isolated lineages (T1–T4 and F1); 3) a selection of Trebouxia species available from SAG, a selection from UTEX and Trebouxia sp. TR9. Both alignments were carried out by MAFFT v7.0 (Katoh et al. Reference Katoh, Misawa, Kuma and Miyata2002; Katoh & Toh Reference Katoh and Toh2008) using default parameters. Alignments were 181 base pairs (bp) (C. hispida) and 197 bp (F. soredians) in length for the nrITS DNA region. The best-fit substitution model for this region (SYM+G for C. hispida and SYM for F. soredians) was chosen using jModelTest v2.0 (Darriba et al. Reference Darriba, Taboada, Doallo and Posada2012) and by applying the Akaike Information Criterion (Akaike Reference Akaike1974). ML analysis was implemented in RAxML v8.1.11 (Stamatakis Reference Stamatakis2006). ML searches were implemented using the GTRGAMMA substitution model. Bootstrap support was calculated based on 1000 replications (Stamatakis et al. Reference Stamatakis, Hoover and Rougemont2008). BI phylogenetic analyses were carried out using MrBayes v3.2 (Ronquist et al. Reference Ronquist, Teslenko, van der Mark, Ayres, Darling, Höhna, Larget, Liu, Suchard and Huelsenbeck2012). Settings included two parallel runs; each run used six chains, was initiated with a random tree and was carried out over 20 million generations, with sampling after every 200th generation. We discarded the first 25% of data as burn-in. MAFFT, jModelTest, ML and BI analyses were implemented on the CIPRES Science Gateway v3.3 web portal (Miller et al. Reference Miller, Pfeiffer and Schwartz2010). Phylogenetic trees were visualized in FigTree v1.4.1 (Rambaut Reference Rambaut2012).
Microscopic examinations (D)
TEM examinations were performed on sample D and on selected pure cultures on day 21 of cultivation (Peksa & Škaloud Reference Peksa and Škaloud2008) from C. hispida and F. soredians (Fig. 1, Sample D).
The cells were fixed in 2% Karnovsky fixative for 12 h at 4°C, washed three times for 15 min with 0·01 M PBS (Phosphate Buffered Saline) (pH 7·4) and then post-fixed with 2% OsO4 in 0·01 M PBS (pH 7·4) for 2 h at room temperature. Thereafter, they were washed three times in 0·01 M PBS (pH 7·4) for 15 min and then dehydrated at room temperature in a graded ethanol series, (50%, 70%, 95% and 100%) for no less than 20–30 min at each step (Molins et al. Reference Molins, García-Breijo, Reig-Armiñana, del Campo, Casano and Barreno2013; Moya et al. Reference Moya, Škaloud, Chiva, García-Breijo, Reig-Armiñana, Vancurová and Barreno2015). The fixed and dehydrated samples were embedded in Spurr’s resin according to the manufacturer’s instructions (http://www.emsdiasum.com/microscopy/technical/datasheet/14300.aspx). Sections of resin (90 nm) were cut with a diamond knife (DiATOME Ultra 45°) using an ultramicrotome (Reichert Ultracut E), mounted on oval hole copper grids, coated with formvar and post-stained with 2% (w/v) aqueous uranyl acetate and 2% lead citrate. The post-staining step was completed using the SynapTek Grid Staining Kit (http://www.ems-diasum.com/microscopy/technical/datasheet/71175.aspx). The sections were observed with a JEOL JEM-1010 (80 kV) electron microscope that was equipped with a MegaView III digital camera and AnalySIS image acquisition software. TEM examinations were carried out at the SCSIE Service of the University of Valencia.
Results
Identification of mycobiont and primary phycobiont by Sanger sequencing
The identity of the Circinaria hispida and Flavoparmelia soredians mycobiont was confirmed by BLAST analyses against the GenBank database. Significant matches of 100% identity and 99% coverage were obtained with other C. hispida (HQ171233) and F. soredians (AY586562) sequences.
The identity of the primary phycobiont present in both thalli was confirmed by BLAST searches of the nrITS DNA sequences and included in the phylogenetic analyses (Figs 2 & 3). Significant matches of 100% identity and 99% coverage were obtained with Trebouxia cretacea (KT819919) and T. gelatinosa (KR914022), respectively.
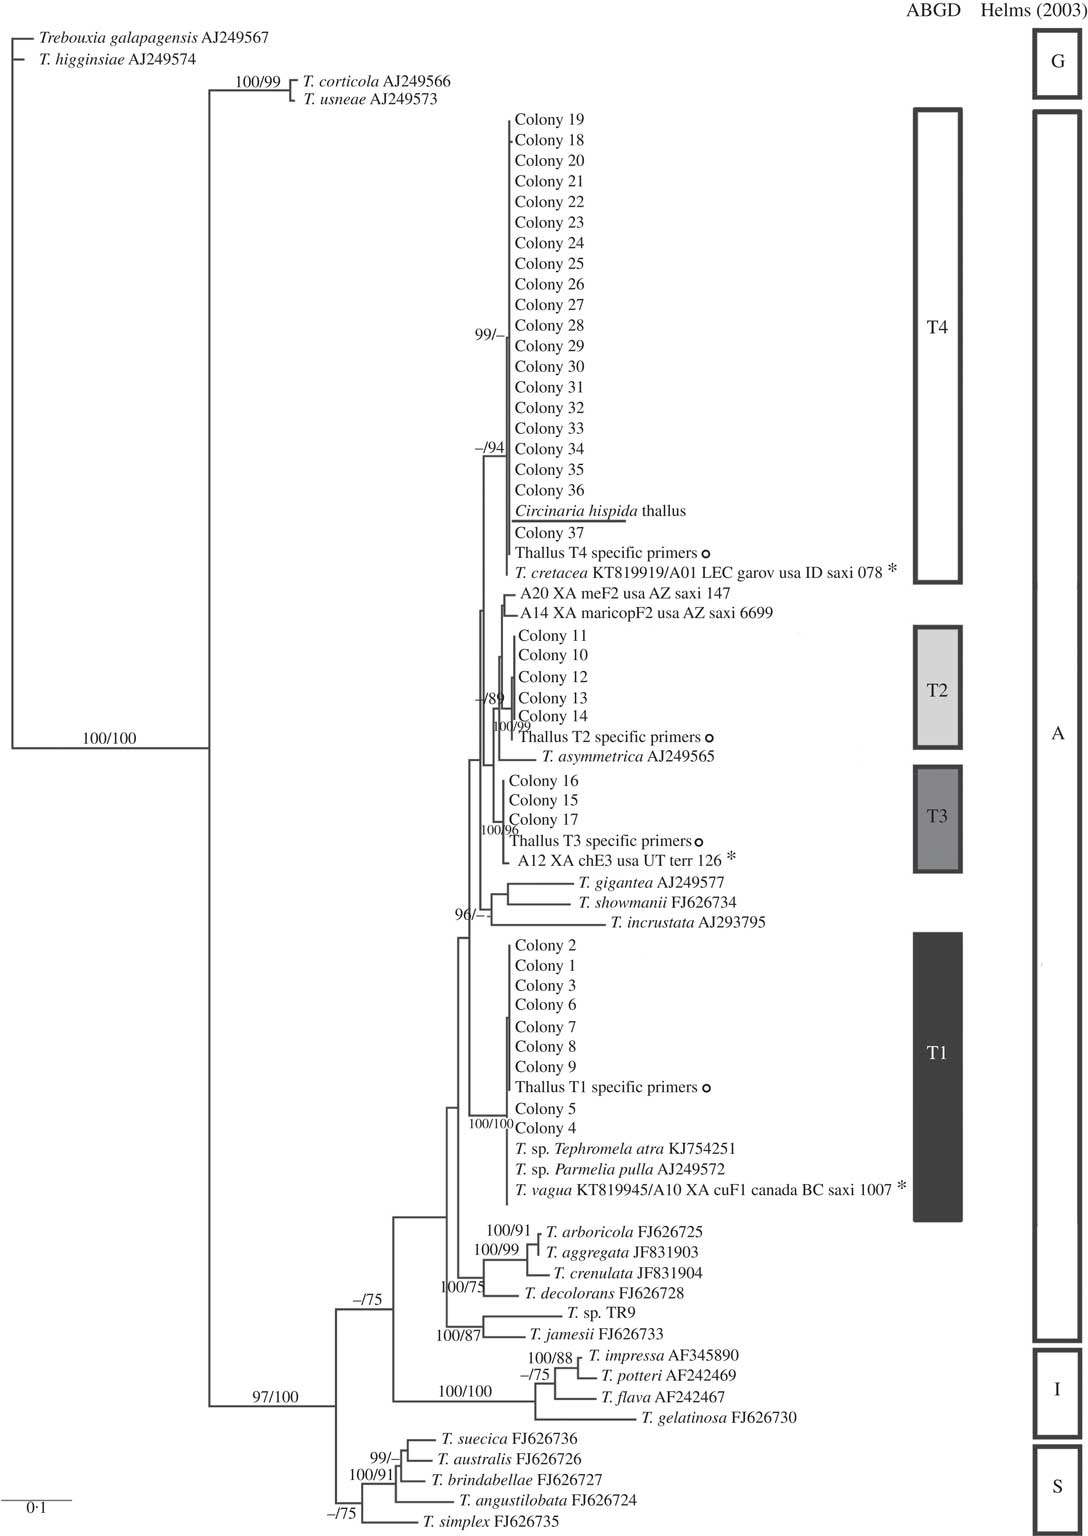
Circinaria hispida phycobiont diversity revealed by Sanger sequencing and isolation. Unrooted nrITS DNA gene tree representing 72 Trebouxia sequences, including 24 nrITS Trebouxia species from SAG, UTEX and Trebouxia sp. TR9, and 5 OTUs described by Leavitt et al. (Reference Leavitt, Kraichak, Nelsen, Altermann, Divakar, Alors, Esslinger, Crespo and Lumbsch2015) retrieved from GenBank. Values at branches refer to BI posterior probabilities ≥95% followed by ML bootstrap support ≥70%. The underlined sequence is the primary detected phycobiont from the thallus; ![]() =sequences obtained from the thallus by specific PCR primers; *=OTUs that fitted strongly with our sequences. Clades A, G, I, S are those described by Helms (Reference Helms2003). The ABGD program identified four OTUs: T1, T2, T3 and T4.
=sequences obtained from the thallus by specific PCR primers; *=OTUs that fitted strongly with our sequences. Clades A, G, I, S are those described by Helms (Reference Helms2003). The ABGD program identified four OTUs: T1, T2, T3 and T4.
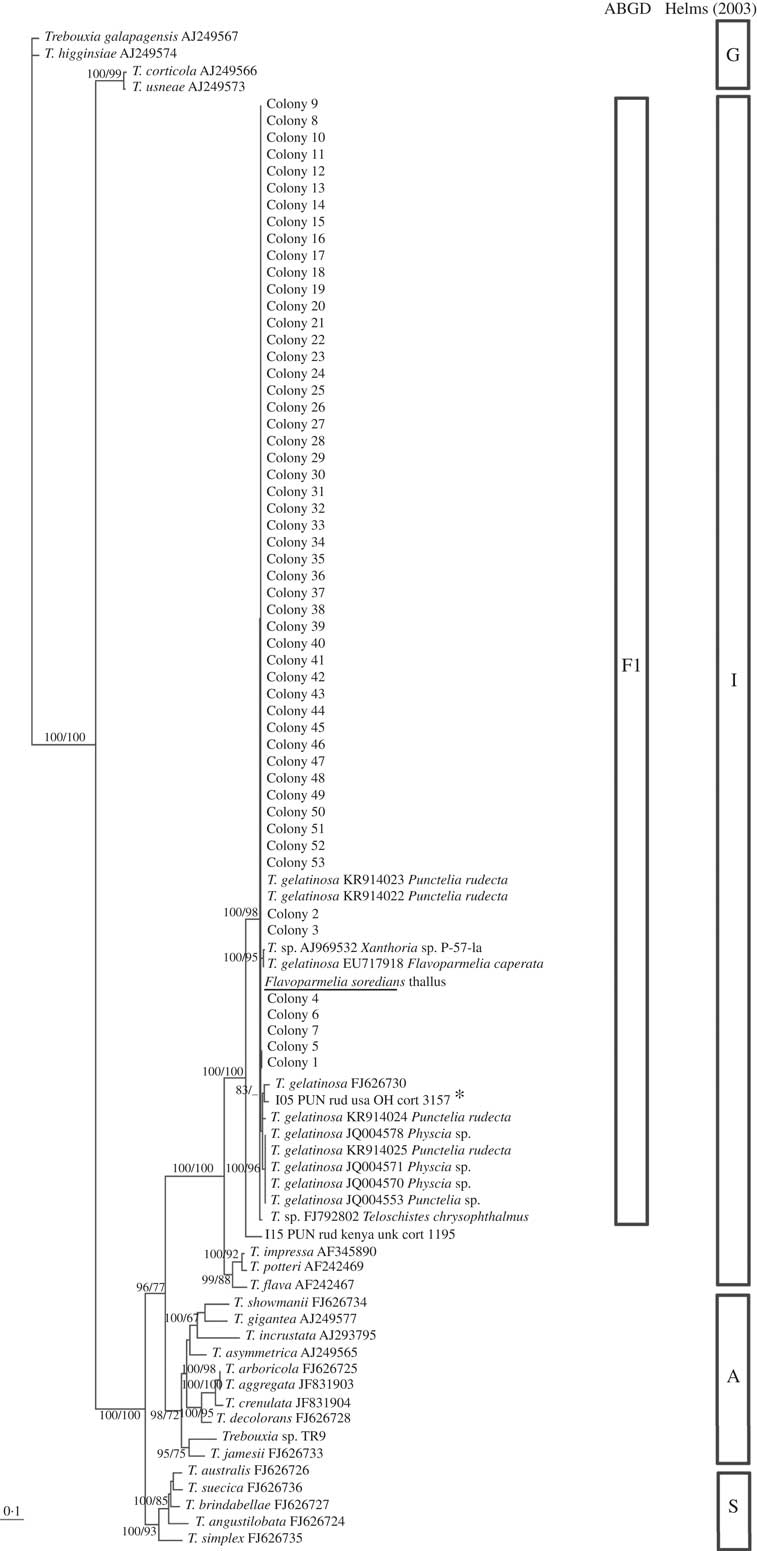
Flavoparmelia soredians phycobiont diversity revealed by Sanger sequencing and isolation. Unrooted nrITS DNA gene tree representing 90 Trebouxia sequences, including 22 nrITS Trebouxia species from SAG, UTEX and Trebouxia sp. TR9, and 2 OTUs described by Leavitt et al. (Reference Leavitt, Kraichak, Nelsen, Altermann, Divakar, Alors, Esslinger, Crespo and Lumbsch2015) were retrieved from GenBank. Values at branches refer to BI posterior probabilities ≥95% followed by ML bootstrap support ≥70%. The underlined sequence is the primary detected phycobiont from the thallus; *=the OTU that fitted strongly with our sequences. Clades A, G, I, S are those described by Helms (Reference Helms2003). The ABGD program identified the unique linage, F1.
Trebouxia diversity by isolation
A total of 37 nrITS DNA sequences for C. hispida and 53 for F. soredians were obtained by sequencing directly from colonies. The aligned algal 5.8S and internal transcribed spacers (ITS1, ITS2) were 539 and 533 bp long, respectively. Circinaria hispida showed 37 variable characters; however, there was only one variable character for F. soredians.
Preliminary phylogenetic analysis, which included our new dataset and the 69 sequences representative of the Trebouxia OTUs described by Leavitt et al. (Reference Leavitt, Kraichak, Nelsen, Altermann, Divakar, Alors, Esslinger, Crespo and Lumbsch2015) (data not shown), allowed us to select and include the most related OTU sequences in our phylogenetic analysis: A01 (T. cretacea, KT819919), A10 (T. vagua, KT819945), A12, A14, A20 (in the case of C. hispida), I05 and I15 (for F. soredians). BI and ML phylogenetic hypotheses were topologically congruent; only clades supported by posterior probabilities ≥95% and bootstrap≥70% have been reported (Figs 2 & 3). The topology for the Trebouxia phylogenetic relationship is congruent with previous studies (Muggia et al. Reference Muggia, Zellnig, Rabensteiner and Grube2010, Reference Muggia, Pérez-Ortega, Kopun, Zellnig and Grube2014; Leavitt et al. Reference Leavitt, Kraichak, Nelsen, Altermann, Divakar, Alors, Esslinger, Crespo and Lumbsch2015; Voytsekhovich & Beck Reference Voytsekhovich and Beck2015).
All Trebouxia sequences from C. hispida belong to the ‘A’- arboricola group, and they formed four statistically well-supported lineages named in the phylogenetic tree as T1, T2, T3 and T4 (Fig. 2). Lineage T1 fitted with T. vagua (OTU A10), lineage T2 formed a well-supported new clade related to T. asymmetrica, lineage T3 matched with OTU A12 and lineage T4 fitted with T. cretacea (OTU A01) and the primary phycobiont from the thallus by Sanger sequencing (underlined in the phylogenetic tree). Lineages T1, T3 and T4 have been previously reported in diverse lichen species. Only lineages T1 and T4 appeared in the genus Circinaria, T1 in C. contorta and T4 in A. desertorum s.a. (Voytsekhovich & Beck Reference Voytsekhovich and Beck2015). Lineage T2 does not match with any previously described Trebouxia sp. (see Supplementary Material Table S1, available online).
All the sequences obtained for F. soredians belong to the ‘I’- impressa group. They formed a statistically well-supported lineage within T. gelatinosa (FJ626730, OTU I05) named F1 and within other sequences ascribed to T. gelatinosa that are available in GenBank from diverse lichens (Fig. 3). Both ABGD and phylogenetic analyses delimited the same lineages: T1–T4 for C. hispida and F1 for F. soredians.
Intrathalline detection of isolated Trebouxia using specific primers
We designed specific forward primers to amplify any of the four Trebouxia lineages detected in C. hispida based on their nrITS DNA. T1 to T4 were successfully amplified in the C. hispida thallus (as indicated by the “○” symbol in the phylogenetic tree in Fig. 2). In the case of F. soredians, only one Trebouxia lineage (F1) was detected and so a specific primer design was not necessary.
Trebouxia diversity by 454-pyrosequencing
Sequencing of nrITS amplicons produced 1645 sequence reads for C. hispida and 1272 for F. soredians. Singleton reads (43 and 19, respectively) were filtered out. By clustering with a 99% similarity cut-off, two OTUs for C. hispida (OTU1C, OTU2C) and one for F. soredians (OTU1F) were recognized. Tree reconstruction was congruent in all utilized methodologies (Supplementary Material Figs S1 & S2, available online). The OTU1C matched with lineage T4 (T. vagua) and the OTU2C matched with lineage T3 (OTU A12). In the case of F. soredians, OTU1F fitted with T. gelatinosa.
Ultrastructural characterization of microalgae
Comparative analyses were performed based on the ultrastructure of pyrenoids, which allowed us to distinguish and compare algae isolated in culture (Figs 4A, 4C, 4E, 4G & 6A) with the respective lineages found in the symbiotic state (Figs 4B, 4D, 4F, 4H & 6B). Pyrenoid types were determined according to Friedl (Reference Friedl1989). The phycobionts of each lineage showed key structural features in common (Supplementary Material Figs S3–S7, available online).
TEM of Circinaria hispida phycobionts in symbiotic and cultured states. Comparative analyses between the phycobionts isolated in cultures and those observed in the symbiotic state within the thallus. A & B, T1; C & D, T2; E & F, T3; G & H, T4. Key to abbreviations: BT=black tubules; Chl=chloroplast; Pg=pyrenoglobuli; Py=pyrenoid; PyS=small pyrenoidal structures; WT=white tubules. Scales: A & B=600 nm; C=800 nm; D, G & H=1 µm; E & F=2 µm.
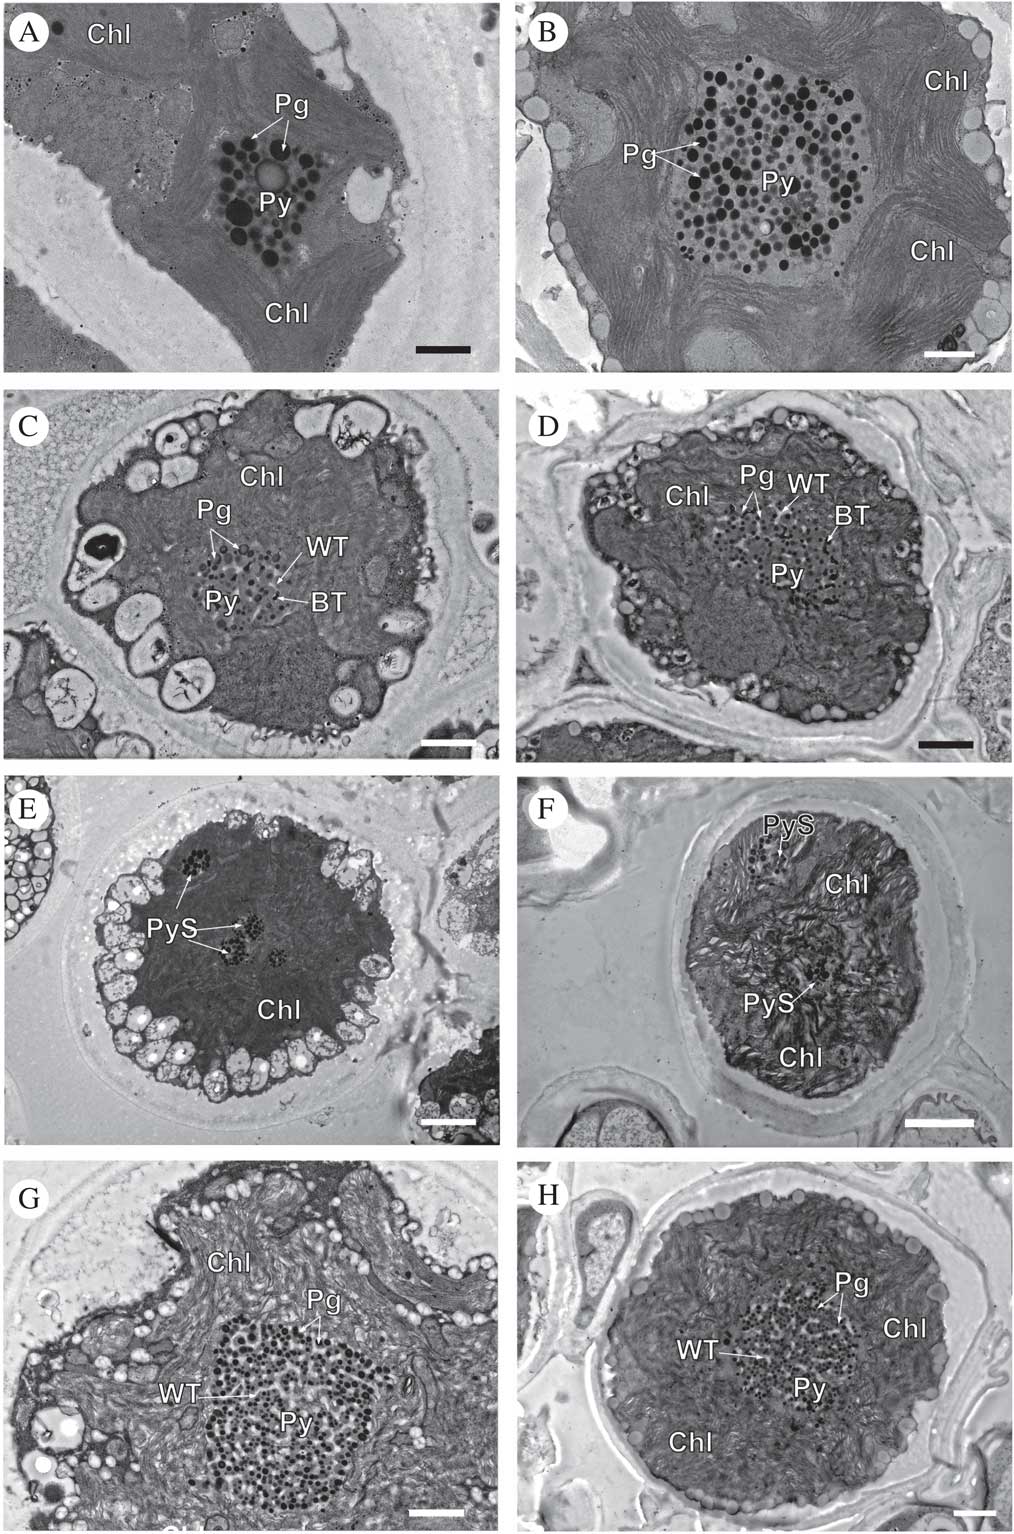
Cells of lineage T1, both in the symbiotic state and in culture (Fig. 4A & B, Supplementary Material Fig. S3), showed the same large single pyrenoid type (gigantea/impressa-type) with abundant and large pyrenoglobuli (130–150 nm, although in culture they may reach 300 nm). The pyrenoid was located in the centre of a single star-shaped, lobed chloroplast; the disposition of the thylakoid membranes was dense, with stackings of four or more straight membranes.
Cells of lineage T2, both in the symbiotic state and in culture (Fig. 4C & D, Supplementary Material Fig. S4), contained a central pyrenoid of the gigantea-type with some tubules of electron-dense content alternating with tubules of non-electron-dense content. The chloroplast was irregularly undulating in its outline with a dense arrangement of slightly sinuous thylakoid stacks.
Cells of lineage T3, both in the symbiotic state and in culture (Fig. 4E & F, Supplementary Material Fig. S5), presented a new type of pyrenoid formed by small pyrenoidal structures that were distributed in the periphery and the central zone of the chloroplast. The chloroplast was irregularly crenated in its outline.
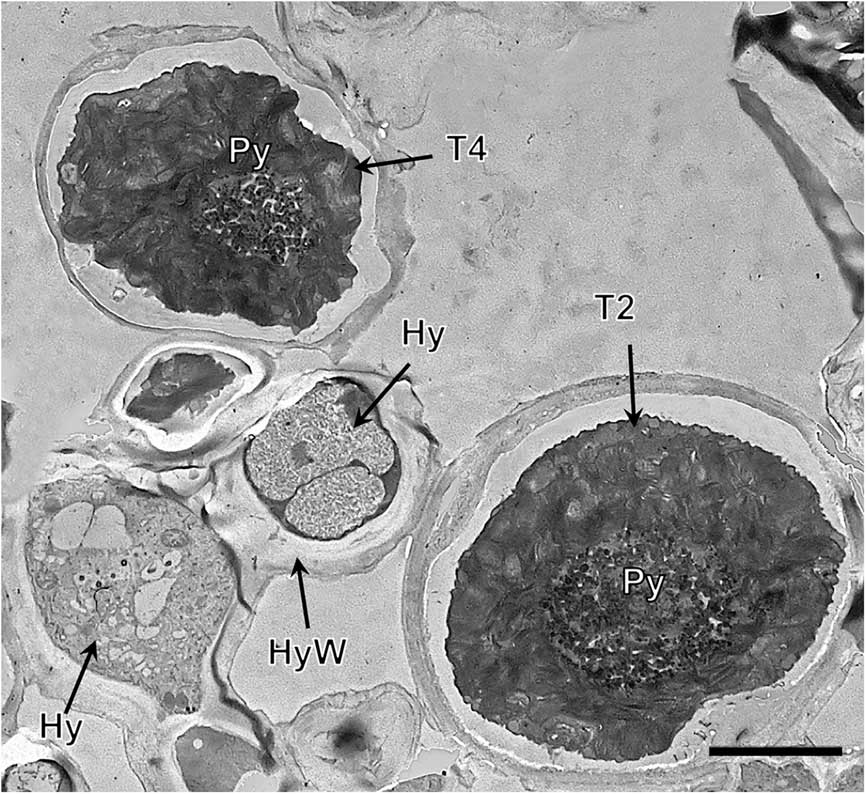
Lineage T4, both in the symbiotic state and in culture (Fig. 4G & H, Supplementary Material Fig. S6), had a large single gigantea-type pyrenoid within homogeneous pyrenoglobuli and abundant non-electron-dense tubules. The chloroplast had an outline that was either irregularly undulating or more deeply lobed with a loose arrangement of slightly sinuous thylakoid stacks. We detected the coexistence inside the thallus of at least two lineages (T3 and T4) (Fig. 5).
TEM of the Trebouxia phycobiont lineages T2 and T4 coexisting in Circinaria hispida. Key to abbreviations: Hy=hypha; T2=lineage T2; T4=lineage T4; Py=pyrenoid; PyS=small pyrenoidal structures. Scale=4 µm.
Flavoparmelia soredians lineage F1 (Fig. 6A & B, Supplementary Material Fig. S7), in the symbiotic state and in culture, showed a large, single gelatinosa-type pyrenoid with tubules traversing the matrix in a parallel arrangement. Numerous pyrenoglobuli were connected to these tubules. The alga showed a large, lobed, dense chloroplast. The thylakoid membranes were grouped in scattered but evident grana.
TEM comparing the Flavoparmelia soredians phycobiont in symbiotic and cultured states. A, isolated lineage F1; B, intrathalline lineage. Key to abbreviations: Chl=chloroplast; Hy=hyphae; Pg=pyrenoglobuli; Py=pyrenoid; T=tubules. Scales: A=1 µm; B=1·5 µm.

Discussion
Lichens represent micro-ecosystems suitable for the study of microorganism diversity in symbiotic associations. Traditional techniques could bias the results obtained by failing to identify the full microalgal diversity.
The identification of Circinaria hispida and Flavoparmelia soredians was confirmed (KU318628 and KU318573) by the DNA barcoding proposed by Schoch et al. (Reference Schoch, Seifert, Huhndorf, Robert, Spouge, Levesque and Chen2012). Molecular identification of lichenized fungi should not be overlooked in microalgal studies in order to avoid uploading Trebouxia sp. sequences to GenBank without any corresponding genetic information about their fungal partnerships (Catalá et al. Reference Catalá, del Campo, Barreno, García-Breijo, Reig-Armiñana and Casano2015; Moya et al. Reference Moya, Škaloud, Chiva, García-Breijo, Reig-Armiñana, Vancurová and Barreno2015).
Sanger results detected only a single phycobiont, which we define as the primary phycobiont (T4 and F1). A potential bias in previous analyses could have arisen by using eukaryotic-specific primers to amplify the nrITS DNA; such primers could only detect the primary microalga, while other phycobionts remained undetected. Electropherograms showing double peaks or polymorphic sequences have been reported in lichens but these samples were usually removed from these earlier analyses (Muggia et al. Reference Muggia, Pérez-Ortega, Kopun, Zellnig and Grube2014; Leavitt et al. Reference Leavitt, Kraichak, Nelsen, Altermann, Divakar, Alors, Esslinger, Crespo and Lumbsch2015; Voytsekhovich & Beck Reference Voytsekhovich and Beck2015). In such cases a cloning strategy should be performed to separate the different sequences obtained (Molins et al. Reference Molins, García-Breijo, Reig-Armiñana, del Campo, Casano and Barreno2013) although this strategy does not allow us to obtain the algal cultures needed for ecophysiological and biotechnological studies.
454-pyrosequencing results detected two OTUs in C. hispida, OTU1C and OTU2C (matched with T. cretacea/T4 and OTU A12/T3), and only one OTU in F. soredians, OTU1F (fitted with T. gelatinosa). The selected ITS1 and 5.8S fragments represent a variable region used to identify microalgae, and this is widely applied to discriminate Trebouxia species; however, 454-pyrosequencing using a GS Junior 454 system generated reads with intermediate lengths which limited the number of base pairs in the genetic marker that was amplified. To avoid the over-amplification of the primary phycobiont, and to detect possible OTUs present at intermediate abundances inside the thallus, it is necessary to determine, by a previous RT-PCR, the appropriate PCR cycle number that should be applied for the preparation of the products to be pyrosequenced. The pyrosequencing assay performed in this study was included on a plate that comprised a total of 82 molecular identifiers. Only 1645 and 1272 filtered reads were recovered for C. hispida and F. soredians, respectively. In both cases, probable sequence variants at middle and low frequencies were not uncovered.
The isolation procedure detected four Trebouxia lineages in C. hispida (T1–T4) and only one in F. soredians (F1). This phycobiont isolation method, based on the Percoll® gradient (Calatayud et al. Reference Calatayud, Guéra, Fos and Barreno2001; Gasulla et al. Reference Gasulla, Guéra and Barreno2010), provided a simple, effective and fast method for isolating and growing algal strains (no bacteria, hyphal fragments or spores were observed). This method can be successfully used not only for Trebouxia isolation but also for other coccoid green microalgae (such as Asterochloris, Myrmecia or Coccomyxa) from a broad range of lichens with diverse life forms. The procedure described in the present study is an improvement on previous methods because it is easier to separate and identify the potential algal diversity in a short period of time (2 days instead of 4–6 weeks) and it makes the molecular identification of microalgae in cultures affordable, something which is essential for physiological experiments.
A specific PCR primer confirmed the presence of the isolated Trebouxia lineages in the original DNA template (sample A). In foliose and vagrant lichens, such as F. soredians and C. hispida, respectively, the thallus parts selected as starting material might represent an important factor that influences the final results, and therefore this is a key parameter to be considered in the experimental design. Taking into account the differential localization of the phycobionts along the lacinias suggested by J. García, E. Barreno & J. F. Pertusa (unpublished data) in Ramalina farinacea, we decided to mix several parts of the thallus as starting material (samples A, B, C and D) for comparative analyses. Surprisingly, phycobiont isolation allowed us to detect more Trebouxia lineages in C. hispida than 454-pyrosequencing, but these results can be explained by 1) differential localization of the phycobionts inside the thallus and 2) low-coverage sequencing. Park et al. (Reference Park, Kim, Elvebakk, Kim, Jeong and Hong2015) detected only one to three OTUs (except in Cladonia borealis) when analyzing several Antarctic lichen species, probably also due to the low number of sequences recovered.
The same lichen thallus was used to perform different approaches to the analysis of intrathalline microalgal diversity (Sanger sequencing, specific primer PCRs, 454-pyrosequencing and isolation). These comparative analyses showed that the isolated Trebouxia were indeed hosted in the thalli but their differential detection was primarily dependent on the protocol used, suggesting that the method and the zone selected in the thallus may limit the detection of further associated algae due to methodological biases. Further studies, including the use of specimens from different populations, are needed to corroborate the coexistence and non-coexistence patterns found in the lichens selected for the present study.
In addition to molecular techniques, phycobiont intrathalline co-occurrence has been validated in different lichen species through ultrastructural examinations by TEM (Casano et al. Reference Casano, del Campo, García-Breijo, Reig-Armiñana, Gasulla, del Hoyo, Guéra and Barreno2011; Molins et al. Reference Molins, García-Breijo, Reig-Armiñana, del Campo, Casano and Barreno2013; Catalá et al. Reference Catalá, del Campo, Barreno, García-Breijo, Reig-Armiñana and Casano2015). The ability to correlate molecular and ultrastructural data, both in symbiotic and axenically isolated states, represents an improvement in clarifying and delimiting the taxonomic concepts in the genus Trebouxia. Although algae undergo a variety of modifications as a result of lichenization (Galun Reference Galun1988; Friedl & Büdel Reference Friedl and Büdel2008), ultrastructural traits of pyrenoids from cultured phycobionts have been traditionally used to characterize Trebouxia species (Friedl Reference Friedl1989) and some authors have highlighted the suitability of the pyrenoid structures for species delimitation by TEM (Ascaso & Galván Reference Ascaso and Galván1976; Ascaso et al. Reference Ascaso, Brown and Rapsch1986; Brown et al. Reference Brown, Ascaso and Rapsch1987; Catalá et al. Reference Catalá, del Campo, Barreno, García-Breijo, Reig-Armiñana and Casano2015).
In this study, the pyrenoid structures and pyrenoglobuli arrangement in the phycobionts that were observed in C. hispida and F. soredians (Figs 4–6, Supplementary Material Figs S3–S7) remained homogeneous enough within lichen thalli and in culture to allow for the correlation of both states. Few modifications were observed, probably due to the lichenization process (e.g. cell wall thickness and the quantity of mitochondria and ribosomes). To avoid modifications related to the conditions of the culture, we suggest standardizing to BBM media culture for physiological experiments and selecting samples on day 21 of cultivation in order to perform ultrastructural analyses, as proposed by Muggia et al. (2016 Reference Muggia, Leavitt and Barrenob ).
In the case of C. hispida, four Trebouxia lineages (T1–T4) were detected both inside the thallus and in isolated cultures (Fig. 4, Supplementary Material Fig. S3). T1 showed a pyrenoid that corresponded to the impressa/gigantea-type and T3 presented a new, easily distinguishable pyrenoid type. T2 and T4 demonstrated similar pyrenoid types, corresponding to the gigantea-type described by Friedl (Reference Friedl1989). Pyrenoid similarities between these lineages agreed with their phylogenetic closeness (Fig. 2). In this case, the stability of the chloroplast thylakoid arrangements was useful to differentiate both lineages. These results suggest that the thylakoid chloroplast arrangement is a key complement to the pyrenoid structure for Trebouxia species characterization.
In F. soredians, a single Trebouxia lineage was identified both in the thallus and in isolated culture (F1) (Fig. 6, Supplementary Material Fig. S7). This result matched with molecular data obtained by Sanger sequencing and 454-pyrosequencing.
In conclusion, to our knowledge this is the most comprehensive study to combine molecular and ultrastructural data for the detection of intrathalline Trebouxia lineages in a complementary approach. This multi-tool analysis performs well when the coexistence of several phycobionts inside a single thallus is predicted. Comparative ultrastructural analyses of phycobionts in the symbiotic state or isolated in culture could be performed because key taxonomic features remain invariable enough within lichen thalli and in culture, allowing the identification of each unique algal lineage and therefore the differentiation of co-occurring species. We are starting to shed light on questions that were previously unsolved (Catalá et al. Reference Catalá, del Campo, Barreno, García-Breijo, Reig-Armiñana and Casano2015) because of the failure to link ultrastructural and molecular results. Moreover, we are gaining a better understanding of how phycobiont diversity may play a role in the functioning and development of lichen thalli or in their ability to cope with changing environmental conditions. Over the last few years, the discovery that Trebouxia diversity is much higher than previously considered, highlights the need for a revision of the classification proposed by Friedl (Reference Friedl1989) so that all of this heterogeneity in Trebouxia is included. The combination of genetic markers together with ultrastructural techniques, both in culture and in the symbiotic state, should be standardized in lichen research to make taxonomic concepts more accurate and to delimit Trebouxia diversity (Muggia et al. 2016 Reference Muggia, Leavitt and Barrenob ).
Supported by the Ministerio de Economía y Competitividad (MINECO, Spain) (CGL2016-79158-P) and Excellence in Research (Generalitat Valenciana, Spain) (PROMETEOII/2013/021 and PROMETEO/2017/039). We wish to thank the technicians (Maria Teresa Mínguez and Nuria Cebrián) of the Servicio de Microscopía Electrónica, SCSIE and Jardí Botànic (Universitat de València) who helped us to perform the TEM process, and Santiago Català for the pyrosequencing analyses. Daniel Sheerin revised the English manuscript.
Supplementary Material
For supplementary material accompanying this paper visit https://doi.org/10.1017/S0024282917000664


