

Dyslipidaemia is a primary risk factor for CVD, peripheral vascular disease and stroke. The WHO estimates that over 60 % of CHD and 40 % of ischaemic stroke in developed countries are due to total blood cholesterol levels in excess of the theoretical minimum of 3·8 mmol/l( 1 ). Reduction of serum LDL-cholesterol by about 5–6 %( Reference Sirtori, Anderson and Arnoldi 2 ) has the potential to reduce CHD risk by 7–12 %( Reference Katan, Grundy and Jones 3 ), whereas a 3 % increase in HDL-cholesterol has the potential to lower the risk by 6–9 %( Reference Anderson and Konz 4 , Reference Ashen and Blumenthal 5 ). Fasting serum TAG elevations also increase the risk for CHD( Reference Ginsberg 6 ). The aggregate changes in these three lipoprotein risk factors can, therefore, potentially reduce CHD risk by 12–20 %( Reference Anderson and Bush 7 ). As a result, cholesterol is by far the most studied risk factor for CHD risk( Reference Sacks, Lichtenstein and Van Horn 8 ).
Although what constitutes an optimal dietary regimen remains a matter of controversy, current guidelines recommend diet as a first-line therapy for patients with elevated blood cholesterol concentrations( Reference Ferdowsian and Barnard 9 ). Among the foods being suggested to lower blood lipids are soya products. A meta-analysis published in 1995 concluded that soya protein intake is effective in reducing total cholesterol (TC), LDL-cholesterol and TAG and in increasing HDL-cholesterol( Reference Anderson, Johnstone and Cook-Newell 10 ). Following this, in October 1999, the US Food and Drug Administration approved labelling of foods containing soya protein as protective against CHD( 11 ); the American Heart Association released a similar advisory shortly thereafter( Reference Erdman 12 ). The UK Joint Health Claims Initiative also permitted that ‘the inclusion of at least 25 g of soya protein/ d as part of a diet low in saturated fat can help reduce blood cholesterol’. Similar claims were also made in South Africa, the Philippines, Brazil and Indonesia( Reference Xiao 13 ). All these presuppose that the hypolipidaemic effects of soya are due to its soya protein content. Soya products in addition, however, contain isoflavones, which have also been subjects of considerable scientific enquiry. Reports of trials investigating the effect of soya isoflavones on blood lipids have not been consistent( Reference Zhan and Ho 14 ).
Over a 100 randomised controlled trials (RCT) and ten meta-analyses have already been published, which have examined the effects of soya protein and/or isoflavones on lipids. Most of these studies report varying effects of soya proteins and/or soya isoflavones on blood cholesterol. Perhaps the only consensus on the subject is that consumption of soya products may have a more marked hypolipidaemic effect in hypercholesterolaemic individuals than in normocholesterolaemic subjects. Although the ten previously completed meta-analyses have reported beneficial effects of soya protein and/or isoflavone on serum lipids, this favourable effect is being challenged, and a reason may be because some recently completed trials do not report an effect of soya protein on serum lipids. In 2012, the European Food Safety Authority concluded that ‘a cause and effect relationship has not been established between the consumption of isolated soya protein and a reduction in blood LDL-cholesterol concentrations’( 15 ). The last published meta-analysis involved studies completed between 1996 and 2008, and examined mainly the effects of soya proteins on LDL-cholesterol( Reference Anderson and Bush 7 ).
In the past 6 years, nine additional clinical trials (involving twelve comparisons and 668 people) on the effects of soya products on lipids have been completed. Based on the availability of more recent high-quality trials, the objective of this review was to re-examine the conclusion that soya protein has proven beneficial effects on blood cholesterol. We also assessed the effects of isoflavones and the combined effect of soya protein and isoflavones on blood cholesterol levels. Specifically, we sought to answer the following question: Does habitual consumption of soya products have a beneficial effect on blood cholesterol level, and if it does what are the predictors of this effect?
Methods
Search strategy and study selection
On 3 March 2014, we searched MEDLINE (through February 2014), CENTRAL (The Cochrane Controlled Clinical Trials Register) and the ClinicalTrials.gov website to identify RCT examining the effect of soya products on blood lipid profile. For the MEDLINE search, we used MeSH (major subject heading) terms (‘soybeans’ OR ‘soybean oil’ OR ‘soybean proteins’ OR ‘soy isoflavones’ OR ‘soy milk’) AND (‘Cholesterol, HDL’ OR ‘Cholesterol, LDL’ OR ‘Triglycerides’). The search was limited to the criteria ‘clinical trials’, ‘English’, ‘human’ and ‘last 10 years’. We limited to the last 10 years because the last published meta-analyses on this subject was completed in 2008. CENTRAL and the ClinicalTrials.gov website were searched using ‘soy’ or ‘soybeans’ as free terms without further restrictions applied to the search. Inspection of the reference list of all identified articles was also conducted. The latter method was repeated until all potentially relevant articles from these sources were identified. Retrieved studies were included if they met the following criteria: (a) were investigating dietary soya products; (b) had a randomised controlled parallel-arm or cross-over design; (c) included subjects aged 18 years and above; (d) reported ‘end of intervention’ mean and standard deviation values of lipid measurements for the active (intervention) and control groups; and (e) provided the intake amount of soya products. We a priori determined that unpublished materials and conference abstracts will be excluded from the review. One-day trials were also excluded because we wanted to report the effects of habitual intake of soya products. Care was taken not to include data from multiple publications of the same population. Furthermore, we excluded studies in which soya intake was mixed with other dietary treatments.
In a sub-study, we searched MEDLINE (through March 2014), CENTRAL and the ClinicalTrials.gov website to identify RCT examining the effect of soya isoflavone supplementation on blood lipid profile. We used the MeSH terms (‘soy isoflavone’ OR ‘daidzein’ OR ‘genistein’ OR ‘glycitein’) AND (‘Cholesterol, HDL’ OR ‘Cholesterol, LDL’ OR ‘Triglycerides’). The search was limited to the criteria ‘clinical trials’, ‘English’ and ‘human’.
Data extraction and quality assessment
Data were extracted by the lead author and subsequently reviewed by one of the co-authors for accuracy. Extracted data included the study characteristics (first author’s name; year of publication; number and age of participants; study design; daily amount of soya product consumed in the active arm; duration of the study; health characteristics of the study population; and location of the study). We also extracted information on the final concentrations of plasma/serum TC, LDL-cholesterol, HDL-cholesterol and TAG in both treatment arms. When the requisite data were not available in the published paper, authors were emailed requesting the appropriate information. All the authors agreed on the eligibility criteria of the included studies. Quality of the studies was evaluated using the validated Jadad score instrument( Reference Jadad, Moore and Carroll 16 ) with criteria that included the following: randomisation, adequacy of sequence generation, double blinding and description of drop-outs. The maximum score obtainable was 5.
Data synthesis and statistical analysis
The effect size used in this investigation was the ‘difference in means’ between the two treatment groups. We utilised plasma/serum cholesterol concentrations obtained at the end of each intervention. Ideally, serum cholesterol concentrations are approximately 3 % higher than the corresponding plasma concentrations( 17 ), but because we were interested in mean differences within each study we analysed plasma and serum concentrations without adjustment for this difference. Studies that reported results in mmol/l were converted to mg/dl using the standard conversion factors (which was a division of the mmol/l value by 0·02586 for TC, LDL and HDL and by 0·01129 for TAG). Estimates of treatment effect on cholesterol in sub-groups defined according to study design features were also carried out. Additional analyses were performed according to the Cochrane Handbook for Systematic Reviews of Interventions ( Reference Higgins and Green 18 ). Heterogeneity across studies was assessed by the Cochran’s Q test, and P<0·10 was considered statistically significant for heterogeneity. The magnitude of heterogeneity was evaluated by the I 2 statistic (percentage of the variability in effect estimates that is due to heterogeneity rather than sampling error). Whenever the test for heterogeneity was statistically significant, the estimate of the difference was calculated using the random effects model, according to DerSimonian & Laird( Reference DerSimonian and Laird 19 ). For the computation of pooled effects, each study was assigned a weight consisting of the reciprocal of its variance. Furthermore, we performed a meta-regression to investigate whether there were any strong predictors of serum lipid changes. The included covariate variables were as follows: (1) initial lipid concentration; (2) duration of intake of soya products (weeks); (3) dose of soya protein consumed measured in grams per day; and (4) study quality (Jadad score). Each coefficient for the meta-regression analysis was estimated using restricted maximum likelihood and the corresponding variances were calculated using the ‘Knapp–Hartung’ variance estimator. Each meta-regression F test was conducted at the significance level of α=0·05, and all meta-regression analyses were performed using Stata/IC 13.1.
Data synthesis and other analyses were completed using Cochrane Collaboration Review Manager 5( 20 ) and Microsoft Office Excel 2010 package (Microsoft Corporation).
Results
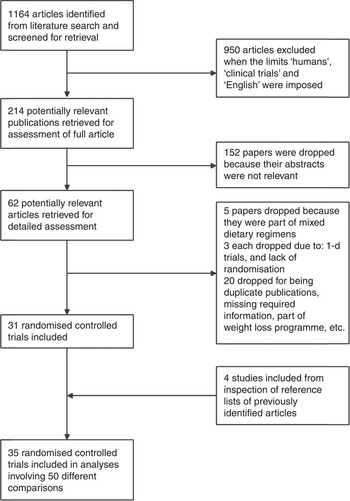
A total of sixty-two articles met our inclusion criteria and their complete texts were downloaded and fully reviewed. A flow chart depicting the selection process is depicted in Fig. 1. Two studies were excluded because there was an inappropriate control group( Reference Engelman, Alekel and Hanson 21 , Reference Ahn-Jarvis, Clinton and Riedl 22 ); three because they were 1-d trials( Reference Campbell, Brown and Dufner 23 – Reference Hanwell, Kay and Lampe 25 ); five exclusions were due to the administration of a mixed test regimen( Reference Matthan, Welty and Barrett 26 – Reference Rideout, Chan and Harding 30 ); and three studies were excluded due to lack of random assignment of the study groups( Reference Jenkins, Kendall and Nguyen 31 – Reference Lobato, Iakmiu Camargo Pereira and Lazaretti 33 ). Other studies were excluded for varying reasons (shown in Fig. 1). In all, thirty-five studies with fifty comparisons were included from our final analyses. Values used for the included studies represent the lipid measurements that correspond to the longest follow-up point. The observed I 2 statistic (percentage of the variability in effect estimates that is due to heterogeneity rather than sampling error) ranged from 92 to 99 %.
Study selection process.
In the sub-study examining the effect of soya isoflavone supplementation on blood lipids, our search produced thirty-two results, including four of the studies already included in our primary study. After exclusion of the twenty-one ineligible studies, we had eleven studies( Reference Hodgson, Puddey and Beilin 34 – Reference Qin, Shu and Zeng 44 ) with fifteen comparison groups.
Study and participant characteristics
The characteristics of the included studies are presented in Table 1. Duration of the studies ranged from 4 weeks to 1 year, with many lasting about 8 weeks. Most RCT were double-blind, described an adequate method of sequence generation and reported details of drop-outs and withdrawals. Overall, twenty-four of the thirty-five studies obtained a Jadad score of ≥3 (high quality).
Characteristics of the included studies

A total of 2670 subjects (aged 28–83 years and 82 % women) were included in the primary analyses. The average intake of soya protein was 30 g/d (range: 14–50 g/d).
Effects of soya on lipid concentration
Intake of soya products resulted in a significant reduction in serum LDL-cholesterol concentration, –4·83 (95 % CI –7·34, –2·31) mg/dl (Fig. 2). The effect quality test (Cochran’s Q) did show significant heterogeneity, and thus the random effects model was used. We also observed statistically significant reduction in serum TAG, –4·92 (95 % CI –7·79, –2·04) mg/dl (Fig. 3), and TC concentrations, –5·33 (95 % CI –8·35, –2·30) mg/dl (Fig. 4). There was also a modest, but highly significant increase in serum HDL-cholesterol concentration, 1·40 (95 % CI 0·58, 2·23) mg/dl (Fig. 5).
Meta-analysis of the effect of soya on LDL-cholesterol. The sizes of the data markers indicate the weight of each study in the analysis. IV, inverse variance. Random–random effects model. Values are in mg/dl.

Meta-analysis of the effect of soya on serum TAG. The sizes of the data markers indicate the weight of each study in the analysis. IV, inverse variance. Random–random effects model. Values are in mg/dl.

Meta-analysis of the effect of soya on total cholesterol. The sizes of the data markers indicate the weight of each study in the analysis. IV, inverse variance. Random–random effects model. Values are in mg/dl.

Meta-analysis of the effect of soya on HDL-cholesterol. The sizes of the data markers indicate the weight of each study in the analysis. IV, inverse variance. Random–random effects model. Values are in mg/dl.

For the sub-study in which only isoflavone supplementation was administered as the test regimen, all the results (LDL, HDL, TAG and TC) were non-significant.
Sub-group analyses
LDL reductions also appeared to be more marked in hypercholesterolaemic patients, –7·47 (95 % CI –11·79, –3·16) mg/dl, than in healthy subjects, –2·96 (95 % CI –5·28, –0·65) mg/dl. When natural soya products (soya milk, whole soyabeans and soya nuts) were used as the test regimen, we observed a substantial reduction in serum LDL levels, –11·06 (95 % CI –15·74, –6·37) mg/dl, as opposed to when ‘processed’ soya (soya extracts, supplements), –3·17 (95 % CI –5·75, –0·58) mg/dl, was used. Intervention with soya protein alone seemed to exert a more positive effect on LDL and TC levels than intervention combining soya protein and isoflavone (Table 2). Studies adjudged to be of higher quality provided more precise estimates. Details of further analyses in sub-groups of studies defined by these study/participant characteristics are shown in Table 2. Sensitivity analyses conducted by excluding studies that used no control group( Reference Bakhtiary, Yassin and Hanachi 45 ), used soya spread as the test diet( Reference Clifton, Mano and Duchateau 46 ) or that did not have any washout period( Reference Meyer, Larkin and Owen 47 ) did not affect the results.
Effects of soya proteins on serum lipids by study design, duration, location, health status and quality of study (Mean differences and 95 % confidence intervals)

* Significant results.
Isoflavone sub-study
The results of the sub-study that focused on the effect of isoflavone supplementation on LDL, HDL, TAG and TC were non-significant (Table 3). Sub-group analyses was also completed for each of these indices using design (cross-over v. parallel-arm), duration (≤12 v. >12 weeks) and health status (Table 3).
Effects of soya isoflavone on serum lipids (Mean differences and 95 % confidence intervals)

* Significant results.
Predictors of the effect of soya on blood lipids
The meta-regression analysis suggested that initial serum LDL, TAG and TC concentrations are strong predictors of the effect of soya on serum LDL, TAG and TC concentrations, respectively (Table 4; Fig. 6–8). Initial HDL concentration did not predict the effect of soya on blood HDL levels. Dose of soya protein, the duration of its consumption and the study quality (Jadad score) also did not predict the effect of soya on blood lipid levels (Table 4).
Meta-regression plot of the effect of initial LDL concentration on soya’s effect on LDL-cholesterol. Values are in mg/dl.

Meta-regression plot of the effect of initial TAG concentration on soya’s effect on blood TAG level. Values are in mg/dl.

Meta-regression plot of the effect of initial total concentration (TC) concentration on soya’s effect on blood TC level. Values are in mg/dl.

Meta-regression – predictors of the effects of soya on serum lipids (Coefficients and their standard errors)
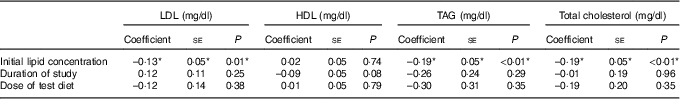
*Significant results.
Discussion
Based on baseline lipid concentrations in the study population, our results show a significant 3 % reduction in serum LDL, 4 % reduction in serum TAG and a 2 % reduction in TC concentrations after an intervention with soya products for a period ranging from 4 to 52 weeks. We also observed a significant 3 % increase in serum HDL concentrations. This beneficial effect seemed stronger in individuals with a higher risk of CHD (hypercholesterolaemic, obese and diabetic subjects). It also appears that consumption of natural soya products is more effective in lowering serum cholesterol than intake of processed soya (e.g. soya protein extract preparations or supplements). LDL reduction was significant in the shorter-duration studies (4–8 weeks), whereas TAG reduction was only significant in the longer-lasting studies (10–52 weeks). Isoflavone supplementation only (i.e. without soya proteins) did not appear to significantly influence the serum lipid profile.
Various mechanisms have been suggested by which soya proteins may exert their lipid-lowering effects. Some have proposed the activation of LDL receptors by essential amino acids from soya protein( Reference Gianazza, Lovati and Manzoni 48 ); others have discussed the possibility of a soya protein-based inhibition of endogenous cholesterol synthesis( Reference Tham, Gardner and Haskell 49 ). Water-soluble fibre and other components of soya may also reduce serum lipid levels( Reference Erdman 12 ). Finally, it has been hypothesised that the substitution of soya for animal protein can result in lower saturated fat and cholesterol intakes, thereby indirectly resulting in a more favourable blood cholesterol levels( Reference Lichtenstein 50 ).
As casein has been reported to raise cholesterol levels, the relative increase in cholesterol concentration in the control group may be attributable to the casein content of the milk protein diet fed to the controls; however, when our analysis was restricted to the twenty-two comparisons where non-milk/non-casein-based diets were used as the control diet, the beneficial effect of the soya intervention on serum lipid was even more profound. Change in serum concentration was –6·37 (95 % CI –10·52, –2·22) mg/dl, –9·39 (95 % CI –12·88, –5·90) mg/dl and –9·69 (95 % CI –13·35, –6·04) mg/dl for LDL, TAG and TC, respectively.
Previous meta-analyses have reported on the hypolipidaemic effects of soya proteins( Reference Anderson and Bush 7 , Reference Reynolds, Chin and Lees 51 , Reference Harland and Haffner 52 ), soya isoflavones( Reference Taku, Umegaki and Sato 53 ) and soya proteins in combination with soya isoflavones( Reference Zhan and Ho 14 ). Our results are consistent with analyses that report the cholesterol-lowering effects of soya protein. We, however, observed no effect of soya isoflavones on serum cholesterol levels and a reduced LDL-lowering effect in studies that administered soya proteins in combination with isoflavones (compared with studies that administered soya proteins alone). Soya protein plus isoflavone test diets, however, had a more positive effect on serum TAG concentrations.
Mean daily intake of soya protein is about 30 g in Japan, 20 g in Korea, 8 g in China and <1 g in the USA( Reference Ho, Woo and Leung 54 , Reference Nagata 55 ). The mean daily intake by participants in our analyses was 29·8 g (range: 14–50 g). This potentially means that the cholesterol-reducing effects of soya protein may not be realised by most soya consumers. It is important to note, however, that a dose–response effect of soya protein on cholesterol reduction was not observed in our analyses and is yet to be established.
As soyabeans are grown around the world under many different climatic conditions, there is a wide range of soyabean varieties. Unlike in Europe, GM soyabeans have become the predominant type grown in the Americas. When our results were stratified by study location, the studies completed in Europe, Asia and Australia showed highly significant positive effects. Conversely, the studies completed in North/South America (where >85 % of soyabean produced is GM) showed non-significant results, except for a mild elevation of serum HDL.
In an earlier study, we observed varying effects of flavanols on serum lipids, depending on the matrix with which the flavanols were administered( Reference Tokede, Gaziano and Djoussé 56 ). Consequently, in this analysis, we compared studies that used natural soya products (roasted soyabeans, soya nuts, etc.) with those that used soya extracts or tablets as the test regimen (Table 2). The LDL-cholesterol-lowering effect appeared to be three times stronger when natural soya products were used. A potential explanation may be the differing levels of bioavailability of the active ingredients.
Soya isoflavones have a biological similarity to mammalian oestrogens, which have been shown to exert cholesterol-lowering effects in humans( Reference Rossouw 57 ). Our soya isoflavone sub-study revealed no effects of isoflavone supplementation on serum lipids. In their meta-analysis, Weggemans & Trautwein( Reference Weggemans and Trautwein 58 ) also reported a lack of efficacy of soya isoflavones on changes in LDL or HDL-cholesterol. In contrast, another study has reported positive effects of isoflavone supplementation on cholesterol and endothelial function( Reference Colacurci, Chiantera and Fornaro 39 ). The varying conclusions on the effect of isoflavones may be in part due to the process by which the isoflavones were extracted( Reference Clarkson and Anthony 59 ). Mean isoflavone consumption is 11–47 mg/d in Asian countries and 1–2 mg/d in Western countries( Reference Arai, Watanabe and Kimira 60 , Reference de Kleijn, van der Schouw and Wilson 61 ), but the mean daily isoflavone consumption in the included studies was 76 mg.
Although we observed a high level of heterogeneity, we are still confident in the conclusions of these analyses, as our observations are consistent with many of the other previously published reports.
In conclusion, our findings showed that an intervention with soya proteins increases serum HDL concentration and lowers serum TAG, LDL and TC concentrations. No effect of isoflavones was observed on serum lipids, and natural soya products appear to have a stronger hypolipidaemic effect on serum cholesterol than soya supplements. Finally, initial LDL, TAG and TC concentrations seem to be strong predictors of the effect of soya on blood lipid levels.
Acknowledgements
During the last 3 years, O. A. T. reports that he has received an investigator-initiated grant from the National Institutes of Health; L. D. reports that he has received investigator-initiated grants from the National Institutes of Health, GlaxoSmithKline, Amarin Pharma Inc., California Walnut Commission and Merck, and has received travel re-imbursement from the International Nut & Dried Fruit Council Inc.; J. M. G. reports that he has received investigator-initiated grants from the National Institutes of Health, the Veterans Administration, Amgen and pills and packaging from Pfizer for a research study, and has served as a consultant to Bayer.
L. D. and O. A. T. conceived the study and are responsible for data integrity and accuracy of data analyses. O. A. T. and T. A. O. drafted the manuscript, and along with L. D. have the primary responsibility for final content. O. A. T., A. Y. and T. A. O. completed the statistical analyses; J. M. G. reviewed the manuscript for its scientific content. All the authors have read and approved this final draft.
The authors have no conflict of interest to declare.


