


Introduction
While female life expectancy is higher than that of their male counterparts in the developed countries, this was not the case in developing countries such as India and China during most of the last century. A systemic bias against females in both the family and society at large, such as female infanticide and higher levels of adult female mortality, resulted in lower levels of female life expectancy (Das Gupta and Mari Bhat, Reference Das Gupta and Mari Bhat1997; Meara et al., Reference Meara, Richards and Cutler2008). However, in the past few decades, female life expectancy in a number of developing countries has increased and surpassed male life expectancy (Saikia et al., Reference Saikia, Jasilionis, Ram and Shkolnikov2011; Le et al., Reference Le, Ren, Shen, Li and Zhang2015). India and China saw a rapid increase in female life expectancies and a widening of gender differences in life expectancies at higher ages in favour of females. For instance, the difference between female and male life expectancies at age 60 in India was only 0.7 years in 1950–1955. This difference had increased to 1.5 years by 2010–2015. Similarly, life expectancy at age 60 was higher by 1.8 years for Chinese females in 1950–1955 and this difference increased to 2.3 in 2010–2015 (United Nations, 2015).
Such improvements in female life expectancy in India and China could lead one to conclude that the relative gender gap in health in these countries is swiftly decreasing. However, making such conclusions based solely on improvements in life expectancy may not capture the gender differences in health. Improvements in life expectancy do not necessarily mean improvements in other aspects of health (Kassebaum et al., Reference Kassebaum, Arora, Barber, Bhutta, Brown, Carter and Coggeshall2016). With an increase in life expectancy, morbidity and disability may decline and get compressed into a shorter duration of life or, alternatively, they may increase and expand to occupy a longer period of life (Omran, Reference Omran1971, Reference Omran2005; Olshansky et al., Reference Olshansky, Rudberg, Cassel, Carnes and Brody1991). Developing countries such as India and China are experiencing a rapid demographic transition along with nutritional as well as economic transitions. Consequently, their morbidity and disability patterns vary substantially across the lifecourse (Jagger, Reference Jagger, Yi, Crimmins, Carrière and Robine2006; George et al., Reference George, Balachandran, Omkar Nadh and Apurva2018). Hence, in situations where there is an expansion of morbidity, increased life expectancy could lead to widening inequalities in health if all groups are not able to benefit equally from reductions in morbidity and mortality at later ages. In particular, functional and intellectual disability-free life expectancy is considerably lower than actual life expectancy in both India and China (He et al., Reference He, Muenchrath and Kowal2012). The absence of good functional and intellectual abilities severely impairs health and wellbeing among older adults, even when they have a higher life expectancy (Hay et al., Reference Hay, Abajobir, Abate, Abbafati, Abbas, Abd-Allah and Abera2017). Poorer functional and intellectual abilities not only lead to a greater burden of ill-health, but also result in lower levels of wellbeing among the older population (Engelhardt et al., Reference Engelhardt, Buber, Skirbekk and Prskawetz2010; Skirbekk and James, Reference Skirbekk and James2014). Hence, a narrow focus just on gender differences in life expectancy does not tell us the whole story about gender inequalities in health in later life in these countries. Studies have shown that the female disadvantage in health is not same across different dimensions of health and that this pattern differs between India and China (Santosa et al., Reference Santosa, Schröders, Vaezghasemi and Ng2016; Wheaton and Crimmins, Reference Wheaton and Crimmins2016). For instance, although female disadvantage exists in both physical and cognitive health in India and China, the gender gap is higher in cognitive health compared to physical health; and the gap is higher in India than in China. Moreover, the gender gap in different dimensions of health varies across regions within these countries (Santosa et al., Reference Santosa, Schröders, Vaezghasemi and Ng2016; Singh et al., Reference Singh, Jasilionis and Oksuzyan2018; Oksuzyan et al., Reference Oksuzyan, Singh, Christensen and Jasilionis2018). Thus, a comprehensive understanding of the gender gap in health among older adults in India and China requires a multi-dimensional perspective of health that captures physical and intellectual abilities, rather than a uni-dimensional approach which tends to focus on differences in life expectancy alone.
While a systematic disadvantage in multiple dimensions of health among older women in India and China is recognised, the current indicators used to understand this have a number of drawbacks: (a) these measures abstractly consider the population above an abstract cut-off age, such as 60 or 65, that is traditionally used to define the older population. Thus, these measures assume that there is no change in characteristics of the population above this age threshold either over time or across countries; (b) existing multi-dimensional measures are not sensitive to cultural differences across countries and generalise the constituents of ideal wellbeing in later life. Most of the existing multi-dimensional measures have their origin in the developed countries and assume that the constituents of wellbeing for older people can be directly translated on to older people living in developing countries, such as India and China, as well. This may not be necessarily true. For instance, the Active Ageing Index (UNECE/European Commission, 2015), the Global Age Watch Index (HelpAge, 2015) and the Index of Well-being in the Older Population (Kaneda et al., Reference Kaneda, Lee and Pollard2011) are, among others, examples of multi-dimensional indicators that have been recently developed. All of these measures have their origins in the developed world, and aim at capturing the differences in health, capabilities and market participation among the older population in different countries around the world. A chief feature of all these indices is that they consider a higher level of labour force participation among the population above a certain age threshold, such as 60 or 65, as an important component of wellbeing in later life. However, these multi-dimensional measures are not directly applicable to developing countries where staying longer in the labour market may not be an ideal situation for the wellbeing for older people (Singh and Das, Reference Singh and Das2015). With regard to India and China, continued participation in the labour market in later life is generally the result of (economic) compulsion rather than individual choice (Pang et al., Reference Pang, De Brauw and Rozelle2004; Singh and Das, Reference Singh and Das2015). Hence, the existing multi-dimensional indicators wrongly assume that the ideals related to wellbeing in later life do not differ across cultures and between the developed and the developing countries.
Of particular relevance for this study is the ‘prospective age approach’ (Sanderson and Scherbov, Reference Sanderson and Scherbov2005; Scherbov and Sanderson, Reference Scherbov and Sanderson2016). However, this has similar drawbacks. This is a measure of ageing based on remaining life expectancy rather than time from birth. As such, it assumes that people with the same prospective age have the same remaining life expectancy The ‘prospective age’ approach was based on the assumption that capturing changes in life expectancy represents the multiple changes in the health and wellbeing of older people. It proposed measuring population ageing using an old-age threshold with a remaining life expectancy of 15 years. Hence, if average life expectancy was 65 in country A then a person would be considered to be an older person at age 50, e.g. 15 years before the end of life. However, if average life expectancy was 75 in country B then a person in that country would be considered an older person at age 60. While the measure was successful in capturing the improvements in life expectancy across populations, it has limitations: (a) it wrongly assumes that the changes in life expectancy capture the changes in multiple dimensions of health and (b) it is based on the conditions in developed countries of the world. Setting the old-age threshold with a remaining life expectancy of 15 years was based on the experience of Europe, where the remaining life expectancy at age 65 in 1980 was indeed 15 years (Balachandran et al., Reference Balachandran, de Beer, James, van Wissen and Janssenin press). From this we can see that the existing measures of population ageing that try to capture multi-dimensional changes among older adults are either based on an abstract definition of old age as the population above age 60 or 65, or are based on the ideals from the developed world on what constitutes wellbeing, or sometimes both. These existing multi-dimensional measures are not appropriate for the cross-country comparison, especially when the developing countries are involved.
Balachandran and James (Reference Balachandran and James2019) have proposed a novel multi-dimensional methodology to identify parity of ages across populations after accounting for different dimensions of health or other aspects of wellbeing in the population. This measure also takes a ‘progressive’ approach to measuring ageing, as proposed by Sanderson and Scherbov (Reference Sanderson and Scherbov2005, Reference Sanderson and Scherbov2013). But it represents an improvement over the existing applications (Sanderson et al., Reference Sanderson, Scherbov, Weber and Bordone2016; Balachandran et al., Reference Balachandran, De Beer, James, Van Wissen and Janssen2017, Reference Balachandran, de Beer, James, van Wissen and Janssenin press) as it is sensitive to the conditions in developing countries. The methodology generates a multi-dimensional old-age threshold (MOAT). This is the value of the old-age threshold that is obtained after accounting for changes in the different dimensions of health and wellbeing of a population. Hence, if the MOAT of a particular population, population A, is 60, and the MOAT of another population B is 65, it means that being age 65 in population B is same as being age 60 if the differences in the multiple dimensions related to health and wellbeing are accounted for. Hence, while the methodology accommodates multiple dimensions of health and wellbeing among older adults, it does not assume the population above an abstract threshold age such as 60 or 65 is ‘elderly’.
In this paper, we make use of the MOAT technique (Balachandran and James, Reference Balachandran and James2019) to explore the gender gap in health in India and China from a multi-dimensional perspective. In this way, this paper presents an innovative application of the MOAT technique for understanding the multi-dimensionality of the gender gap in health in later life that is pertinent in these Asian countries. Moreover, given the regional heterogeneity within both India and China, it is crucial that we understand the extent of gender differences in health at the provincial levels not simply at the national level. To do this we apply the MOAT technique to analyse the multi-dimensional gender gap of major provinces in India and China.
Data and methods
Selection of variables
As mentioned above, there are multi-dimensional gender differentials in health among the older population in India and China. A change in general health alone cannot capture the multi-dimensionality in health, given that there are gender differences in physical and intellectual abilities. In order to capture these varied dimensions, it is necessary to choose variables to represent the different dimensions of health. While making this choice, we need to ensure that these variables are appropriate to the context of the population and the region that is being studied.
To represent the different dimensions of health, we used a combination of three variables: (a) one representing general health, (b) one capturing functional abilities, and (c) a third capturing intellectual abilities. We used self-rated health to capture the general health of the different populations considered. Self-rated health has been identified as a good proxy for actual health status and found to be correlated with mortality and morbidity patterns (Jylhä, Reference Jylhä2009; Miilunpalo et al., Reference Miilunpalo, Vuori, Oja, Pasanen and Urponen1997). In addition, it is commonly used to measure health in developing countries such as India and China, and hence the data for this variable are readily available for gender and at the provincial levels. To understand age-specific levels of self-rated health at a population level, we used the percentage of the population with good or very good self-rated health (coded 1).
In order to capture functional capabilities of the populations considered, we used the percentage of the population which has problems performing activities of daily living (ADL). This variable is particularly useful in countries like India and China where the prevalence of functional disabilities is generally high (Yi et al., Reference Yi, Vaupel, Zhenyu, Chunyuan and Yuzhi2002; Dsouza et al., Reference Dsouza, Rajashekar, Dsouza and Kumar2014). Moreover, self-rated health may not completely represent functional abilities (Tsuji et al., Reference Tsuji, Minami, Keyl, Hisamichi, Asano, Sato and Shinoda1994). In developing countries, functional abilities among older people may indicate other vulnerabilities associated with ageing, such as higher levels of admission to retirement homes and low levels of health-care utilisation (Chatterji et al., Reference Chatterji, Kowal, Mathers, Naidoo, Verdes, Smith and Suzman2008; Bloom and Eggleston, Reference Bloom and Eggleston2014; Picco et al., Reference Picco, Achilla, Abdin, Chong, Vaingankar, McCrone, Chua, Heng, Magadi, Ng and Prince2016). For these reasons, we used ADL to reflect the functional health of the older population in these countries. In order to capture the level of difficulty with performing ADL, we measured an individual's ability to perform six activities: walking, eating, bathing or showering, using the toilet, dressing, and getting in and out of the bed. If an individual has difficulty in any one of these activities they are identified as having functional limitation (coded 0), or else not (coded 1).
To capture intellectual abilities, we measured the level of cognition among the population. A widely used measure of cognitive ability is the number of words recalled out of ten words from a pre-set list (Skirbekk et al., Reference Skirbekk, Loichinger and Weber2012; Weber et al., Reference Weber, Dekhtyar and Herlitz2017). A higher number of words recalled indicates better levels of cognition. Cognitive ability has been increasingly recognised as a more dynamic measure of intellectual ability for use with older populations than traditional variables such as years of schooling which tend not change over the lifecourse after a certain level of attainment earlier in life (Skirbekk et al., Reference Skirbekk, Loichinger and Weber2012; Weber et al., Reference Weber, Dekhtyar and Herlitz2017). Hence, although the level of cognitive ability tends to be correlated with the levels of education, it is sensitive to changes over the lifecourse. This is particularly important in the context of countries such as India and China because there were very few educational opportunities and infrastructure in these countries prior to the 1960s, due to historical reasons such as the struggle for independence and subsequent lags in development. As a result of this, the present older population in these countries spent their childhood and youth with comparatively fewer educational opportunities. However, as these countries grew economically and socially over time, there were subsequent improvements among these populations over the lifecourse.
Data source
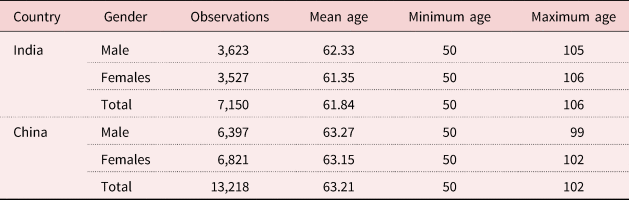
We use the data for India and China from the WHO Study on Global AGEing and Adult Health (WHO-SAGE), Wave 1 (2007–2010) (Kowal et al., Reference Kowal, Chatterji, Naidoo, Biritwum, Fan, Ridaura and Boerman2012) for our analysis. The data are nationally representative data of the population aged 50 and over in these countries. An overview of the data-set is given in Table 1.
Summary of the representative data-set, by country and gender
Methodology
We use the methodology provided by Balachandran and James (Reference Balachandran and James2019) to capture the multiple dimensions of health in later life. Their approach is an extension of the characteristics approach by Sanderson and Scherbov (Reference Sanderson and Scherbov2013; Scherbov and Sanderson, Reference Scherbov and Sanderson2016), which stipulates an old-age threshold across populations based on differentials in any dimension of health over the lifecourse. However, Balachandran and James (Reference Balachandran and James2019) have improved the characteristics approach by using a multi-dimensional framework. We make use of this multi-dimensional framework to understand the gender gap in health in India and China. This is the first attempt to use such a multi-dimensional framework to understand the gender gap in health in later life in developing countries. Their approach stipulates an old-age threshold for a population that accommodates multiple dimensions of health. The resultant old-age threshold is called the MOAT. The higher the value of the MOAT, the better the achievements of the particular population in terms of different dimensions of health. The methodology for producing the MOAT consists of four steps.
Step 1: Selection of the standard population
To produce the values of the MOAT, first, a standard population is chosen in order to compare the different dimensions against the standard population. A standard population is a hypothetically formulated population based on the age-specific values for each of the three dimensions of the different populations considered in the analysis. The age-specific value of the standard population is obtained by averaging the highest and lowest values for the corresponding age among the different populations considered. In choosing such an age-specific value for the standard population, it is ensured that the standard population chosen is comparable for the different populations considered. Mathematically, this can be expressed as follows:
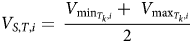 $$V_{S\comma T\comma i} = \;\displaystyle{{V_{{\rm min}_{T_k\comma i}} + \;V_{{\rm max}_{T_k\comma i}} } \over 2}$$
where  $V_{{\rm min}_{T_k\comma i}} $ refers to the value of the standard population S of the dimension $T_k$ at age i. k can take a value between 1 and 3, as three dimensions: self-rated health, cognition or abilities with ADL. $\;V_{{\rm max}_{T_k\comma i}} $ is the minimum value of dimension $T_k$ at age i across the populations considered and $V_{{\rm max}_{T_k\comma i}} $ is the maximum value of the dimension $T_k$ at age i across the populations. Since our interest is in analysing the gender gap in India and China, there are essentially four different populations under the purview of our analysis. These are the male and female populations in each of the two countries.
Hence, the value of self-rated health at different ages is the average of the highest and lowest values among the male and female populations in India and China. Similarly, the age-specific value for cognition is based on the average of the highest and lowest age-specific number of words recalled across the different populations. Likewise, the standard population of the dimension of abilities with ADL is obtained.
Step 2: Selection of frontier value in each dimension
After formulating the standard population for each dimension considered, we obtain a ‘frontier value’ from the standard population. In the process of obtaining the frontier value, we set a lower and upper bound for the standard population, due to empirical reasons. Since the data we use are representative of the population above age 50, we use age 50 as the lower bound for the standard population. Although there is no upper age limit in the data-sets, an empirical investigation indicates that the comparable samples across the populations considered are much reduced above the age of 85. Hence, we use age 85 as the upper bound of the standard population. In order to smooth the fluctuations occurring in the data, we categorise the data into seven age groups of five-year intervals. We then obtain the frontier value in each dimension from the standard population by averaging the values across the seven age groups between the ages of 50 and 85. Mathematically, this can be expressed as follows:
 $$OV_{T_k} = \;\mathop \sum \limits_{i = 50}^{85} \displaystyle{{V_{S\comma T_k\comma I}} \over N}$$
where  $OV_T$ is the frontier value using the dimension $T_k$; $V_{S\comma T_k\comma I}$ refers to the value of the standard population S of the dimension $T_k$ at age group I. N is the number of age groups. Since, there are seven age groups in our analysis, the value of N is 7.
Step 3: Identification of the old-age threshold across countries
Once the frontier values for different dimensions are estimated, the next step is to identify each of the dimensions for the different populations under consideration. The old-age threshold is the age at which a population reaches the frontier value. For instance, if the frontier value of the dimension of cognition is four words and the male population in China reaches this value at age 55, then age 55 is considered to be the old-age threshold for that particular dimension. In case the population continues to be at the same level of cognition at age 55, or if it returns back to the same level of cognition at age 55, then age 55 is considered to be the old-age threshold for the population. Mathematically, it can be expressed as follows:
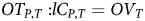 $$OT_{P\comma T}\;\colon lC_{P\comma T} = OV_T$$
where  $OT_{P\comma T}$ refers to the old-age threshold of the population P with regards to dimension T. This value is given by the last chronological age of the population P at which the value the dimension T (given by $lC_P\rpar $ is the same as the frontier value of dimension T (given by $OV_T\rpar $. Since we have five-year age groups in the analysis, a linear interpolation technique is used to find the exact old-age threshold.
Step 4: Combining different dimensions
After identifying the different old-age thresholds based on the different dimensions for each population, the different old-age thresholds need to be combined to attain the multi-dimensional measure called the MOAT. We combine the different dimensions by averaging the values of the old-age thresholds using the different variables of self-rated health, cognition and ADL. Such an averaging is in line with many other multi-dimensional measures such as the Human Development Index (HDI). The resultant average old-age threshold is a multi-dimensional one that accommodates for the changes in different dimensions of health. This averaged old-age threshold is called the MOAT. Mathematically it can be expressed as follows:
 $$MOAT_P = \;\mathop \sum \limits_{T = 1}^3 \displaystyle{{OT_{P\comma T}} \over 3}$$
where  $MOAT_P$ refers to the MOAT of country C. It is given by the average of old-age threshold across characteristic T for the population P (given by $OT_{P\comma T}\rpar $.
Results
We computed the age-specific values of self-rated health, cognition and percentage of population with abilities to perform ADL for the four populations: (a) male population in India, (b) female population in India, (c) male population in China, and (d) female population in China. We also found the age-specific values of the standard population in different dimensions. The results of these computations are plotted in Figure 1.
(a) Percentage of the population with good self-rated health (SRH) across different age groups for the selected populations, 2010. (b) Age-specific values of mean number of words recalled in selected populations, 2010. (c) Percentage of the population able to perform activities of daily living (ADL) in different age groups among selected populations, 2010.
Source: Authors’ calculation based on WHO-SAGE (WHO Study on Global AGEing and Adult Health), Wave 1, 2007–2010 (Kowal et al., Reference Kowal, Chatterji, Naidoo, Biritwum, Fan, Ridaura and Boerman2012).
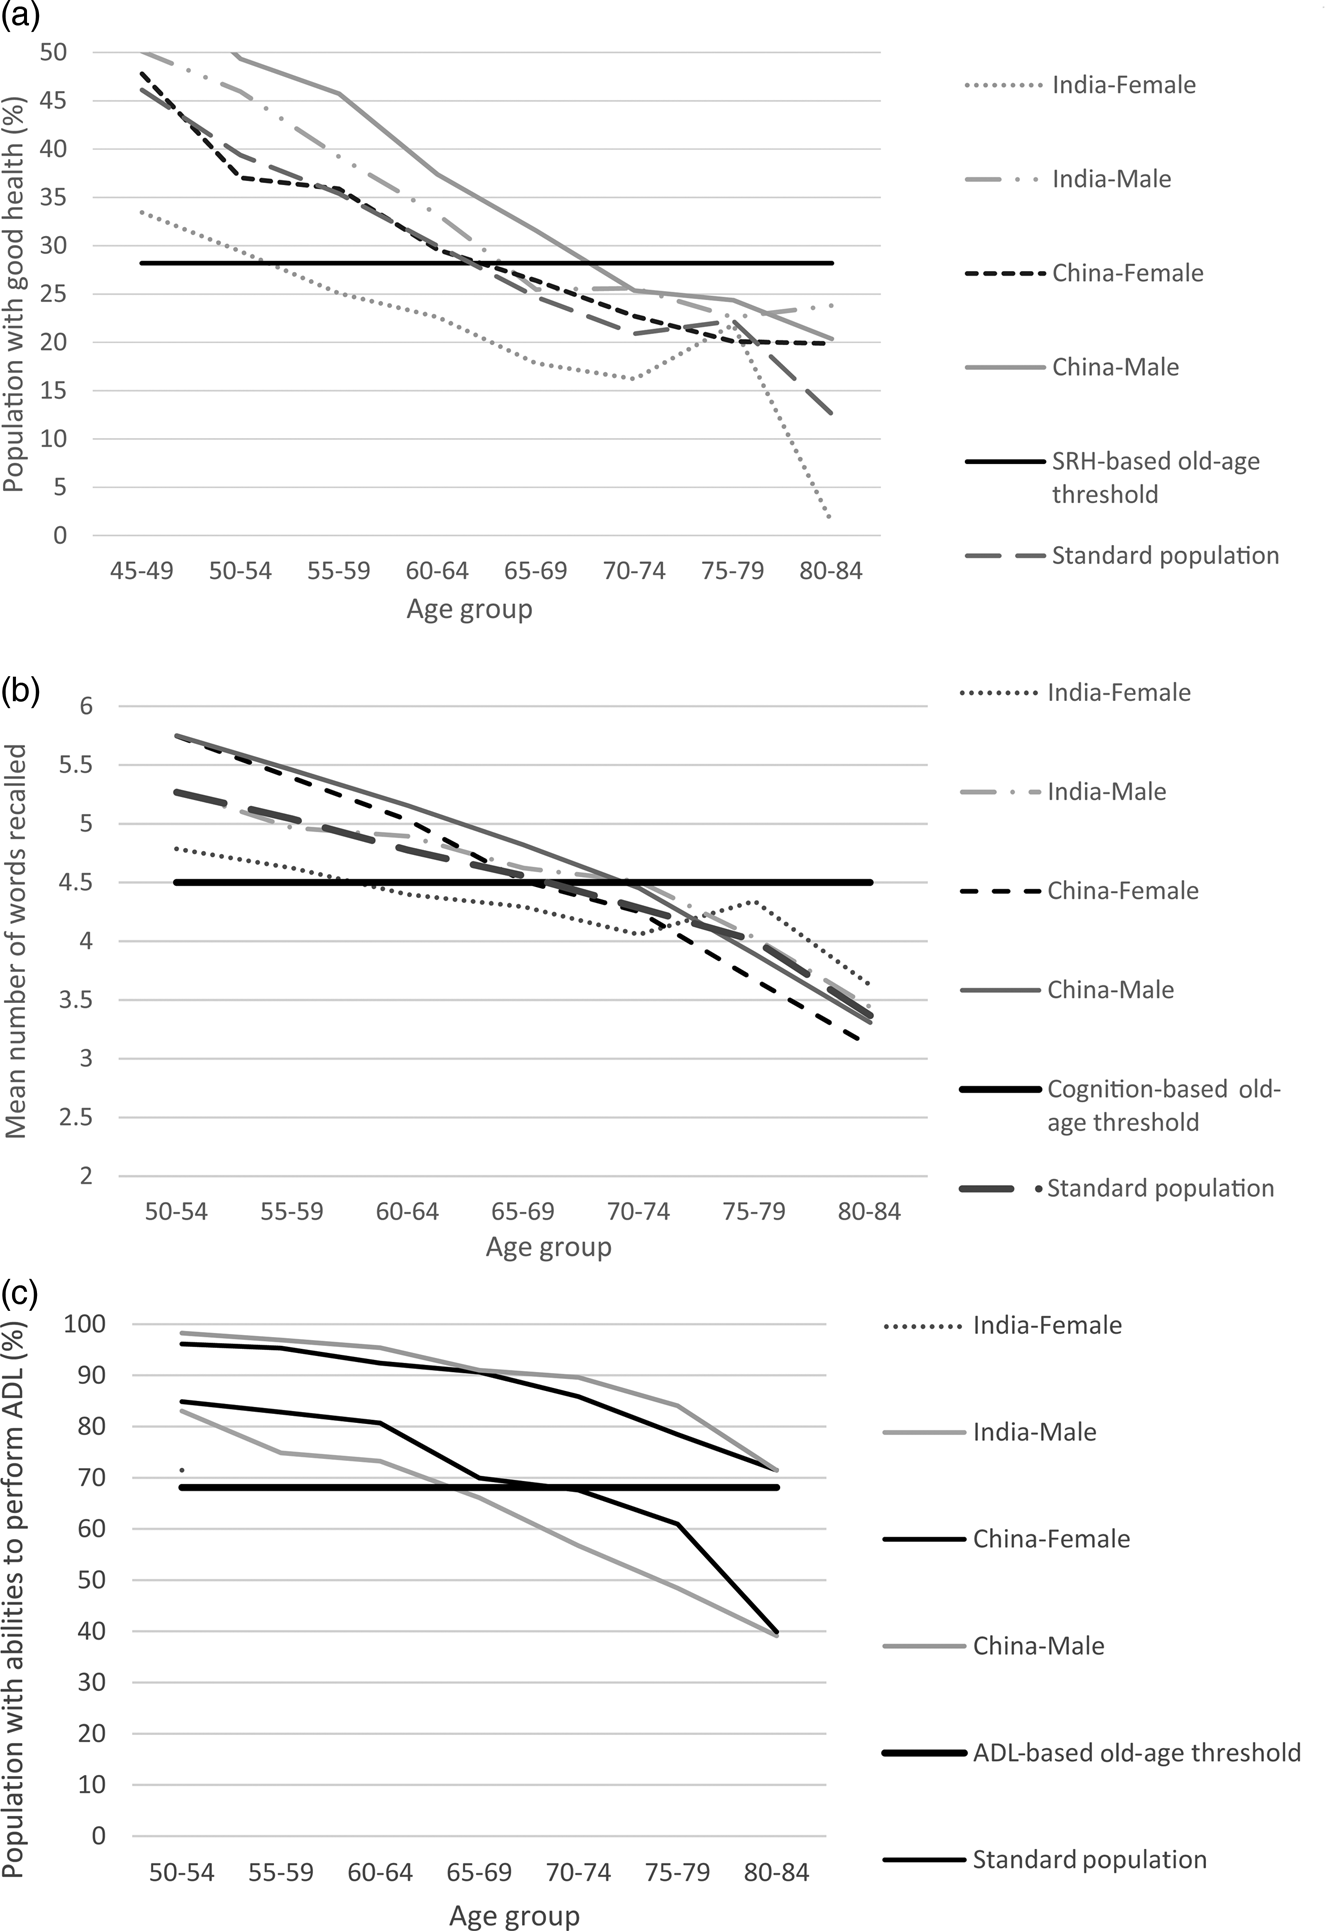
Figure 1a shows a decline in self-rated good health of the population among the male and female populations in India and China. However, the levels and rate of decline are different across the populations. While the Indian female population has the lowest levels of self-rated health across most parts of the lifecourse, Chinese males have the highest levels of self-rated health. Figure 1b shows that the average mean number of words recalled goes down with age. However, the patterns of decline are different across the populations. A similar pattern can be observed in Figure 1c where the percentage of the population who are able to perform ADL is depicted. In general, this also shows a pattern of decline with increasing age though there are variations in the rate of decline across different populations. In general, it can be seen that the female population of India has lowest absolute values for the different dimensions, whereas the male population of China generally has better levels of performance.
Figure 1 also provides values for the standard population with regard to different dimensions. From the standard population, the frontier values of the different dimensions were calculated. The self-rated health-based frontier value was 28.2, for cognitive function it was 4.5 and for ADL it was 68.1. This means that the population has good self-rated health until it reaches the age where 28.2 per cent of the population has good self-rated health. Similarly, the population has good cognitive ability until it reaches the age where the frontier value of cognitive function is 4.5 words. Likewise, the age where 68.1 per cent of the population are still able to perform all the ADL is the age at which the population has good functional capabilities. Based on the frontier values identified, we estimate the old-age threshold for different dimensions and the also estimate the MOAT. These estimates are shown in Table 2.
Estimates of old-age threshold values for different dimensions and multi-dimensional old-age threshold (MOAT) across gender in India and China, 2010

Source: Authors’ calculation based on WHO-SAGE (WHO Study on Global AGEing and Adult Health), Wave 1, 2007–2010 (Kowal et al., Reference Kowal, Chatterji, Naidoo, Biritwum, Fan, Ridaura and Boerman2012).
The second, third and fourth columns in Table 2 show the old-age thresholds based on the dimensions of self-rated health, cognition and functional abilities (ADL), respectively, for the selected populations. For instance, the self-rated health-based old-age threshold for the Chinese male population is 65. This means that at age 65, the percentage of the population in the Chinese male population with good self-rated health is the same as the frontier value of 28.2 per cent. Similarly, the cognition-based old-age threshold for the Chinese male population is 72 and the functional abilities-based old-age threshold for China is 83. This means that the Chinese male population attains the cognition-based frontier value of 4.5 words at age 72 and ADL-based frontier value of 68.2 per cent at age 83. It may also be noted that the female population in India has lower values of old-age thresholds in different dimensions as well as in terms of MOAT. The male populations in India and China have higher values of old-age thresholds across the different dimensions in comparison to their female counterparts. The only exception here is for the dimension of ADL abilities in China, where the male and female populations have the same old-age threshold value.
The estimates highlight the relative advantage/disadvantage for each of the populations in terms of different dimensions. For instance, the Indian female population has higher old-age threshold values for the cognition-based old-age threshold in comparison with self-rated health, functional abilities and also based on MOAT. This means that the relative performance of the Indian female population in terms of cognition is better than their performance in other dimensions. Contrary to this, the cognition-based old-age threshold of the Chinese female population is lower than their performance in the dimensions of self-rated health and functional abilities.
Gender gap across India and China
A higher old-age threshold depicts better performance of the population in a particular dimension or in terms of multiple dimensions (if MOAT is considered). Likewise, a lower old-age threshold indicates a lower level of performance. Thus, a difference between the old-age thresholds of the male and female populations of a country illustrates the gender gap in the country. In Figure 2, we illustrate the gender gap in India and China for different dimensions and also for MOAT. The higher the value of the gender gap, the higher is the level of disadvantage among females in comparison with males in the particular dimension.
Gender gap in India and China across different dimensions and multi-dimensional old-age threshold (MOAT), 2010.
Source: Authors’ calculation based on WHO-SAGE (WHO Study on Global AGEing and Adult Health), Wave 1, 2007–2010 (Kowal et al., Reference Kowal, Chatterji, Naidoo, Biritwum, Fan, Ridaura and Boerman2012).
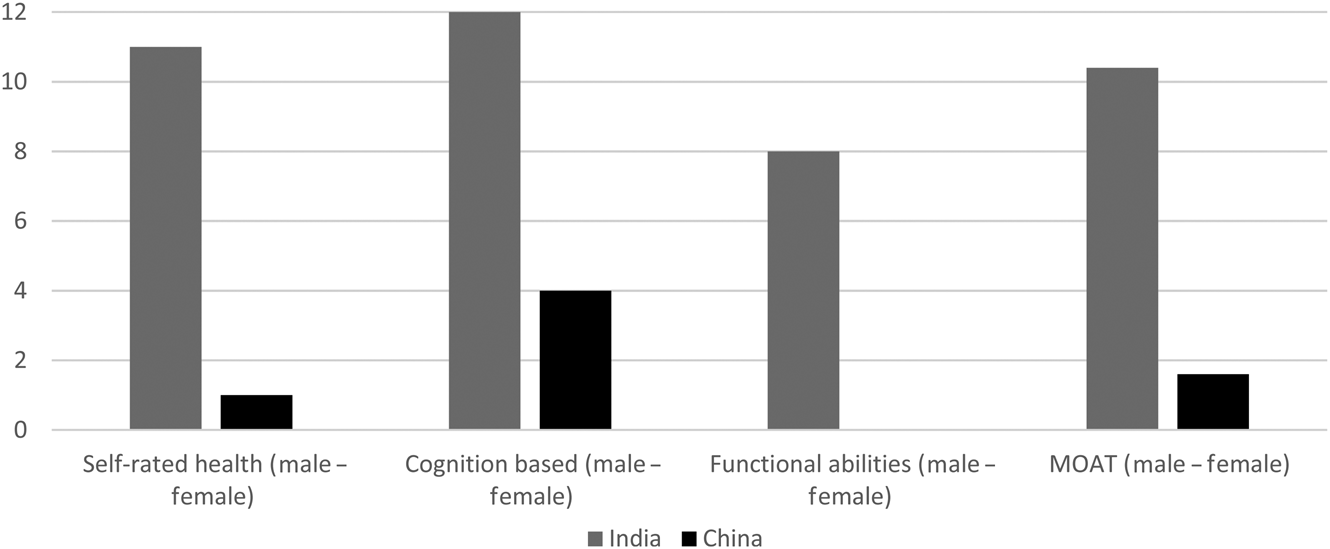
The difference, which represents the gender gap in a country, is clearly higher in India in comparison to that of China across the different dimensions. However, there are differences across the dimensions. The cognition-based gender gap is higher in India than the other dimensions. This is followed by the gender gap in self-rated health and then by functional abilities. A similar pattern is also observed in China. The cognition-based gender gap is higher in China as well, in comparison to the gender gap in the other dimensions. This is followed by the gender gap in the dimension of self-rated health and functional abilities. In fact, the gender gap in China in terms of functional abilities is zero. Both India and China have a significant gender gap in cognition in later life.
The gender gap estimation with MOAT shows the multiple levels of deprivation faced by older women in these countries. The estimates show that the multi-dimensional gender gap in India is much higher than that in China. The values of the gender gap are 10.4 in India and 1.6 in China. This means that the multi-dimensional gender gap is 6.5 times higher in India than in China. The results based on MOAT clearly add to our understanding of the gender gap as MOAT captures the complexity of this gender gap. A uni-dimensional understanding of the gender gap can, by definition, only identify the gender gap in one specific dimension of health. On the other hand, the MOAT-based analysis of the gender gap is comprehensive and accounts for the gender gap along multiple dimensions. For instance, the MOAT-based gender gap in both India and China is lower than the cognition-based gender gap in the particular countries. However, in both the countries, the MOAT-based gender gap is higher than the gender gap in the dimension for functional abilities. Similarly, the MOAT-based gender gap is lower than the self-rated health-based gender gap in India, whereas in the case of China, the MOAT-based gender gap is higher than that for self-rated health.
The gender gap in India and China at the provincial level
Both India and China are known for having high levels of regional inequalities in health (Yip and Mahal, Reference Yip and Mahal2008). The socio-economic inequalities at the provincial levels in these countries are believed to be responsible for this (Dummer and Cook, Reference Dummer and Cook2008). Given these regional inequalities, it is important not just to understand the extent of the gender gap in health at the national level. We must also drill down to the regional level to get a more holistic picture of the patterns of gender inequalities in health in these countries. The WHO-SAGE data-set provides information on six Indian provinces and eight Chinese provinces. Among the provinces considered in India, Karnataka and Maharashtra have better levels of HDI values, while Rajasthan and Uttar Pradesh have lower levels of HDI values (Global Data Lab, 2017). Among the Chinese provinces considered, Shanghai has the highest levels of HDI values while Yunnan has the lowest levels. It is probable that the gender inequality is lower in provinces with higher levels of HDI values, and this needs to be explored. We illustrate the MOAT and old-age thresholds based on different dimensions for the provinces of India and China in Tables 3 and 4, respectively.
Estimates of old-age threshold values for different dimensions and multi-dimensional old-age threshold (MOAT) across gender in different provinces of India, 2010
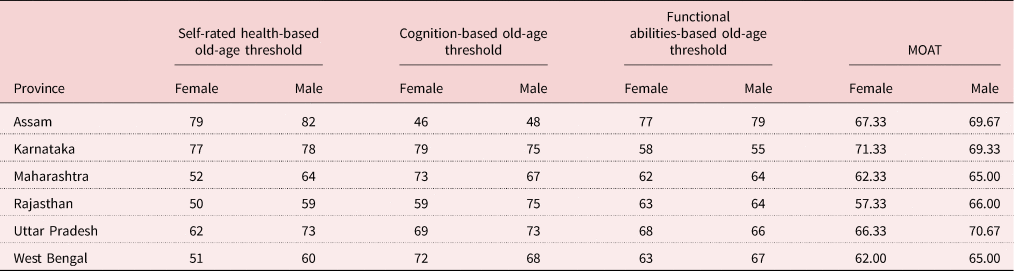
Source: Authors’ calculation based on WHO-SAGE (WHO Study on Global AGEing and Adult Health), Wave 1, 2007–2010 (Kowal et al., Reference Kowal, Chatterji, Naidoo, Biritwum, Fan, Ridaura and Boerman2012).
Estimates of old-age threshold values for different dimensions and multi-dimensional old-age threshold (MOAT) across gender in different provinces of China, 2010
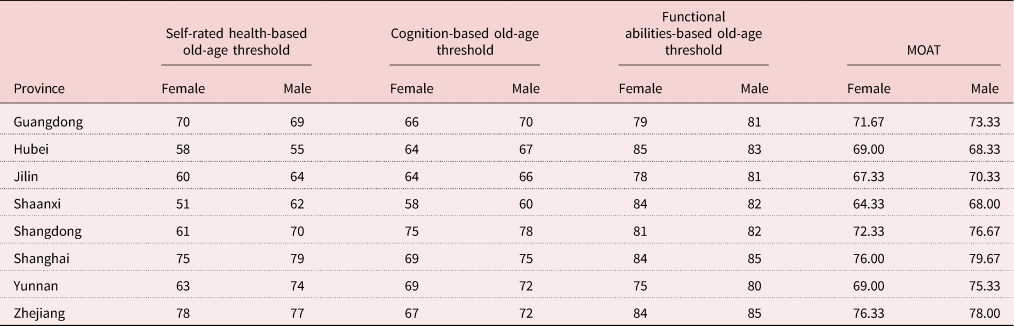
Source: Authors’ calculation based on WHO-SAGE (WHO Study on Global AGEing and Adult Health), Wave 1, 2007–2010 (Kowal et al., Reference Kowal, Chatterji, Naidoo, Biritwum, Fan, Ridaura and Boerman2012).
Table 3 shows the MOAT and old-age thresholds based on different dimensions for six different provinces in India. The province of Karnataka has the highest MOAT for females and Assam has the highest MOAT for males. At the same time, the province of Rajasthan has the lowest MOAT value for females, and the provinces of Maharashtra and West Bengal have the lowest values of MOAT for males. Interestingly, the province of Karnataka has a MOAT value for females higher than that of males. This pattern in Karnataka, the South Indian province included in the analysis, is in accordance with the general patterns of health in India, where the South Indian province shows a comparatively higher gender equality (Balarajan et al., Reference Balarajan, Selvaraj and Subramanian2011). Studies shows that the general health among older adults in the South Indian provinces of Kerala, Tamilnadu and Karnataka is significantly better than their counterparts in rest of India (Rajan et al., Reference Rajan, Mishra and Sarma2001; Giridhar et al., Reference Giridhar, Sathyanarayana, Kumar, James and Alam2014). There are also provincial-level patterns for individual dimensions. Some provinces with better performance in MOAT lag in performance in certain dimensions. For instance, Assam has higher values of old-age thresholds based on the dimensions of self-rated health and functional abilities, but has lower old-age threshold based on the dimension of cognition.
Similarly, Table 4 shows the MOAT and old-age thresholds based on different dimensions for eight provinces of China. Shanghai has the highest MOAT among the Chinese male population and Zhejiang has the highest MOAT for the Chinese female population. Shaanxi has the lowest MOAT values for the Chinese male and female populations. Patterns in individual dimensions also differ across provinces. The old-age thresholds based on the dimensions of self-rated health and functional abilities are higher in Zhejiang than the old-age thresholds based on cognition. Likewise, the old-age thresholds based on the dimensions of cognition and functional abilities are higher for Hubei than its old-age thresholds based on self-rated health.
We use the MOAT and dimension-specific old-age thresholds across male and female populations to analyse the gender gap in the different provinces in both countries. As executed in the case of estimation of the national comparisons of the gender gap, we find the difference between the MOAT of the male and female population across the different provinces considered to obtain the results of multi-dimensional gender gap at the provincial level. Tables 5 and 6 show the results of the estimation of the gender gap in the provinces of India and China, respectively.
Estimates of the multi-dimensional gender gap and the gender gap based on different dimensions in different provinces of India, 2010
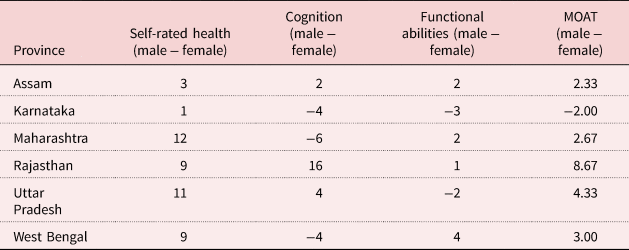
Note: MOAT: multi-dimensional old-age threshold.
Source: Authors’ calculation based on WHO-SAGE (WHO Study on Global AGEing and Adult Health), Wave 1, 2007–2010 (Kowal et al., Reference Kowal, Chatterji, Naidoo, Biritwum, Fan, Ridaura and Boerman2012).
Estimates of the multi-dimensional gender gap and the gender gap based on different dimensions in different provinces of China, 2010

Note: MOAT: multi-dimensional old-age threshold.
Source: Authors’ calculation based on WHO-SAGE (WHO Study on Global AGEing and Adult Health), Wave 1, 2007–2010 (Kowal et al., Reference Kowal, Chatterji, Naidoo, Biritwum, Fan, Ridaura and Boerman2012).
Table 5 shows the estimation of the gender gap in the six Indian provinces. Except for the province of Karnataka, all the provinces have a positive value of difference in the MOAT across gender, indicating that the multi-dimensional gender gap is biased against females in these provinces. The province of Rajasthan has the highest gender gap using the MOAT. That is, the female disadvantage is highest in Rajasthan in comparison to the other provinces. After Rajasthan, the gender gap using the MOAT is highest in Uttar Pradesh. This is followed by West Bengal, Maharashtra and Assam in that order. There are also provincial-level patterns in individual dimensions as well. Maharashtra has the highest gender gap in the dimension of self-rated health, followed by Uttar Pradesh. Rajasthan has the highest gender gap in the dimension of cognition. The low level of access to education for females and cultural bias against female literacy can be endorsed with the responsibility of this pattern in the dimension of cognition in the province of Rajasthan (Thomas et al., Reference Thomas, Wang and Fan1999). The province of West Bengal has the highest gender gap in the dimension of functional abilities.
Table 6 shows the results of the estimation of the gender gap in eight provinces of China. The value of the difference in the MOAT is positive in most provinces of China as well, indicating a gender gap in multi-dimensional health that is biased against females in the Chinese provinces. The only exception to this is the province of Hubei, where the difference in the MOAT values across gender is negative and less than 1. This indicates the slight female advantage in multi-dimensional health in the province. The province of Yunnan has the highest gender gap followed by Shangdong. There are also variations in the gender gap across the dimensions. While Yunnan and Shaanxi have the highest gender gap in the dimension of self-rated health, Shanghai has the highest gender gap in the dimension of cognition. Again, Yunnan has the highest gender gap in the dimension of functional abilities.
Discussion
The paper contributes to the literature in multiple ways. Firstly, it provides an innovative way to use a population ageing measure to understand gender inequalities in health across countries. Secondly, it highlights the need to take a multi-dimensional approach to understanding gender inequalities in health in developing countries. Thirdly, it provides empirical insights into the multi-dimensional gender gap in health in India and China, at the national and provincial levels.
Empirically, the paper illustrates the existence of the multi-dimensional nature of the gender gap in health both in India and China and that this is higher in India than in China. An effort at quantifying the intensity of the multi-dimensional gender gap among the older population shows that the gender gap in India is around 6.5 times higher than in China. The estimations of the multi-dimensional gender gap in both countries is different from the estimations based merely on one dimension. For instance, the gender gap using the dimension of functional abilities alone is lower in both India and China in comparison with the multi-dimensional estimate of the gender gap in these countries. Similarly, the gender gap using the dimension of cognition is higher than the multi-dimensional gender gap in both countries. It also needs to be noted that the picture presented by the multi-dimensional perspective of the gender gap is also different from that presented by the differences in the life expectancies. While the life expectancies among older females have been continuously increasing in these countries and is higher than those of males, the relative position of females is actually disadvantaged and vulnerable once the multiple dimensions of health are taken into consideration. For instance, for the period of 2005–2010, the difference in life expectancies at age 50 across gender was 2.2 years in India and 2.5 years in China, with a relative advantage for females (United Nations, 2015). Thus, a conclusion based on merely life expectancy may presume female advantage in these countries at older ages. However, our analysis depicts a clear female disadvantage in both the countries once multiple dimensions of health are taken into consideration. Hence, when a multi-dimensional lens is used to understand the gender gap among the older population, a country has better levels of gender equality in health when it simultaneously improves gender equality in multiple dimensions related to health.
The paper also highlights how the multi-dimensional gender gap among the older population is heterogeneous across the provinces of India and China. The provinces of Karnataka in India and Hubei in China have lower levels of gender inequality compared to other provinces in their respective countries. Likewise, the provinces of Rajasthan in India and Yunnan in China have the highest levels of gender inequality. These patterns are in accordance with the wider patterns of health at the provincial level in the countries (Balarajan et al., Reference Balarajan, Selvaraj and Subramanian2011; Evandrou et al., Reference Evandrou, Falkingham, Feng and Vlachantoni2014). Rajasthan and Yunnan are also provinces with relatively lower levels of HDI values, while Karnataka has higher levels of HDI values. However, it may also be noted that our analysis illustrates that the gender gap need not necessarily have a direct association with the levels of HDI values. For instance, the provinces of Shanghai and Maharashtra in China and India, respectively, have relatively higher levels of HDI values, but also have relatively higher levels of gender gap.
Our application also shows that the multi-dimensional gender gap estimations at the provincial level are significantly different from uni-dimensional estimates, thereby underlining the importance of a multi-dimensional perspective for deriving a more holistic picture. There have been some recent efforts to bring out multi-dimensional measures for population ageing in specific contexts and interests, such as the Global Age Watch Index and Active Ageing Index (HelpAge, 2015; UNECE/European Commission, 2015). However, unlike the other existing multi-dimensional measures, our application is progressive as it provides a measurement for comparison of the intensity of the gender gap across populations. The existing multi-dimensional measures, on the other hand, merely index the different improvements in characteristics of older persons and their environments based on an already-existing abstract definition of age 60 or 65 to define older persons.
However, it should be noted that the old-age thresholds need to be cautiously interpreted. The old-age thresholds are estimated on the basis of the standard population, which is derived from the populations considered. The resultant old-age thresholds are useful for comparisons across the considered populations, but the interpretation of the absolute value of the old-age threshold may not be very useful. However, the important point here is that the old-age thresholds are extremely useful for understanding the gender gap across the countries. A difference between the old-age thresholds derived across the genders in both countries indicates a difference in the relative achievements of the male and female populations in the respective countries.
An important choice in the analysis is the choice of the variables that corresponds to the multiple dimensions relating to different aspects of health. We chose the variables in consideration of the suitability of the region considered for the study, literature and availability of data in the region. However, it would be possible to use different variables that represent different dimensions of health in the region of interest and based on data availability.
Another important assumption in the execution of the methodology is the choice of the weights given to different dimensions. We chose an approach of giving equal weights to different dimensions during the creation of the MOAT. Such an approach is in line with other international multi-dimensional indices for wellbeing, such as the HDI. The provision of giving equal weights to different dimensions avoids any kind of normative positions on the relative importance of different dimensions considered. However, in future, the methodology to understand the gender gap used in our analysis can also be executed with differential weights if the interest is in understanding the relative importance of certain dimensions.
Recommendations
Our findings have direct implications for policy makers. The start of ‘old age’ for women is earlier than their male counterparts in these countries and thus a lifecourse approach to improve different aspects of the health of women should be underscored. Policy makers should concentrate on giving equal educational opportunities to women, given the connection between education at younger ages and cognitive abilities across the lifecourse. The educational opportunities for women in these countries are presently very low. The burden of functional disability is also higher among women than among men, pushing them to ‘old age’ sooner than males. With a continuous rise in the older population in these countries, the study suggests the need for a comprehensive and holistic gender-sensitive health agenda in India and China. Such a health agenda should recognise the multi-dimensionality of deprivation among different aspects of health among women.
The provincial-level differentials of the gender gap in health directs policy makers to the need to concentrate on older women in regions with a higher gender gap. A cumulative disadvantage for women across the lifecourse in many socio-economic-cultural aspects may be responsible for the multi-dimensional disadvantage in health. A targeted approach for the elimination of the gender gap in these regions is called for.
Our results point towards the serious need to increase not only the health budget, but also budgetary provisions related to education and other quality dimensions for females in India and China. Given the vastness and heterogeneity in these countries, we acknowledge that there would be a multiplicity of factors that are country- and region-specific that would determine the gender gap in the countries and its provinces. It might be worthwhile in future studies to understand the determinants of the differentials in the gender gap as well. Also, better data documentation initiatives are needed in these countries to capture its heterogeneity.
Acknowledgements
The authors acknowledge valuable comments from Fanny Janssen, Joop de Beer and Leo van Wissen on the earlier version of the manuscript, although any errors are our own and should not tarnish the reputations of these esteemed professionals.
Financial support
The first author acknowledge the support by the Ubbo Emmius Fund (AB; alumnus and friends of the University of Groningen, The Netherlands).
Conflict of interest
The authors declare no conflicts of interest.
Ethical standards
No ethical approval was required.


 Open access