

DISCUSSION POINTS
-
• Historical issues associated with market control through a cartel, the tension between enclave operations and resource nationalism, and the support by national security frameworks, still linger.
-
• The entanglement of the fossil fuel supply industry, banks, and commodity traders, and the financialization of commodities currently allow fossil fuel supply transactions to be made in non-competitive ways.
-
• The immense capital available to those operating the fossil fuel supply chain affords not only economic advantages, but also allows them to side-step regulation.
Introduction
The elephant in the room
The issue of climate change has repeatedly made the news: April 2016 was the fifth consecutive month in which the global monthly temperature was more than 1.0 °C warmer than average with March having the most deviation (1.23 °C) from average of any month recorded since 1880. 13 out of the 15 highest monthly temperature departures since 1880 have occurred since February 2015. 1,2 It was announced that carbon dioxide (CO2) emissions from the burning of coal, oil and gas and cement production continued to climb, resulting in an emitted load of 35.9 GtCO2 in 2014, the highest in history, and an increase of 0.6% over 2013. 3 The Paris Agreement, which clearly expresses the intention to hold global warming well below 2 °C, and to pursue efforts to keep it within 1.5 °C, has absorbed the idea put forth by climate scientists that even the 2° warming limit may be highly dangerous. Reference Hansen, Sato, Hearty, Ruedy, Kelley, Masson-Delmotte, Russell, Tselioudis, Cao, Rignot, Velicogna, Kandiano, von Schuckmann, Kharecha, Legrande, Bauer and Lo4 The International Panel on Climate Change Working Group III (IPCC WGIII) states that in the context of the current emissions, which are rising faster than expected, a clear break in the emissions trend is needed by 2019, or the most feasible pathway to keep global warming within 2 °C would be missed. In addition, economists, such as Nicholas Stern, former chief economist at the World Bank, have published results showing that the climate models used by the IPCC severely underestimate the economic costs of climate change because the underlying assumptions have not kept up with the science. Reference Dietz and Stern5 The carbon intensity of the global energy supply has not decreased since 1990 despite 20 years of international climate negotiations under the United Nations Framework Convention on Climate Change (UNFCCC). Reference Friedlingstein, Andrew, Rogelj, Peters and Canadell6
Is the broader conversation lost?
Despite the awareness of the need to respond to these urgent and overarching issues, business-as-usual carries on with incremental decisions, made in narrow frames of reference, that continue to build, and lock investments into the conventional fossil fuel infrastructure. An example of this lack of a pervasive strategy to transform the energy supply was highlighted recently by an interdisciplinary group of scientists. They observed, in the context of the development of oil-sands pipelines in Canada, that these projects are implemented by the careful steering of the developer through incremental, fragmented, and narrow decision-making regulatory processes which limit the discussion to a superficial handling of the problems associated with oil development. They call for a broader conversation in which international economic and energy security strategies are weighed against their consequences in terms of environmental preservation and justice. Until this broader perspective has been taken and incorporated into better policies and processes, they recommend a moratorium on new oil-sands development projects. Reference Palen, Sisk, Ryan, Árvai, Jaccard, Salomon, Homer-Dixon and Lertzman7 Decisions and arguments based on narrowed frames of reference and restricted scopes of information have become endemic in the public conversation about climate change and renewable energy.
The urgency of addressing the enormous price tag of inaction is penetrating through society. A report warning of the severe, urgent, and manifold risks of climate change to the US economy, although clearly describing the urgent need to act, did not address solutions, which opens up a tension field of competing interests. 8 Major oil companies forecast that in 2040 oil and gas will be the largest energy sources, with the demand having increased by ∼40% in 2035 over today. 9,10 An example of the other end of the spectrum are the multitude of plans, feasibility studies, and demonstrations of an energy supply based on 100% renewables. Reference Jacobson, Howarth, Delucchi, Scobie, Barth, Dvorak, Klevze, Katkhuda, Miranda, Chowdhury, Jones, Plano and Ingraffea11–14
Humanity’s combustion of fossil fuels as it over-consumes resources has created a complex of ubiquitous environmental, social, and economic problems. While the urgency of climate change is resounding louder each year, it is important to look for bona fide solutions that penetrate to really disentangle, rather than superficially address, the knot of interdependent problems. And while scientific and technological understanding will need to be applied, solutions will no less need to be informed by history and aired in public. Most importantly, this crisis of our planet and society must be seen also as an opportunity for strengthening such pillars of human society as democracy, fairness, equality, and peace. Reference Klein15 The alternative, using ad hoc solutions to deal with each separate manifestation of a problem, will escalate the urgency and lead to emergency ‘trade-offs’ that degrade our global civilization and planet, delaying action on bona fide solutions.
A judgment of the viability of an electricity-generating technology must be based upon the social, environmental, and economic impacts of its deployment all along the supply chain.
In addition, the historical and present issues that motivate the change need to be taken into account, as well as the appropriateness of the technology for a climate-changed future. Neglecting the context of the change, or by singling out one issue while neglecting many others, introduces logical fallacies into the exercise. One such logical fallacy is the status quo bias, in which the status quo is assumed to be fine because it is the way things are.
For example, the viability of a renewable electrical energy technology may be solely framed in terms of the cost to the consumer as compared to the costs of grid electricity, i.e., its ability to reach ‘grid parity’. In this case, a grid electricity price is referenced as a benchmark, often without further examination of whether that price is actually artificially low, which has been the case in Europe. Electricity tariffs, relevant to more than half of the European electricity supply, have been priced artificially low, inadvertently leading to the accumulation of ‘electricity tariff deficits’ in 11 member states. Reference Linden, Kalantzis, Maincent and Pienkowski16 While this type of grid parity discussion is useful in considering the competitiveness of, say, photovoltaic electricity (PV), in a particular market, it rhetorically sets up the status quo as the desired condition to be reached, without considering its sustainability or its social impact. Therefore, this premise is not sufficient for a viability judgement. Further, the argument over the ‘competitiveness’ of energy industries should be put into the context of whether the energy supply has ever functioned in a competitive market. In a companion article, the competitiveness of PV as compared to grid electricity is analysed. This Viewpoint article treats the history, impacts, and current market status of the fossil fuel supply chain.
A brief overview of the lingering aspects of historical fossil fuel acquisition strategies is presented in section “Lingering geo-political aspects of historical acquisition strategies”. The fossil fuel industry has been shaped by government subsidies, advantages, and protections given to it since WWI. Many of the historical issues associated with noncompetitive practices to control the market, operation in and value generation for the narrow enclave within which it functions, and being intertwined in national energy security frameworks still linger.
Section “Fossil fuel subsidies” takes a look at the massive government subsidies that fossil fuel industries receive. The International Monetary Fund (IMF) calculates that roughly 6.5% of the global GDP was spent in 2015 to subsidize fossil fuels. This does not include the producer subsidies, which include direct subsidies for exploration, financing, and insurance subsidies through export credit agencies (ECAs) and subsidies for shipping as well as for security. While the IMF includes environmental impacts, it only includes those associated with air pollution, climate change, and increased traffic.
The current fossil fuel suppliers are not only industry players, but also banks and commodity traders and are profiled in section “Who are the fossil fuel suppliers now?”. The economic and social consequences of the globalized oil & gas industry are taken up in section “Economic and social consequences of the globalized oil & gas industry”, followed by a renewed look at the physical consequences of the fossil fuel supply chain in section “Physical consequences of the fossil fuel supply chain”. Recent market developments for uranium, coal, and oil & gas markets are taken up in section “Recent market developments: uranium, coal, oil & gas”. Section “Discussion” presents a discussion of the social impacts of financialization in the context of the global fossil fuel suppliers. Finally, as a conclusion, some considerations are presented to keep in mind when trying to avoid limited frames of reference in conjunction with the comparison of renewable and fossil fuel energy sources.
Climate changers
Fossil fuel suppliers are clearly responsible for the lion’s share of anthropogenic greenhouse gas emissions over the past 250 years. 17 Emissions totaling ∼900 GtCO2 eq, or 65% of cumulative worldwide emissions of industrial CO2 and methane between 1751 and 2010, have been traced to 90 “carbon major” entities: 56 crude oil and natural gas producers, 37 coal extractors (including subsidiaries of oil & gas companies), and 7 cement producers. Reference Heede18
Climate scientists have calculated the amount of fossil fuels that could still be burned before critically overloading the atmosphere. Reference Meinshausen, Meinshausen, Hare, Raper, Frieler, Knutti, Frame and Allen19 It is this that motivated the energy investors at Carbon TrackerFootnote * to analyze in detail the amount of ‘stranded’ carbon fuel assets (meaning carbon fuel that cannot be sold because it cannot be burned) that are already accumulating. They, along with the Grantham Institute at the London School of Economics, and in cooperation with HSBC, Reference Spedding, Mehta and Robins20 Citigroup, and Standard & Poor's, have raised the flag that 60–80% of the coal, oil and gas reserves of listed firms are unburnable. 21 If not addressed, the carbon bubble Footnote † can have widespread and damaging economic repercussions. Despite the consequence that fossil fuel use is altering the thermal balance of the earth, the prevailing economic drivers apparently lock in the unflagging pursuit of new fossil fuel reserves.
The valuation of all conventional fossil fuel companies is directly based on their reserves. Footnote ‡ For both mining and oil & gas extraction, financial performance in these companies relates more to exploration and development and to the continual addition of new reserves, than it does to refining or marketing. Reference Garcia and Camus22,23
Today, despite the increased commodity trading, the oil and gas industry is still very centralized, i.e., dominated by a handful of companies with a high concentration of capital and power in its decision centers. Its business has been supported by national policies from price regulation and subsidies to military intervention for securing oil supply. At the same time, this prominent positioning of the industry has limited innovation, increased inertia, and created resistance to change. Reference Bismuth and Castellani24 A good starting point for gaining a perspective on the fossil fuel supply chain is to take a brief historical look at the origins of this industrial sector.
Lingering geo-political aspects of historical acquisition strategies
The oil & gas industry has occupied a strategically privileged and economically subsidized position for decades. Although the geo-political issues that announced themselves early in the last century have evolved to some degree, they are, in essence, still lingering. Some of these issues are: market control through a cartel; the emergence of resource nationalism; and the (inter)national political and military framework support for secured access to oil & gas resources.
International and national political structures have economically and politically facilitated the major oil companies to acquire exclusive rights, or ‘concessions’, to explore and exploit oil-rich regions of the world since WWI, when oil was first recognized as strategically important. Britain and France were empowered by the Treaty of Versailles and the creation of the League of Nations to acquire the occupancy contracts, or ‘concessions’, which gave rise to the British Petroleum (BP) company and others Footnote § , and that dominated the industry until the early 1970’s. Reference Stevens25 The original concessions in Iran, Iraq, Kuwait, and Saudi Arabia were unreasonably long with an average duration of 82 years. In addition, the concession areas were huge: more than 88% of the national area was claimed in Iran and Saudi Arabia, and 100% of the national area in Iraq and Kuwait. Furthermore, the royalties paid to the host countries were decided unilaterally by the oil concerns. Finally, the concession agreements gave the oil companies the right to operate within an enclave. They had total freedom to create their own state within the concession areas, which included deciding the plans for exploration, development, and production. Despite attempts to influence these decisions, the host governments had no role, according to the concession agreements, in the operation of the companies or administration of the concession areas. Reference Stevens25,Reference Mitchell26 These contracts laid the seeds for conflicts for decades to come.
Cartel to improve the energy return on investment
Between the two world wars, when the handful of major oil corporations controlled the total market, rivalry led to a price war, which culminated in a major conflict between Shell and Standard Oil (Exxon) in India during 1927 and 1928. Reference Stevens25 In 1928, representatives of Standard Oil, Shell, and BP met secretly at Achnacarry Castle, Scotland, to address the situation by forging a secret cartel agreement. A BP-authored draft of this agreement states that because the petroleum industry could not earn a sufficient return on its investment in a competitive environment, the three oil companies would divide the world's markets among themselves, to limit production and maintain prices. 27 By preventing the emergence of market competition, they ensured extraordinary profits to those who controlled the cheaply produced oil of the Middle East. Reference Mitchell26
Resource nationalism
In the 1950's and 60's, producer governments tried to regain control of their resources, as in the example of Iran. In 1951–53, Iranians elected Muhammed Mossadegh, a leader of a secular democratic party, as Prime Minister. Negotiating between an emerging labor movement in the Iranian oil industry and BP, Mossadegh nationalized the oil industry, but with terms more favorable to BP than those advocated by the labor representatives. The international oil companies (IOCs) boycotted Iranian oil and the British blockaded exports at the refinery at Abadan, which threw Iran into an economic crisis and weakened the government. An Anglo–American military coup unseated Mossadegh's parliamentary-based government, restored and enhanced the oligarchic rule of the shah, and violently repressed political dissent. Reference Mitchell26 In the following decades, the oil producing countries eventually nationalized their oil and gas resources and formed OPEC as a counterweight to the ‘old guard’ independent oil companies. Currently, the IOC's control about 10% of the world's reserves. Reference Myers and Soligo28
National political frameworks
National political frameworks still routinely facilitate IOC's bargaining power with foreign governments. When BP was courting Azerbaijan for access to the Baku oilfield's in Azerbaijan, just after the Soviet Union broke up, the British government flew Margaret Thatcher in to visit the newly formed government in Azerbaijan and to witness the signing of the memorandum of understanding between the Azeri National Oil Company and BP. The deal, known as the ‘contract of the century’ was signed two years later, with BP as the head of the consortium, and the Azeri national oil company entitled to only a fifth of the oil developments. Parallels have been drawn between this contract, achieved for a private oil corporation through state foreign policy frameworks, and those made in the years between the world wars. Reference Marriott and Minio-Paluello29,Reference Blair30
National security
Now no less than earlier, oil remains a central economic and political factor, worthy of military involvement to secure. Reference Tétreault31 The Institute for the Analysis of Global Security, headed by former National Security Advisor Robert MacFarlane, estimates that the 1990–91 Gulf War, to resolve an oil dispute between Iraq and Kuwait, cost the international community about $80 billion. The cost of the 2003 Iraq war and the following occupation of the country is estimated at $200 billion. 32 The costs associated with US military operations in the Persian Gulf between 1976 and 2007 were estimated to total $6.8 trillion (2008$), which includes 500 billion spent in 2007 alone. Reference Stern33
These examples show that oil is deeply entwined in the national security interests of states, and as such is not a simple market commodity. The IOC's did not achieve their current state of predominance by the level rules of fair market competition. To stifle competition and achieve a better return on their investment, they formed a cartel. Market control through cartels is still emblematic of the oil & gas market. These industries have been supported with government national security frameworks that have promoted and guarded their interests since the end of WWI. While the expense of this support has been estimated from time to time, the actual accounting remains nontransparent. This history of exploitation of oil resources for the benefit of the dominating economies is a lingering issue, which presently comes to light in the discussions over how to pay for mitigating climate change. Not only has the fossil fuel industry enjoyed the privileged institutional support, they have also received many subsidies.
Fossil fuel subsidies
The subsidies that directly concern the fuel supply chain are the producer subsidies (∼$100 billion annually), the financial subsidies through ECAs for overseas projects (∼$50–$100 billion annually), and the cost of securing fossil fuel supplies by protecting shipping lanes (estimated at $20–500 billion a year), or about ∼$200–700 billion per year, over and above the total subsidies estimated by the IMF Reference Tagwerker34 (Table 1).
Overview of indicative amounts of subsidies for fossil fuels (not including nuclear) as compared to those for renewables.

* The ‘resource curse’ refers to the stunting of economic growth by point-source extractive resource revenues and is explained in the next section (section “Economic and social consequences of the globalized oil & gas industry”).
** The amount of damages that were caused by the effects of huge extraction point-source revenues to the economies of developing nations have not yet been estimated.
Producer subsidies
Producer subsidies for the exploration of oil, gas, and coal have been estimated to be about $90 billion in the G20 nations in 2013. Reference Bast, Makhijani, Pickard and Whitley35,36 Another study found that the top 10 EU member states (by GDP) have allocated at least €78 billion to fossil fuel production subsidies over the last 13 years. 37 The $5.1 billion in national exploration subsidies provided by the US in 2013 was almost double the 2009 level. The UK has been providing subsidies, of up to $1.2 billion a year, for offshore and unconventional gas and oil exploration. The subsidies of governments to their own state-owned oil & gas enterprises ranged from $2–5 billion in Russia, Mexico, India, $9 billion in China, $11 billion in Brazil, to $17 billion in Saudi Arabia, totaling $43–52 billion. Reference Bast, Makhijani, Pickard and Whitley35
Since the beginning of the nuclear age, the American government has subsidized uranium mining, milling, and enrichment as well as fuel fabrication for the dual purpose of developing both nuclear weapons and nuclear energy capability. There are three main types of subsidies for uranium fuel production in the US that come from the ‘depletion allowance’, the permission to extract minerals from public lands without royalties, and insufficientFootnote ** requirements for post-mining restoration. Reference Koplow38 The depletion allowance is a subsidy for investments in depletable resource extraction, and is estimated to have amounted to about $25 million per year for companies operating in the US in the general period between 2000 to the present. The US Mining Law of 1872 allows ‘hardrock’ minerals, including uranium, to be extracted from federal land without royalties, and allows the user to privatize the land for only a few dollars per acre. Reference Koplow38
Subsidies through ECAs
ECAs are publicly financed banks, (in both OECD and non-OECD countries) that use taxpayer money to provide government-backed loans, guarantees and insurance to support their home industries to carry out projects overseas that are too risky for commercial underwriters. Reference Ilias39 The global association of ECAs is the ‘Berne Union’, which, collectively in 2013 insured $1.9 trillion of exports and foreign direct investment (more than 10% of international trade), and indemnified $4.5 billion to exporters and investors, protecting them from losses suffered due to buyer defaults in all regions of the world. 40 Indeed, the entire myopic focus of these activities has been on the benefit of exporters and investors, to the detriment of the people and environment of the host countries, and without the public consent of the funding taxpayers. 41
The total global government-backed export support in 2013, as estimated by the Ex-Im Bank, was 286 billion USD. Oil & gas and power plant projects account for about 20% of Ex-Im Bank's portfolio. Reference Akhtar42 If the portfolios of other ECAs are similarly diversified, then about 60 billion USD are spent by ECAs on subsidizing oil & gas and power plant projects each year.
One example of an ECA funded oil & gas project is the construction of the Baku–Tbilisi–Ceyhan oil pipeline from the Caspian Sea oilfields in Azerbaijan, through Georgia to the Turkish coast near the city of Ceyhan. The pipeline is owned and operated by a consortium of oil companies, with BP having the largest stake. Construction was started in 2002, and in 2003 Amnesty International rang the bell with a report stating that the mechanisms for protecting human rights were being systematically undermined. 43 A report from a fact-finding mission was conducted by NGOs in 2004 and corroborates claims of human rights abuses, including infringement of labor laws, insufficient or lack of compensation for appropriated lands, repression of dissent, corruption, falsification of documents, silencing of the press, destruction of environment and infrastructure, and paramilitary coercion. Reference Marriott and Minio-Paluello29,44
More recently, Baku's city center has been undergoing a multi-billion dollar ‘face-lift’ with the construction of high-rent innovative buildings designed by Europe's best architects and funded with oil profits. The sudden oil wealth has reached only the select few. While the cost of living in the city of Baku is similar to that of most Western European cities, the average monthly Azerbaijani salary is not more than 350 euros per month. The countryside is still deeply underdeveloped with 42% of rural residents living below the poverty line. Apart from the export of oil and gas, no other industrial sectors have prospered and become competitive on world markets. Reference Rousseau45 In Transparency International's 2015 Corruption Perception Index, Azerbaijan came in 126th out of 175 countries. 46 In a 2015 report on freedom of the press, Azerbaijan is ranked among the worst countries (162 out of 180) for freedom of the press, as courageous journalists have to choose between staying silent, leaving the country or going to jail. 47
Lawyers and NGO's have pointed out that the effective financing of these infrastructure projects by state funds (i.e., public money channeled through ECAs) carries with it obligations, under international law, to ensure human rights are safeguarded. They call for regulations that would make sure that the ECAs act in accordance with the international development goals. 41,Reference Sant'Ana48 Nevertheless, the ECA's facilitate corporate investment into situations that are too risky because of political instability or a host of other reasons. That corporations become threatened and then become entangled in human rights abuses must be due to outcomes that probably were, or should have been, considered from the outset.
Another tragic outcome of the ECA financing is that, in the event of a default on the payments for the home corporation's business activities, the debt is then assigned to the country's sovereign external debt. Sudan, for example, has a debt estimated at $43.7 billion. Because Sudan stopped servicing its debt in 1984, and because the interests on the loans are about 10% or more, the interests and penalties account for well over 80% of the total amount (i.e., ∼$35 billion). 49
Subsidies for shipping
The US Energy Information Administration (EIA) estimates that 63% of the world's oil supply travels by ship. 50 Oil tankers carrying 17 million barrels, or about 20% of the world's oil supply, pass through the Strait of Hormuz between Iran and the United Arab Emirates each day, and they are protected by the US Navy (Fig. 1). The cost of protecting oil transit has been estimated to be between $13 to $143 billion per year. Reference Plumer51,52
World oil transit chokepoints. 50
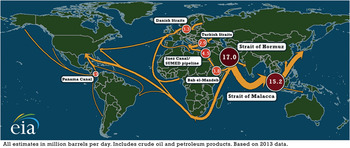
The specific costs for military protection of chokepoints in oil shipping routes is not the only subsidy enjoyed by the shipping industry. Ships servicing the oil and gas industry, including tankers, gas carriers, and offshore vessels make up about 38% of the world's international shipping fleet. International shipping has mostly evaded regulation, in what appears to be a cat and mouse game, as ships can effectively choose the rules they want to follow. Ever since 1991, the International Maritime Organization (IMO), a United Nations agency, has been faced with the challenge of regulating the international shipping industry. Like trying to carry water with a sieve, the IMO may negotiate regulations, but does not have the mandate to enforce them. Reference Strong53
The nation where the ship is registered is the ‘flag’ state, which holds the power to enforce regulations. Not surprisingly, ships are registered with nations that provide ‘flags of convenience’, those that have the softest environmental and social requirements, low taxes, cheap registration fees and least interference in the shipping business. The ship registries in Panama, Liberia, the Marshall Islands and Hong Kong account for about 50% of the world's fleet. The conditions for workers on board ships registered under flags of convenience are precarious, with very low pay, poor on-board conditions, inadequate provision of food and clean water and long working periods without adequate rest. 54
International shipping eluded the scope of the Kyoto Protocol and the climate impacts of the shipping industry have continued to grow unabated. In the EU, shipping is the only sector without a cap on emissions. 55 Most marine engines are designed to burn the cheapest fuel, i.e. residual fuels such as heavy or intermediate fuel oil. Residual fuels are the dregs of the crude oil after the lighter hydrocarbon fractions have been separated out, and therefore contain a higher concentration of sulfur, ash, asphaltenes, and metals than crude oil. Air pollution from marine engines engineered for burning residual fuels include 17–31% higher NO x emissions, 5–10% higher SO x emissions than conventionally combusted oil, as well as toxics and heavy metals. Reference Corbett and Winebrake56,Reference Merk57 Currently responsible for 3% of global annual greenhouse gas emissions (which is greater than the total annual emissions of Germany), maritime transport emissions are expected to rise to 5% of global emissions by 2050. This is not compatible with the Paris Agreement to keep global warming below 2 °C. 58 Furthermore, shipping emissions in ports have been linked to respiratory disease, coronary heart disease, and premature births. It has been calculated that shipping-related particulate matter (PM) emissions are responsible for approximately 60,000 cardiopulmonary and lung cancer deaths annually, occurring near coastlines in Europe, East Asia, and South Asia. Reference Merk57
As a long-awaited agreement on monitoring, reporting, and verification on shipping emissions makes its way through the European Parliament, it is becoming more and more watered down. The need to monitor sulfur (SO x ) emissions, as well as nitrogen oxide (NO x ) emissions has been tossed out of the proposal, which is slated to come into effect next year, despite the fact that NO x from shipping in Europe is expected to exceed all land-based sources by 2020. 59 Weak agreements appear to be the norm. The new ‘Polar Code’ regulations allow vessels with inadequate structural reinforcements for icy conditions to operate in Arctic environments, and provide no forethought of the severe irreversible effects a single oil spill would have on the sensitive Arctic environment nor measures to take in the event of an oil spill. 60,61 The hope, which had also been articulated by the European Commission, was that regulations for shipping emissions would be addressed at the Paris climate conference, but they were not included in the agreement. 62 Nevertheless, the UNFCCC and the IMO are scheduled to take the issue on at the next climate conference in Morocco in November 2016. Reference Bisiaux63 The industry estimates that implementing regulations such as limits on emissions, the Ballast Water Management Convention, and the ILO Maritime Labour Convention will cost the shipping industry an estimated $500 billion over the next 10 years. Reference Birkett64 The lax regulatory environment for international ships is clearly an economic benefit to the industry, and one that will require some enforcement mechanism to change.
Consumer subsidies
Consumer subsidies, or ‘pre-tax’ subsidies, are subsidies that lower the price for consumers and are worked out by comparing the price paid to the international market price, with the price-gap indicating the subsidized amount. The global consumer subsidies for 2013 have been calculated by both the IEA ($548 billion) and the IMF ($492 billion) to be about half a trillion US dollars. Reference Bárány and Grigonytė65 The consequences of using the fuel, especially the environmental impacts, also have a price tag and are generally paid for with public funds. The IMF figures these externalities (added to their consumer subsidies) as ‘post-tax’ subsidies. The IMF's post-tax estimation of the sum of the consumer subsidy and the subsidy for the environmental impact of the use of the fuel comes to a staggering $4.9 trillion (6.5% of global GDP) in 2013, and is projected to be $5.3 trillion (6.5% of global GDP) in 2015. Reference Coady, Parry, Sears and Shang66
Table 1 summarizes the literature on fossil fuel subsidies. Subsidies that support activities to supply petroleum fuels, called ‘producer subsidies’, are estimated to be ∼$200–700 billion per year. Reference Tagwerker34,52,54,Reference Birkett64 The total subsidy amount for fossil fuels in 2013, found by adding producer subsidies, and the amount for security measures for geo-political access, to post-tax subsidies, is in the range of $US 5.5 to $US 6 trillion dollars (Table 1). The global renewable consumer subsidies were only 22% of the consumer subsidies for fossil fuels, and the total renewable subsidies (US$ 120 billion) were only about 2% of the total fossil fuel subsidies in 2013.
Of the $5.3 trillion (6.5% of global GDP) that the IMF estimates are going to subsidize fossil fuels in 2015 for costs passed to society by environmental damage, roughly $2 trillion were due to oil and natural gas. Reference Coady, Parry, Sears and Shang66,68 The IMF limits their scope to air pollution (and not to impacts on water or land), global warming and externalities associated with road traffic. The largest share, estimated to be almost 4% of the global GDP, or ∼$3 trillion, is due to coal. Reference Coady, Parry, Sears and Shang66
Considering that roughly 70% of newly produced fuels cannot be burned, and are therefore not likely to be valued, and in view of the investments needed to transition the global society to a more sustainable energy supply, the continuation of these fossil fuel subsidies has been characterized as a ‘triple-lose’ scenario. Reference Bast, Makhijani, Pickard and Whitley35 Not only are they steering funds into fuels that cannot be burned without catastrophic climate effects, they are also diverting investment away from economic renewable energy alternatives such as solar and wind. The continued support for fossil fuels undermines the necessary upgrading of future infrastructure, which not only includes the physical infrastructure, but also the regulatory, political, and economic framework that serves institutions such as the energy market, the utility regulatory system, and the power grid, that were built with government funds. Reference Bast, Makhijani, Pickard and Whitley35
Who are the fossil fuel suppliers now?
Fossil fuels are supplied by the oil and gas industry, the coal and uranium industry, as well as banks and commodity traders.
Fossil fuel supply industrial sectors
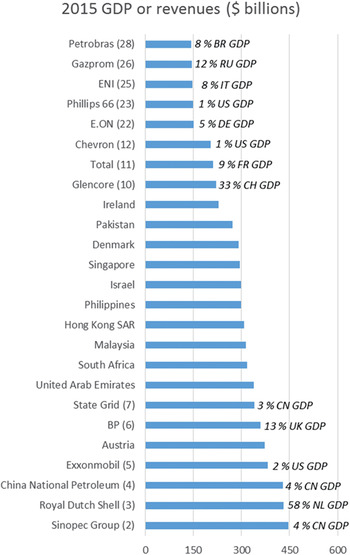
Over 100 of the Fortune Global 500 derive their business from the fossil fuel supply chain (Fig. 2). The magnitude of some of their revenues are comparable to the GDPs of mid-sized national economies, such as Ireland, Greece, Israel, and Austria. Although this is a frequent comparison, the company profits may be a better measure to gauge the level of disposable capital these corporations have at hand (Fig. 3). It must also be kept in mind, however, that multi-nationals can benefit from accounting methods to attribute profits to offshore tax havens. An inquiry into US based multinationals has found that Exxonmobil has US$ 51 billion tax-free US dollars in 37 tax havens, and Chevron has US$ 35.7 billion in 12 such non-taxed havens. Reference McIntyre, Phillips and Baxandall69 Indeed, the Fortune 500 companies have more than US$ 2.1 trillion in accumulated profits offshore to avoid US taxes. Reference McIntyre, Phillips and Baxandall69
Comparison of 11 selected national GDPs with revenues of 14 companies listed in the 2015 Fortune Global 500. 232 The Fortune Global 500 ranking of companies, starting with largest company by revenues, is shown in parentheses next to company name. The company’s revenue, as a % of home country GDP, is also given.
Annual profits of selected companies from Fortune’s 2015 Global 500 [389] ranking. Fortune Global ranking by revenues indicated in parentheses.

Many of the Fortune Global 500 from the banking sector such as (Goldman Sachs, Deutsche Bank, JP MorganChase, Morgan Stanley etc.) also control fossil fuel supply chain operations.
After the Great Depression, regulations to separate commercial and investment banking, such as the Glass–Steagall Act, were put in place in the US to limit the ability of banks to engage in the monopolistic, anti-competitive structures that were key contributors to the collapse of the stock market in 1929. Over the past decades, many of these laws have been repealed, opening up opportunities for banks. In this increasingly weakened regulatory environment, banks have found that commodities, such as fossil fuels, provide a nexus of profit-making angles. Commodities include oil, gas, coal, uranium, electricity, and CO2 allowances. Banks have commodity trading subsidiaries, as do the ‘supermajor’ oil companies, pipeline and storage operators, and power generation utilities. In 2008, PriceWaterhouse Coopers published a brochure about commodity trading in the oil and gas, power utility, and mining sectors. 70 It is premised on the observation that the ‘hard hat’ business of fossil fuel supply and power generation is increasingly intertwined with the ‘hard ball’ business of financial trading.
Banks and shadow banks
The commodity market revenues of the world's top 10 investment banks peaked at more than $14 billion in 2008. Reference Leff71 As early as 2006, a US Senate committee investigation reports that tens to hundreds of billions of dollars had been poured into commodity markets by hedge funds, private equity funds, large investment institutions, pension funds, and other investment funds over the preceding years. These non-bank financial entities, as well as corporate commodity traders are often referred to as ‘shadow banks’, because they act as credit intermediaries and undertake financial transactions, just as banks do, but without an equal level of regulation, and also without the same kind of safety-net for the global economy. 72 As more regulation of financial trading by banks was introduced after 2008, commodity trading by banks decreased and was taken up by the ‘shadow banks’. Also used as intermediaries by mega-banks, shadow banks continue to accumulate assets in shadow banking deals along the oil & gas value chain. In 2014, 52 private equity funds raised $39 billion for investments in the oil and energy sector, 20% higher than the previous year and the highest since 2008. Reference Kumar73 The side-stepping of regulations by forming nonbank entities makes the regulators' task a cat and mouse game.
Not willing to lose a competitive advantage, oil & gas companies and utilities have established banking, investment, and/or commodity trading subsidiaries. By having enormous capital assets, and by being able to access money with the privileges accorded banks, fossil fuel suppliers have been allowed much more favorable circumstances than other companies. A unit of the French power utility, EDF, purchased Lehman Brother's physical trading unit during the financial crisis, and has seen a 60% rise in its revenues since 2008. The trading unit, which has separated its financial performance from its parent group, reported pre-tax profits of almost 500 million euros in 2012. It has since expanded into oil market logistics. A key advantage for corporate trading units is that they, unlike banks, are not banned from trading with their own money. When units of BP and Royal Dutch Shell registered as ‘swap dealers’ Footnote †† in 2013, they were perceived as being in the same league as the mega-banks in terms of their derivative dealing. Corporate merchants were estimated in 2013 to account for about 40% of the U.S. oil and gas-hedging business, up from almost nothing in just a few years. The multi-billion dollar conglomerate owned by Charles and David Koch, ‘Koch Supply & Trading’, has a unit which claims to have traded the first oil swap over 25 years ago. Now it employs nearly 500 people worldwide, and promotes itself as an alternative to Wall Street. Reference Leff71 In 2013, Dr. Markus Krebber, CFO, described the German utility's trading unit, RWE Supply & Trading, as being the commercial heart of RWE, more or less as a bank's treasury function, through which all the commodity flows go. 74
Indeed, trading is present at every stage of the supply chain, and the longer the global supply chain the greater the range of trading options, as Deloitte points out. 75 In the conventional electricity supply chain, electricity customers have traditionally been a captive market. Electricity charges have been a reliable revenue stream upon which financial traders float their financial instruments. The unease comes from the idea that they manipulate these streams. Commodity traders may engage in physical operations, in which they buy the commodity at various stages in the supply chain and arrange for transportation and/or storage and/or processing in the following supply chain link, to take advantage of the most lucrative deals. Reference Pirong76 In addition, they hedge most price risks with a variety of derivative and future contract financial instruments. Reference Pirong76 Their scope of business includes contract management, export pre-financing, currency trading, and identifying interest rate differentials.
Profit motives and varieties of insider trading
In one case study of the recent US Senate investigation, Goldman Sachs purchased two open pit coal mines in Columbia with related railroad and port assets in the period 2010–2012. In addition to its longstanding coal trading operations, Goldman has been involved with producing, storing, transporting, selling, and supplying physical coal. When Goldman bought the La Francia and El Hatillo coal mines, they knew the areas around the mines were suffering from severe coal related pollution. The Columbian government had requested the company operating the mines (who continued to operate them under Goldman) to contribute to relocating the local population to a less polluted area. 77
However, it was only in Goldman's interest to take on the mines as a merchant banking venture, which means as a short-term investment that must be sold within ten years. This framing created a disincentive for Goldman to pay for long-term infrastructure investments. It is clear they did not supply the resources to adequately address the problems that occurred at those mines between 2010 and 2012, including port access problems, mine and railway closures, a mine blockade by women and children, contractor disputes, labor unrest, aggravated pollution levels, regulatory limits on mining activities, flooding, and the cancellation, postponement, and settlement of coal supply contracts. However, as a Wall Street trader, Goldman can recoup losses by betting, with a ‘short hedge’, that the coal prices and valuation of their affiliate would go negative. That is exactly what they did. The US Senate report states that Goldman offset its own losses through betting that their own mines would lose value, a ‘short coal hedge’, which gained nearly $250 million for themselves. The US Senate report remarks that the insider information they obtained by owning the mine was not public. Therefore this sort of speculation is troubling. 77 As of September 2014, the people living in El Hatillo, Columbia had yet to see any mitigation of the pollution, recompensation or relocation. Reference Acevedo78
This kind of speculation based on insider knowledge of the coal market was noted to have been carried out by other banks, including Morgan Stanley, Credit Suisse, Deutsche Bank, Société Générale, Barclays, Standard Chartered, Macquarie Group, and Bank of America (via Merrill Lynch Commodities). The US Senate report notes several instances of noncompetitive deals giving unfair advantages to banks supplying fossil fuels, including the transport of coal for Merrill Lynch commodities by its own in-house shipping brokerage, or the buying of coal by Deutsche Bank from Latin American suppliers to help specific mining companies to realize their growth plans. 77 In other words, these deals are the result of market power and nonpublic information which lock out competition.
Effect on markets and prices
The complexity of the financial instruments and the lack of transparency makes it difficult to discern the effects of financialization of the fossil fuel-to-electricity supply chain on the commodity price. Nevertheless, the degree of market abuse, from before the 2008 crisis through to the present, continues to be investigated and debated. Reference Marengo79,Reference Creti and Nguyen80 Financialization makes the market more interconnected. Trading on the materials and/or conditions from one supply chain link certainly depends on the earlier supply chain links, and, according to the nature of the deal, may also depend on the latter links. In addition, traders who trade in commodity markets often trade in equity markets. A shock in one market may provoke traders to act in another market, creating dependencies between markets. In other words financialization creates dependencies that affect ‘risk sharing’. Intensive commodity trading may be interpreted as being due to market fundamentals (supply and demand) instead of due to other financial motives. Therefore, it affects ‘information discovery’. In both of these ways, speculation is found to affect the prices of commodities. Reference Cheng and Xiong81–Reference Lautier and Raynaud83
Economic and social consequences of the globalized oil & gas industry
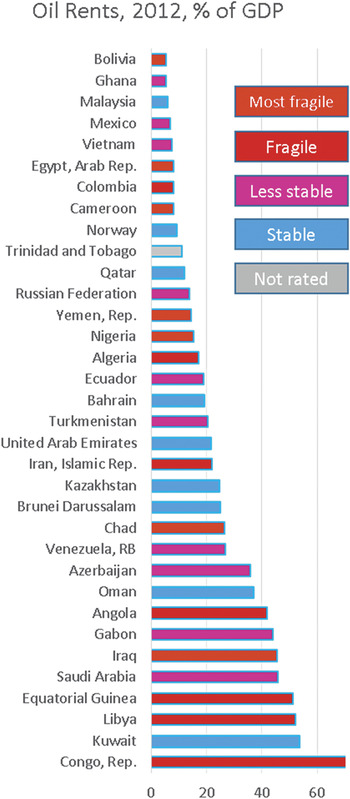
Fuels are resources that can be used to fill the needs of society. So it would intuitively follow that an abundance of these resources would lead to improved economies and more stable nations. But this is in fact clearly not the case for oil & gas resources. Of the 34 countries who are able to derive more than 5% of their GDP from oil exports, only 9 are ranked as stable nations (Fig. 4). 84,85
Economies that are highly dependent upon oil exports actually have stunted growth, as compared to economies that do not export oil. A 2012 report by the United Nations remarks that despite the fact that energy and mining sector companies are among the largest companies in the world, and have in recent years enjoyed record profits due to the increasing commodity prices, this wealth has not been shared with where these extractions occur. This lack of wealth distribution to these developing countries where most people remain in poverty is understood to be due to the fact that the extractive industry operates as an enclave in the host country with few linkages to the broader economy. They warn that the gap between the receipts of these companies and the local economic benefits is likely to widen if resource owners do not put appropriate policies in place to retain value created from the industry. Reference Sigam and Garcia86
Economic externalities of the ‘resource curse’
The observation that developing countries with an abundance of resources (i.e., mineral, and above all oil, resources) exhibit significantly lower economic growth than comparable countries without similar resources has been called the ‘resource curse’. Reference Sachs and Warner87 The extraction of mineral wealth in a developing country is often correlated with the inability to diversify and grow the economy, authoritarianism, and poor governance coupled with weak institutions, a high probability of engagement in war, and high levels of inequality in the society.
Resource wealth can limit diversification of a nation's economy. It has been observed that high exports from a single sector can cause a currency's value to increase, which renders products from other sectors uncompetitive. This is referred to as the ‘Dutch Disease’ after the experience of the decline of Dutch agriculture and manufacturing after the discovery of oil & gas in the North Sea. Reference Karl88 Economies that rely heavily on single commodity exports are subject to a much higher degree of volatility than diversified economies. Volatility makes planning difficult, and exerts a negative influence on investment, income distribution and poverty alleviation, as social spending is withheld to buffer shocks. Reference Karl88
Oil production sites are typically enclaves with high capital investment (in extraction infrastructure) within a host nation, but with weak linkages to the broader economy. The sector creates few jobs per unit of capital invested, and the majority of jobs are rarely sourced from the local economy. Reference Karl88 Unlike manufacturing or agriculture which generates smaller revenues but distributes them widely, oil revenues may be viewed as a point-source of revenues for the host nation. Reference Dolan89 Oil revenues generally go directly to the government either as royalties paid by foreign oil companies, or as taxes and profits from state-owned enterprises. These revenues give rulers the option not to tax their own people. More productive economic activities are not necessarily required and therefore not promoted, and the critical link between taxation, representation and accountability may be broken. Reference Karl90
In a developing country in which oil revenue dominates all other income, the state can become a rentier state, in which society organizes around the influx of point-source revenues, in contrast to revenues from a productive diversified domestic economy. The oil revenue flow is at the same time too large—no work could provide such rents- and too centralized, too disconnected from and unresponsive to the dynamics of the local society. Authoritarian governments have most often shown up in these situations and the diversification through productive activity ‘arising from the ground up’ is actually discouraged. In developed countries, oil revenues tend to benefit incumbent political players. Reference Ross91
Among the countries which have been identified as having the oil resource curse are: Nigeria, Algeria, Angola, Egypt, Libya, Sudan, Chad, Cameroon, the Republic of Congo, Equatorial Guinea, Venezuela, and Saudi Arabia. Reference Karl90,Reference Li92–Reference Sekumade103 Fig. 5 shows the contribution of oil revenues to the total state revenues for 7 African nations. All of these countries, except Cameroon (with 53% of state revenues from oil & gas and other minerals combined), receive more than half of their state revenues from oil exports. Even after decades of maintaining significant exports, these economies have not become diversified, Furthermore, the agricultural exports, which contributed up to 70% of the Nigerian state revenue in 1960 decreased to 2% by 2009, in an inverse correlation with oil exports. Reference Watkins and Kende-Robb104 Developing countries in Africa, such as Angola, the Central African Republic, Equatorial Guinea, Liberia and Nigeria, have been characterized as exhibiting the resource curse. Botswana is seen as an exception. Reference Chanda105
Oil revenues as percent of total state revenues in 7 African oil-exporting nations.

One of the largest producers of diamonds in the world, Botswana has had sustained economic growth since 1966. It has carefully managed revenues to avoid debt incurred during boom and bust cycles, and has consistently invested in national development projects. Furthermore, it has a functioning multi-party democracy with the lowest levels of corruption in Africa. Despite the laudable governance of resource revenues, it has not escaped all the symptoms of the resource curse because it's economy is not diversified. Indications of a low diversification are high unemployment (16–40%), attributed to the low job creation in non-mining sectors, that ∼40% of the workforce is used by the government, as well as the persistence of high inequality and severe poverty. Reference Li92,Reference Chanda105
The average annual growth rate (as % of GDP) between 2000 and 2011 for Equatorial Guinea (17%), Angola (10%), Chad (8.3%), and Nigeria (6.4%) places these nations among the world's top economic performers. Even Cameroon's growth rate over this period was a respectable 3.4%. Reference Watkins and Kende-Robb104 While the GDP reflects the number of transactions that occur within a society, it does not reflect whether or not the economy of that society blossoms or not. The GDP can be a misleading indicator of the wealth of a country. The economic activity of resource extraction typically involves foreign firms, capital and personnel so a significant value of the gains goes to foreigners. 106
Oil development is often accompanied by stark income inequality. For example, in Angola, oil wealth has transformed some prime sea-view areas in Luanda into enclaves for the elite and for oil executives, with multi-million dollar homes using electricity subsidized with oil revenues, while a short distance away are shanty towns with no electricity and a lack of clean water. State enterprises, such as the Angolan state oil company, and the country's elite are investing revenues overseas. Reference Watkins and Kende-Robb104
Lack of diversification, particularly reducing the size of the manufacturing and agricultural sectors shuts down economic opportunities for women, which worsens conditions for children. Reference Ross91,Reference Edame, Effiong and Efefiom107,Reference Easterly, Dooley and Frankel108 In 2012, the Nigerian National Bureau of Statistics reported that 60.9% of the population, almost 100 million people, were living in absolute poverty, on less than $1 dollar per day. This figure was up from 54.7% in 2004. 109 For many children the reality is harsh. In the 7 countries in Fig. 6, on average 11% of children die before their 5th birthday. Of those that remain, roughly a third have stunted growth, and about a quarter of children between the ages 5–14 are working. The average for each of these parameters is shown for all countries with very high, high, medium and low human development indices (HDI), revealing that conditions for children in these 7 African countries are among the worst in the world. 110
Conditions for children in 7 African oil exporting nations. 110

Scale, instability and secrecy
The previous paragraphs have indicated that oil revenues can be massive, and that managing the volatility that accompanies them is a strong test of governance. It has been also observed that the greater the oil wealth, the more secret the budget. These observations have been validated in an empirical analysis of 50 years of data for 170 countries in all regions of the world. Reference Ross91 Large oil revenue flows correlate with corruption. It has been reported that there have been more violations of the US Foreign Corrupt Practices Act by energy companies than by any other kind of business, including weapons trading. Reference Chazan and K. Silverstein111 Indeed, it is interesting to plot the percentage of oil exports (% GDP) next to the corruption ranking of Transparency International as shown in Fig. 7. The orange trendline relates to the corruption ranking of all countries. Interestingly, if the Islamic countries are not included, the corruption ranking trendline (light blue) is nearly parallel to the oil exports trendline (medium blue). This could be rationalized by viewing the imposition of Sharia laws as a heavy enforcement counter-measure to combat otherwise severely corrupting conditions, and improving the overall corruption picture (but not gender inequality).
Countries, with oil exports >5% of GDP 85 shown on right axis, and their ranking in Transparency International’s Corruption Perception Index, left axis. The medium blue trendline shows the trend of oil exports. The orange trendline shows the trend in corruption ranking for all countries. Interestingly, by not considering the Islamic countries, the trendline (light blue) of the corruption ranking is nearly parallel to the oil exports.
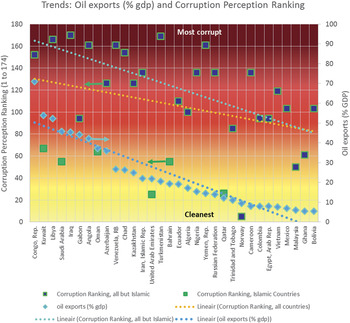
Transparency International also publishes a ‘Bribe Payers Index’, in which industry sectors are ranked according to their level of corruption. In the most recent results, the oil & gas industry was deemed to be the world's fourth most corrupt industry sector, followed by mining in the fifth place. 112 One example concerns the Société nationale des pétroles congolais (SNPC), the state oil company of the Republic of Congo. Coraf, a Congolese refinery processed 12.2% of the 150,000 barrels per day that SNPC traded in 2013, but never paid the public treasury for the oil. 113 The corruption in Congo's oil sector does not discourage Swiss traders (Vitol, Glencore, Mercuria, Lynx and Trafigura) who acquired between 27 and 36% of all crude sold by the SNPC from 2011 to 2013, for over $400 million. 113 In some cases, they earn their large commissions by doing nothing else but transferring the paperwork to an international buyer. At the end, the Congolese people are the losers of oil profits, taxes and interest on the funds that are rightfully theirs. Secrecy in global oil trading is the norm, and the international oil traders clearly collude in and facilitate the corruption. Reports have detailed that the Swiss traders are contributing to the perpetuation of a corrupt system in Nigeria, 114 Angola, 115 and others. 116
The effect of oil revenues on development has impeded economic growth
Although the literature documenting these effects is well substantiated, the authors are unaware of any study that estimates the costs of these economic externalities of oil revenues to these societies. These costs have been indicated to exist in Table 1, but an estimated amount has not been supplied.
Physical consequences of the fossil fuel supply chain
Oil & gas supply chain (Table 2)
The oil & gas supply chain is shown in Table 2. Because oil & gas are often extracted from the same wells, their production costs (capital and operations) are typically combined. Therefore, even though oil is much less used as a fuel source for electricity than gas, they are treated together because they are parallel branches in the petroleum industry. Furthermore, the family of technologies that are used to recover both conventional and unconventional petroleum fuels are considered to be under the umbrella of ‘oil & gas’ in this Viewpoint article.
Oil & gas fuel supply chain.

Exploration
Exploration for oil & gas involves moving heavy equipment into often remote, pristine natural areas. Infectious diseases have been introduced to aboriginal cultures by exploration crews and/or the impacts of the disruption to the environment, as well as the increased traffic that occurs with oil exploration activities. Population movements and rapid industrialization as a result of these activities can lead to breakdown of the aboriginal social fabric. Exploration for oil and gas is unlike that for coal, because the coal deposits are relatively well-known and not yet depleted. Reference Epstein and Selber117 Even exploration on the open ocean has significant consequences. Seismic exploration for geologic oil formations generates incredibly loud underwater sound blasts which may destabilize reproduction and survival of threatened whales and commercial fish populations. Reference Branegan118 Noise from a single seismic airgun survey, used for oil & gas exploration, can blanket an area of over 300,000 km2 continuously for weeks or months, and even penetrate through thousands of meters of ocean and hundreds of kilometers into the ocean floor. Reference Weilgart119 This noise pollution is shrinking the sensory range of marine animals, disturbing at least 55 marine species, including endangered whales as well as 20 fish species that are commercially valuable. 120 Even elusive sea creatures, such as the giant squid, have been killed by the sonic blasts. Reference Than121
Development & production
After location of an oil resource by drilling tests, an oil well must be developed and completed, during which large amounts of gas may vent to the atmosphere. The development of a well is carried out by running a specialized steel pipe down the length of the well until it reaches the oil/gas reservoir. This steel casing is then cemented into place, to support the sides and to prevent other liquids from entering into the well. Completion involves the use of a gun or explosive charge to perforate the casing and to induce the hydrocarbons to flow into the well. In addition to the act of perforating the casing, the heavy drilling liquids sitting at the bottom of the well may also block the flow. These may be ‘lifted’ by injecting gas deep into the well using coiled tubing. When unblocked, the hydrocarbons will begin to flow, often carrying with them water also from the formation, called ‘produced water’. The well must then be ‘stimulated’ either chemically, such as by using acid to create new pores in the formation, or by hydraulic fracturing (‘fracking’). Fracturing of the rock formation occurs with the high pressure injection of specialized fracking fluids, containing particles and a variety of chemicals including surfactants and biocides, and often containing methanol, lead and benzene. With time, the natural pressure of the reservoir will decrease. Then, ‘secondary recovery’ techniques are used to increase the pressure by injecting water, natural gas or other gases into the well. ‘Enhanced recovery’ techniques aim at reducing the viscosity of the oil so that it will flow. These include injecting steam, aqueous, or gaseous fluids with various chemical attributes. As they are extracted, the materials produced from the well are subject to processes to separate the hydrocarbons from the other constituents, and to ready them for transportation. In various stages of completing the well, the wellbore, and surrounding formation must be cleaned out. The solids and fluids from the well are most often stored in open-air pits, while the gases are allowed to escape into the atmosphere, or they are burned off (flared) Reference Stein122 (Fig. 8).
Map of gas flares in Nigeria. 131

Air
Use of fossil fuels in the electricity and heat sector produces about 40% of global CO2 emissions. 123 CO2, and other ‘greenhouse gases’, impair the ability of the earth's atmosphere to shed heat, causing long term effects on the earth's climate. In addition, the combustion of oil, gas, and coal emit further pollutants: volatile organic compounds (VOCs) and poly-aromatic hydrocarbons (PAHs), nitrogen oxides (NO x ), carbon monoxide (CO), sulfur oxides (SO x ) and PM (PM-10 and PM-2). Volatile organic compounds are carbon-based compounds that can easily evaporate at room temperature, like benzene, xylene or gasoline. PAHs are generally larger hydrocarbon molecules than VOCs, and semi-volatile, such as benzopyrenes. NO x can combine with moisture, ammonia, or other compounds to produce nitric acid. NO x may also react with VOCs to produce low-lying ozone or smog. CO is an odorless and colorless gas that is produced via the incomplete burning of carbon-based fuels. SO x are precursors to sulfuric acid, a main component of acid rain. Aerosols are composed of PM that are categorized according to size, with PM-10 being particles less than 10 micrometre, and PM-2.5 being less than 2.5 micrometre in diameter. NASA animations, based on satellite data, reveal how global weather patterns effectively transport CO2 and CO emissions 124 and aerosols all over the globe. 125
Gas flaring
Gas flaring is an integral part of oil & gas development and production. In areas that lack gas pipeline infrastructure (most oil development areas), it is more economic to burn off the gas rather than to build a pipeline, re-inject it into the ground or store it in tanks for eventual sale. 126 Indeed, satellite pictures (and Google Earth) show flaring all over the world. Reference Sklar127–131 The global amount of gas flared in the year 2011 was estimated to be about 140 billion cubic meters on the basis of satellite data. 129,132 Assuming a conversion efficiency typical for natural gas power plants (33%), this amount of gas would produce about 490 TWh of electrical energy, or close to the yearly electricity consumption of Germany. 133 As of 2011 Russia, Nigeria (Fig. 8), Iran, Iraq and the US flared the most gas. Iraq flared 9.4 billion cubic meters in 2011, as compared to the 7.1 billion cubic meters flared by the US. 129,Reference Elvidge134 Although flaring produces less potent GHG emissions, than venting the methane directly to the atmosphere, it is environmentally damaging and economically wasteful. Reference Salmon and Logan135
Unconventional oil production in the US at North Dakota's Bakken formation increased 40 times between 2007 and 2013, and the volume of flared natural gas in the US more than doubled between 2011 and 2013. An economic value of approximately US$ 1 billion in fuel was lost in 2012 due to flaring and the associated GHG emissions were equivalent to having an additional 1 million cars on the road. Reference Salmon and Logan135 Earthworks has reported that the Ventura County Air Pollution Control District in California has found that the following VOCs may be released from natural gas flares: benzene, formaldehyde, polycyclic aromatic hydrocarbons (PAHs, including naphthalene), acetaldehyde, acrolein, propylene, toluene, xylenes, ethyl benzene and hexane. 136
Fugitive natural gas emissions
Fugitive natural gas emissions, or leaks of methane and/or VOCs from stationary structures, such as storage tanks, processing equipment and pipelines across the whole natural gas infrastructure, is a major contributor to greenhouse gas emissions. Six different recent studies between 2012 and 2013 have confirmed that between 1 and 9 percent of the natural gas production in the US escapes into the atmosphere. 137–Reference Weber and Clavin143 For the US natural gas production in 2012 of nearly 700,000 million cubic meters (4620 million metric tons), leaks and vents allowed the equivalent of between 7000–60,000 million cubic meters of methane, equal to between 160 and 1400 million metric tons of CO2 eq to escape into the atmosphere. In other words, the equivalent emissions of between ∼35 and 300 coal power plants were due to fugitive natural gas emissions. 137,Reference Myhre, Shindell, Bréon, Collins, Fuglestvedt, Huang, Koch, Lamarque, Lee, Mendoza, Nakajima, Robock, Stephens, Takemura, Zhang, Stocker, Qin, Plattner, Tignor, Allen, Boschung, Nauels, Xia, Bex and Midgley144
Health impacts
Studies have shown links between human exposure to the oil & gas air-pollutants and mortality, cardiovascular diseases, respiratory diseases, asthma visitations and hospitalizations, reduced lung function, and lung cancer. Reference Epstein and Selber117 Air tests taken in the vicinity of US unconventional drilling sites identified 36 chemicals that may affect the sinus, skin/ear/nose/mouth, eyes or cause neurological symptoms, 21 that may induce behavorial effects or affect the brain or nervous system, and 28 that have been associated with liver or kidney damage or digestive or stomach problems, as well as 9 that may affect the heart, muscles, or blood cells. 145 PAH exposure to humans may also cause cancer, impair the development of human fetuses (embryo-toxicity), cause birth defects and/or changes to human DNA, as well as cause reproductive damage, immune system disfunction and endocrine disruption. Reference Ball and Truskewycz146 PAHs also impair the health of other mammals, birds, fish, amphibian, reptiles, invertebrates and plants. Reference Ball and Truskewycz146 Mixtures of PAH's, as would occur from combustion or spill of a fossil fuel, chemically influence each other and therefore have a different toxicology profile than its components in isolation. According to researchers in this field, the specific risks of these PAH cocktails need to be elucidated and public awareness of these risks needs to be sharpened. Reference Ball and Truskewycz146
Water, soil and agriculture
PAHs are also released in oil spills such as the Deepwater Horizon accident in the Gulf of Mexico in 2010. Chemicals are injected into the well to stimulate, or unclog, the flow of hydrocarbons, as well as in hydraulic fracturing.
Xylene is widely used as a stimulation fluid for dissolving hydrocarbon-based clogs in oil and gas wells. Reference Zoveidavianpoor, Samsuri and Shadizadeh147
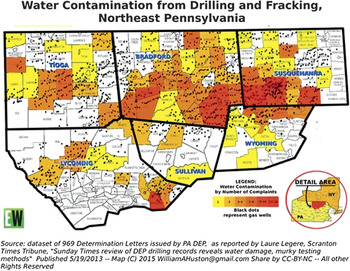
Various chemicals used in hydraulic fracturing are also contaminating ground water sources in the US. The map in Fig. 9 indicates the 969 cases confirmed by the Pennsylvania Department of Environmental Protection in which water supplies in Pennsylvania have been contaminated or reduced by oil and gas operations, as of 2013. Reference Legere148 A Congressional report 149 states that 650 different fracking fluid products contained 29 chemicals that were known or possible human carcinogens, regulated under the Safe Drinking Water act for their risks to human health, or listed as hazardous air pollutants under the Clean Air Act. Because the formulations of these products are proprietary, the ingredients are considered to be trade secrets and are closely guarded.
Water supplies in US impacted by oil & gas operations, confirmed by Pennsylvania Department of Environmental Protection in 969 cases. Source: LauraLegere, graphic by WilliamAHuston@gmail.com. Reference Fox and Ziesche237
This is a problem for diagnosing and treating patients that have been exposed to these fluids, as well as the nurses that treat them. In one report, a patient who had been severely exposed to fluids used in extracting natural gas from shale rock was admitted to an emergency room, complaining of a headache and nausea. He was immediately attended by a nurse, Cathy Behr. Because the chemical smell emanating from this patient was so intense, the emergency room was put on ‘lock-down’ with attending staff suiting up in hazardous material (Hazmat) protection suits. Upon the contact with this patient the nurse developed serious health problems which required intensive care and were diagnosed to be due to chemical poisoning. The identity of the chemicals responsible for the poisoning could not be obtained by the nurse because this was ‘proprietary information’. Reference Rafferty and Limonik150 Acute toxicity is a possible outcome for people who are in direct contact with the chemicals, by those who live close to drill pads, by emergency workers who must deal with spills, and by health professionals who care for the victims. The cases of people harmed by drilling requires further investigation. An obstacle to gathering this information is that people who file lawsuits for compensation most often must agree to confidentiality provisions as part of the settlement. Reference Rafferty and Limonik150
Ogoniland in southeast Nigeria has been encumbered with accumulating oil pollution for decades. Since the 1950's, before Nigeria's formation as an independent country, oil operations have been carried out by Royal Dutch Shell and other IOC's. Currently Shell's subsidiary, the Shell Petroleum Development Company of Nigeria Limited (SPDC) is the operator of a joint venture (the SPDC JV) between the government-owned Nigerian National Petroleum Corporation—NNPC (55%), SPDC (30%), Total E&P Nigeria Limited (10%) and Nigerian Agip Oil Company (5%). 151 Amnesty International reported on the severe contamination in 2008, and an in-depth 3 years investigation by the United Nations Environmental Program (UNEP) followed in 2011. The three-year investigation found that the land and underground water were heavily contaminated, with some of the contamination still lingering 40 years after the oil was spilled. Community drinking water contained dangerous concentrations of benzene and other pollutants, with benzene concentrations more than 900 times the World Health Organization (WHO) guideline. Contamination of the soil extended more than 5 meters deep in many areas. Most of the spill sites, alleged by the oil firms to have been cleaned, were still highly contaminated. There was also evidence of oil firms dumping contaminated soil in unlined pits. The report documents, among others, health threats from contaminated drinking water and also underlines that the special spread of the pollution may be larger than previously assumed. UNEP called for the establishment of, at minimum, a $1 billion fund for environmental restoration projects, to be financed by the Nigerian government and the oil industry. 152 No action had been taken by the oil companies, headed by Shell, and the Nigerian government on any of the agreed actions to ameliorate the situation in Nigeria as of August, 2014. 153 Additional studies document that high concentrations of carcinogenic PAHs and heavy metals are pervasive in soils as well as in commonly consumed vegetables and tubers grown in the region. Reference Nwaichi, Wegwu and Nwosu154
The Bodo community, a relatively small part of Ogoniland, had filed a lawsuit against Shell for compensation for oil spills occurring in 2008 and 2009. In January 2015, Shell avoided a High Court Case in the UK by agreeing to an £55 million settlement, in which £35 million is paid to affected individuals and £20 million to the community. Follow-up lawsuits for similar damages to local communities can be expected. Reference Vidal155
Physical effects of coal supply chain (Table 3)
Coal contributes 29% of the total primary energy supply, and is responsible for 44% of the total (2012) global CO2 emissions. For comparison, oil and gas contribute 32 and 21% of the primary energy supply, and their combustion generates 35 and 20% to the total CO2 emissions. 123
Coal supply chain.

Coal can be extracted from underground or surface mines. Underground mining is associated with a high frequency of fatal accidents, and chronic lung disease, especially black lung disease, and the emission of methane. Surface mining includes open-pit mining, strip mining and Mountain Top Removal (MTR). MTR involves using explosives to blast and excavation equipment to remove the tops off mountains, to expose coal seams and dump the resulting debris in the valleys and streams below. The debris buries streams and contaminates surface and groundwater sources with carcinogens and heavy metals. The deforestation in combination with the disruption of waterways leads to increased mudslides and flash floods. The blasts themselves can weaken infrastructure and buildings, and strain neighboring communities. A strong link between lung cancer and the PM from coal dust associated with MTR is being observed. Epidemiological evidence shows a correlation of 60,000 lung cancer cases with MTR activities in nearby Appalachian communities. Reference Mathiesen156,Reference Luanpitpong, Chen, Knuckles, Wen, Luo, Ellis, Hendryx and Rojanasakul157
Coal washing uses polymer chemicals to remove impurities before the coal is transported to power plants, and creates a by-product of water, coal debris and washing chemicals called slurry. Slurry is often stored in open pits or ponds, which have sometimes leaked or failed. Transportation of coal, by rail, truck or ship, can also release coal dust into the air. Post combustion wastes, coal ash, is also stored at dump sites, at which leaching toxic residues have been found to migrate into water supplies. Also known as fly ash, the coal combustion residue is known to contain toxic chemicals and heavy metals known to cause cancers, birth defects, learning disabilities, kidney disease and diabetes. Reference Lockwood, Welker-Hood, Rauch and Gottlieb158,Reference Epstein, Buonocore, Eckerle, Hendryx, Stout, Heinberg, Clapp, May, Reinhart, Ahern, Doshi and Glustrom159
The respiratory effects of coal combustion products (including NO2, small PM less than 2.5 micrometres (PM2.5), ozone, SO2 and mercury), can exacerbate or cause pulmonary disease (including lung cancer), cardiovascular disease, and nervous system disorders.
Coal extraction in Columbia
Like Goldman Sachs, Glencore, another giant company (see Fig. 2), mines coal in Columbia's Cesar region. The convoluted corporate structuring of, and internal transactions between, Glencore's coal mining subsidiaries in Columbia has facilitated tax evasion, absurdly low royalty payments (only 6% of operational income) to the Columbian government for the coal, as well as unfair conditions and exploitation of laborers (Fig. 10). 160 “The [Columbian] Comptroller's Office calculates that between 2008 and 2012 Glencore paid an average of only 0.9% income tax on its operational income.” 160
In 2011–2012, Glencore paid only about 6% of its operational revenue to the Columbian government as royalties for the coal. 160

The economic effect of the royalties and jobs due to mining has not benefitted Columbia. On the contrary, the regions with coal mining are the most destitute. The municipalities where Glencore conducts its mining operations, La Jagua and El Paso, have an unsatisfied basic necessities index that surpassed 64% in 1993 and grew to a more dire 75% in 2005. 160 Glencore's labor practices have been found to be not in compliance with Columbia's labor laws. 160
Despite all the concessions the Columbian government has provided for coal extraction, Glencore has been sanctioned many times by the Columbian environmental authorities for illegal dumping of toxic waste, illegal diversion and/or obstruction of water resources (including aquifers), illegal forest and plant cover removal over extended areas and coal spills, among others. Water resources used for human consumption and agricultural use have been contaminated with toxic mine tailing waste and associated chemicals, leaving high levels of arsenic, antimony, manganese, lead and other metals, and resulting in permanent ecosystem impairment and loss. The open-pit mining causes airborne particulate air pollution which affects vegetation and soils. Because of air pollution and environmental degradation, Glencore must contribute, along with Goldman Sachs and Drummond, to relocating the population of several towns near the mines it operates.
As of 2015, Glencore had carried on mining activities there for almost 20 years, during a 40 years armed conflict. To guarantee the protection and security of the mining infrastructure in the municipalities of El Jagua de Ibirico and Becerril, Glencore undertook secret cooperation agreements with the Columbian Ministry of Defense, involving contributions by the company worth more than 180,000 dollars annually. By virtue of these agreements, a military unit, the Special Energy and Transport Battalion No. 2, established a military base within [Glencore's] Calenturitas mine. From 2007 to the present, there have been at least four murder investigations against a total of 20 of the unit's personnel. Two of the investigations have concluded in a conviction of charges of crimes against humanity. 160 The third murder case did not reach trial because the time for the statute of limitations elapsed, and the fourth is still under investigation.
Like the unfortunate coal mining regions in Columbia, six coal mining counties of Kentucky, in the Appalachian region of the US, are ranked among the ten worst places to live in the US. Reference Flippen161,162 The median household income in Clay County is barely above the poverty line, at $22,296, about half the median income in the rest of the country. Only 7.4 percent of the population has a bachelor's degree, while 12.7 percent is unemployed, and 11.7 percent is disabled. 162 Coal has been the primary industry in Clay County for decades. The coal production has been in decline since the 1990's, but the economy has not yet recovered. Coal mining regions across Appalachia have elevated mortality rates. Reference Hendryx and Ahern163
Although Appalachia cannot suffer from currency appreciation due to coal exports, it is often described as presenting the resource curse, in that its resource abundance negatively impacts its economic growth. Reference Douglas and Walker164 World Bank economists recently addressed this question and showed that inequality in the distribution of resource revenues is enough to generate stagnation (i.e., the Dutch disease) in the economy even for a country with an initially higher manufacturing productivity. Reference Chisik, Onder and Battaile165 A more equal distribution of revenues, as opposed to the point-source nature of fossil resource revenues, would stimulate diversification of the local economy and apparently avert the Dutch Disease.
Physical effects of uranium supply chain (Table 4)
Uranium mining environmental impact
In conventional mining of underground or open pit mines the bulk rock containing the ore is extracted, and then ‘milled’, or crushed, and then chemically leached to concentrate the uranium fraction into a dry yellow powder of U3O8, called ‘yellowcake’. Because the mining and milling of uranium ore seeks to isolate only 0.01% of the rock, 99.9% of the extracted rock is rejected after processing. The amount of ‘tailings’, or the crushed rock that is rejected, is significant, and is roughly 80% as radioactive as the sought-after ore. In contrast, in situ leaching techniques inject water, mixed with oxygen and sodium bicarbonate, down the wells to pierce the ore formation and dissolve the uranium in the groundwater. Pumped to the surface, a processing plant separates the uranium from the sludge, or ‘tailings’ generated with this process. In situ leaching accounts for 80% of the uranium ore produced in the US at present because it is more cost effective and facilitates extraction from lower-grade ore reserves. However, evidence is mounting that these techniques result in degraded groundwater resources, which is particularly devastating in the arid regions where uranium is found. Reference Koplow38
Uranium supply chain.

Subsequent processing converts U3O8 into uranium hexafluoride (UF6), which is then enriched to concentrate (from 0.72% to the roughly 3.5%) the active isotope (U-235) of uranium. The enriched UF6 is then solidified and processed into uranium oxide (UO2), which can be used to manufacture nuclear fuel rods for power plants.
The bill for the clean-up of uranium mining is passed to the taxpayer. The cost of cleaning up the uranium mining sites is estimated to be about the market value of the uranium extracted. Reference Koplow38 In the southeastern US, uranium extraction in Arizona, New Mexico, and Utah has left severely polluted sites still needing remediation, that the US Environmental Protection Agency has designated as ‘Superfund sites’. 166 On the Navajo lands alone, a legacy of uranium contamination remains from more than 500 abandoned uranium mines, homes built with contaminated mine waste rock, and contaminated water wells.
Recent market developments: uranium, coal, oil & gas
Uranium
More than half the world's uranium production comes from just 10 mines located in Canada, Australia, Niger, Kazakhstan, Russia and Namibia, which are controlled by eight corporate entities: Cameco, Areva, BHP Billiton, Rio Tinto (with daughter Energy Resources of Australia), Kazatomprom, Rosatom and Paladin Energy. 167,233 As of 2008, a small club of 14 corporations controlled 90% of the uranium supply. 168
1984 and 1985 were the years that saw the highest number (33 in both years) of nuclear plant start-ups, just before the Chernobyl accident. Then, the number of start-ups declined sharply until 1990, the first year that the number of shutdowns surpassed the number of start-ups. Over the decade, 1991–2000, however, there were more start-ups (52) than shut-downs (30) overall. Nuclear contributed its highest share ever (i.e., 17.6%) to the global electricity generation in 1996. In the period, 2001–2014, 48 new nuclear reactors worldwide were connected, and 58 reactors were shut down. 11% of the reactors (47) currently listed as operating (435) are actually off the grid, experiencing a long-term outage (i.e., off-line ≥ 1.5 years) with minimal prospects of being restarted. As of 2014, of the 67 reactors listed as being under construction, 9 have been under construction for between 12 and 20 years, and 49 have already experienced significant (several months to several years) construction delays. Only 18 were either started within the past 3 years, or have not yet reached the project start-up date. Over 70% of the new reactors (48) are in 4 countries: China, Russia, India and S. Korea. Reference Schneider and Froggatt169
Nuclear power generation reached its peak in 2006, when there was ∼360 GW installed capacity producing 2660 TWh of electrical energy, even though the number of operating units had already been in decline since 2002 (when 437 reactors were operating). The price shot up in 2007 (Fig. 11) apparently due to concerns about supply meeting demand, in conjunction with a belief that nuclear power would rise as a noncarbon emitting power source, a notion that was certainly more credible then than it is today. In 2010, large nuclear power developers, e.g. Areva, were again actively promoting the eventuality of a nuclear renaissance. Reference Grancea and L. Grancea170 In both 2007 and 2010, the resurgence of nuclear power did not happen. Reference Fernando171 In the past few years, some have promoted that nuclear fuel and technology will become more relevant to the global energy supply. Reference Kidd172 In Europe, the test case for the ‘mini’ nuclear renaissance is the Hinkley Point C plant in the UK which has been in the planning since 1998, but due to the many troublesome aspects of the technology, it is still not certain to go ahead. It would deliver the most expensive electricity on the system, requiring subsidies of roughly £17.6 billion. Reference Schneider and Froggatt169 The necessary funding for the final stages needs to be extended by EDF, which is currently in the red. 173
Uranium price history from 2005 to 2015. 238
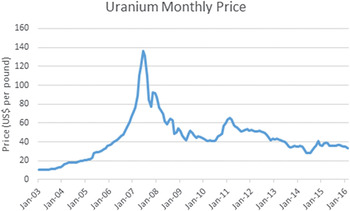
The shut-downs in the nuclear industry; however, have allowed for uranium fuel to be stockpiled. With nuclear power now only generating 10.3% of the global electricity generation, and with analysis showing that uranium supply will be in surplus until at least 2021, it is hard to believe that any change in the price will not be due to pure speculation. Reference Koven174 Between 1995 and 2005, the price of uranium never topped $20 per pound, not least because uranium fuel is highly subsidized, and the subsequent movements in the price were apparently speculative bubbles. Uranium prices are, at the end of the day, a very small cost factor in the overall economics of nuclear plants, which are being roundly outcompeted in a host of more important criteria such as overall cost, flexibility, and build times, as demonstrated by the Hinkley Point C project.
Coal
Research that delved into more than half of the coal development investments between 2005 and 2014 (i.e., the funding of 52% of the coal mining industry and 53% of the coal power industry projects) identified and inventoried the involvement of banks in facilitating funding. Only 20 commercial banks were responsible for channeling 273 billion euros (367 billion dollars) into coal projects, or 70% of the funding examined in the study (which covered investments totaling $500 billion). Since this study only examined half of the overall funding, this suggests that the total expenditure during these nine years was on the order $1 trillion, and it does not include the huge investments in coal transportation that accompany coal mining expansion projects around the world. 175 Financing of coal projects has increased by 360% since 2005, the year that the Kyoto Protocol entered into force. 2013 was a record year for coal finance, with commercial banks providing more than $88 billion to the main 65 coal companies. 175 In 2014, global investment for coal held steady at US$ 141 billion, as compared to $145 billion in 2013. 176 Recent announcements by JPMorgan Chase, Bank of America, Citigroup and Morgan Stanley, however, that they are shifting investments away from coal may confirm the 2015 Paris Agreement as a turning point. Reference Corkery177
The price of coal has decreased by 40% since 2011, reflecting a slowing in demand (due to competition from other energy sources and energy efficiency, and regulations to limit air pollution). China has accounted for over four-fifths of global coal consumption growth, half of which is thermal coal used predominantly to fuel China's coal-fired fleet of electrical power generating stations. Reference Sussams178 As a response to the growing coal pollution in major Chinese cities, the Chinese government has decided to limit coal use. China's Premier Li Keqiang said, in a statement to parliament, that the goal is to limit the growth in coal consumption in key areas that are affected by severe smog, regions where conserving energy is difficult, and in industries with overcapacity, and replace coal with alternative energy sources. Reference Green179 Chinese imports of seaborne coal dropped 31% in the first 8 months of 2015, as compared to the previous year. 180
Despite the slack in demand, the supply of coal continues to grow as projects, that were undertaken during the last few years when coal prices were high, begin to produce. 181 A survey of 83 coal companies shows that they have increased their combined net fixed assets by $214 billion since 1990. 181 Miners from Colombia to Australia maintained output as prices fell for a fourth year in 2014. Despite continued losses, Peabody Energy Corporation, one of the world's largest coal producers, increased extraction from the US Powder River Basin mines, and is expected to soon file for bankruptcy, following other large coal companies such as Arch Coal, Alpha Natural Resources, and the Patriot Coal Corporation. Reference Goldernberg182,Reference Corkery183 Despite the bankruptcies, the stockpiles of coal held by US utilities (∼100 million tons) threatens to depress prices for years. Reference Parker184
The strategy has been for the main mining industries, those with highest volumes and lowest production costs, to keep producing and push more expensive producers out of the market. Reference Vitelli, Sharples and Parker185 Investors have watched the valuation of coal investments drop by over 50% between August 2009 and August 2014. Figure 12 shows that the value of coal, as shown by the Bloomberg Global Coal Index, which tracks the share prices of 32 large coal producers, is not following two other indices, namely the MSCI World Energy Index, which is heavily weighted toward oil and gas companies, or the more general Morgan Stanley Capital Index (MSCI) World Index. 181 Investors would benefit from a reduction in supply and a divestment of capital assets of over-extended companies. Reference Vitelli, Sharples and Parker185 In both the coal and oil & gas sectors, market mechanisms are underway to further concentrate the industry: the price wars are knocking out projects requiring ‘artificially’ high minimum prices to be viable. Players that are more diversified and/or have deeper pockets will survive.
Bloomberg Global Coal Index does not follow the MSCI World Energy Index or the more general MSCI World Index, but rather declines significantly over the period between August 2009 to August 2014. 181
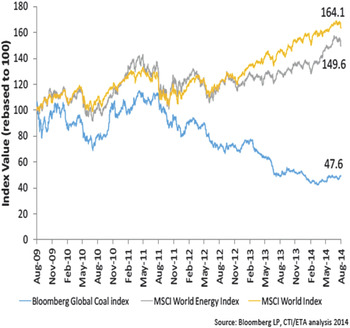
Oil & gas
How much oil and gas is there?
Of the total 47,500 oil fields on record in 2006, only 507 (1%) were giant fields, and were responsible for 45% of all crude oil. Reference Klare186 Historically, the world's oil production has been dominated by 10 giant (conventional) oilfields, which produced 20% of the crude oil in 2007: six in the Middle East, two in Russia, one in Mexico, and the last in Azerbaijan. 187 Despite an increasing demand for oil, conventional production remained flat since 2005. Reference Mearns188–Reference Aleklett190 Consistent with the fuel companies' financial driver to replace reserves, a growing energy demand has been projected by a variety of institutional and industry forecasts. For example, the IEA has asserted that the energy supply will need to grow by ∼40% by 2040 67 (more recently, estimates of demand growth have been revised downward to reflect the halving of demand growth between a 5-year high in the 3rd quarter of 2015 to a 1-year low in the 4th quarter 2015 191 ).
Even though they are more expensive to recover because they are in the most remote and uninhabitable places on earth, unconventional oil & gas sources, such as tight oil, shale gas, oil sands, natural gas liquids, and deep-water or Artic oil & gas reserves, were seen as the answer to a falling conventional supply. The high price of oil (up until mid-2014) made these efforts appear to look like good investments.
BP's chief of exploration and production proudly stated their technical ability to extract and develop petroleum reserves in the most hostile environments on earth. Footnote ‡‡ To put this in perspective, a conventional oil rig at the Azeri–Chirag–Guneshli (ACG) oilfield in Azerbaijan is likened to a space station. The seven thousand tons of components and machines, built all over the world, needed for one oil rig are assembled near Baku, before they are launched into their deepwater positions with the aid of satellites. Footnote §§ The overlap between the technology used for oil rigs and space stations is not just a metaphor, it is also the focus of a proposed recent research agenda which seeks to apply space technology strategies to the maintenance of oil & gas assets in remote or extreme places. Reference Perrons and Richards192
The idea to increase reserves relies on setting up these massive processing stations to produce oil from the depths of the sea and at the polar icecap, where the US Geological estimates that 20% of the world's undiscovered oil lies. 193 These extreme conditions require additional engineering designs to keep the equipment operating at ever greater pressures and lower temperatures. Ultra-deep wells, drilled in water at least 1.5 km deep, and often into several more kilometers of rock to the reservoir below, accounted for around half of all the world's new discoveries in the first half of 2012. Reference Callus and Hays194 Unconventional oil & gas resources present other challenges. Hydraulic fracturing (‘fracking’) of tight oil and gas, despite operating in inhabited areas, also requires more wells and extensive production operations than conventional oil & gas resources, including greater energy and water consumption, closer well spacing and service traffic. 195
Vast amounts were spent on finding new oil and gas in 2014 when the price of oil was still high. Compiled by the US Energy Information Agency (EIA) in Fig. 13, the upstream expenditures grew on average by 11% per year, or a total of 450% between 2000 and 2012. 196 Even with the increased funding, production did not increase but rather decreased by 6% between 2006 and 2012 Reference Weijermars, Clint and Pyle197 (Fig. 15). Barclays estimated global exploration and production (E&P) spending would reach a new record of $723 billion in 2014, up 6.1% from $682 billion in 2013. Reference Addison239 Up to 2000, major oil companies could spend half their capital on upstream activities and be able to replace the reserves depleted by production. In 2014, they were spending ∼80% of their capital on upstream activities. Reference Weijermars, Clint and Pyle197 Footnote *** It looked like the rising cost of hydrocarbon extraction would be able to be supported by oil prices above $100/barrel, but it was already acknowledged that replacing reserves would be challenging. Reference Weijermars, Clint and Pyle197 An oil price of at least $60/barrel would be enough to double the estimation of US petroleum reserves (by including now economic unconventional sources). $90/barrel would triple them. Reference Slaughter198
Exploration and production expenditure of 42 oil & gas companies. 196

Brent crude oil price ($/bbl) from 2000 to January 2016. Source data: EIA. 236
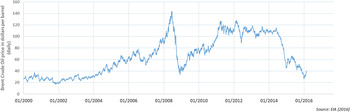
Rig count for US unconventional oil & gas fell by 39% by the end of Feb. 2015. By March, 2016 the number of rigs had decreased by 75% since the peak in Sept. 2014. 52
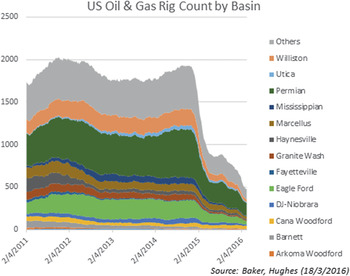
Demand for oil has slowed due to global economic weakness, tougher fuel economy regulations, more installations of renewable energy, and increasing energy efficiency in general. Unconventional production, especially hydraulic fracking of tight oil, doubled US production between 2010 and 2013. This was the largest supply, globally, of new petroleum liquids since 2008, and it led to an oversupply in the market. Reference Slaughter198,Reference Doshi and Corrigan199 The success in the US production led to the idea that the tight oil resources around the world should be developed by US companies. Reference Webster200 Analysts found that prices between $60–$100/barrel would allow development of tight oil resources in Russia, Argentina, China, North Africa, Mexico, Australia, Columbia, Algeria and Brazil. Reference Webster200 American global energy experts suggested that America preempt OPEC's dominance over the oil market. Reference Nocera201 Footnote ††† Then they asked OPEC to cut production to keep prices up. OPEC decided in mid-2014 against shoring up prices artificially, with the motive of maintaining market share. This decision caused oil prices to fall by about 50% in the second half of 2014, after a four year period of stability at about $105/barrel Reference Bank202 (Fig. 14). In the context of the developing issue of climate change as well as the growing fossil fuel divestment movement, analysts in 2014 pointed out that the Saudi decision may have even taken into consideration the contingency that fossil fuel reserves may eventually be rationed. Reference Prudent203
Gas prices are also affected by the downturn in oil prices. Asian gas contracts are directly linked to oil prices. In the U.S. and European markets, there is an indirect relationship between oil and gas prices. Footnote ‡‡‡, Reference Martén and Jiménez234
At less than $60/barrel, unconventional sources of oil and gas are not competitive. The Brent crude oil price has mostly been below $60/bbl since December 2014, with the resulting collapse of many tight oil development projects. 204,Reference Tully205 Unlike conventional wells that tap relatively large petroleum reserves that produce for 20 years, horizontal wells into tight oil reserves generate far less and are, on average, largely depleted within three years. 206 The EIA suggests that the average depletion rate for a tight oil well is 50% over three years, but other sources suggest that the depletion rates, over the first year, are between 65 and 90% for both tight oil and shale gas. Reference Sandrea207 Either way, shale oil producers need to constantly drill new holes. Reference Cunningham208 The North America rig count declined by 39% in the first months of 2015. As of March, 2016, the number of total producing rigs has decreased by 75% since a peak at the end of Sept. 2014 Reference Hughes209–215 (Fig. 15).
The Standard & Poor's index of 80 oil and gas exploration companies peaked in June, 2014, and has since then lost 2/3rd of its value. It has been the most significant change in valuation since the crisis in 2008–9 (Fig. 16). The number of rigs in the Gulf of Mexico declined by 75% between the middle of 2014 and March, 2016, consistent with the estimation that a price of $80/bbl (WTI) is needed to ensure the viability of most deepwater developments. Reference Adeosun216,217 Although there are benefits to consumer countries, and losses to producer countries with the current low fuel prices, it is not expected to be a long-term condition. Volatility is expected to be the ‘new normal’. 218,Reference Klevnäs, Stern and Frejova219
The valuation of 80 oil and gas exploration companies by Standard & Poor, 2016. 235

Dangerous market conditions will allow only the most endowed corporations to survive, putting pressure to consolidate on an already concentrated industry. The still-producing conventional fields continue to be economic at lower prices. Saudi Arabia will lose some income from the reduction in prices, but it is only a fraction (17%) of the revenue it will receive (Fig. 17). Furthermore, it has the world's third largest sovereign wealth fund which can insulate it from short term price instabilities. 220 According to the official documents, Saudi Arabia's returns are significantly lower than other funds (up to 10%), i.e., no more than 2–3%, because much of the money was invested in US Treasury Bonds. One might wonder why Saudi Arabia would not arrange higher returns, as was done by US university endowments, when they shifted their investments away from the US Treasury bonds decades ago. Reference Piketty223 Saudi Arabia and the United States have maintained close security ties since the 1940's. Reference Blanchard222 Speculation has suggested that economic, including military trade, arrangements have become entangled with diplomatic relations. Reference Piketty223
EIA illustration of economic security of Saudi Arabia. 231
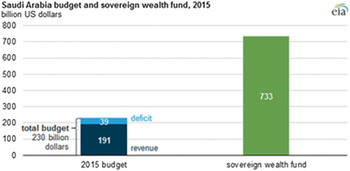
Discussion
The oil & gas supply chain was forged by companies who capitalized on a special relationship with government. Because the strategic importance of oil & gas was recognized after WWI, dominating international alliances enabled Western oil concerns to create states within states, and to occupy extraction areas effectively as their own colonies. Legacy issues, such as the market control through a cartel, the resolve for resource nationalism, and the support of national security apparatuses still linger. The fossil fuel business has historically depended on anti-competitive practices, and functioned through cartel arrangements. The cartel agreement between the major oil companies, entered into before WWI, was subsequently challenged by the OPEC cartel, which evolved as oil-producing states nationalized their reserves. Historically, and continuing through to the present day, fossil fuels have received massive subsidies.
Currently, fossil fuels are supplied by investment and industry entities, that figure in the Fortune Global 500 listing of the world's largest corporations, with revenues on the scale of nations. The fossil fuel business is obscured by a financialized fabric of banking, development and trading deals. US Senate investigations have revealed that this allows for integration of the supply chain through noncompetitive dealing.
The financialization of the supply chain ensures that short-term profit for traders occupies a priority position in the motivations for directing flows through the supply chain. Moreover, short-term profits for shareholders are a dominating priority for corporate management boards. With this decision-making structure, any considerations other than profit are an afterthought. The physical movements of materials in supply chains are manipulated to deliver the greatest profit by remote highly digitized traders.
Unfortunately, the fossil fuel supply chain has devastating social, economic and physical consequences. Revenues from fossil fuel development are so large and come to so few hands that they may not lead to widespread economic growth, as has been evident after many decades of oil development in developing countries. Indeed, oil development has coincided with the shrinking of other economic sectors in these nations. Not only do massive fossil fuel revenues inhibit the diversification of an economy, they bring with them troubling issues associated with instability and secrecy.
The fossil fuel supply chain is responsible for heavy pollution which lowers the living conditions of neighboring communities, in both developing (e.g., Columbia) as well as developed (e.g., Appalachia, Pennsylvania) countries. Although this is well-known, the encroachment of unconventional oil & gas recovery into residential areas in the US has renewed awareness of its damaging health effects. In addition, the persistence and extent of long-standing contamination sites were often underestimated, as is the case in Nigeria.
Now the markets for uranium, coal and oil are over-supplied, and the price is going down. Nevertheless, the fossil fuel companies have not followed market signals, but have continued to oversupply the market. The spate of coal company bankruptcies, and the very recent shift of banks away from coal financing may indicate that the Paris Agreement was in fact a turning point for the supply of coal. It is not clear how things will materialize for the oil & gas industry, which has access to so much capital.
From an empirical history of the concentration of wealth in the world, it has been observed that the rate of return on (large amounts of) capital, (i.e., up to 10%), is currently 2–3 times the growth rate of global GDP (about 3%). Reference Piketty223 The management of capital can provide a higher rate of return than the operations business of extracting and selling fuels. While these accumulations of cash may help to insulate the entity from unforeseen events, they also may isolate the entity from engaging on a level playing field in democratic political or market contexts, which is important for informed judgments about what the best business decisions are, from any other point of view than that of increasing returns.
The disturbing revelation that large piles of capital can accumulate about 3 times faster than an economy can grow means that the distribution of wealth in society can easily become persistently and highly concentrated. Reference Piketty223 This is a destabilizing force that can threaten the values of social justice upon which democratic societies are based. Reference Piketty223
Highly financialized sectors are able to have an influence on the degree of regulation and tax structure they are subjected to. Public authorities often respond to poor stock market performance by creating regulatory environments favorable to business. Even more direct policy action can be gained by steering financial flows on bond markets, which are markets for government debt. Highly financialized sectors with capital flows large enough to be significant on the national level can wield influence over public policy through financial interactions with bond markets. Reference Prosser224 In addition, the current global trade system ensures unimpeded global capital flows allowing large companies to mobilize operations ‘off-shore’ at will. At least their threat to move to another country needs to be taken seriously. Reference Prosser224 Regulations have yet to definitively grasp a real handle on the problems accompanying global finance. Reference Bieling225,Reference Rodrik226
The Nobel prize winning economist Joseph Stiglitz explains that increased financialization of the economy creates more inequality. Reference Stiglitz227 Jamie Galbraith has also shown that larger financial sectors are linked to more inequality through the deregulation of economic sectors and through subsidies. Not only did these measures grow the financial sector, but they enhanced its ability to move money from the poorest to the richest. Reference Stiglitz227,Reference Galbraith228
Because of its emphasis on creating short-term profits with its ability to influence regulations and move capital, financialization is considered to have the potential to destroy the social safeguards for, and rights of, working people. Reference Prosser224 A hallmark of the current global economy is that trade clashes with the ability of governments, at the national level and below, to maintain societal and environmental standards. Dani Rodrik calls globalization in its current highly unregulated form “hyper-globalization”, and argues that it cannot co-exist with both nation states and democracy. He then sees two options: a global government able to regulate global trade, or limiting global trade so national governments are able to regulate it. He reasonably asserts that a global democratic governance in which all nations participate in a unified government is not currently attainable, so we must choose nations and democracy and find a new way to handle globalized trade. The nation must be able to exert barriers to trade to establish democratically determined standards for society, otherwise globalization will repeatedly bypass important civic standards in a ‘race to the bottom’. Reference Rodrik226
Financialization has drained sources of finance for real investments in capital stock and infrastructure. The availability of easy credit to promote debt-financed consumption has been distracting. It has taken away the attention on how a lack of investments in the real economy can depress it. Reference Hein229
Financialization and globalization, as currently practiced, and industry concentration threaten civil and democratic economic governance of one of the most central pillars of society, an energy supply. The ability of a nation to steer the growth of its economy by setting an industrial policy, to protect the growth of domestic industries, or introduce requirements for domestic components, is necessary to diversify an economy. Reference Chang230 On the other hand, the current globalized economy puts pressure on manufacturing to leave developed nations. This was a significant contributor to Europe's loss of its PV manufacturing sector.
Being able to generate electricity without any fuel means that the generation costs only depend upon the costs of installing a system. Consequently, the price of electricity is then fixed for the duration of the system's life, unlike the economics of electricity that depends on fuel whose price is subject to the volatile, complex, and unpredictable movements in commodity markets. Furthermore, by not requiring fuels and operating from local resources, wind and solar will never demand the same kind of trade-off between economic interests and environmental health and safety that fossil fuels do. In addition to the price stability, renewables do not exert economic or social pressure on politically unstable regions of the world to increase industry reserves of fossil fuels. Furthermore, the economic value creation from renewables is widely distributed throughout society, in contrast to the proceeds from fossil fuel extraction. While the economics of fossil fuel extraction align and reinforce the globalized financial flows that are creating increasing inequality and loss of local and national political influence, the broad ownership opportunities and bottom-up investment presented by a local, renewable, secure energy source may be viewed as an investment in peace and democracy (see companion article).
Conclusions
To avoid limited frames of reference when considering the value of renewables as compared to fossil fuels, here are three thoughts to keep in mind.
-
(1) The fossil fuel industries have never operated as competitive product industries. They have enjoyed government subsidies, advantages, and protections since WWI, and continue to receive them today. The advantages of capital and financialization allow them to carry out business in noncompetitive ways and gives them options for side-stepping regulations.
-
(2) The fossil fuel supply chains exert multiple physical, social and economic injuries on the environments that carry them. These impacts have persisted over decades and continue to encroach upon us. The true cost of fossil fuels which includes the costs of these damages needs to be taken into account.
-
(3) The financialized economy is for most of us a virtual economy, except for the fact that wages are not growing as they used to. As fossil fuel development generates point-source revenues, they align with, and do not balance, the financialized economy. The real economy would benefit from sectors able to deliver distributed value creation.
Acknowledgments
We acknowledge the graphic by William Huston (WilliamAHuston@gmail.com) showing the water contamination data from the Pennsylvania Department of Environmental Protection, obtained by Laura Legere, Scranton Times Tribune. The authors gratefully acknowledge the valuable comments of the anonymous reviewers and editors.


