


INTRODUCTION
Recently, Knight and colleagues (Reference Knight, Harrison and Jones2019) pointed out that rock glaciers remain a poorly understood geomorphic element of the landscape, at least in part because of their polygenetic origin in combination with the numerous ways they have been studied. The literature commonly refers to two main types of rock glaciers according to their mode of origin, glacier-derived and talus-derived (e.g., Barsch, Reference Barsch1996; Berthling, Reference Berthling2011), whereas landforms generated by a third mode, rock avalanche-derived rock glaciers (e.g., Whalley and Azizi, Reference Whalley and Azizi2003), are largely ignored.
Talus-derived rock glaciers are considered indicative of periglacial conditions with permafrost (e.g., Barsch, Reference Barsch1996; Kääb, Reference Kääb and Elias2013). Ice formation within pre-existing talus accumulations, followed by downslope creep and deformation of the ice core and interstitial ice creates characteristic lobe shapes—talus-derived rock glaciers—that have high survival potential even after the internal ice disintegrates. Relict talus-derived rock glaciers are therefore a landform where reliable dating can give information about past regional climatic conditions. Dating of (active and relict) talus-derived rock glaciers ranges from relative dating techniques such as landform associations (e.g., Humlum, Reference Humlum2000), lichenometry (e.g., André, Reference André1994), advance rates (e.g., Berthling and Etzelmüller, Reference Berthling and Etzelmüller2007), differential weathering as determined by photogrammetric measurements (e.g., Kellerer-Pirklbauer et al., Reference Kellerer-Pirklbauer, Wangensteen, Farbrot and Etzelmüller2008), and Schmidt-hammer methods (e.g., Shakesby et al., Reference Shakesby, Matthews and Owen2006) to numerical methods such as 14C dating of organic material from the ice core (e.g., Haeberli et al., Reference Haeberli, Kääb, Wagner, Mühll, Geissler, Haas, Glatzel-Mattheier and Wagenbach1999; Konrad et al., Reference Konrad, Humphrey, Steig, Clark, Potter and Pfeffer1999), 14C dating of lake sediments affected by rock-glacier meltwater (Paasche et al., Reference Paasche, Dahl, Løvlie, Bakke and Nesje2007), Schmidt-hammer calibrated-age dating (e.g., Matthews et al., Reference Matthews, Nesje and Linge2013), surface-exposure dating of coarse debris using in situ cosmogenic 10Be (e.g., Ballantyne et al., Reference Ballantyne, Schnabel and Xu2009; Hippolyte et al., Reference Hippolyte, Bourlès, Braucher, Carcaillet, Léanni, Arnold and Aumaitre2009; Cossart et al., Reference Cossart, Fort, Bourlès, Carcaillet, Perrier, Siame and Braucher2010), in situ 36Cl (Çiner et al., Reference Çiner, Sarikaya and Yildirim2017), and luminescence (optically stimulated luminescence and infrared stimulated luminescence) techniques on sand-rich horizons (Fuchs et al., Reference Fuchs, Böhlert, Krbetschek, Preusser and Egli2013). Optically stimulated luminescence dating of rock surfaces (e.g., Sohbati et al., Reference Sohbati, Murray, Chapot, Jain and Pederson2012) does not appear to have been applied to talus-derived rock glaciers yet.
Ottadalen in southern Norway (Fig. 1A, B) is located inside the margin of the Younger Dryas (YD) ice sheet. Lobate, coarse rock-debris accumulations are found in Øybergsurdi beneath the south-facing wall of Øyberget (Fig. 1C, D) in upper Ottadalen. These features are not included in the regional rock-glacier inventory presented by Lilleøren and Etzelmüller (Reference Lilleøren and Etzelmüller2011). However, Matthews and colleagues (Reference Matthews, Nesje and Linge2013) discussed whether these landforms are relict talus-derived rock glaciers or rock-slope failure accumulations and concluded that their morphology is clearly consistent with the former. This study builds on their interpretation.
(color online) (A) Map of the North Atlantic, the rectangle (dashed line) outlines southern Norway shown in (B). (B) The broken line shows the approximate position of the Younger Dryas ice-sheet margin in southern Norway (modified from Andersen et al., Reference Andersen, Lundqvist and Saarnisto1995). The oval marks the location of the study site, west of the town of Otta and east of Strynefjellet (S). J indicates the approximate location of the glacier Jostedalsbreen. The drainage direction (arrows) of river courses go through the valleys Romsdalen, Ottadalen, Gudbrandsdalen, and via lake Mjøsa to the sea southeast of Oslo. (C) Digital elevation model of the uppermost part of Ottadalen valley showing lobes along the Øybergsurdi talus slope (https://hoydedata.no/LaserInnsyn/). (D) Simplified topographic map of the uppermost part of Ottadalen valley showing the minimum extent of the Øybergsurdi talus (shaded area) as mapped from aerial photos. Locations of the boulder samples (circles) and bedrock samples (squares) are shown for the four sites Summit, Up-valley, Lobe 2, and Lobe 3 investigated in this study. The star indicates the location of the control points used in the Schmidt-hammer dating study of Matthews et al. (Reference Matthews, Nesje and Linge2013), in which Lobes 1–3 were first dated.

Three lobes were dated by Matthews and colleagues (Reference Matthews, Nesje and Linge2013) using Schmidt-hammer surface-exposure dating, yielding 10,340 ± 1280, 9920 ± 1385, and 8965 ± 1700 years for Lobes 1, 2, and 3 (Fig. 1D), respectively. A Schmidt hammer measures the surface hardness or compressive strength of a rock surface via the extent of rebound (R) from when the hammer's spring-controlled plunger hits the surface. Schmidt-hammer surface-exposure dating uses R values from surfaces of known age for age calibration of R values from surfaces of unknown age (e.g., Shakesby et al., Reference Shakesby, Matthews, Karlén and Los2011; Wilson and Matthews, Reference Wilson and Matthews2016). The early Holocene ages, however, are inconsistent with the absence of a permafrost climatic regime at the time. Two scenarios were suggested to explain the landform ages: (1) rapid early-Holocene paraglacial formation where residual glacial ice was buried by debris, or (2) a slower formation under permafrost conditions during an earlier interstadial with subsequent preservation beneath cold-based ice. In this study, we apply in situ cosmogenic 10Be surface-exposure dating to test these two scenarios. 10Be is produced in quartz exposed at the Earth's surface by interaction between the mineral and secondary cosmic-ray particles (Gosse and Phillips, Reference Gosse and Phillips2001), and the concentration of 10Be in a rock surface thus allows calculation of the duration of exposure.
Several studies have compared results obtained using the two methods (e.g., Engel, Reference Engel2007; Sánchez et al., Reference Sánchez, Mosquera and Romaní2009; Winkler, Reference Winkler2009; Wilson et al. Reference Wilson, Dunlop, Millar and Wilson2019a; Reference Wilson, Linge, Matthews, Mourne and Olsen2019b). Although both dating approaches rely on subaerial exposure, their measures of time rely on fundamentally different parameters affecting the rock surfaces (i.e., rate of chemical weathering versus production of in situ cosmogenic nuclides). This paper therefore makes a general contribution, not only to understanding the dating and formation of rock glaciers, but also to the methodology of two geochronological methods.
REGIONAL SETTING
Physical and geological characteristics of the region
Ottadalen in southern Norway (Fig. 1A, B) extends from the town of Otta in the east towards the water divide at Strynefjellet (S in Fig. 1B) in the west. The easternmost outlet glaciers of Jostedalsbreen (J in Fig. 1B), the largest glacier on continental Europe today (487 km2), are located 25 km west of Øyberget.
Ottadalen is the largest tributary valley to Gudbrandsdalen valley (Fig. 1B), and its valley floor increases from 380 m asl in the east to 450 m asl in the west. The valley has a typical U-shape with steep valley sides and over-deepened troughs. The study area (Fig. 1C, D) consists predominantly of dioritic to granitic gneisses of Precambrian age (Lutro and Tveten, Reference Lutro and Tveten1996) that dip 60° north. Boulders in the rock-glacier study sites are of local origin from the Øyberget cliff face and are mainly composed of a distinctive banded gneiss with white bands of quartz-feldspar, pink bands of potassium-feldspar, and gray bands of biotite-mica.
Prior 10Be surface-exposure ages in the vicinity have been reported by Goehring and colleagues (Reference Goehring, Brook, Linge, Raisbeck and Yiou2008) from boulders along an altitudinal transect from 1086 to 1617 m asl at Blåhø in lower Ottadalen, about 60 km east of Øyberget. They found that boulders on striated bedrock yield 10Be ages of 10–12 ka, boulders on exposed bedrock or thin till give 10Be ages of 15–30 ka, and one boulder from the summit blockfield gave a 10Be age of 25 ka. A progressive divergence between 10Be surface-exposure ages of bedrock and boulders (Supplementary data in Goehring et al., Reference Goehring, Brook, Linge, Raisbeck and Yiou2008) with increasing elevation was interpreted as reflecting cold-based, low-erosive glacier cover at higher elevations. The minimal divergence below 1300 m asl was interpreted as confirming rapid deglaciation after 15 ka. Recently, Marr and colleagues (Reference Marr, Winkler, Binnie and Löffler2019) added cosmogenic 10Be surface-exposure ages of 21 ka (boulder) and 46 ka (bedrock) to the Blåhø dataset. In addition, they report 10Be surface-exposure ages of 13 ka (bedrock) from Dalsnibba (1476 m asl), 45 km northwest of Øyberget. Again, using cosmogenic 10Be surface-exposure dating, Andersen and colleagues (Reference Andersen, Egholm, Knudsen, Linge, Jansen, Goodfellow, Pedersen, Tikhomirov, Olsen and Fredin2019) found that boulders > 1600 m asl on the Reinheimen plateau, 20–40 km east of Øyberget, give a deglaciation age around 10.5 ka (global calibration dataset, Lal-Stone time-independent scaling scheme).
Additional evidence of former cold-based, low-erosive ice sheets is found at multiple sites in the Gudbrandsdal region displaying water-deposited sub-till sediments (i.e., sediments overridden by later glaciation and hence overlain by till) of interstadial origin (see Bergersen and Garnes, Reference Bergersen, Garnes and Ehlers1983, and references therein). In upper Ottadalen, examples of such sites are located 10 km west and 21 km east of Øyberget. The overlying tills have been correlated and used to reconstruct changes in ice-movement directions during the last glaciation in Ottadalen (Bergersen and Garnes, Reference Bergersen, Garnes and Ehlers1983). Four phases are defined from the stratigraphy: (i) a glacial inception phase with down-valley (eastwards) ice flow, (ii) an early regional phase with the ice divide (culmination zone) located parallel to the regional water divide across upper Ottadalen (no lateral flow), (iii) an inland ice phase with across-valley ice flow towards the northwest, and (iv) a late regional phase with across-valley ice flow towards the northeast. Without numerical chronology of these phases, it is impossible to rule out preservation of pre-last glacial maximum (LGM) deposits.
Upper Ottadalen was ice covered during the YD stadial (12.8–11.7 ka) when the margin of the Scandinavian Ice Sheet (SIS) was located in the fjord heads to the west. Regional ice-sheet reconstructions by Hughes and colleagues (Reference Hughes, Gyllencreutz, Lohne, Mangerud and Svendsen2016) and Stroeven and colleagues (Reference Stroeven, Hättestrand, Kleman, Heyman, Fabel, Fredin and Goodfellow2016) depict how the SIS margin retreated eastwards to expose the field area between 11 and 10 ka. Outlet glaciers of Jostedalsbreen, the plateau glacier to the west, formed two prominent marginal moraines at 10.1 and 9.7 cal ka BP (see Nesje [Reference Nesje2009] and references therein). Matthews and colleagues (Reference Matthews, Nesje and Linge2013) assumed that upper Ottadalen became ice free immediately after the Erdalen Event (10.1–9.7 cal ka BP, Dahl et al., Reference Dahl, Nesje, Lie, Fjordheim and Matthews2002; i.e., at c. 9.7 cal ka BP).
Reconstructions of the total glacio-isostatic rebound in Fennoscandia indicate that upper Ottadalen has experienced a total uplift in the order of 125 m since 12 ka (e.g., Lyså et al., Reference Lyså, Knies and Larsen2008; Vorren et al. Reference Vorren, Mangerud, Blikra, Nesje, Sveian, Ramberg, Bryhni, Nøttvedt and Rangnes2008, p. 541), of which half or perhaps two-thirds occurred prior to 8 ka. The present-day uplift rate is 2–3 mm yr-1 (Dehls et al., Reference Dehls, Olesen, Olsen and Blikra2000). Upper Ottadalen has been pine dominated since shortly after the deglaciation (Paus, Reference Paus2010; Paus and Haugland, Reference Paus and Haugland2017), and pine grew at least up to 1270 m asl (present elevation) between 9.8 and 7.7 cal ka BP (Paus and Haugland, Reference Paus and Haugland2017; Paus et al. Reference Paus, Haflidason, Routh, Naafs and Thoen2019). The present-day pine-tree limit in the region is about 950 m asl.
Matthews and colleagues (Reference Matthews, Nesje and Linge2013) used temperature and precipitation data from the closest meteorological station to estimate the mean annual air temperature (MAAT) and mean annual precipitation at the elevation of the relict rock-glacier lobes (c. 520 m asl, Supplementary Table 1). The climatic normal period 1961–1990 yielded a MAAT of 1.6°C and mean annual precipitation of 295 mm (Matthews et al., Reference Matthews, Nesje and Linge2013).
Information about annual snow cover is not available as measurement records, but modelled data is available from 1 September 1957, until today via the online resource, seNorge.no (http://www.senorge.no). Weather and snow data with a spatial and temporal resolution of 1 km and 24 hours, respectively, is displayed on topographic maps. Weather data is calculated via spatial interpolation of point observations, while snow data are simulated with snow models using the weather data. Although it is uncertain how well the modelled snow data depict the actual conditions at the rock-glacier site, comparison of measured and modelled data for the nearest weather station (Gjeilo-i-Skjåk, 378 m asl) suggest that the snow data are likely to be representative (Supplementary Table 1).
The study area lies below the regional lower limit of discontinuous permafrost. In southern Norway the limit is around 1500 m asl, corresponding to a mean annual temperature of about 3°C (Lilleøren et al., Reference Lilleøren, Etzelmüller, Schuler, Gisnås and Humlum2012). Data from three boreholes 60 km east of the study area show permafrost at 1560 m asl but not at 1450 m or below (NORPERM, 2018; http://geo.ngu.no/kart/permafrost/).
Location and characteristics of the sampling sites
Application of in situ cosmogenic 10Be surface-exposure dating, not only to determine the age of relict rock glaciers but also to determine surface-exposure ages of other landform surfaces, is crucial for determining the timing of rock-glacier formation. Samples for in situ 10Be dating in this study were collected from four locations: the Øyberget summit, the up-valley site, Øybergsurdi lobe 2, and Øybergsurdi lobe 3 (Fig. 2). These will be referred to as “Summit,” “Up-valley,” “Lobe 2,” and “Lobe 3” for simplicity. Lobe 1 was not visited because of ongoing quarrying.
(color online) Overview (main photo) of Øyberget from the south, showing the locations of the sites in this study: Summit, Up-valley, Lobe 2, and Lobe 3. A clear transition from the steep cliff face to the talus slope is evident at approximately 800 m asl. Bare bedrock is exposed at the Up-valley site (A) and at the Summit (B, C) where glacially transported boulders are common. Boulders at the Up-valley site may originate both from glacial transport (boulder in the foreground, D) and rock fall activity (boulders in the background, D). The lower part of the talus slope has multiple lobate-shaped landforms, where the most prominent are Lobes 1–3. The uneven surface of Lobe 3 is shown in (E), and the slightly higher Lobe 2 can be seen in the background (photo taken from boulder F towards west, see Fig. 3). The mountain slope east (down valley) of the slope has a thick till cover (F), in sharp contrast to the Up-valley and Summit sites.

The Summit (> 1200 m asl) has a discontinuous to thin (< 0.5 m) cover of till and numerous glacially transported gneiss boulders (Fig. 2B, C). The exposed bedrock at the summit area exhibits polished quartz-rich veins and smooth glacially eroded surfaces with plucked edges. Five samples were collected and processed from the summit area (Fig. 3A–E, Table 1); of these, two were from bedrock (Fig. 3A–C) and three were from boulders (Fig. 3A, D, E).
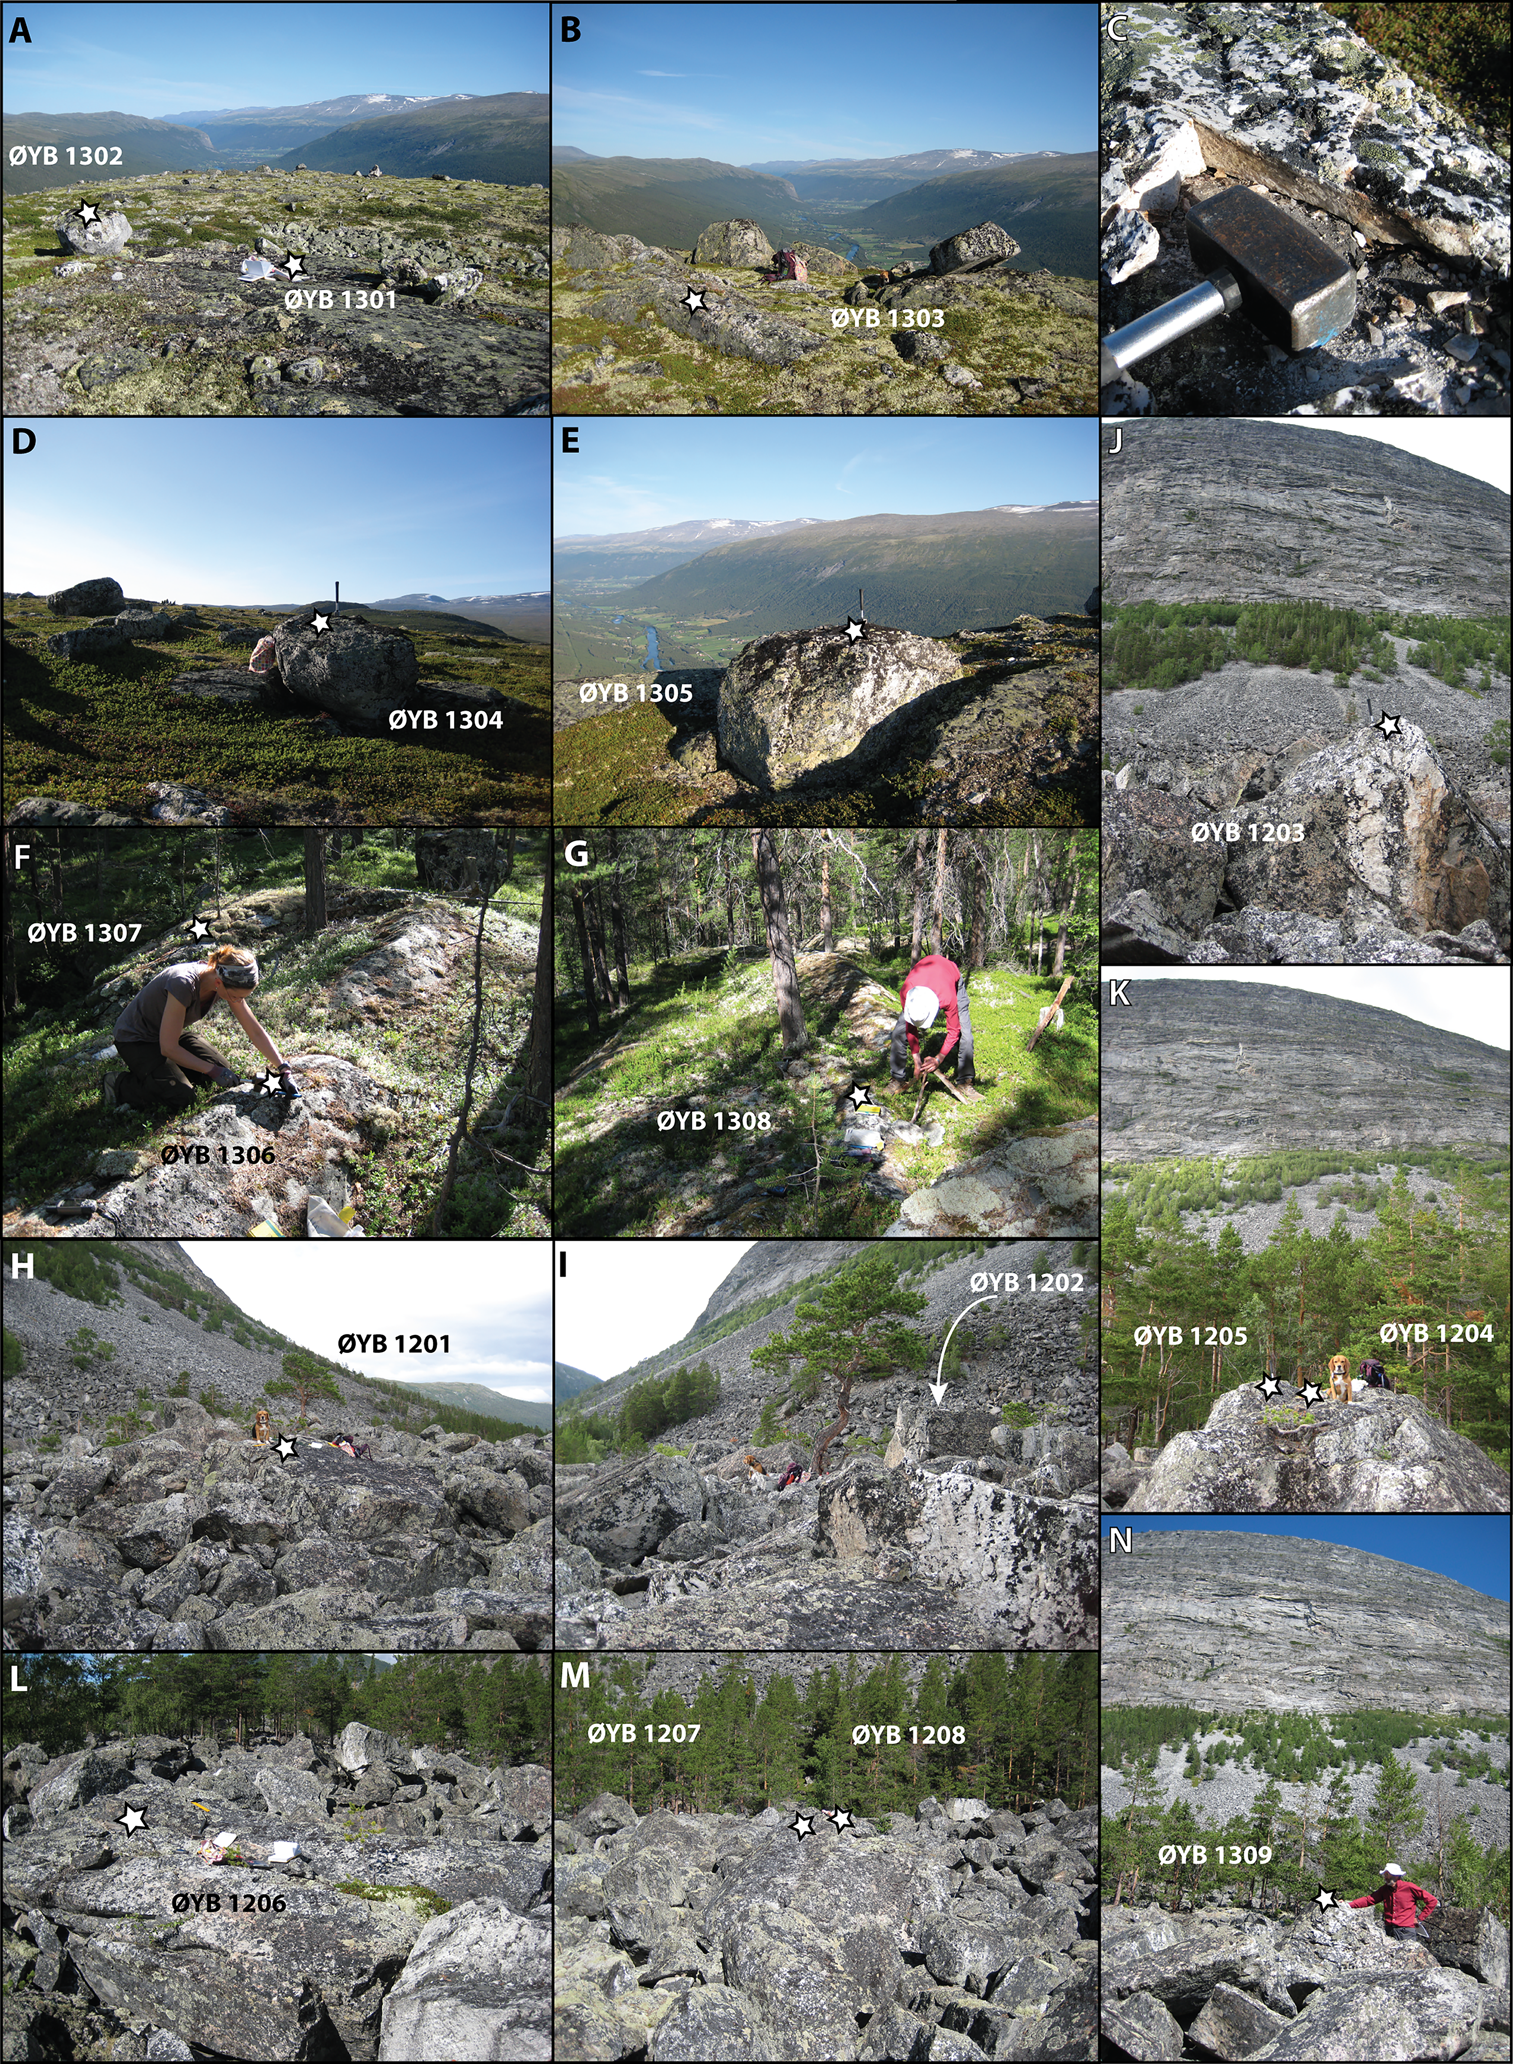
(color online) Rock surfaces sampled (marked with a star) for 10Be surface-exposure dating at the Summit (A–E), Up-valley (F–G), Lobe 2 (H–J) and Lobe 3 (K–N). (A) Sample ØYB 1301 from bedrock (open notebook for scale) and sample ØYB 1302 from a boulder (boulder-s1) surface 60 cm above the bedrock. (B) Sample ØYB 1303 from an exposed bedrock surface (rucksack in the background for scale), 56 m from sample ØYB 1301. (C) A close-up of the sampled vein in (B). (D) Sample ØYB 1304 from the surface of the boulder-s2 resting on bedrock (standing hammer for scale). (E) Sample ØYB 1305 from the surface of boulder-s3 resting in a bedrock niche (standing hammer for scale). (F) Samples ØYB 1306 and ØYB 1307 from exposed bedrock surfaces, less than 3 m apart, at the Up-valley site. (G) Sample ØYB1308 from bedrock, approximately 40 m north of surfaces shown in (F). (H) Sample ØYB 1201 from the sub-horizontal surface of boulder-2a on Lobe 2. Sitting beagle (41 cm at the withers) for scale, c. 50 cm tall. (I) Sample ØYB 1202 from the horizontal surface of boulder-2b (Lobe 2) to the right of the pine tree (rucksack leaning towards the tree trunk for scale). The pine tree in the background is the same as in Figure 3H here and Figure 4a of Matthews et al. (Reference Matthews, Nesje and Linge2013). (J) Sample ØYB 1203 from the small flat top surface of pointy boulder-2c (standing hammer for scale). The boulder is located closer to the front of Lobe 2 than boulders-2a and -2b. (K) Sample ØYB 1204 from a weathered and detached, but still in situ, piece of the top surface of boulder-3a, and sample ØYB 1205 from a quartz-rich knob from the highest part of the surface of boulder-3a. Eastern part of Lobe 3, sitting beagle (c. 50 cm tall) for scale. (L) Sample ØYB 1206 from boulder-3b in the middle part of the uneven surface of Lobe 3 with 25-cm-long orange angle square ruler for scale. (M) Samples ØYB 1207 and ØYB 1208 from the surface of boulder-3c, situated close to boulder-3b. A 30-cm-long tool bag is barely visible as a scale. (N) Sample ØYB 1309 from a quartz vein exposed at the top point of boulder-3d, situated close to the steep front of Lobe 3. Tall person for scale.
Summary of field data for samples for 10Be surface-exposure dating.

a Geometric shielding correction was computed after Dunne et al. (Reference Dunne, Elmore and Muzikar1999).
The Up-valley site (Fig. 1, 2) is located west of the Øybergsurdi talus slope and about 2 km up-valley from Lobe 2. Bedrock exposures here consist of smooth glacially eroded surfaces (Fig. 2A) and polished quartz-rich lenses. Most boulders here are situated close to the slope, indicative of a clear rockfall origin (Fig. 2D), and the very few convincing glacially deposited boulders have unsuitable size and/or geometry for surface-exposure dating. Other boulders occur in groups beyond the extent of the obvious talus deposits; these boulder accumulations are situated on exposed bedrock and in depressions between exposed bedrock. Plucking and transport by either glaciers or meltwater could explain these accumulations. Three bedrock samples (Fig. 3F, G) were collected and processed from the Up-valley site (Table 1).
The Øybergsurdi talus slope, beneath the Øyberget summit (1227 m asl) (Fig. 1C, D, 2) covers more than 1 km2 and has several lobe-shaped features along its lower part. The most pronounced lobes are found at an elevation of 510–540 m asl, and they are up to 200 m wide and 200 m long. The lobes have steep fronts, uneven and low-angle surfaces, and sharp transitions to the talus slope behind them (Fig. 2E). The base of the talus slope and inter-lobe area are forested; the vegetation on the lobes themselves is very sparse except for the occasional pine. Mosses and heath species are often confined to small depressions on the boulder surfaces, and lichens are typically present on all exposed rock surfaces. The boulders comprising the open-work lobes are large, typically 1–3 m long on their longest axis. Traversing these lobes is like climbing a coarse, subhorizontal scree deposit; individual boulders often protrude 1–2 m above their base or surrounding ground, and they are typically 0.5–2 m apart. Most boulders are firmly stuck in the landform, but some boulders are loose. Few large boulder surfaces have smaller, very angular boulders on top, suggesting rock fall deposition. No glacially transported (perched/erratic) boulders were observed. All boulder surfaces selected for sampling were at least 1 m above the boulder's base and were horizontal to subhorizontal, and shielding from surrounding boulders was less than the topographic horizon. Three samples were collected and processed from boulder surfaces on Lobe 2 (Fig. 3H–J, Table 1), and six were collected and processed from boulder surfaces on Lobe 3 (Fig. 3K–N, Table 1).
The valley slope (Fig. 2F) east of the Øybergsurdi talus slope has a thick (> 10 m) till cover up to about 800 m asl (i.e., no bedrock exposures were observed in ravines, only in parts of the stream, and no material was collected for dating). It stands, however, in sharp contrast to the exposed bedrock at the Up-valley site and Summit area, the Øybergsurdi talus slope, and the open-work Lobes 2 and 3.
MATERIALS AND METHODS
Field sampling
In the field, it is crucial to collect samples that are representative of the geological problems and/or hypotheses being investigated or tested. This seems straightforward, but it does not always turn out to be so. 10Be is produced within quartz through spallation of oxygen and muon-induced reactions (Gosse and Phillips, Reference Gosse and Phillips2001), and its concentration is in theory a measure of how long a surface has been exposed to secondary cosmic radiation. That is, it indicates whether the rock surface has had a single-stage, continuous exposure history in the same position. In the case of pre-exposure, temporal cover, and geometric or elevation change, the concentration represents a more complex history (e.g., Ivy-Ochs et al., Reference Ivy-Ochs, Kerschner and Schlüchter2007).
Gneiss surfaces were sampled using a hammer and chisel for in situ cosmogenic 10Be surface-exposure dating of material from three different settings: glacially eroded bedrock, glacially transported boulders, and rock-glacier boulders. Sample locations and elevations were recorded in the field with a hand-held GPS (Garmin 60SCx) and later confirmed from a digital elevation model (Høydedata, 2018; https://hoydedata.no/LaserInnsyn/). Figure 3 shows the sampled surfaces from the Summit site (Fig. 3 A–E), the Up-valley site (Fig. 3F, G), and Lobes 2 and 3 (Fig. 3H–N). Topographic shielding was determined for each surface based on clinometer readings to the horizon. Sample thickness was measured in the field and re-checked prior to crushing. Observations on weathering, erosion, and snow shielding were noted. Table 1 summarizes the field data relevant for calculating 10Be concentrations.
Sample preparation
Rock samples were processed at the Department of Earth Science (GEO), University of Bergen (UiB), using standard mineral-separation techniques (Kohl and Nishiizumi, Reference Kohl and Nishiizumi1992) on the 0.25–0.5 mm fraction. Quartz purity was assessed by ICP-OES measurement of aluminum; concentrations less than 100 ppm were desired for optimal column chemistry yields. Preparation of samples from clean quartz to targets for accelerator mass spectrometry (AMS) measurement of 10Be/9Be was done according to procedures modified from Child and colleagues (Reference Child, Elliott, Mifsud, Smith and Fink2000). Beryllium extraction was done at GEO, UiB, and Be targets for AMS analysis were prepared at the Scottish Universities Environmental Research Centre (SUERC) Cosmogenic Isotope Laboratory. 10Be/9Be ratios were measured on the 5 MV AMS at SUERC (Xu et al., Reference Xu, Dougans, Freeman, Schnabel and Wilcken2010) in 2015. The average process blank (10Be/9Be = 3.18 ± 0.75 × 10⁻¹⁵, n = 3) was subtracted from sample 10Be/9Be values to account for background levels of 10Be.
Calculation of 10Be surface-exposure ages
When calculating in situ 10Be ages, certain assumptions were made with regard to the erosion and exposure history of the rock surfaces. Relevant correction factors for erosion, uplift (glacio-isostatic rebound), snow cover, and forest are presented in Table 2. Table 3 presents laboratory data, calculated 10Be concentrations (2.6%–6.0% range in analytical 1σ errors), and 10Be surface-exposure ages. Ages are obtained using the online exposure age calculator formerly known as the CRONUS-Earth online exposure age calculator, version 3 (Balco, Reference Balco2017), available at http://hess.ess.washington.edu/math/v3/v3_age_in.html. We apply the Scandinavian calibration set of Stroeven and colleagues (Reference Stroeven, Heyman, Fabel, Björk, Caffee, Fredin and Harbor2015) (18 samples from 4 sites, available at http://calibration.ice-d.org/cds/2), and the calculator computes reference production rates (via spallation) and exposure ages according to the Lm scaling scheme (Balco et al., Reference Balco, Stone, Lifton and Dunai2008) where the latitude-altitude-based scaling factors of Lal (Reference Lal1991) are modified to account for geomagnetic field variability (Lifton, Reference Lifton2016). The Scandinavian 10Be production rate (Stroeven et al., Reference Stroeven, Heyman, Fabel, Björk, Caffee, Fredin and Harbor2015) has a reference sea-level high-latitude 10Be production rate of 4.13 ± 0.11 atoms g-1 yr-1 (Lm scaling).
Relevant correction factors for the sites in upper Ottadalen and the approximate (exposure-time dependent) percent increase in 10Be surface-exposure age when accounted for.
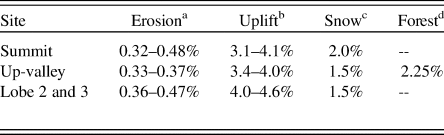
a Erosion by chemical weathering and removal of grains is in the order of 0.48 mm ka-1 based on observed relief (4–5 mm) of polished quartz veins near the Up-valley site.
b Based on uplift data compiled by Lyså et al. (Reference Lyså, Knies and Larsen2008).
c Based on monthly snow depth data calculated from modelled daily snow thickness for years 1958–2017 (SeNorge, 2018) and calculated using a snow density of 0.2 g cm-3 and an attenuation length in snow of 160 g cm-2 (see references in Gosse and Phillips, Reference Gosse and Phillips2001).
d Reduction in 10Be production rate due to shielding by forest is adapted from Plug et al. (2007).
Laboratory data calculated and corrected 10Be surface-exposure ages for the samples from upper Ottadalen, southern Norway.

1 All AMS targets were prepared and measured at SUERC.
2 A density value of 2.65 g cm-3 is used for all samples.
3 Be carrier concentration: 998.9 ± 3.6 μg/g.
4 10Be/9Be isotope ratios are normalised to the NIST SRM Be standard assuming a 10Be/9Be nominal value of 3.06×10⁻¹¹ (i.e., AMS standard NIST_30600 in the online calculator, see note 7). AMS data and data derived from this are given with 1σ uncertainties.
5 A procedural 10Be/9Be blank value of 3.253 ± 0.771×10⁻¹⁵ (n = 3) is used to correct for background.
6 Propagated uncertainties include error in the blank and counting statistics.
7 10Be surface exposure ages were calculated with “the online calculator formerly known as the CRONUS-Earth online calculator” (Balco et al., Reference Balco, Stone, Lifton and Dunai2008) version 3, the Lm scaling model, and the Scandinavian 10Be production calibration dataset (Stroeven et al., Reference Stroeven, Heyman, Fabel, Björk, Caffee, Fredin and Harbor2015). Analytical uncertainties are given in parentheses; systematic uncertainties (after parentheses) include the 10Be production rate and 10Be decay constant uncertainties. Arithmetic average ages are reported with (1) one standard deviation (1 SD) in parentheses for internal/10Be data comparison, and (2) propagated 1-sigma (analytic) systematic uncertainties for comparison with non-10Be data.
8 Calculated ages: assuming no atmospheric pressure anomalies (std model), no significant erosion during exposure (ε = 0 mm ka-1), no prior exposure, no glacio-isostatic rebound, and no local temporal shielding (e.g., snow, sediment, soil, vegetation).
9 Corrected ages (see Table 2 for details) assuming no atmospheric pressure anomalies (std model), an erosion rate of 0.48 mm ka-1 for gneiss surfaces, no prior exposure, 3.1%–4.6% increase in 10Be concentration to compensate for glacial rebound, 2% reduction in 10Be production for the forested Up-valley site, and moderate snow shielding (1.5% reduction in 10Be production for Up-valley and Lobe sites, and 2.0% for the Summit site).
RESULTS
10Be surface-exposure ages
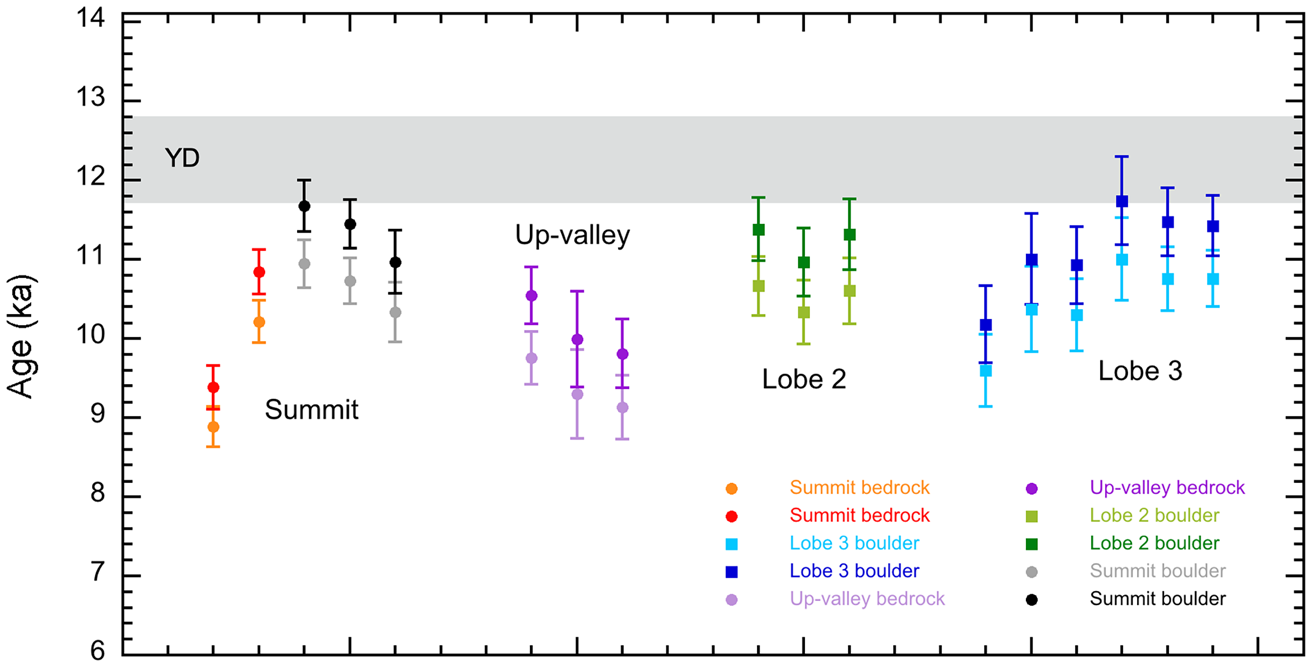
The calculated in situ 10Be ages obtained for the 17 samples span from 8.9 ± 0.3 to 11.0 ± 0.5 ka (1σ analytical uncertainty) and show close to insignificant variation within and between the individual sites: Summit, Up-valley, Lobe 2, and Lobe 3 (Fig. 4, Table 3).
For the Summit site (1225–1175 m asl), 10Be surface-exposure ages (8.9 ± 0.3 to 11.0 ± 0.3 ka) overlap within 2σ, except for youngest age (Fig. 4, Table 3). The agreement between bedrock and boulders implies that both surface types were sufficiently eroded by glacial processes that nuclide inheritance is not an issue, and that the surface-exposure ages can be taken to reflect the timing of deglaciation of the summit area.
(color online) The distribution of calculated (pale symbols) and corrected/recomputed (dark symbols) 10Be surface-exposure ages for the Summit, Up-valley, Lobe 2, and Lobe 3 sites. Correction was made for erosion (all samples, except ØYB 1309), and for temporal/local changes in 10Be production rate due to glacio-isostatic uplift (all samples), snow cover (all samples), and vegetation (Up-valley only). The total impact of all quantifiable ages is in the order of a 6%–8% increase. The order of samples for individual sites follows the sample labelling (Table 1). Error bars show the 1σ analytical uncertainty. Gray band marks the time interval of the Younger Dryas stadial.

For the Up-valley site (617–615 m asl), three glacially abraded bedrock surfaces give overlapping 10Be surface-exposure ages (9.1 ± 0.4 to 9.8 ± 0.3 ka) (Fig. 4, Table 3). No appropriate boulders were found for comparison with the bedrock samples; however, the internal agreement between the three bedrock surfaces suggests that nuclide inheritance is not a likely issue.
For Lobe 2 (542–538 m asl), three large boulders give overlapping 10Be surface-exposure ages (10.3 ± 0.4 to 10.7 ± 0.4 ka) (Fig. 4, Table 3). For Lobe 3 (528–515 m asl), four large boulders give six 10Be surface-exposure ages (9.6 ± 0.5 to 11.0 ± 0.5 ka) where five of the six ages overlap (Fig. 4, Table 3). Note that two of the boulders (D, F) each have replicate samples with overlapping results.
Relevant correction factors and corrected 10Be ages
It is unlikely that the dated rock surfaces are unaffected by processes occurring since the timing of initial exposure. In this study, we consider chemical weathering to be a relevant prerequisite for erosion at all sites. Moreover, changing atmospheric depth caused by uplift (glacio-isostatic rebound) and seasonal snow cover are relevant for all sites, whereas temporal shielding by vegetation is relevant only for the Up-valley site. The relevant correction factors are described and discussed in the Supplementary material and summarized in Table 2. Based on our observations of the protruding quartz vein in the area, a locally derived erosion rate of 0.48 mm ka-1 (i.e., 5 mm in 10.5 ka) has been applied to all samples, except sample ØYB 1309 since this was pure quartz with an unknown erosion rate (and probably episodic loss of grains rather than steady state). The impact of erosion translates to an increase in age of less than 0.5% (i.e., c. 50 years). The maximum uplift correction for the 12–0 ka interval amounts to 4.1% for the Summit site, 4.4% for the Up-valley site, and 4.6% for Lobes 2 and 3. Assuming a moderate snow cover from modern data amounts to reductions in 10Be production of about 1.5% for the Up-valley and Lobe sites and 2.0% for the Summit site. Forest shielding at the Up-valley site for the c. 9.5–0 ka interval results in an average reduction in 10Be production of about 2%.
Recomputed data (i.e., corrected 10Be ages) are presented in the right-most column in Table 3. The corrected ages are first used to assess the inter-site correspondence considering the 1σ analytical uncertainties only (in parentheses). The corrected 10Be ages span from 9.4 ± 0.3 to 11.7 ± 0.6 ka (1σ analytic uncertainty). The total impact of all quantifiable corrections is in the order of 6%–8% (i.e., c. 0.6–0.8 ka). Figure 4 compares the calculated and recomputed (corrected) ages and shows close to insignificant intra-site variation for all four sites: Summit, Up-valley, Lobe 2, and Lobe 3 (Fig. 4, Table 3).
Corrected 10Be surface-exposure ages from the Summit site range from 9.4 ± 0.3 to 11.7 ± 0.3 ka, which overlap within 1σ (Fig. 4, Table 3), except for one obvious outlier (9.4 ± 0.3 ka, ØYB 1301 bedrock). This bedrock sample was collected 1 m from the boulder giving the oldest age at the Summit (11.7 ± 0.3 ka, ØYB 1302). All the other boulder and bedrock samples could have some degree of inheritance, except for the young outlier (ØYB 1301). For this specific setting, however, we suggest that the young bedrock surface age is too young because of temporary debris cover; summit sites with cairns have a high risk of human impact (e.g., cobble removal and quarrying, in connection with cairn-building). The bedrock outcrop has several boulders and cobbles, and the distance to thin till cover is about 1 m. The arithmetic average corrected age with one standard deviation is 11.2 ± 0.4 ka for the Summit site (Table 3).
Corrected 10Be surface-exposure ages from the Up-valley site range from 9.8 ± 0.4 to 10.6 ± 0.4 ka (Fig. 4, Table 3). The Up-valley site shows younger ages than the other sites (Fig. 4), indicating that relevant shielding effects might be unaccounted for, such as prolonged snow cover and/or denser snow in the forest. The arithmetic average corrected age with one standard deviation is 10.1 ± 0.4 ka for the Up-valley site (Table 3).
Corrected 10Be surface-exposure ages from the Lobe 2 site range from 11.0 ± 0.4 to 11.4 ± 0.4 ka (Fig. 4, Table 3), giving an arithmetic average corrected age of 11.2 ± 0.2 ka for Lobe 2. Corrected 10Be surface-exposure ages from the Lobe 3 site range from 10.2 ± 0.5 to 11.7 ± 0.6 ka (Fig. 4, Table 3). The near-outlier age (10.2 ± 0.5 ka, ØYB 1204) overlaps with the other age (ØYB 1205) obtained from the same boulder. The ØYB 1204 sample was detached from the boulder surface via weathered cracks, indicating a higher erosion rate affected by more than one weathering front, possibly standing water and/or former vegetation cover. As there is an intra-boulder correspondence between the two samples from boulder D (Fig. 3), and overlap within 2σ, we include sample ØYB 1204 in the average age. This gives an arithmetic average corrected age of 11.1 ± 0.6 ka for Lobe 3.
The rock-glacier boulders are not expected to have undergone substantial erosion during the downslope creep of the rock glacier, as they are as angular as boulders in the present-day talus slope. Nevertheless, we do not expect nuclide inheritance stemming from the material's pre-rock-glacier history. The large number of boulders constituting the current talus slope and the lobes indicate that there was a high production of talus boulders from the cliff face at some point in time, and/or that boulders were shielded by talus material prior to lobe formation. The very uniform 10Be ages indicate rapid formation of the lobes.
Average corrected ages only comprise ages overlapping within 2σ analytical uncertainties. Only sample ØYB 1301 gives an age that does not overlap with neighboring results within the 2σ uncertainty. Average corrected ages are furthermore presented in two ways: (1) as arithmetic average ages with one–standard deviation uncertainties for assessing inter-site correspondence, and (2) as arithmetic average ages with propagated 1σ analytic (parentheses) and systematic uncertainties for comparing the average corrected 10Be ages with dating results from other techniques.
The inter-site comparison shows very uniform face values for arithmetic average corrected ages (Fig. 5). The crucial point for assessing inter-site correspondence is the uncertainty of the average corrected age. The use of one standard deviations provides a measure of the scatter of the average corrected ages. The smaller uncertainties, compared to the propagated 1σ uncertainties, could allow for a clearer site separation. However, using the standard deviation instead ignores uncertainties associated with the individual ages.
(color online) Average corrected 10Be ages (ka) with one standard deviation (squares) and propagated systematic 1σ and 2σ uncertainties (circles) for each site (see Table 3). Gray band marks the time interval of the Younger Dryas stadial.

DISCUSSION
Timing of onset and deactivation of rock-glacier activity
According to the average recomputed 10Be ages with one–standard deviation uncertainties (right column, Table 3), the Summit site was deglaciated at 11.2 ± 0.4 ka and the Up-valley site at 10.1 ± 0.4 ka. Of the relict rock-glacier lobes, Lobe 2 has been stable for the past 11.2 ± 0.2 ka and Lobe 3 for 11.1 ± 0.6 ka. The timing of deglaciation represents the maximum age for the inception of rock-glacier activity, whereas the 10Be ages from rock-glacier boulders represent the timing of inactivation. When active, as well as during the melting phase, boulders on a rock glacier can move and change their exposure geometry.
Rapid deglaciation and lobe formation are indicated by the similar 10Be ages obtained from the Summit site, Lobe 2, and Lobe 3. Rock-glacier movement by creep varies with the mean annual ground surface temperature, thickness of snow cover (meltwater supply), and the intensity of ground freezing during winter. In the Swiss Alps, modern annual mean surface-velocity rates of rock glaciers are in the order of 0.1 to 3 m yr-1 (Delaloye et al., Reference Delaloye, Lambiel and Gärter-Roer2010), suggesting that the 100–200-m-long rock-glacier lobes at Øyberget could have expanded to their present size in less than 100 years. This suggests that there was sufficient time for rock-glacier formation during the deglaciation; the question of whether the environmental conditions during the deglaciation were conducive to rock-glacier formation remains (see further discussion below).
Comparison of 10Be and Schmidt-hammer surface-exposure ages
Schmidt-hammer surface-exposure dating uses rebound (R) values from surfaces of known age for age calibration of R values from surfaces of unknown age (e.g., Shakesby et al., Reference Shakesby, Matthews, Karlén and Los2011; Wilson and Matthews, Reference Wilson and Matthews2016). The R value is a measure of the compressive strength of a rock surface, which is reduced with time as a result of chemical weathering. However, aspects of this dating technique require brief clarification in the present context.
An important assumption made by Matthews and colleagues (Reference Matthews, Nesje and Linge2013) for converting R values into surface-exposure ages was that the weathering rate is linear with time and hence that two surfaces of known age could be used to derive a linear calibration equation for dating the Øyberget rock glaciers using Schmidt-hammer surface-exposure dating. Matthews and colleagues (Reference Matthews, Winkler, Wilson, Tomkins, Dortch, Mourne, Hill, Owen and Vater2018) further supported this assumption based on the slow rate of chemical weathering of crystalline rock over the relatively short Holocene timescale, especially in arctic-alpine environments (Colman, Reference Colman1981; Colman and Dethier, Reference Colman and Dethier1986; André, Reference André2002; Nicolson, Reference Nicholson2008). Particularly pertinent is the test of the linearity assumption by Shakesby and colleagues (Reference Shakesby, Matthews, Karlén and Los2011), who sampled a large number of Holocene raised beaches of known age and showed no improvement in the relationship between R value and time using a non-linear function. Matthews and colleagues (Reference Matthews, Winkler, Wilson, Tomkins, Dortch, Mourne, Hill, Owen and Vater2018) concluded, on this basis and that of Tomkins and colleagues (Reference Tomkins, Dortch and Hughes2016, Reference Tomkins, Dortch, Hughes, Huck, Stimson, Delmas, Calvet and Pallàs2018), that a linear relationship may be applicable for timescales up to c. 20 ka.
Matthews and colleagues (Reference Matthews, Nesje and Linge2013) dated the relict talus-derived rock-glacier Lobes 1–3 and obtained ages (± 95% confidence intervals) of 10.3 ± 1.3, 9.9 ± 1.4, and 9.0 ± 1.7 ka, respectively (Fig. 6). The apparent trend of decreasing nominal values with decreasing elevation is, however, not a true trend when the uncertainties are taken into account. All three rock-glacier lobes give R values indicating that they have existed for approximately the same duration of time as the older surface of known age used by Matthews and colleagues (Reference Matthews, Nesje and Linge2013), which lies close to our Up-valley site. According to the Schmidt-hammer surface-exposure ages ± 95% confidence intervals, Lobes 1–3 formed between 7.3 and 11.6 ka ago, hence overlapping with the regional deglaciation date of c. 9.7 ka (Dahl et al. Reference Dahl, Nesje, Lie, Fjordheim and Matthews2002).
(color online) Comparison between average corrected 10Be surface-exposure ages and Schmidt-hammer surface-exposure (SHD) ages from Matthews et al. (Reference Matthews, Nesje and Linge2013). The arithmetic average corrected 10Be ages (circles) are shown with propagated systematic 1σ and 2σ uncertainties. The Schmidt-hammer exposure ages (diamonds) from Matthews et al. (Reference Matthews, Nesje and Linge2013) are reported at the 95% confidence interval. Gray band marks the time interval of the Younger Dryas stadial.

Comparing the arithmetic average corrected 10Be surface-exposure ages (± systematic 1σ and 2σ uncertainties) from this study (Fig. 6), shows good agreement with the Schmidt-hammer exposure ages of Matthews and colleagues (Reference Matthews, Nesje and Linge2013). Figure 6 also indicates that the face value of the 10Be surface-exposure ages may be higher than for the Schmidt-hammer exposure ages. Results from both methods, however, indicate that Lobes 2 and 3 are older than surfaces at the Up-valley site. This warrants further discussion in order to determine whether this is an effect of local environmental conditions affecting both methods (see next paragraph) or reflects details of glacier extent at the end of the deglaciation (see the “Regional implications” section of the Discussion).
The Up-valley site may be affected by slightly different environmental factors than Lobes 1–3. For example, the microclimate in the forest may compromise the assumption of identical weathering rates since forests can have more humid environments than exposed locations because of the shading effect of trees, plant respiration, and the trapping of snow. More humid conditions can enhance the chemical and biological processes associated with chemical weathering, effects not experienced on the forest-free lobes or at the Summit site. Moreover, temporal and spatial variation in plant litter, vegetation, and soil may impact the weathering rate. A slightly higher rate of chemical weathering, at the Up-valley site for example, would also be relevant to the 10Be surface-exposure ages, since this could imply a higher rate of weathering and erosion (i.e., loss of quartz with 10Be, resulting in underestimated 10Be surface-exposure ages).
The most important methodological implications of this comparison between the two dating techniques stem, however, from the similarity of the respective age estimates. Mutual corroboration of the results justifies the very different underlying assumptions of both techniques. Furthermore, the results suggest that the two techniques can be complementary approaches to exposure-age dating, and that greater use could be made of the two techniques together in future research projects involving rock surfaces. The techniques may be particularly compatible on relatively short late Pleistocene and Holocene timescales, where they overlap in their temporal ranges and advantage can be taken of their different practical constraints in terms of cost, time, and technical sophistication. For instance, for lateral moraines with additional boulders from rock falls, it would be a great advantage to apply initial Schmidt-hammer screening when selecting boulder surfaces to be sampled for cosmogenic nuclide surface-exposure dating.
Environmental conditions for rock-glacier formation
Formation of talus-derived rock glaciers (sensu Barsch, Reference Barsch1996) requires periglacial conditions with permafrost. For the mode of origin of the lobes beneath the south-facing wall of Øyberget, Matthews and colleagues (Reference Matthews, Nesje and Linge2013) suggested three hypotheses: (1) that the landforms are produced by (Holocene) major rock-slope failures, (2) paraglacial formation of rock glaciers in the early Holocene, and (3) periglacial rock-glacier formation during an earlier interstadial followed by subsequent survival beneath a cold-based ice sheet. Rockslides or rock avalanches can form coarse debris accumulations (e.g., Ballantyne et al., Reference Ballantyne, Schnabel and Xu2009, Reference Ballantyne, Wilson, Gheorghiu and Rodés2014; Hermanns et al., Reference Hermanns, Schleier, Böhme, Blikra, Gosse, Ivy-Ochs, Hilger, Mikoš, Vilímek, Yin and Sassa2017), but these will lack morphological features produced by creep of interstitial ice. Several arguments were listed by Matthews and colleagues (Reference Matthews, Nesje and Linge2013) against formation entirely by rock-slope failure for the lobes of Øybergsurdi: lack of matching scars on the rock wall, relatively uniform boulder size, small-scale lobate extension relative to potential run-out distance, general integrity of each lobe, and the form of the transverse ridges.
According to the average corrected 10Be surface-exposure ages (± propagated 1σ uncertainties) in this study, summit deglaciation (11.2 ± 0.7 ka) and stabilization of rock-glacier lobes (Lobe 2: 11.2 ± 0.7 ka; Lobe 3: 11.1 ± 1.2 ka), occurred faster than our data can resolve; therefore, both the inception and cessation of rock-glacier activity occurred very early after, or even during, the deglaciation. In the “Timing of onset and deactivation” section of the Discussion, we argued that modern data indicate that lobes of this size can form in less than 100 years, given favorable environmental conditions of permafrost and debris supply.
Permafrost at the location of the lobes is unlikely based on the present-day distribution of permafrost in southern Norway and the work of Lilleøren and colleagues (Reference Lilleøren, Etzelmüller, Schuler, Gisnås and Humlum2012) in particular. Using thermal properties from two boreholes at Jetta, 60 km east down-valley of Øyberget, the authors modelled ground temperatures over the Holocene time interval. Permafrost is recorded today at 1560 m asl (borehole JetBH1), but not at 1218 m asl (borehole JetBH3). The initial model domain of Lilleøren and colleagues (Reference Lilleøren, Etzelmüller, Schuler, Gisnås and Humlum2012) contains no permafrost because of lack of information about the subglacial temperatures of the last ice-sheet cover, and the model outputs are thus minimum estimates. Temperatures below 0°C are demonstrated for the 1560-m borehole site in the early and late Holocene, but temperatures remained above 0°C for the whole Holocene at the 1218-m borehole site. A permafrost environment below 1200 m asl for the early Holocene in Ottadalen is therefore incompatible with the simulated borehole data, and it can be confidently predicted that no permafrost existed at the elevation of the rock-glacier lobes at the foot of Øyberget.
Another possibility for formation under a conventional periglacial environment would be during the Ålesund interstadial (38.2–34.5 ka, Mangerud et al., Reference Mangerud, Gyllencreutz, Lohne, Svendsen, Ehlers, Gibbard and Hughes2011), the latest period of ice-free conditions before the Holocene. As discussed by Matthews and colleagues (Reference Matthews, Nesje and Linge2013), this implies preservation of the rock-glacier lobes underneath cold-based ice. Evidence of the former existence of cold-based ice, such as till deposits overlying glacio-fluvial or glacio-lacustrine sediments, is found close by (Bergersen and Garnes, Reference Bergersen, Garnes and Ehlers1983), although the timing of ice-free conditions in upper Ottadalen has not been confirmed by empirical dating. Assuming a complex exposure history for Lobes 2 and 3 with c. 3 ka of exposure (37–34 ka, i.e., the Ålesund interstadial), c. 23 ka of burial (34–11 ka, glacial build-up to LGM and subsequent persistence), and c. 11 ka (the Holocene) of exposure, and applying the same corrections for the Holocene, an apparent minimum 10Be surface-exposure age of about 13 ka would be expected. The present 10Be dataset has 1σ uncertainties ranging from 2.6% to 6.0%, so the ages of surfaces with a brief pre-exposure and long burial history could still overlap within 1σ or 2σ. Taken at face value, cosmogenic nuclide surface-exposure dating cannot reject the hypothesis of preservation beneath a cold-based ice sheet. The agreement between 10Be surface-exposure ages from bedrock and boulders at the Summit, however, argues against a pre-Holocene, subglacial preservation history of the rock-glacier lobes.
With rejection of the rock-slope failure hypothesis, the absence of an early Holocene permafrost environment, and with intra- and inter-site agreement of 10Be ages making pre-Holocene exposure unlikely, we are left with two possible explanations for the 10Be dataset: (1) the paraglacial hypothesis, or (2) both sets of 10Be and Schmidt-hammer surface-exposure ages are incorrect.
Formation of rock-glacier lobes in the absence of permafrost under paraglacial conditions would require burial of residual glacial ice in the valley by a rapid and large debris supply (without major rock-slope failure and associated major rock-avalanche scars) and subsequent creep of the debris-covered ice. A paraglacial origin is in general supported by an increasing number of observations in the region. In Storfjorden, 50 km west of Øyberget, for example, Longva and colleagues (Reference Longva, Blikra and Dehls2009) found that rock-avalanche frequency was very high during YD and Preboreal times. A rock-avalanche deposit in Innerdalen (62.72°N, 8.73°E) has been shown to have been formed when there was still ice in the valley (Schleier et al., Reference Schleier, Hermanns, Rohn and Gosse2015), despite the low preservation potential of such deposits. Most dated rock-avalanche deposits, however, lag the deglaciation by 1–2 ka. Hermanns and colleagues (Reference Hermanns, Schleier, Böhme, Blikra, Gosse, Ivy-Ochs, Hilger, Mikoš, Vilímek, Yin and Sassa2017) show this by comparing a compilation of 10Be surface-exposure ages of rock-avalanche deposits and scars with the ice-sheet retreat chronology in southern and western Norway. Rapid supply of large quantities of debris in the early Holocene can be attributed to the mechanical instability/weakness of newly exposed landscapes (e.g., Ellis and Calkin, Reference Ellis and Calkin1984; Blikra and Nemec, Reference Blikra and Nemec1998). The lack of large scars or indentations and the steepness of the cliff face at Øyberget can be explained, along with the large size of boulders in the lobes and talus, by bedrock properties. In the roadcut near the Up-valley site, the exposed bedrock shows complex banding of variable thickness (< 3 m) and composition that dip 30–60° north, suggesting that the southern face of the Øyberget should be relatively stable as the angle of dip does not favor sliding from north to south.
Regional implications of the 10Be surface-exposure ages from Øyberget
Vertical down-wastage of the last ice sheet in this region makes the apparent 10Be age relationship between Summit and Up-valley sites reasonable. It is, however, problematic that the Up-valley site provides significantly younger ages than the Lobes. This situation could be explained if the Up-valley site has experienced additional shielding than has been accounted for. This is considered unlikely as the same relative age pattern is revealed by the Schmidt-hammer surface-exposure ages. Increased weathering would be evident from the R values and cannot be the explanation. Only a later deglaciation time or a post-deglaciation erosional event could explain the agreement between the two methods. Hence, this relatively young age may be accounted for by a deglaciation model involving vertical down-wastage followed by up-valley retreat of a trunk glacier in upper Ottadalen.
In the DATED-1 reconstruction of Hughes and colleagues (Reference Hughes, Gyllencreutz, Lohne, Mangerud and Svendsen2016), the time-slice reconstructions suggest that deglaciation of upper Ottadalen occurred around 11–10 ka; Øyberget is outside the minimum extent of the SIS at this time but inside the maximum extent. Our data indicate that their boundary for the most-credible SIS extent at 11 ka should be moved east of the Øyberget study area.
The average corrected deglaciation age for the deglaciation of the summit of Øyberget at 11.2 ± (0.7) 1.5 ka (Table 3), is in agreement with the youngest boulder age of 10.9 ± 2.6 ka 60 km down valley (our recalculation from data reported by Goehring et al., Reference Goehring, Brook, Linge, Raisbeck and Yiou2008). The timing of valley deglaciation may therefore have been slightly earlier than suggested by the aforementioned ice-sheet reconstruction. The indistinguishable ages from similar elevations, although 60 km apart, is in agreement with the reconstructed course of the deglaciation by Garnes and Bergersen (Reference Garnes and Bergersen1980), where the ice sheet underwent vertical down-wasting after a final phase of ice movement towards the northeast. During the down-wasting, Ottadalen was situated between the main water divide in the north and the ice-divide in the south, and the ice-sheet surface is believed to have had a relatively small gradient (c. 10 m km- 1) based on lateral, erosional, and accumulation meltwater features in this area, in particular when the ice surface came down to about 1200 m asl (Garnes and Bergersen, Reference Garnes and Bergersen1980). This may have resulted in dynamically active ice at the Up-valley site and stagnant, dynamically inactive ice in lower-elevation areas (i.e., valley bottoms). Temporal and spatial complexities associated with vertical down-wasting of the last ice sheet makes reconstruction of the last deglaciation in such regions particularly challenging. However, new geochronologic tools and refined numerical models are expected to disentangle information on the final demise of large ice sheets.
CONCLUSIONS
The purpose of this study was to evaluate the timing and environmental controls on past rock-glacier formation in southern Norway. To do this, we first wanted to test whether boulders on relict rock-glacier lobes at Øyberget could be reliably dated with in situ 10Be, and if so, to compare the results with previously published Schmidt-hammer surface-exposure ages. Age determination is crucial to obtaining further information about the environmental conditions under which the rock-glacier lobes were formed. The study has reached several conclusions where average corrected 10Be ages are given in ka with propagated 1σ (analytic) and systematic uncertainties. Relict rock-glacier lobes in southern Norway can be reliably dated with in situ 10Be, judging from the uniform data obtained from two examples at Øyberget in upper Ottadalen. Rock-glacier Lobes 2 and 3 at the foot of Øyberget became inactive around 11.2 ± (0.7) 1.4 and 11.1 ± (1.2) 2.3 ka, respectively, when corrected for glacio-isostatic uplift, snow shielding, and erosion. The ages are slightly older than, but not statistically different from, previously published Schmidt-hammer surface-exposure ages from the same rock-glacier lobes. The close similarity corroborates the results of both dating techniques and supports their mutual compatibility and complementarity. According to the 10Be data, the Summit (1225–1175 m asl) of Øyberget was deglaciated around 11.2 ± (0.7) 1.5 ka, when glacio-isostatic rebound, snow shielding, and erosion are taken into account. There is no evidence for any nuclide inheritance effect. The Up-valley site from Øyberget has been ice free for the last 10.1 ± (0.8) 1.3 ka when glacio-isostatic rebound, snow shielding, and erosion are taken into account. This justifies the previously assumed deglaciation date of c. 9.7 ka used for Schmidt-hammer surface-exposure dating. The uniformity of the 10Be surface-exposure ages from all four sites leads to rejection of the hypothesis that the rock-glacier lobes could have been preserved beneath a cold-based, low-erosive glacier during the LGM. As the timing of formation of the rock-glacier lobes is incompatible with the non-permafrost climatic conditions that existed at the sites in the early Holocene, their formation is explained as a result of rapid paraglacial formation involving enhanced debris supply and burial of residual ice immediately after deglaciation. The results demonstrate that rock-glacier lobes may form over a relatively short period of time (hundreds rather than thousands of years) under non-permafrost conditions and arguably exemplify a paraglacial mode of formation.
ACKNOWLEDGMENTS
Henriette Linge thanks Hanne Linge for crushing and mineral separation of the rock samples, Lars Evje and Maria Miguens-Rodriguez for assistance during laboratory processing of the samples, and Stein-Erik Lauritzen and Aage Paus for data discussions. The 2013 samples were collected during the Swansea University Jotunheimen Research Expedition 2013, and this paper represents Jotunheimen Research Expeditions Contribution No. 212. Sample preparation and AMS analysis for in situ cosmogenic 10Be surface-exposure dating was funded by the Bjerknes Centre for Climate Research. We thank two anonymous reviewers for providing detailed and constructive comments on an earlier version of this manuscript. The manuscript further benefitted from the comments given by Attila Çiner, an anonymous reviewer, and Quaternary Research Associate Editor Jim O'Connor.
SUPPLEMENTARY MATERIAL
To view supplementary material for this article, please visit https://doi.org/10.1017/qua.2020.10.


 Open access