
1. Introduction
Palatalisation is a canonical term in phonology, used to describe a range of phenomena in which non-palatal consonants acquire a specification for palatality. We describe in this paper a case of palatalisation which has an intriguing type of patterning which has not been previously reported. We thus expand our understanding of the range of possible palatalisation patterns. The process is more interesting than just that, however. We show that it involves a segmental process in which a spreading (or agreement) phenomenon is sensitive to the quantity of the source of the specification that spreads (or drives the agreement). Quantity-sensitivity in phonology is usually considered in relation to prosodic phenomena, so the recognition of any quantity-sensitive segmental pattern is noteworthy. Furthermore, while a small number of other quantity-sensitive patterns have been reported from the segmental domain, all cases of which we are aware have the opposite patterning to that reported here: a preceding short vowel is required to trigger a process, and a long vowel blocks it. In the main pattern that we present here, a preceding long vowel is necessary to trigger the process, and a short vowel blocks it. Our observations thus extend our knowledge of what is possible in phonology, mixing subsegmental and prosodic specifications in a way which is rarely described.
A second goal of this paper is to expand our phonological understanding of the variety of English which has this palatalisation: Liverpool English (LE). This dialect has received some descriptive attention, but the phonological details of LE phenomena which differ from those found in reference varieties of English (like RP and General American) remain poorly described, as for most varieties of English. Our analysis of LE goes beyond the description of its palatalisation, however. In order to adequately describe it, we offer a full and novel analysis of LE’s vowel system.
The article is structured thus: Section 2 explains why LE offers relevant palatalisation data – it features a process which derives dorsal fricatives; Section 3 considers the type of palatalisation that dorsal fricatives often engage in – Dorsal Fricative Assimilation – and also issues related to the acoustic identification of the relevant fricatives; Section 4 sets out our new data describing the patterning of Dorsal Fricative Assimilation in LE; Section 5 considers how we analyse the LE results; and Section 6 concludes.
2. Liverpool Lenition creates palatalisable dorsal fricatives
The dialect of English spoken in the northern English city of Liverpool (and closely surrounding areas) has several phonological characteristics which set it apart from its neighbours. Later in this article, it will be necessary to describe aspects of LE segmental phonology in some detail, but we focus here on one of these characteristics which enables our central descriptive focus: unlike most varieties of English, LE has dorsal fricatives. After a brief description of the variety in general, we explain the source of these fricatives.
The variety that we consider is typically described as ‘Liverpool English’ (as we do here) or ‘Merseyside English’ (after the conurbation of which Liverpool is part). Colloquially it is known as ‘Scouse’. LE ranks high in studies of people’s awareness of distinct dialect areas in Britain (Montgomery Reference Montgomery2007a, Reference Montgomery, Nevalainen and Traugott2012). It usually fares badly in studies of sociolinguistic stigma (Coupland & Bishop Reference Coupland and Bishop2007, Montgomery Reference Montgomery2007b), but there is evidence that it ranks higher in certain positive characteristics, such as ‘friendliness’ (Watson & Clark Reference Watson and Clark2015). Despite its social status, Watson (Reference Watson2006, Reference Watson2007a) argues that LE is not taking part in dialect levelling to the same degree as many other varieties of English, showing that it has high local covert prestige. Watson & Clark (Reference Watson, Clark and Hickey2017) find that levelling is still generally resisted in Liverpool (with the exception of TH-fronting, for which they find some evidence of geographical diffusion into LE). Furthermore, Trudgill (Reference Trudgill1999) assumes it will be the centre of a future dialect region of England. In a similar vein, McNeill (Reference McNeill2009) surveyed 402 future education students from six establishments in Merseyside and found that 64% believe that an accent gives a sense of belonging, and that 76% believe Liverpudlians are proud of LE even outside of Liverpool. A fair amount of previous linguistic work has considered the variety in various ways, including Knowles (Reference Knowles1973), de Lyon (Reference De Lyon1981), Honeybone (Reference Honeybone2001, Reference Honeybone2007), Sangster (Reference Sangster2001), Watson (Reference Watson2006, Reference Watson2007a, Reference Watsonb, Reference Watsonc), Marotta & Barth (Reference Marotta and Barth2005), Pace-Sigge (Reference Pace-Sigge2010), Cardoso (Reference Cardoso2011, Reference Cardoso2015), Crowley (Reference Crowley2012), Honeybone & Watson (Reference Honeybone and Watson2013), Watson & Clark (Reference Watson and Clark2013, Reference Watson and Clark2015), and Juskan (Reference Juskan2016, Reference Juskan2017).
There are clear contact-related explanations for some of the phonological characteristics that set LE apart from neighbouring varieties, which Honeybone (Reference Honeybone2007), in part following Knowles (Reference Knowles1973), links to new-dialect formation in the nineteenth-century, related to some of the principles of such contact effects that Trudgill (Reference Trudgill1986, Reference Trudgill2004) proposes (see Crowley Reference Crowley2012 for an alternative view of the timeline and ways in which linguistic contact played out in LE, and Cardoso Reference Cardoso2015 for a rebuttal of Crowley’s points). Some of the variety’s other characteristics are, naturally, due to endogenous developments, and we consider one of these in this article. We are not aware of any possible exogenous source for the pattern that is our major focus (in Section s 4 and 5) in any lect which was involved in the development of LE (nor indeed are we aware of any phonological phenomenon with identical patterning in any language).
One crucial point for our purposes is that LE features synchronic, variable obstruent lenition. This derives surface affricates and fricatives from underlying stops (that is, stops can synchronically progress two stages down a lenition trajectory of the type discussed in many places, including Lass Reference Lass1984 and Honeybone Reference Honeybone and de Carvalho2008). A fair amount of work has investigated Liverpool Lenition (including Honeybone Reference Honeybone2001, Sangster Reference Sangster2001, Marotta & Barth Reference Marotta and Barth2005, Watson Reference Watson2007b), showing that – while the full environmental patterning is complex at both prosodic and melodic levels and the process is variable (which is unsurprising as LE is a stigmatised non-standard variety) – some broad phonological generalisations are clear: fricatives are common realisations of underlying stops in final and (foot-/word-)medial positions (and affricates are also possible in these positions), while affricates (and stops) but not fricatives are common in initial positions. There are many aspects of Liverpool Lenition that we do not consider here because they are not relevant to our precise concerns. As our focus is on fricatives, final and medial positions are relevant, and in order to direct our focus and to control for other factors, we focused only on final position in our data collection (as described in Section 4).
Lenition is possible in stops at all places of articulation, but Watson (Reference Watson2007b) shows that it is most common for /t/, /d/ and /k/. In what follows, we will focus on the place of articulation of fricative realisations of /k/. It is notable that lenition of /k/, although variable, is very common finally – Watson (Reference Watson2007b) found, in his corpus of elicited speech from 16 adolescent LE speakers, that /k/ is realised as a fricative 94% of the time in utterance final position, meaning that for those speakers it is almost categorical. Not all LE speakers lenite quite so much – in a different sample of LE speakers, Marotta & Barth found that 43% of pre-pausal occurrences of /k/ were lenited (although this average may hide inter-speaker differences). The 12 speakers that we focus on in this paper lenited 89% of word-final occurrences of /k/ overall. Not all speakers of English from Liverpool have lenition in their phonology – this is not surprising, as it is a variable feature which is clearly associated with the city’s dialect (and some speakers may want to avoid that association). As we explain in Section 4, the speakers included in our sample are extracted from a group of 26 who were recorded for Cardoso (Reference Cardoso2015). Four of them did not lenite at all. In the 22 speakers who showed any lenition at all, 66% of occurrences of word-final /k/ were lenited.
The lenition-derived fricatives in LE pattern like underlying fricatives in that they have no closure, and feature high frequency noise throughout their realisation. Crucial for our purposes is that the dorsal fricative realisations of /k/ can engage in palatalisation of the type that is often described as Dorsal Fricative Assimilation (DFA). We consider this in the next section.
3. Dorsal fricatives and Dorsal Fricative Assimilation
Our interest in LE dorsal fricatives derives from a fleeting observation in Honeybone (Reference Honeybone2001). After mentioning that underlying /k/ can be realised at a range of places of articulation in LE, that piece observes that
[t]his process of dorsal fricative place assimilation is similar to, but not quite the same as, that which is found in many varieties of German …. Front high vowels … can cause assimilation to [ç], but it seems likely that the length of the preceding vowel affects the likelihood of assimilation. (Honeybone Reference Honeybone2001: 241–242)
This claim does not specify a precise pattern and relies on informal observation, inviting the serious study that we present in this article.
DFA is a kind of palatalisation. Palatalisation has been studied in some detail, both in typological work such as Bhat (Reference Bhat1978) and Bateman (Reference Bateman2007, Reference Bateman2011) and in research on segmental structure aiming to model consonant–vowel interactions, such as Clements (Reference Clements1985), Lahiri & Evers (Reference Lahiri, Evers, Paradis and Prunet1991), Halle, Vaux & Wolfe (Reference Halle, Vaux and Wolfe2000), and/or in the Dependency and Government Phonology traditions (such as Anderson & Ewen Reference Anderson and Ewen1987 and Kaye, Lowenstamm & Vergnaud Reference Kaye, Lowenstamm and Vergnaud1990). Several ‘overview’ pieces also exist, such as Kochetov (Reference Kochetov, Ewen, Hume, van Oostendorp and Rice2011) and Krämer & Urek (Reference Krämer and Urek2016).
Bateman’s (Reference Bateman2007, Reference Bateman2011) detailed survey of palatalisations distinguishes between two fundamental types: ‘full palatalisation’, in which segments’ entire place of articulation is shifted from non-palatal to palatal (typically due to the palatality of an adjacent vowel), and ‘secondary palatalisation’, in which a secondary palatal specification is added to segments (which retain their primary place of articulation).Footnote 2 DFA is a type of full palatalisation, as the entire place of articulation of a fricative is shifted from back dorsal to palatal – canonically, it occurs in languages which have an underlying fortisFootnote 3 back dorsal fricative. Such back dorsals are typically transcribed as /x/, but may in fact be either velar by default (as in Standard Russian and Greek), or (pre-)uvular by default (as in Standard German and Northern Standard Dutch – see e.g. Kohler Reference Kohler1977, Reference Kohler1999; Collins & Mees Reference Collins and Mees2003; van Oostendorp & Sebregts Reference van Oostendorp and Sebregts2017). As none of these languages contrast velar and uvular fricatives, the precise place of back dorsals is often ignored, and we do not push this point here – our interest is in where front dorsals of the [ç] type can occur, on the assumption that these are categorically distinct from back fricatives, as is the consensus in the literature. We thus differentiate categorically between (i) a ‘front’ dorsal of the [ç] type, at the canonical palatal place of articulation, and (ii) ‘back’ dorsals from the velar to (pre-)uvular places of articulation, of the type [x~x̱~χ˖~χ]; we thus view any transcription of the [x] or [χ] type as being, phonologically, the same thing (at least for the languages that we consider here, where there is no question of contrast among back dorsals).
In DFA, dorsal fricatives take their surface place of articulation at least in part from adjacent vowels, so that ‘palatal vowels’ (to use the terminology of, for example, Jakobson Reference Jakobson1968 and Crothers Reference Crothers1978) of the front-high type, such as /i ɪ ɛ/ (the precise set naturally depends on the language) co-occur with the front dorsal [ç], and other vowels (such as /a o/) co-occur with a back dorsal, such as [x] or [χ˖].
DFA is not universal in languages with dorsal fricatives: Northern Standard Dutch (henceforth simply Dutch) has, for example, [fliχ] vlieg ‘fly’, [zɪχ] zich ‘self’ and [laχ] laag ‘low’, [buχ] boeg ‘ship’s bow’, irrespective of the place of the adjacent vowel. DFA is, however, quite common. It can proceed in either direction: in Standard German (henceforth simply German) and Scots, the assimilation is perseverative, while in Modern Greek and Chilean Spanish, it is anticipatory. All this is shown in (1), where the vowel relevant to the assimilation is underlined.Footnote 4

In some patterns, non-vocalic segments also trigger the assimilation (some such aspects of the German case are discussed below) but in LE only vowels are relevant as drivers of assimilation, so we focus on vowels as sources of palatality here.
How does assimilation of this type occur? DFA provides some of the evidence that has been used to argue (in the literature on segmental structure cited above) that place of articulation (PoA) must be modelled using fundamentally the same features for consonants and vowels, so that PoA can spread from vowels to consonants. The German case (often called the ich-Laut~ach-Laut alternation) is one of the closest analogues to what we describe for LE in Section 4, because fundamentally parallel segments are involved: both have a tense-long/lax-short contrast in front high vowels which are involved in driving a perseverative assimilation, and both have a front [ç]-type fricative alternating with a back [x~χ]-type fricative (which can go all the way to uvular). Although the languages are closely related, the DFA patterns have developed completely independently – German dorsal fricatives are overwhelmingly either inherited Proto-Germanic /x/ (which English has lost) or emerged due to the High German Consonant Shift, which did not affect English. LE dorsal fricatives are overwhelmingly derived by Liverpool Lenition (it may be possible to argue that some are borrowed, for example in names like Bach).
The German case is well-known in the phonological literature because it has been implicated in theoretical debate a number of times (with reference to: whether morphological information should be used in phonemic analysis and/or the opacity that morphological boundaries can invoke, the question of accuracy in transcription, the status of ‘structure preservation’ in phonology, and the modelling of assimilation in Optimality Theory (OT) – see, among others, Bloomfield Reference Bloomfield1930; Kohler Reference Kohler1977, Reference Kohler, Hardcastle and Marchal1990; Hall Reference Hall1989; Iverson & Salmons Reference Iverson and Salmons1992; Merchant Reference Merchant1996 and Noske Reference Noske1997). As well as the vowel-driven alternation shown in (1), in German, [ç] also occurs after /n l r/, as in (2).

The dorsal fricatives following /r/ show a degree of opacity, as /r/ is realised in this environment as a low vowel at the surface in many varieties of German, as shown in (2), and low vowels are typically followed by the back fricative (as in [naːχ] nach ‘after’), but there is evidence (from alternations, for example) that the vocalisation of /r/ is synchronic,Footnote 5 and this opacity can be straightforwardly accounted for in either derivational or representational terms. Dorsal fricatives also occur initially in German (as in [çɛmiː] Chemie ‘chemistry’ and the bound morpheme -chen [çən] ‘diminutive’), although as Robinson (Reference Robinson2001) shows, the precise details of what is possible in initial position are contested and vary from variety to variety. These complications do not apply to the LE case: Liverpool Lenition does not canonically derive fricatives initially, and our analysis in Section 4 predicts that assimilation after consonants would not occur. Watson (Reference Watson2007b) shows that fricatives cannot be derived from /k/ after a nasal (only 1% of /ŋk/ sequences result in a fricative in his data). Fricatives are derived after an /l/ (100% of /lk/ sequences result in a fricative), but those following /l/ are not in a palatalisation environment.
Many analyses have been proposed for German DFA, some taking /x/ as the underlier (e.g. van Lessen Kloeke Reference van Lessen Kloeke1982, Lass Reference Lass1984), some taking /ç/ (e.g. Bloomfield Reference Bloomfield1930, Merchant Reference Merchant1996) and some taking a segment which is specified for dorsality, but is underspecified for its precise place of articulation (e.g. Hall Reference Hall1989, Wiese Reference Wiese1996). Contemporary analyses adopt autosegmental spreading or OT-type alignment of a feature which inheres in relevant preceding segments, and perhaps also some default filling-in of features for fricatives which are not in a position to get a suitable specification from a preceding segment.
The most thorough consideration of relevant data for the German case is Robinson (Reference Robinson2001), who proposes the spreading convention reproduced here in (3).

In Robinson’s analysis, [Coronal] spreads from a preceding sonorant to derive [ç] from a segment which would otherwise surface as [x]. The precise nature of the phonologically active feature is the basis of much of the theoretical discussion of palatalisation mentioned above, and we return to this issue in Section 5 . There will be a close parallel to the German case in our discussion of LE, but certain facts seem clearer in LE than in German. As well as the absence of initial dorsal fricatives, or those relevant to the data in (2), LE derives its dorsal fricatives synchronically from a segment which patterns otherwise like a standard /k/ in English, so the derived fricatives can be straightforwardly assumed to have the same PoA as /k/ at some level of analysis.
3.1 Place of articulation in previous reports of LE dorsal fricatives
A number of previous reports mention the PoA of LE fricatives that are derived through the lenition of /k/. None of them make the precise observation reported at the start of Section 3, but many corroborate the claim that /k/ can be realised as both a back dorsal, of the [x~χ] type, and as a front dorsal, of the [ç] type.
The serious study of LE began with Knowles (Reference Knowles1973), which aims to provide a broad overview of the variety. Knowles briefly describes dorsal fricatives as the realisation of /k/ (‘true fricatives do occur in the velar position’) but does not focus on the issue of their PoA in detail. He includes some relevant transcriptions, however (Knowles Reference Knowles1973: 252), reproduced here in (4).

The precise intention of these transcriptions is not fully explained. Knowles (Reference Knowles1973: 90) writes with reference to vowel transcription that ‘[f]ronting … is marked by a plus sign … and retraction by a minus sign’, which is essentially the IPA convention, and this is surely also the basis of the transcription that Knowles used for consonants, too: the fricatives are all dorsal, with some degree of variation in terms of frontness or backness. The transcription [x-] is a back dorsal, which could be a notational variant of [χ] – this seems quite secure because Knowles (Reference Knowles1973: 252) further mentions that ‘the retracted fricative [x-] is often accompanied by uvular scrape’. Wells (Reference Wells1982: 371) reinterprets Knowles’ data in this way, writing that, in LE ‘[t]he /k/ fricative is sometimes uvular rather than velar, and may have a degree of uvular scrape: [nɛχ] neck, [klɒχ] clock’. This makes the LE back dorsal fricative analogous to that found in, for example, Dutch, German and (especially North) Welsh in tending towards uvularity (and this tallies with our own observations, too). It seems clear that back fricatives are intended for neck and clock, but the intent of [x+] is not fully clear. If we assume that Knowles would have transcribed a palatal [ç] if he had heard one, as he is fully conversant with the IPA, we should most reasonably assume that [x+] in snake and book is a somewhat fronted back dorsal, likely driven by variable coarticulation with the preceding vowel as it is not categorically fronted (as we discus in Section 5.1, the vowel in book is somewhat fronted in LE). This is very little data, but we note here that neck, which has the front dress vowel, is not transcribed as fronted at all, despite some degree of phonetic fronting clearly being possible. We note further that Knowles’ transcriptions are based on data collected in 1968–69 and thus represent the LE of 30–40 years before that described in the remaining material considered here (from Watson, Marotta & Barth, and ourselves), so it is possible that the situation that we describe has arisen in LE since the 1960s.
Watson (Reference Watson2007b, Reference Watsonc) provides a much fuller description of LE dorsal fricatives than Knowles, largely based on auditory analysis of the corpus described in Section 2, and intending, in Watson (Reference Watson2007c), to provide a representative description of the basic segmental phonetics and phonology of the variety. He gives corroboration that there is now DFA in LE, writing (Reference Watson2007c: 353) that ‘palatal fricatives can be found following the close front monophthong [iː] and closing diphthongs [eɪ, aɪ]Footnote 6 … and more dorsal fricatives are attested following low and back vowels…. These dorsal fricatives can be velar or uvular’. Unlike Knowles, Watson is explicit in using [ç] to describe the product of /k/ lenition in the environment that he describes, and in using ‘back dorsal’ fricative transcriptions elsewhere. Watson (Reference Watson2007c) gives representative transcriptions for LE forms in a number of places, reproduced here as (5).

Watson (Reference Watson2007c) transcribes the word cloak in two slightly different ways – as fully velar or somewhat advanced (this is possible because it occurs multiple times in ‘The North Wind and the Sun’, the passage used for the representative transcription in Watson Reference Watson2007c). Given that Watson is unambiguous in transcribing a front dorsal as a palatal, we see the advanced velar variant as a fundamentally back fricative, which is subject to some degree of coarticulation. The fact that this is variable (as both [x] and [x̟] are transcribed for the final /k/ of cloak) reinforces this assumption, as coarticulation is inherently variable.
Watson (Reference Watson2007b: 178) suggests that there may be a gendered pattern to the DFA because in his corpus of nine females and seven males, palatals are only produced by male speakers. He gives quantitative results for the number of fricatives at specific places of articulation following a number of vowels, but he did not expressly consider our key topic of interest – whether vowel quantity determines fricative place. In Section 4, we present the results of an acoustic investigation of the issue which provides clear results, and we also interpret some of Watson’s quantitative results there (and in Section 5, too). For now, we note that Watson (Reference Watson2007b) considered dorsal fricatives following LE vowels that he transcribes as /a aɪ ɑː e iː eɪ ɛː ɪ ɒ uː ɔː əʊ uː/, and all of the palatal fricatives that he identifies occur following /aɪ/ or /iː/, apart from one single token following short /ɪ/ (the ‘kit vowel’, out of a total of 37 tokens), with no tokens of a palatal following what he transcribes as short /e/ (the ‘dress vowel’, out of a total of 31 tokens of dorsal fricatives following that vowel).
A few other texts of which we are aware mention something relevant. De Lyon (Reference De Lyon1981) considers LE lenition of /k/, and transcribes a wide range of variants: [k kʰ kˣ ˣk kx xk xᵏ ᵏx χ x~h h ʔ ø], where [χ] = ‘strong fricative’ and [x~h] = ‘weak fricative’, which may imply a front fricative. However, de Lyon does not present results according to phonological environment, and so her results cannot contribute to our analysis. Marotta & Barth (Reference Marotta and Barth2005) provide an acoustic description of some aspects of LE lenition. They write (Reference Marotta and Barth2005: 395) that ‘[t]he lenition trajectory for /k/ comprises two stages only; from the stop to the affricate and then to the fricative: [k] → [kx] → [x], or [ç]. The fricative can be realized as velar or palatal, depending on the preceding vowel’. They do not specify which vowels are involved, however, and say nothing else of relevance to our concerns, except that the one transcription that they provide of a fricative derived from /k/ is of like, which has the /k/ realised as [ç]. Ogden (Reference Ogden2009: 134) briefly describes LE dorsal fricatives, explaining that they range ‘from palatal through to uvular articulations, depending on the preceding vowel: a more forward place of articulation with front vowels, a backer place of articulation with back vowels, as in ‘week’, [wiːç], ‘back’, [bax], ‘dock’, [dɒχ]’. The only other relevant information that Ogden gives is a transcription for the word smoke as [sməʉx].
The previous reports considered here are compatible with the claim at the start of this section that ‘it seems likely that the length of the preceding vowel affects the likelihood of assimilation’ of a dorsal fricative in LE. That claim was based on anecdotal observation, following considerable experience of LE, that [ç] is common as a realisation of /k/ only after long/tense front high vowels and after diphthongs which end in a front high position. The above transcriptions from recent descriptions of LE – from Watson (Reference Watson2007c), as in (5) above, from Marotta & Barth (Reference Marotta and Barth2005) and from Ogden (Reference Ogden2009) – fit well with this: DFA from a back dorsal to [ç] is only transcribed in these representative transcriptions following long vowels (including diphthongs) which are either fully front high or which end in a front high position – it is never given following a short vowel (of any quality). The absence of evidence is not evidence of absence, of course, but nonetheless, only one token ever reported in previous literature goes against this pattern – the single token of [ç] following /ɪ/ in Watson (Reference Watson2007b). This should give us pause, but it invites further consideration because of its rarity – it is so rare that it could be due to a performance error or be explicable on other grounds (we assume the latter, as briefly discussed at the end of Section 4.1). We are left with fair grounds for a hypothesis that the LE pattern of DFA is like that described for German to the extent that the vowel preceding the fricative conditions it (with a front fricative occurring only following vowels which end in a non-back/low position), but is unlike the German pattern in that the quantity of the preceding vowel also conditions the DFA: it does not occur if the vowel is short. We test this hypothesis in Section 4. We first describe our basis for the objective identification of fricative place.
3.2 Identifying dorsal fricatives
Almost all previous descriptions of LE dorsal fricatives were based on auditory analysis. While this can lead to subtle and accurate description, acoustic analysis can offer an important check and an objective way to discriminate between phonological categories, as long as identifiable acoustic correlates can be established for them. This can be especially helpful in cases like that in focus here, because, in principle, articulation is possible in dorsal fricatives anywhere along the cline from [ç] to [χ], and auditory analysis may not always be able to distinguish the PoA clearly. In order to test the hypothesis from the end of the last section, we used a detailed acoustic analysis to ensure the accuracy of our classification of the PoA of a set of specially-collected tokens, controlled for phonological environment, of lenition-derived dorsal fricatives in specially-collected data from 12 LE speakers.
Previous research has considered a number of acoustic correlates for fricative PoA (see Strevens Reference Strevens1960, Jassem Reference Jassem1962, Wrench Reference Wrench1995, Gordon, Barthmaier & Sands Reference Gordon, Barthmaier and Sands2002, Alwan, Jiang & Chen Reference Alwan, Jiang and Chen2011),Footnote 8 but cross-linguistic studies have established that the Centre of Gravity (CoG) measurement is the most accurate diagnostic measure for PoA in fortis fricatives (Forrest et al. Reference Forrest, Weismer, Milenkovic and Dougall1988, Jongman, Wayland & Wong Reference Jongman, Wayland and Wong2000, Gordon et al. Reference Gordon, Barthmaier and Sands2002, Jones & Nolan Reference Jones and Nolan2007, Alwan et al. Reference Alwan, Jiang and Chen2011).Footnote 9 CoG measurements have been used compellingly to determine the PoAs of fricatives shared by most varieties of English (Forrest et al. Reference Forrest, Weismer, Milenkovic and Dougall1988, Jongman et al. Reference Jongman, Wayland and Wong2000), and to compare the PoA of fricatives cross-linguistically (e.g. in Gordon et al. Reference Gordon, Barthmaier and Sands2002). We follow this body of work in using CoG to identify the PoA of the dorsal fricatives which derive from the lenition of /k/ in LE.
CoG is the spectral mean or the average of the frequency range. In other words, CoG provides a measurement for on average how high the frequencies are for a given spectrum. Lower frequencies are associated with constrictions further back in the mouth as the vocal cavity is longer (Kent & Read Reference Kent and Read2002, Johnson Reference Johnson2003, Ladefoged Reference Ladefoged2006). Higher CoG frequencies correspond to articulations that are further front. There is, however, cross-linguistic, interspeaker, and intraspeaker variation in the CoG measurements, producing a wide range of frequency values for palatal and/or ‘back’ measurements. This means that it is not completely straightforward to ascribe a frequency range to each PoA. Table 1 shows this variation in previous work, but also areas of clear agreement: there is a consistent difference in the average CoG for each PoA, and palatals have higher average CoG than back fricatives. Table 1 presents figures from previous work describing fricative CoG measurements, extracting their results for velar fricatives (to show the range of values ascribed to that PoA) and for palatals for those languages which have them. All languages surveyed show the average CoG for palatals to be higher than velars.
Summary of cross-linguistic studies on CoG measurements (averaged across all speakers in the sample) for PoA.

Gordon et al. (Reference Gordon, Barthmaier and Sands2002) considered two languages with both palatal and velar fricatives: Gaelic and Western Aleut. Table 1 shows that the average CoG values over all speakers for palatals were 4416 Hz and 4648 Hz respectively, whereas for velars, they were 4209 Hz and 4364 Hz respectively. Kemp (Reference Kemp2011) found much higher average COG values for both palatals (6256 Hz) and velars (5207 Hz). These cross-linguistic differences are only on the raw values for CoG frequencies, however: the raw frequency values may differ, but the general pattern of a higher average CoG for palatal fricatives than for velars is consistent.
These studies also show the interspeaker and intraspeaker variation in averaged CoG values, given in Table 2. For example, Gaelic speakers’ average CoG values for palatal fricatives ranged from a minimum of an average of 4185 Hz for one speaker to a maximum of an average of 4792 Hz for another speaker, whereas velars ranged from 3976 Hz to 4617 Hz. Furthermore, speakers varied in the length of intermission between the palatal to velars; the speakers had from 101 Hz to 503 Hz between the two PoAs (equivalent figures were not given for German in Kemp Reference Kemp2011). Fricative PoA and consequently CoG measurements are influenced by the size of the vocal tract, similar to vowel production, so it is not surprising to find interspeaker variation in these measurements. In order to ensure that statistical significance is not contingent on the individual speaker values, we normalised our own data (as described in Section 4).
Inter-/Intraspeaker variation: Showing the minimum and maximum averaged CoG values for speakers and the difference between CoG values for palatal and velars.

The phonological pattern closest to that of LE from these languages is that described for German by Kemp (Reference Kemp2011). However, while Kemp (Reference Kemp2011) finds the same general trends in CoG as the other studies, her raw average CoG measurements are fairly different and the individual speakers are more variable. This could be a result of the methodology used, as speakers were asked to read nonce words in her study. Nonce words are potentially more variable than existing words because speakers may not have been fully confident in their reading of them, which could lead to over-exaggerated speech in some cases. Secondly, the actual make-up of the fricative system in German could affect this. Most of the languages described by Gordon et al. (Reference Gordon, Barthmaier and Sands2002) had a number of dorsal fricatives (for example, contrasting palatals, velars and uvulars, as in Western Aleut). In comparison to this, German has few dorsal fricatives. The more dorsal places of articulation, the more fine-grained the frequency differences will have to be, and if a language has fewer dorsal fricatives, a wider range of frequencies can be used for each PoA. This may be expected for LE, too, as there are comparatively few dorsal fricatives in the variety. Previous studies that feature acoustic analysis of /k/-lenition in LE use less reliable measures, such as intensity (Marotta & Barth Reference Marotta and Barth2005).Footnote 10 This means that we do not have any evidence of what to expect in terms of CoG measurements in LE.
Despite the variation that occurs in CoG measurements across previous studies, the consistent result of higher average CoG for palatals and lower for velars is completely robust. A further conclusion is, however, that there is no simple way to map precise CoG measurement frequencies to specific PoAs. We tackled this for our data from LE by comparing our acoustic data with an auditory analysis. Both authors classified the fricatives, prior to taking the acoustic measurements, into two fundamental categories: front (that is, fully palatal) and back (velar-uvular). There was a large degree of agreement across our auditory judgements, and we compared the typical CoG of fricatives which had been identified auditorily as unambiguously palatal or back with the acoustic measurements, confirming the way to map CoG measurements to PoA. This could then be used to objectively identify the PoA of fricatives which were less clearly characterisable on an auditory basis. The following section describes our methodology and results in detail.
4. Quantity-sensitive DFA in Liverpool English
In order to investigate our hypothesis that quantity drives assimilation in LE dorsal fricatives, we recorded twelve speakers producing words which were chosen to compare realisations of /k/ preceded by vowels which have the same fundamental PoA, but which differ in terms of their phonological length. We focused on two vowels, which we transcribe below, following Watson (Reference Watson2007c), as [ɪ] and [iː], in order to compare the realisations of /k/ that occur following a short front high vowel and long front high vowel, keeping all other phonological parameters as similar as possible. These are widely referred to as the kit and fleece vowels, following the system of keywords for lexical sets proposed to describe English vowel phonology in Wells (Reference Wells1982), and we adopt these labels here.
The data collection for this study was integrated into that for a larger study on an unrelated feature in LE (Cardoso Reference Cardoso2015), with the words that we chose for this study included as some of the distractor tokens in wordlist fieldwork for that study. For our purposes, the other 330 words in the wordlist (which were necessary for the purposes of Cardoso Reference Cardoso2015) count as distractors, so there was no chance that informants would be aware of what we were interested in. The words were randomly presented in the carrier sentence ‘Say X here’.
There are only a few minimal pairs of the type that we required, featuring words which are both relatively frequent and well-known. The words in (6) are those that we used.Footnote 11

The frequency counts for these words are given in Table 3. These were taken from CELEX and show both the COBUILD overall frequency and the COBUILD frequency per million words. These figures are fundamentally the same (the latter is 17 times the former), but we give them both for completeness. While there are differences in terms of the relative frequency, Table 3 shows that these do not all go in the same way, and the differences between the two members of a pairFootnote 12 are not unreasonably massive (they are as small as is possible given the lexicon of English).
Frequency counts for words tested.

The words were repeated between one and three times, but each member of a minimal pair was repeated the same number of times as the other member (although, due to speakers’ errors, some speakers may have produced the target words fewer or more times than was included in the stimuli).
We focus only on word-final realisations of /k/ in order to control for any other factors which might influence the realisation of the segment, so that we can clearly test whether preceding vowel quantity has an effect. This should not be taken to imply that DFA can only occur in this position, however. Palatals can certainly also occur medially (for example, Watson Reference Watson2007c transcribes making as [meɪçən]) and from anecdotal observation we think a similar pattern of assimilation to that found word-finally applies in that environment (as it does, mutatis mutandis, in German DFA, as in [laɪçə] Leiche ‘corpse’ vs. [laχə] Lache ‘puddle’).
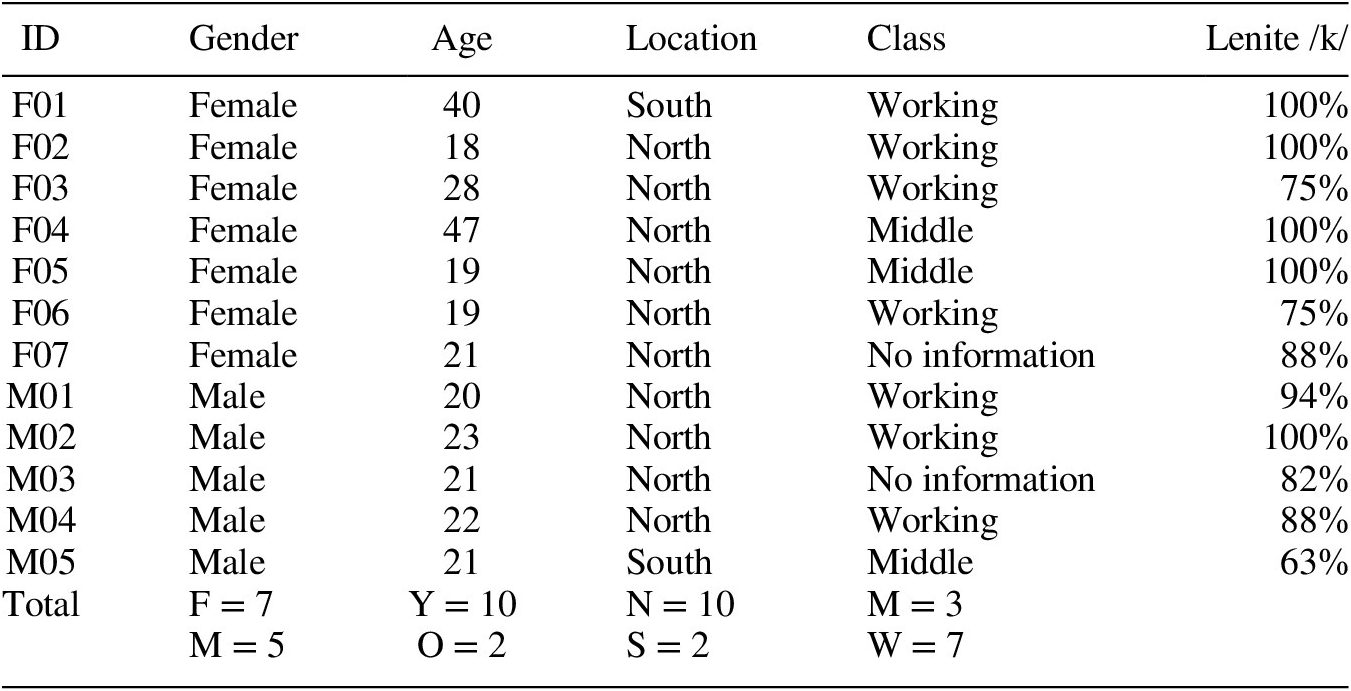
Cardoso (Reference Cardoso2015) recorded 28 informants, and we consider here results from only those who robustly lenite /k/ (at least 60% of the time), in order to be sure that they would produce enough tokens following both vowels to compare. In fact, most of the informants in the current study lenite much more than 60% of the time, as shown in Table 4, which also gives a summary of informants’ metadata. We thus report on data from seven female and five male speakers, who come from both the northern and southern areas of Liverpool.Footnote 13 All speakers have lived in Liverpool for all of their lives (apart from M04, who has lived outside of Liverpool for one year, and F03, who has lived away for three years, both as adults). There is also a mix of working and middle class speakers and while most speakers were around 20 (fitting into a ‘younger’ (Y) category), there were also two informants in their forties (seen as ‘older’ (O)). Class was determined on the basis of the occupation of informants’ parents because most informants were students (‘no information’ in Table 4 means either that an informant did not give information about their parents’ occupation or their parents were described as ‘retired’).
Details of informants used in this study; the numbering of speakers reflects the order of recording.
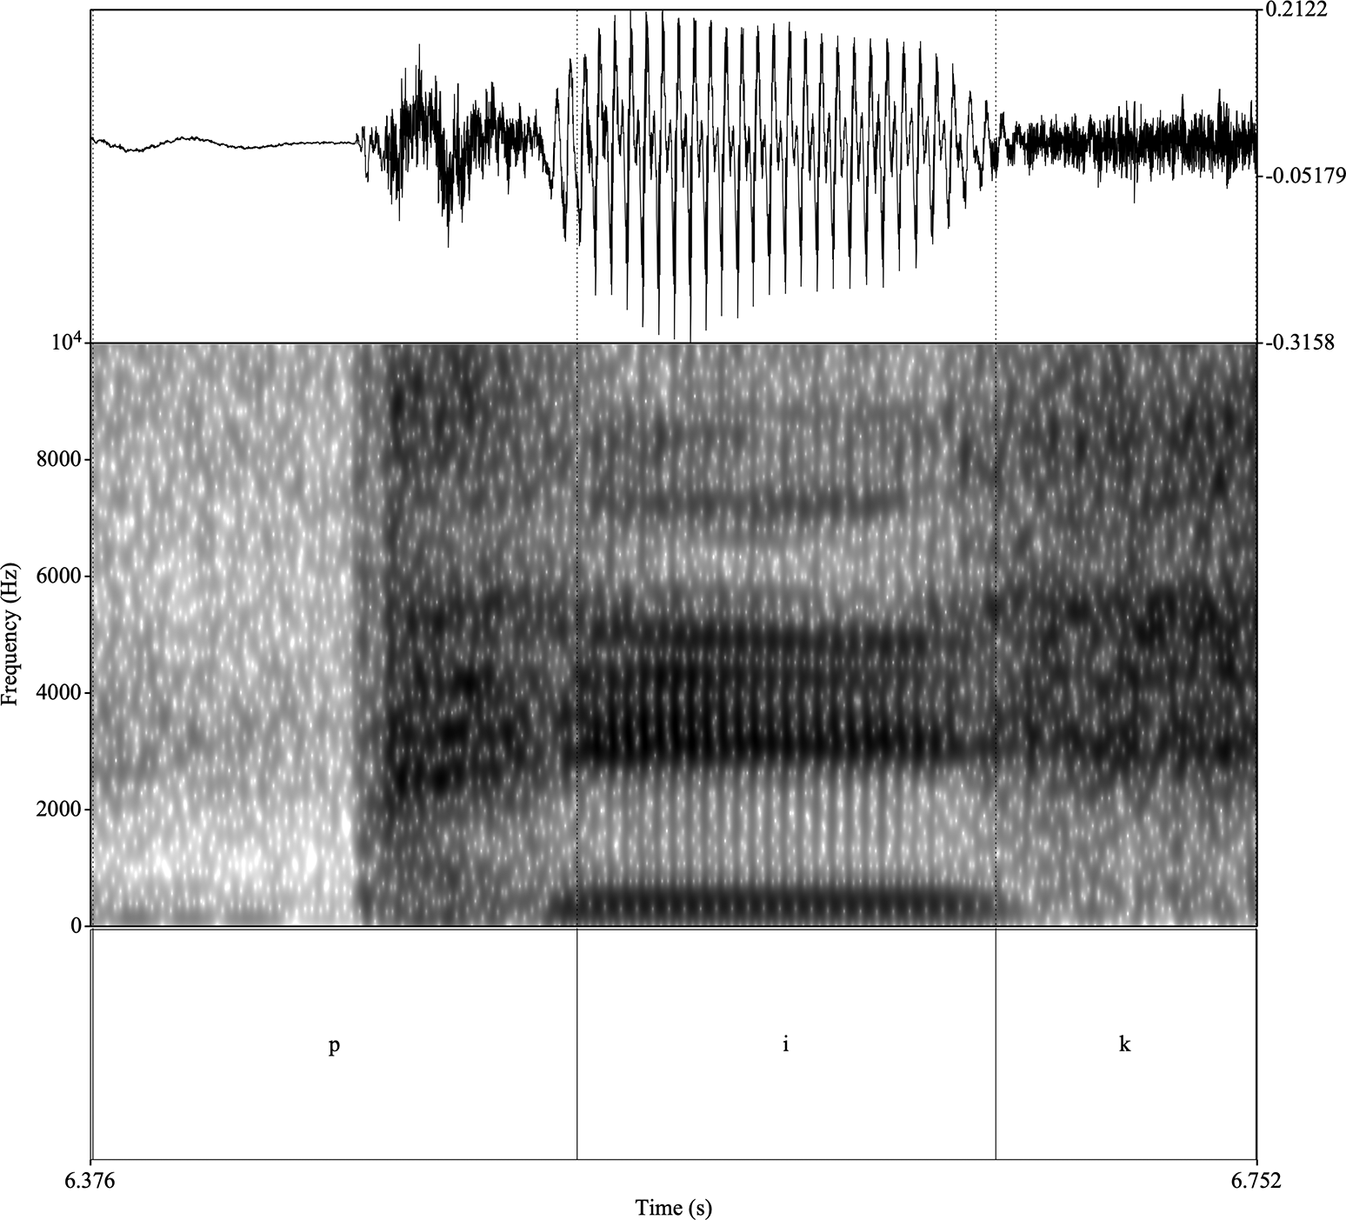
We considered all of these speakers’ fricative realisations of /k/, first auditorily and then on the basis of their CoG (as described in Section 3.2). Tokens were classified as a fricative if the silence that corresponds to the occlusion of stops was absent, as in Marotta & Barth (Reference Marotta and Barth2005) and Watson (Reference Watson2007b). In such cases, the waveform and spectrogram show frication from the end of the preceding vowel to the beginning of the next (as shown in Figure 1). There were very few cases that were ambiguous, but any that were ambiguous were removed from the final analysis.
Example spectrogram & waveform from speaker F01 for the word peek (note that the transcription is for the UR), showing aperiodic waveform and high frequency frication in the realisation of /k/; no stop closure occurs in /k/, unlike in the realisation of /p/.
The procedure for taking CoG measurements differs slightly in each previous study on fricative PoA. Our procedure most closely follows that of Kemp (Reference Kemp2011). All CoG measurements were taken in Praat with the default spectrogram settings. The procedure was as follows: in order to limit co-articulation effects, the spectral slice was taken 0.0075 seconds after the vowel for a duration of 0.05 seconds.Footnote 14 The lenited /k/ fricatives are not of the same duration as non-lenited fricatives and therefore we could not use a spectral slice of 0.2 seconds (which Kemp Reference Kemp2011 used). The CoG measurement was calculated from this spectral slice by Praat with a power of 1 or weighted by an absolute spectrogram. As in previous studies, the raw CoG measurements were not consistent across speakers. In order to ensure that specific informant measurements and the specific vocal tract differences are not responsible for statistical significance, we have normalised the CoG measurements.
Vowel normalisation is a commonly used procedure in acoustic analyses in order to ensure that measurements can be comparable, as gender and speaker-specific vocal tract differences are known to affect vowel formant measurements. On the other hand, consonant acoustic measurements are rarely normalised, despite the fact that many of those measurements will be influenced by vocal tract configurations in a similar way; notable exceptions are Drager & Hay (Reference Drager and Hay2010) and Hay & Maclagan (Reference Hay, Maclagan, Preston and Niedzielski2010). The lack of previous work on consonant normalisation means that there is no standard method for normalising consonant measurements. We used a model similar to the one in Hay & Maclagan (Reference Hay, Maclagan, Preston and Niedzielski2010).
Hay & Maclagan (Reference Hay, Maclagan, Preston and Niedzielski2010) discuss the degree of r-ness in intrusive /r/ contexts using F3 measurements. In order to normalise for vocal tract differences, they took F3 measurements for ‘regular’ /r/ productions in the word Sarah and included this mean F3 measurement in a linear regression model. This should then account for the speaker-specific vocal tract differences. Similar to F3 measurements for /r/ in Hay & Maclagan (Reference Hay, Maclagan, Preston and Niedzielski2010), the fricative frequency range is influenced by differences in vocal tract length.
In order to normalise our fricative CoG measurements, we took measurements of /k/ aspiration. As dorsal fricatives do not generally occur in non-postvocalic positions in Liverpool English, we were not able to take CoG measurements for ‘regular’ dorsal fricative productions in the same way that Hay & Maclagan (Reference Hay, Maclagan, Preston and Niedzielski2010) did. However, there is a potential workaround in our case. It is generally accepted that ‘burst frication is essentially the same as a short duration fricative produced at the same place of articulation as the stop’ (Flemming Reference Flemming2002: 23). Furthermore, stop release bursts have been shown to provide reliable PoA discriminations (see e.g. Dorman, Studdert-Kennedy & Raphael Reference Dorman, Studdert-Kennedy and Raphael1977). Therefore, we used CoG measurements of the release burst for initial /k/ to control for vocal tract length. We used Praat to calculate the spectrum of a 0.01 second-long slice taken immediately following the stop closure. The CoG measurement was then calculated with a power of 1 in Praat. These values were then included in the linear regression model used in the final analysis, and this acted as a normalisation for the CoG measurements of lenited /k/. If the PoA of lenited /k/ is not affected by the preceding vowel, the /k/ burst predictor should account for most of the variation in the model (see Hay & Maclagan Reference Hay, Maclagan, Preston and Niedzielski2010 for a more detailed description of this normalisation method).
4.1 Results
Overall, we found a clear difference between the realisations of lenited /k/ following the fleece and kit vowels in both the auditory and acoustic analysis. The acoustic analysis produced robust results for a quantity-sensitive DFA pattern in LE, as discussed below, and indeed the spectrograms are often visually different for palatals and back fricatives (see Figure 2 for a clear example, comparing realisations of seek, with a fleece vowel, and sick, with kit).
Comparison of a palatal and back fricative for speaker F01 in the words seek and sick. IPA symbols used here are approximate surface transcriptions.

The average CoG values, including all measurements from all speakers, show a clear difference between dorsal fricatives following fleece (with an overall average of 4922 Hz) and those following kit (with an overall average of 4088 Hz). Table 5 gives results of the CoG measurements for each individual speaker. Note that some have a big difference between the average CoG for post-fleece fricatives and that for post-kit fricatives (e.g. M02) and some speakers do not (e.g. M03).
CoG measurements per speaker and overall.

A clearer way to look at the difference between the CoG values is to inspect the distribution of the values overall in a density plot, as in Figure 4, which shows a clear distinction (a bimodal distribution) between the CoG measurements even when all speakers are grouped together. Figure 4, like other results below, uses the graphical type of representation called ‘violin plots’. Violin plots are a combination of a box plot and density plot (Hintze & Nelson Reference Hintze and Nelson1998). Box plots show a distribution of values based on five values: the minimum, first quartile, median, third quartile, and the maximum. The line in the centre of the boxes indicates the median values. The notches in the sides of the boxes show whether the medians of the boxes differ. In other words, if two boxes’ notches do not overlap that is taken as ‘strong evidence’ that their medians are different (Chambers et al. Reference Chambers, Cleveland, Kleiner and Tukey1983). Note that the notches are only used as visual aids and the effects that we report on were checked using standard statistical procedures, as described below. The box plots shown in violin plots also indicate the mean, which is represented by a white dot. Figure 3 is an example plot, to show how they should be interpreted. In it, the median of all three categories likely differ from one another, as none of the notches overlap. Furthermore, the figure demonstrates that the mean and median are the same for ‘cat1’, but not for ‘cat2’ and ‘cat3’, because the line in the middle of the boxplot and the white dot align for ‘cat1’, but not for ‘cat2’ and ‘cat3’.
Example violin plot.

Distribution of CoG measurements by vowel across all speakers.

Density plots are similar to histograms, as the frequency distribution of a feature is shown along a continuous dimension. Therefore, density plots demonstrate the distribution of measurement values in relevant categories in a data set, such as the preceding vowel. The example plot in Figure 3 shows that the distribution for ‘cat3’ is much wider than the distribution of the other two categories, and that ‘cat1’ and ‘cat3’ have a more normal distribution than ‘cat2’, as shown by the bumps in the distribution of ‘cat2’. Density plots are difficult to interpret when there are more than two categories and do not provide information about differences in average measurements across categories. Therefore, violin plots are preferable to either density plots or box plots alone. In Figure 3, the density plot portion demonstrates that the distribution of ‘cat1’ and ‘cat2’ overlap to a large extent, despite the differences demonstrated by the box plots in terms of the medians, means, and overlap of boxes. The plots have the relevant groups or categories plotted along the x-axis, with the y-axis showing the measurement.
Figure 4 presents a violin plot for the results in Table 5, showing the average CoG measurements for all speakers together, for post-fleece fricatives (labelled ‘fleece’) and post-kit fricatives (labelled ‘kit’). Although there is some difference in terms of the behaviour of individuals, there is clearly a massive non-overlapping difference between the CoG averages for the two types of fricative.
In order to ensure that this effect was not being driven by specific tokens, we considered the CoG measurements across all tokens for each word across all speakers, as presented in Figure 5. These results corroborate our findings: all tokens within each vowel can be seen to be behaving as a group. The tokens of lenited /k/ in post-fleece environment all have CoGs that are categorically higher than those for post-kit tokens.
CoG measurements across all speakers by token. Fleece is dark grey, kit is light grey. (Boxplots are not included in this graph because the plots are too small.)

Finally, we used a linear regression model to see if our results are statistically significant and to test whether the results are due to speaker-specific vocal tract features. In the linear regression model, the dependent variable was CoG measurements, and the predictors were preceding vowel and the normalisation of CoG measurements. Random intercepts for speaker were also included in the model. The vowel came out as a highly significant predictor for CoG measurements, as shown in Table 6. In other words, there is a statistically significant difference between the CoG measurements for post-fleece and post-kit fricatives.
Results from the linear regression model showing that the difference in terms of the two vowels’ CoG measurements (named ‘vowelkit’) is statistically significant.

If we compare these results to those found for other languages (in the studies mentioned in Table 1 above) our results are much closer to what was found for Gaelic and Western Aleut (by Gordon et al. Reference Gordon, Barthmaier and Sands2002) than to the German results (from Kemp Reference Kemp2011). The CoG distinction between post-fleece and post-kit fricatives is comparable to the distinction in Gaelic and Western Aleut, and the post-kit fricatives have a CoG around or between that found in other languages for a back dorsal ([x-χ]). However, the range of variation that we found seems to be more like that found in Kemp (Reference Kemp2011), in that there are some speakers with very large frequency ranges for CoG, such as F06.
Overall, therefore, our results are clear: even though both fleece and kit are front high vowels, the dorsal fricatives that follow fleece have an average CoG which is around 1000 Hz higher than the dorsal fricatives that follow kit. This difference is analogous to the difference found for palatal and back (velar-uvular) dorsal fricatives in other languages, and it maps onto a distinction that we noted in our initial auditory classification into palatal and back dorsals: the fricatives following fleece tend to sound like canonical palatals, while those following kit tend to sound velar-uvular. As hypothesised, it is the difference in quantity of the vowel which determines whether the fricative assimilates to a preceding front high vowel. This kind of pattern is by no means expected. We are not aware of any report of a similar pattern in previous literature, even in closely related languages which also feature dorsal fricatives: German has consistent [ç] following both long and short front high vowels (as in [ziːç] siech ‘ill’ and [zɪç] sich ‘self’), and [x-χ] following non-front-high vowels (as in [daχ] Dach ‘roof’), as shown in (1), while Dutch does not have DFA at all, with [x-χ] following [i], [ɪ] and [a] (as in vlieg ‘fly’, zich ‘self’ and vraag ‘question’).
We therefore see our results as establishing that LE does indeed feature quantity-sensitive DFA. However, Table 5 shows that there is interspeaker variation in this phenomenon, so we need to consider our results at a speaker-specific level. Table 5 shows that some speakers have a robust categorical difference between the CoG measurements after fleece and kit. This is further shown in Figure 6, which represents the results for speakers F02 and M02. On the other hand, certain other speakers have more overlapping CoG measurements, as shown in Figure 7 for speakers F07 and M04. Note also that speakers with a categorical difference between CoG measurements in the post-fleece and post-kit environments (as in Figure 6) operate on a tighter scale (approximately 2000 Hz) than the speakers with overlapping distribution (as in Figure 8).Footnote 15 A final set of speakers do not, in fact, have a quantity-sensitive pattern of DFA at all, but rather have palatal realisation of the fricative with both vowels, as shown in Figure 8 for speakers F06 and M03 – that is, the fricatives that follow both fleece and kit vowels have CoGs at the high end of the Hz measurements produced in this study, which are comparable to the palatals which only follow fleece in other speakers (and which sound palatal in auditory analysis). The behaviour of this last group of speakers is most compatible with the assumption that their dorsal fricatives do undergo assimilation but that the assimilation is not quantity-sensitive.
Speakers with a categorical difference between CoG measurements before fleece and kit.

Speakers with quantity-sensitive DFA, but overlapping CoG measurements.

Speakers without quantity-sensitive DFA.

A summary of the results reported in this section is given in Table 7, which shows that while all 12 speakers show DFA, two speakers do not show a quantity-sensitive pattern. Of the 10 speakers who do show quantity-sensitivity, five show overlapping distributions for the two realisations in terms of CoG (and hence, we assume, precise PoA), while five do not have an overlapping pattern, showing clear categoriality in terms of the two realisations. The two speakers who have only one (assimilated) realisation of the fricatives naturally cannot have overlapping distribution (hence the ‘n/a’ in Table 7).
Summary of patterns of DFA found in the 12 speakers.

There are thus in fact three types of speakers in our data – that is, there are speakers with the three types of pattern/grammar shown in (7).

This kind of interspeaker variation in terms of LE DFA has been reported before (although not in such detail). The transcriptions and descriptions for LE dorsal fricatives that Watson (Reference Watson2007b) gives indicate that the precise realisational possibilities vary from person to person. As noted above, Watson (Reference Watson2007b: 178) writes that ‘[t]he two “most front” fricatives are provided [by] the male speakers only – there are no female tokens of the palatal’, showing that in his data there is a gender-based pattern in terms of assimilation. We do not find this in our data.
We cannot perceive any correlation between the three types of pattern in (7) and the age, gender or class of the speakers (as described in Table 4 above), and while both speakers from the south of Liverpool are in category (7b), there is not enough data to show for sure that there is a geographical pattern as it may be that if we had more speakers from the south there would be more variation in them. There is no real variation in terms of whether speakers’ parents were from Liverpool, either (practically all parents were from Liverpool); both parents of the most exceptional speakers (M03 and F06) were from Liverpool, and there is nothing about the speakers that would pick them out as unusual based on the information that we collected from them.
We lack the space in this article to examine why these three distinct groups of speakers exist. For present purposes, we simply assume that the existence of speakers such as those in (7a, b) (especially those in (7b)) show beyond doubt that quantity-sensitive DFA is possible, and that it exists in the majority of our speakers. We present a phonological analysis of this pattern in Section 5. An earlier version of this article included an account of the relationship between the three groups of speakers in (7). This will now appear as Cardoso & Honeybone (to appear) due to length constraints on the current article (in a nutshell, our analysis is that (7a–c) represent diachronic stages of development of the phenomenon, frozen as individual differences in grammars within the current speech community).
5. Analysis: Liverpool English vowels, consonants and DFA
The last section has shown that for the majority of speakers that we investigated, fricatives in words of the fleece lexical set assimilate, while fricatives in words of the kit lexical set do not. What is responsible for this pattern? In this section, we offer an analysis of this pattern, in several steps. Section 5.1 provides a featural analysis of the phonology of LE vowels and relevant aspects of LE consonants, in order to establish the groundwork for the formalisation of the quantity-sensitive assimilation pattern, which is set out in Section 5.3. Section 5.2 gives justification for some of the assumptions that prove crucial in Section 5.1.
5.1 Preliminaries to an analysis: LE vowels and consonants
It is clear from Section 4 above that the nature of a preceding vowel can determine the PoA of a following dorsal fricative in LE. As we have seen, this is similar to DFA patterns in other languages, and while an analysis of the German DFA pattern is given in (3) above, this cannot simply be transferred to LE – aside from the quantity-sensitivity, there is no LE DFA in environments that are not preceded by a vowel. If we assume that the PoA patterning of LE dorsal fricatives is, however, similarly derived – by assimilation driven by some aspect of the featural composition of preceding segments – then we need an analysis of the featural make-up of LE vowels and of those aspects of consonantal PoA that interact with them. No such analysis has previously been provided. We offer one here. We take as our starting point the description of LE in Watson (Reference Watson2007c), which is the most comprehensive (if concise) recent discussion of LE segmental phonetics extant, and we use a theory of features which aims to be simple and broadly translatable across frameworks.
Watson (Reference Watson2007c) discusses the segmental contrasts of LE and their surface realisations, showing that LE has the same number of vocalic contrasts as most other varieties of English from northern England except in one specific case. Watson sets out the LE vowel contrasts as in (8), with a segmental transcription and example words for each (in line with an IPA-related transcriptional tradition for English), to which we have added the relevant keyword from the system of lexical sets developed in Wells (Reference Wells1982).

As (8) shows, Watson (Reference Watson2007c) analyses vowels as inherently long or short. Although we acknowledge the controversy regarding the underlying nature of the contrast in English between pairs of vowels such as fleece and kit (Knowles Reference Knowles1973, for example, does not transcribe length for tense vowels at all, relying on a contrast between /i/ and /ɪ/ which could be described as tense/lax), we accept Watson’s characterisations for the purposes of this paper. As we show in Section 5.2, the phonetic instantiations of such vowels in LE do differ in duration, as has been described for many other (especially British) varieties, so length is presumably phonological at some level. We follow Watson in assuming that it is fundamental, as explained below. As (8) also shows, Watson proposes the transcription /ʉː/ for the goose vowel; that is, the vowel is not back at any level of analysis. This is not due to a recent/variable fronting (unlike in many varieties of English, as shown in e.g. Labov, Ash & Boberg Reference Labov, Ash and Boberg2005, Ferragne & Pellegrino Reference Ferragne and Pellegrino2010). Rather, the goose vowel has been non-back for as long as we have records for LE. Although Knowles does not overtly transcribe this, he does not disagree, writing (Reference Knowles1973: 270) the ‘[c]lose central /u/ varies … from front of centre to back of centre. At the front it overlaps with /i/, but is quite distinct from it on account of the auditory qualities and tongue-shape associated with rounding’. Watson’s transcription /ʉː/ makes explicit the non-back quality of the vowel involved, so we adopt it here.
The set of contrasts in (8) also shows that LE has two contrasts less than the ‘Maximal English’ (Honeybone Reference Honeybone2010) set of vowels. One of these is expected for a northern English variety: there are contrasting vowels in kit, dress, trap and lot, but the same vowel occurs in the foot and strut sets. More unusually (but shared with the neighbouring Lancashire English), LE has the same vowel in the nurse and square sets, so LE has one contrast less than most other English varieties of English in the set of vowels variously described as ‘free’, ‘long’ or ‘tense’. We again follow Watson in using /eː/ to transcribe the LE nurse/square vowel as this seems to indicate the typical frontness of the vowel in most current LE speakers. There is much else that could be said about the LE vowel contrasts, but most other points are not specific to LE, so we expect they do not need discussion here. We note further only that the LE face and goat vowels are typologically unusual for Northern English English as they are diphthongs, and that, as Cardoso (Reference Cardoso2015) shows, the price and mouth vowels have complex patterns of realisation, so the transcriptions in (8) should be seen as ‘default’ or underlying forms.
We will need an understanding of the subsegmental make-up of these vowels in order to understand the pattern of DFA described above, so we offer a full analysis of the LE vowel system here. All that we will need for LE consonants is the specifications for certain places of articulation, and we consider those here too, in ways which lean heavily on that discussed for vowels. We follow Watson’s (Reference Watson2007c) description closely, but Watson does not analyse the featural phonology of the segments. In doing that here, we are influenced by the search for pattern congruity and economy, by the aim of capturing how the segments behave in the phonology of the language, as well as by the search for an appropriate degree of what Honeybone (Reference Honeybone2010) calls ‘surface-respect’ (that is, the segments’ underlying specifications should reflect the phonetic space of their phonetic interpretation to a fair degree, to the extent possible while still accounting for phonological patterning and processes).
We use a small set of privative features, following a practice adopted, for example, in Honeybone (Reference Honeybone2001, Reference Honeybone2005) and Watson (Reference Watson2007b), which is in line with representational trends in segmental phonology, but which also aims for the specifications to be as translatable as possible into compatible frameworks. In this approach, segments may consist of single specifications, or may be ‘complex’ in consisting of more than one specification. In (9), we name the specifications that we use to characterise PoA relatively transparently, enclosing them in vertical slashes (borrowing a convention of Dependency Phonology). We use them to analyse the basics of the LE vowel system in (10) below.

The specification names can be spelt out in various ways, as shown in (9), and so can largely be seen as straightforwardly interpretable in many frameworks (part of the point of using the cover-names for specifications is that the issue of quantity-sensitivity for a segmental process arises whatever model of features is adopted). The second column in (9) gives the formalism of the tradition which our set of specifications is most closely in line with, often referred to as the ‘Dependency/Government’ approach (e.g. in Carr, Durand & Ewen Reference Carr, Durand and Ewen2005), or ‘Element Theory’ (e.g. in Backley Reference Backley2011), hence ‘ET’.Footnote 18 This approach shares lines of argumentation with feature geometric approaches, for which specifications are given in the third column in (9). This follows work such as Sagey (Reference Sagey1986), but is modified by arguments that front vowels are specified in the same way as coronal consonants, as in Clements (Reference Clements1991) and Lahiri & Evers (Reference Lahiri, Evers, Paradis and Prunet1991). We also give, in the fourth column, equivalent specifications from a recent influential development of such ideas: the Parallel Structures Model (Morén Reference Morén2003, Reference Morén, Blaho, Bye and Krämer2007).Footnote 19 The fifth column gives approximate equivalences to the specifications used here with the features used in the SPE tradition. As our approach assumes privativity, the translatability of specifications given in (9) is not completely straightforward, but to most intents and purposes, when we use particular specifications below in the representation of segments or formalisation of processes, they can be translated in this way.
In aiming for translatability here, we ignore a number of complex issues in the representation of PoA (e.g. should labials and dorsals share some aspect of the same place of articulation; should palatals and coronals?). For the purposes of this paper, we do not need to commit to answers to these questions as they do not weigh on the phenomenon discussed.
We make one further representational assumption: that there is headedness in segmental melody. This assumes that all melodic entities need a head (as discussed widely in the tradition of segmental representation that we build on, for example in Backley Reference Backley2011: 42). We mark a head in segmental representations, such as those given in (10) for the set of LE monophthongs set out in (8) above, using bold type.

The specifications in (10) assume that quantity is indeed fundamental, with the fleece and kit vowel, for example, consisting of the same featural specifications, but linked to either one or two skeletal units. More explicit representations are given in (11), which are in line with those of Backley (Reference Backley2011: 47), for example. ‘N’ represents a nucleus, and ‘x’ represents a ‘timing-slot’, as in many representational models (a rhymal x-slot can be seen as analogous to a mora in mora-based approaches, which we discuss further in Section 5.3).

We assume here that the specifications attach, through root nodes, to skeletal timing slots and that the difference of articulation which is often described as tense/lax (e.g. that the fleece vowel is tense, and the kit vowel lax) is a reflection of the realisation of the different phonological objects.
We assume, as is traditional in such representational approaches, that diphthongs of the type found in English are also represented with two x-slots, as in (12).Footnote 20

As (12) shows, we assume that each part of a diphthong has its own head. This seems right because, for example, the goat vowel /ɛʉ/ has multiple elements in each part of the diphthong. Diphthongs are thus simply specified as for two monophthongs, so price = /a/ + /ɪ/ and goat = /ɛ/ + /ʉ/. The placement of a head in a representation has no relevance; for consistency, we always place it lowest.
The specifications for the PoA of LE vowels in (10) above are quite straightforward once the set of specifications set out in (9) is adopted. In a simple vowel system of the type /i a u/, each vowel contains only one specification, and each of the three specifications produce a distinct vowel. In a linguistic system like LE, which has multiple heights, mid vowels are represented as complex, so, for example, the dress vowel is comprised of the specifications which independently make up the kit vowel and the trap vowel. Kostakis (Reference Kostakis2015) offers a wide range of arguments in favour of such representations (from the behaviour of such vowels in a large number of diachronic developments in Germanic languages, of which LE is one) and against alternatives (such as non-specification for place in mid-vowels), and we see this as good evidence in favour of such representations.
Other aspects of (10) need some comment. The kit vowel /ɪ/ cannot be left unspecified in terms of the features used here (as Youssef Reference Youssef2010 does in a PSM approach for Buchan Scots) as there is no evidence for any other feature to specify it distinctly from schwa, which can then itself be left unspecified (unlike for Buchan Scots, where Youssef argues that a feature [Lowered Larynx] is needed in the system). The representations in (11) fit the LE system, as we discuss further below, and they fit the phonetic facts, as we discuss in Section 5.2.
The notion that segmental representations involve headedness fits well with the analysis we propose for the LE pattern of DFA. In (10), we assume that |lowness| is head where it features in a segment. This has the effect that |palatality| is not head in complex vowels, an analytical assumption which is carried over into the representation of the goose vowel /ʉː/, which we assume is specified with a dependent |palatality| because of the consistent and persistent long term phonetic placement of the vowel in the front-to-central section of the vowel space (this is clearly the target that speakers aim at). This does not make the goose vowel a ‘front’ vowel, as it contains both |palatality| and |dorsality|, which pull the vowel both ways (both to the front and to the back, which in LE is resolved by realising the vowel as front-to-central); in fact, nothing in our analysis depends on this complex specification of /ʉː/, but the overall analysis of the vowel system in (10) seems most compelling, for reasons that we touch on below. Our headedness assumptions do not follow from a principle, but they fit best with the patterning that LE shows. They combine with the other assumptions above to provide an analysis of the LE monophthong inventory which sees it as a symmetrical system of vowel pairs, disturbed only at the back-high place, where there is no pair (only the foot/strut vowel is there) – instead, the goose vowel is filling what would otherwise be a complete gap in the system: it is a high central vowel. The symbols suggested by Watson (Reference Watson2007c), given in (8) and (10), are arranged into the system suggested here in (13a) below. We continue to use these symbols below for the sake of transcriptional tradition, but we acknowledge that our analytical assumptions really imply that LE has a system of segments that would best be transcribed as set out in (13b), with the difference in the pairs being one of quantity, and with the mid-vowels specified with |lowness| as head.

This latter point is in line with the observation that the LE nurse/square vowel is in fact transcribed as /ɛː/ in much other work on LE (e.g. Watson Reference Watson2007b, Honeybone, Watson & van Eyndhoven Reference Honeybone, Watson and van Eyndhoven2017).
A final implication of all this is that the LE diphthongs would best be transcribed as set out in the last column in (14), in which the first two columns are from Watson (Reference Watson2007c), and the third shows Wells’ (Reference Wells1982) keyword for the relevant lexical set. As shown in (12) above, the first part of the face and goat diphthongs are in fact analysed here as phonologically the same.

We do not need to consider the segmental make-up of LE consonants in as much detail as its vowels, as only the place of articulation is really relevant, and within PoA only those places relevant for DFA are necessary. We represent them as shown in (15), using some of the specifications from (9).

This means that we assume that [ç] is specified in terms of PoA only by |palatality|, not by (the equivalents of) both |palatality| and |dorsality|, which is what Robinson (Reference Robinson2001) assumes for his rule presented in (3) above. Our assumption is translatable into the use of |coronal| to specify the place in [ç], as long as that feature is also used to specify place in front high vowels (as in Clements & Hume Reference Clements, Hume and Goldsmith1995 and much else, but not as in Sagey Reference Sagey1986 and other such work). Within |dorsality|, we assume that a range of precise articulations are possible ([x˖~x~χ˖]), likely driven at least in part by coarticulation.
Otherwise, in terms of consonantal structure, we assume only that fricatives include a specification |frication|, which can be translated into |h| in most varieties of Element Theory, as ‘C-manner [open]’ in the Parallel Structures Model, and as [+continuant] in a more traditional feature system. We therefore represent [ç] as in (16), where the specification for place is assumed to be head, as for vowels (although little hangs on this in terms of our analysis of DFA).

We can now present a formalisation of the patterning of LE DFA which was shown to exist in Section 4. We do this in Section 5.3 below. Some of the assumptions made in this current section will be crucial in that. It may be, however, that the reader will doubt some of these assumptions (Are fleece and kit really both front high vowels? and are they really differentiated as ‘long’ and ‘short’?). In anticipation of such worries, we next present some clear evidence in favour of our position.
5.2 Are fleece and kit really both front high vowels? And are they long and short?
Section 5.1 argues that the LE fleece vowel, which triggers DFA to produce [ç] in the patterns described in (7), is phonologically different from the LE kit vowel, which does not trigger DFA in the patterns in (7a) and (7b), only in that fleece is long and kit is short. But is this really the case? A reader might assume that the vowel that we are transcribing as /ɪ/ in LE is actually not front and high at all (as in New Zealand English, Scots and in some environments in South African English), and that this is why no assimilation occurs after it. This is not the case, however: there are good reasons to see LE kit as a front high vowel which is phonologically specified for the feature that can in principle induce palatalisation in DFA, in exactly the same way as the fleece vowel. While we do not expect to be able to read off phonological specifications from phonetic data in a simplistic manner, we expect some degree of ‘surface respect’, such that vowels that are specified by |palatality| will be in the front-high section of the vowel space. If LE kit is central, as in some other varieties of English, we would not expect it to be specified by |palatality|. Figure 9 is a plot of LE vowels from our data which shows the relevant placement of a number of LE vowels in the standard F1–F2-plot approximation of the vowel space.Footnote 21
F1–F2 plot showing the phonetic realisation of LE vowels.

While schwa (represented by ‘@’) is rather high in Figure 9, this may be because final schwas can be raised in LE, and schwa is unspecified in terms of place, so may be expected to have a wide range of realisations. As assumed in Section 5.1, affiliation to a double unit of length produces a more extreme articulation, and from what we know about practically all varieties of English, we would not expect both members of the fleece/kit vowel pair to occur in exactly the same spot on the vowel space; nonetheless, Figure 9 shows that kit is fundamentally in the front-high quadrant of the vowel space in LE, between fleece and dress, and overlapping with face.
The placement of kit in Figure 9 is similar to its placement in the F1–F2 plot for Liverpool given in Ferragne & Pellegrino (Reference Ferragne and Pellegrino2010), which compares such plots for a number of varieties of English, with kit on a diagonal between fleece and dress. This is fundamentally the same as Ferragne & Pellegrino’s findings for varieties of English from Birmingham, Cornwall, East Anglia, East Yorkshire, Lancashire, Newcastle upon Tyne, Dublin, and for ‘Standard Southern English’, but is different to what they find for Glasgow, Elgin (Scottish Highlands), and Belfast, where kit is clearly central. Given that LE patterns like the former set of varieties, a reasonable conclusion is that kit is a front high vowel, like fleece, in LE if it is anywhere in English. If LE patterned like the latter set of varieties, a case could be made that kit was not a front high vowel in LE.Footnote 22
The above shows, to the extent that phonetic data can, that both fleece and kit are front high vowels in LE (of the type that we might expect to be characterisable using |palatality|), with their difference in the extremity of their articulation due to differences of implementation. But do they really differ in quantity? If so, we would expect that fleece would be realised with fundamentally longer duration that kit, with fleece comparable to a diphthong like price. Figure 10 shows that this is the case. The plots in Figure 10, which show the measurements for the duration of these vowels in the data collected for this study and for Cardoso (Reference Cardoso2015), indicate that fleece is fundamentally longer in its duration than is kit, with completely non-overlapping boxplots. On the other hand, fleece and price are of overlapping, comparable length.
Duration of LE vowels.

All available phonetic evidence indicates that the basis of the difference assumed for fleece and kit in Section 5.1 is on the right lines. In any case, the minority of speakers of LE listed in (7c) have a grammar in which both fleece and kit cause palatalisation, which implies that both vowels contain the specification which can cause the LE dorsal fricative to become a palatal. It seems, though, that in most speakers, kit is prevented from passing on this specification. We turn to the reason for this now.
5.3 Analysis: Quantity-sensitive DFA in Liverpool English
The basic assimilation in the DFA described in (7) is nothing out-of-the-ordinary. As shown in (1), DFA in which palatal fricatives correlate with front high/mid vowels and back fricatives with other vowels is common, and can be modelled by spreading a feature which only front high/mid vowels have to the fricative, or by forced agreement of the fricative’s place features with those in the vowels. As will be clear from Section 5.1, we assume that this involves the transference of |palatality| from a vowel to a following fricative. The key question, which makes the data described here exceptional, is: why does the DFA (in the majority of speakers) only occur following long vowels? To answer this, we follow a lead given in Bye & de Lacy (Reference Bye, de Lacy and de Carvalho2008), which links certain segmental patterns to foot structure. The LE pattern has a fundamental difference to that described by Bye & de Lacy, however, as explained below.
We model the basic assimilation as in (17). This is a simple representational conception of DFA as spreading, in which |palatality| spreads when it is the head of a segment (represented, as above, in bold) to a following back fortis fricative, which then loses its own place specification (|dorsality|), resulting in [ç]. The latter point could follow from the assumption that a segment can only have one head, and so |palatality| replaces |dorsality|, but this assumption is not absolutely necessary. (17) can be translated into whichever representational framework a reader prefers – indeed it could be seen as the addition of |palatality| to |dorsality| if that is the representation preferred for [ç]. The process in (17) could also be implemented OT-style as the satisfaction of a high-ranked Agree(|palatality|) constraint penalising VF sequences in which members do not either both have or lack |palatality| (where ‘F’ refers to a dorsal fricative), or using a high-ranked constraint which bans a sequence of a back or low vowel followed by [ç], as in Merchant (Reference Merchant1996). The precise implementation of the part of the process in (17) is not crucial.

The representation in (17) accounts for the non-quantity-sensitive pattern in (7c). The majority pattern in the LE data, however, in (7a) and (7b), is quantity-sensitive: DFA occurs if the preceding vowel (monophthong or diphthong) is long, but not if it is short (we deal with the difference between (7a) and (7b) in Cardoso & Honeybone, to appear, viewing them as stages in the phonologisation of DFA). Quantity-sensitivity is not normally associated with segmental phenomena, but Bye & de Lacy (Reference Bye, de Lacy and de Carvalho2008) describe another phenomenon which requires it. Flapping in English (at the lexical level) typically occurs in intervocalic (or intersonorant) position, as long as the second syllable in the relevant sequence is not stressed. Bye & de Lacy (Reference Bye, de Lacy and de Carvalho2008: 197) show, however, that post-stress flapping in New Zealand English (NZE) Acrolect has the patterning in (18).

The distinction between examples like hatter [hǽɾə] and barter [báːtə] shows that, in NZE Acrolect, flapping only happens if the preceding vowel is short. Bye & de Lacy account for this by proposing that it is related to the different positioning of the /t/ in the foot, assuming that the English foot is the moraic trochee, following a long line of work such as Hayes (Reference Hayes1987, Reference Hayes1995). The footings given by this assumption, with the foot represented by parentheses, are [(hǽɾə)] and [(báː)tə], because short vowels and coda consonants each possess one mora, and long vowels possess two. The footings relevant here (and throughout this article) are the initial footings (it is likely that, later in a derivation, initially unfooted syllables are grouped into higher-level feet, or ‘superfeet’). A mora is equivalent to a rhymal x-slot for our purposes, and we use the term ‘mora’ to refer to this type of structure below. This means that both the [æ] and [ə] from hatter are needed to form a foot, which in turn means that the /t/ in that word is foot-medial, whereas the [aː] vowel of barter contains two moras, so the /t/ in that word is not in the foot, and flapping is blocked. The precise implementation of Bye & de Lacy’s account of flapping need not be considered here; their crucial insight is the role of foot structure in conditioning it. Fundamentally, if the target for flapping is outside of the foot, flapping is blocked.Footnote 23
The pattern that Bye & de Lacy describe is similar to, but also notably different from, that described in this paper. The quantity-sensitive pattern of LE DFA is, we propose, not blocked, but triggered if the target is outside of the foot. Thus, for speakers with quantity-sensitive DFA, we account for the difference between teak, where DFA occurs (following fleece), and tick, where it does not (represented here and below using [χ] to represent a back dorsal fricative), following kit, as in (19), with foot structure again represented using parentheses.
The [ɪ] of tick has one mora, so the foot (which requires two moras) includes the following consonant, which is also moraic (coda consonants are typically assumed to be moraic in Standard English for syllable-weight-based reasons, and this also applies to LE); the [iː] vowel of teak, on the other hand, has two moras itself and the following fricative (which is moraic itself as it is in a classical coda position) cannot be included in the bimoraic foot.
We assume, therefore, that the quantity-sensitive DFA process, as found in the large majority of the LE speakers, can be characterised as in (20), where foot structure is made explicit (the foot boundary is also marked with a subscript F for clarity).

This should be read as requiring that a foot-boundary be present between the trigger and the target for the spreading to occur, and (as above) that |palatality| must be a head in order for it to spread. Another way of saying this is that the target dorsal fricative must be outside the basic bimoraic foot in order for it to assimilate. Given the representations proposed in Section 5.1, we think this makes exactly the right predictions. It shows that DFA will occur in teak, and all words with that rhyme, as in (21), which represents the rhyme of such words.

(20) prescribes that the (quantity-sensitive) DFA in question here will not occur in tick (or other words with that rhyme), as shown in (22), with the foot boundary not where it needs to be in order to trigger DFA. The potential target for the DFA is inside the foot that contains the potential trigger, so no DFA occurs.

(20) makes further clear predictions as to where LE quantity-sensitive DFA should and should not occur. We predict that there will be no palatal fricatives following vowels which do not contain |palatality| (low vowels, schwa, /ʊ ɒ ɔː/). DFA should also not occur in words with the dress vowel, such as tech, because neither the foot structure nor headedness requirements are met, as shown in (23).

DFA should also not occur in fricatives following the goat vowel, as in toke, because the headedness requirement is not met, as in (24), nor will it occur in words with the nurse/square vowel, such as Turk, as in (25).


We predict that the process will occur, however, following the price vowel, as in tyke, shown in (26), and this also holds for words like take (with face).

Finally, we predict that LE quantity-sensitive DFA will also occur in a medial environment in words with a fleece, price or face vowel, such as taking or bacon (which would be [(beɪ)çn̩]), as shown (minus the initial consonant) in (27), because the fricative is in the environment described in (20). DFA is predicted not to occur, however, in medial dorsal fricatives following a short vowel, including kit, as in words such ticking or chicken ([(t͡ʃɪχn̩)]), as shown (minus initial consonant) in (28), because the fricative is foot-internal.


These predictions are empirical, but their full testing is beyond the scope of this paper. They can, however, be easily checked against all previous descriptions of LE dorsal fricatives, as described in Section 3.1. They hold up well in this light. As mentioned above, Knowles (Reference Knowles1973) does not transcribe or describe palatals, possibly because his fieldwork was conducted before the pattern of DFA described here was innovated. The other representative transcriptions and descriptions that are based on first-hand phonetic analysis (we consider here Marotta & Barth Reference Marotta and Barth2005, Watson Reference Watson2007c and Ogden Reference Ogden2009), fit well with what we predict.Footnote 24 Watson’s (Reference Watson2007c: 353) observation that ‘palatal fricatives can be found following the close front monophthong [iː] and closing diphthongs [eɪ, aɪ]’ is clearly compatible – it does not explicitly exclude palatals following short vowels, but we might expect that Watson would mention short vowels in this place if he had noticed palatals following them. None of the previous work discussed here provides an example of a dorsal fricative following a short front high vowel that we could consider, apart from Wells (Reference Wells1982), which transcribes neck as [nɛχ] – if this is allowed as a relevant datum, it is compatible with what we predict.
The transcriptions discussed in Section 3.1 unambiguously describe back dorsals following short vowels, as in [bax] back (given by Watson and Ogden), [dɒχ] dock (Watson and Ogden), [tsʊx] took (Watson); in terms of post-long-vowel fricatives, all data also fit our predictions, as in [ʃaːx] shark (Watson), [wiːç] week (Watson and Ogden), [laɪç] like (Watson and Marotta & Barth), [tˢeɪç] take (Watson), and also in terms of the goat vowel, as shown in [klɛʉx, kʰlɛʉx̟] cloak (Watson) and [sməʉx] smoke (Ogden), even though the authors transcribe the vowel slightly differently. All of this is as predicted above.
In terms of medial fricatives, our predictions also fit with previous data. Watson (Reference Watson2007c) gives [maːxɪh] market, with a low vowel and hence no DFA, and [meɪçən] making, with a face vowel, and hence a palatal. We have no data for post-medial-kit-vowel dorsal fricatives, and this offers a crucial empirical prediction if our foot-related analysis is correct. We think it is relevant here that the pronunciation of chicken with (pre-)uvular fricatival scrape (i.e. with a back dorsal fricative) is a shibboleth for LE, doubtless because the uvular is strident/salient. This should become clear if the reader googles Scouse chicken, or the phrase ‘chicken and a can of coke’, which should bring up a large number of results (22,900 on 3rd July 2020 including http://www.wikihow.com/Talk-Like-a-Scouse-Teenager). While some of this material is playing with stereotypes (and may be insulting), we see it as evidence that our prediction is met: the fricative in this environment is back, as no DFA can occur.Footnote 25
6. Conclusion
The large majority of speakers that we report on in this paper have a robust pattern in which the quantity of a preceding vowel constrains the application of assimilation. We are aware of no process with identical patterning in any other language, so we hope that the material discussed here is of interest. Palatalisation really can be quantity-sensitive, and phonology needs to be able to model this.


 Open access