



Overweight and obesity are major risk factors associated with the leading causes of disability and death globally(Reference Afshin and Forouzanfar1). According to the WHO from 1975 to 2016, the proportion of children and adolescents with overweight and obesity increased from 4 to 18 %. In the same period, the prevalence of overweight and obesity among adults tripled(2). Latin America is one of the most obese regions globally (7 % of children <5 years, 17–36 % of adolescents and >50 % of adult women are overweight or obese)(Reference Rivera, de Cossio and Pedraza3,Reference Popkin and Reardon4) , and Mexico is one of the leading countries in the region(Reference Rivera, Barquera and Campirano5–7). From 1999 to 2012, the combined prevalence of overweight and obesity in Mexico increased among preschool-age children (from 8·8 to 9·7 %), school-age children (from 26·9 to 34·4 %), adult men (from 59·5 to 69·4 %) and among adult women (from 62·0 to 70·5 %)(Reference Barquera, Cam, pos and Hernández8–Reference Rivera, Shamah and Villalpando10). These changes, in Mexico and the region, have been driven by major population dietary changes in the last two to three decades as a result of population growth, economic development and the transformation of the food system(Reference Popkin11). This leads to a negative impact on access to food and on the nutritional status of populations from different urbanisation areas within the same geographic regions(Reference Popkin12–14). In Latin America, major changes in diets have been documented using Euromonitor or food balance data from the FAO(Reference Popkin and Reardon15). However, because the data are aggregated, it is not possible to get a detailed understanding of how changes are occurring in different segments of the population (e.g. urban/rural, age groups or birth cohort). Mexico is the only country in the region with available systematically repeated national surveys with individual-level dietary intake(Reference Popkin and Reardon15). Yet, evidence regarding the dietary changes of the Mexican population is limited. Previous analysis of the Mexican diet with the use of a single 24-h recall questionnaire from National Surveys shows that from 1999 to 2012, the energetic intake between main meals (snacks) increased, particularly among preschool-age children (11·6 v. 19·5 % of the total energetic intake per d) and adult women (5·6 v. 9·8 % of the total energetic intake per d)(Reference Duffey, Rivera and Popkin16). Likewise, another analysis in the same population showed that energy from sugar-sweetened beverages increased among school-age children (+45·4 kcal/d), adolescent women (+57·3 kcal/d) and adult women (+96·4 kcal/d). The intake of fruit-based drinks (agua fresca) and fruit juices with added sugars increased among children and adolescent girls; also, among school-age children and adult women, the intake of flavoured milk and sodas increased and the intake of sweetened coffee/tea increased among adult women, whereas the intake of whole milk decreased in all age groups(Reference Stern, Piernas and Barquera17). However, these studies only focused on snacks or beverages, leaving out the rest of the diet.
Although previous studies based on 24-h recall have analysed food intake, no study has identified trends in solid food intake from the total diet using 24-h recall in national surveys in Mexico. There is a need to understand changes in food group’s intake, particularly those related to the more and less healthful components of dietary intake according to national dietary guidelines. Moreover, it is important to understand if trends in food group’s intake have differed in urban v. rural areas and in specific age groups and birth cohorts. This information is relevant to inform the design and development of public policies aimed at improving the nutritional status and focus on the segments of the population where this is more needed. Thus, this study aimed to build upon the previous analysis of beverage changes between 1999 and 2012 and analyse changes in solid foods. Furthermore, to obtain a deeper understanding of the drivers of these changes and the segments of the populations most affected by these, we analysed crude changes and changes adjusted by sociodemographic characteristics to isolate changes in intake from those inherent to society’s development. We also evaluated if changes differed between urban and rural areas and by birth cohorts.
Methods
Study design and participants
The Mexican Nutrition Survey 1999 (MNS-1999) and the Mexican Health and Nutrition Survey 2012 (MHNS-2012) were cross-sectional, multistage, stratified and cluster-sampled surveys representative of the Mexican population. The design and methods were described elsewhere(Reference Gutiérrez, Rivera, Sh and amah9,Reference Rivera, Shamah and Villalpando10) . Both surveys were conducted by Mexico’s National Institute of Public Health. Informed consent was obtained from each participant or participant’s parent or guardian (for <10-year-old children). The survey research protocol was approved by the National Institute of Public Health ethics, biosafety and research committees.
The MNS-1999 was conducted between October 1998 and March 1999 and surveyed 21 503 Mexican households with a household response rate of 82·3 %. Because of budget restrictions, it only collected information on children (<12 years) and women (12–49 years)(Reference Rivera, Shamah and Villalpando10). The MHNS-2012 was conducted between October 2011 and May 2012 and surveyed 50 528 households with a household response rate of 87 %(Reference Gutiérrez, Rivera, Sh and amah9).
In this study, only the age groups included in both surveys were analysed (children of both sexes, adolescent women and women of reproductive age). In both surveys, dietary information was collected from representative subsamples of the age/sex groups included, using 24-h recalls. In both surveys, a single recall was collected in all subjects and, in 2012, a second recall was collected in a subset; however, in this study, we included only a single 24-h recall in both surveys. Our analytical sample was 5631 from MNS-1999 and 6723 from MHNS-2012.
Dietary data
In both surveys, we used a single 24-h recall collected by trained interviewers on both weekdays and weekends. Participants were asked about all foods and beverages consumed over the previous 24 h (including beverages, snacks and items consumed away-from-home) as well as the amount consumed. Interviewers were trained with a validated technique(Reference Shamah-Levy, Villalpando-Hernández and Rivera-Dommarco18) to assist participants in the estimation of portion sizes; and they were provided with numerous resources to aid in data collection, including a manual with photos of the most commonly consumed foods, a food scale and measuring cups and serving spoons of various sizes. The primary meal planner was asked to report childrens’ (<12 years) food intake. Subjects could report their intake as (1) individual foods, (2) custom recipes (individual ingredients that make up the recipe as reported by participants) and (3) standard recipes (sets of default ingredients that make up a recipe when the informer was not able to provide one). For the present analysis, food recipes were disaggregated into their ingredients.
There was an important difference between the MNS-1999 and the MHNS-2012 24-h recall methodology. Although in both surveys, trained interviewers performed the recall, the 1999 survey used a printed questionnaire, while the 2012 survey used an electronic software. Moreover, in 1999, interviewers were trained to do probes similar to the multi-pass method noted below (but had fewer probes for away-from-home eating, and to identify missing foods and meals), whereas in 2012, the five-step multiple-pass method was automated and embedded in the electronic software(19). Portion sizes were estimated with the same validated technique in both surveys; the electronic software did not contain portion size images.
Food groups
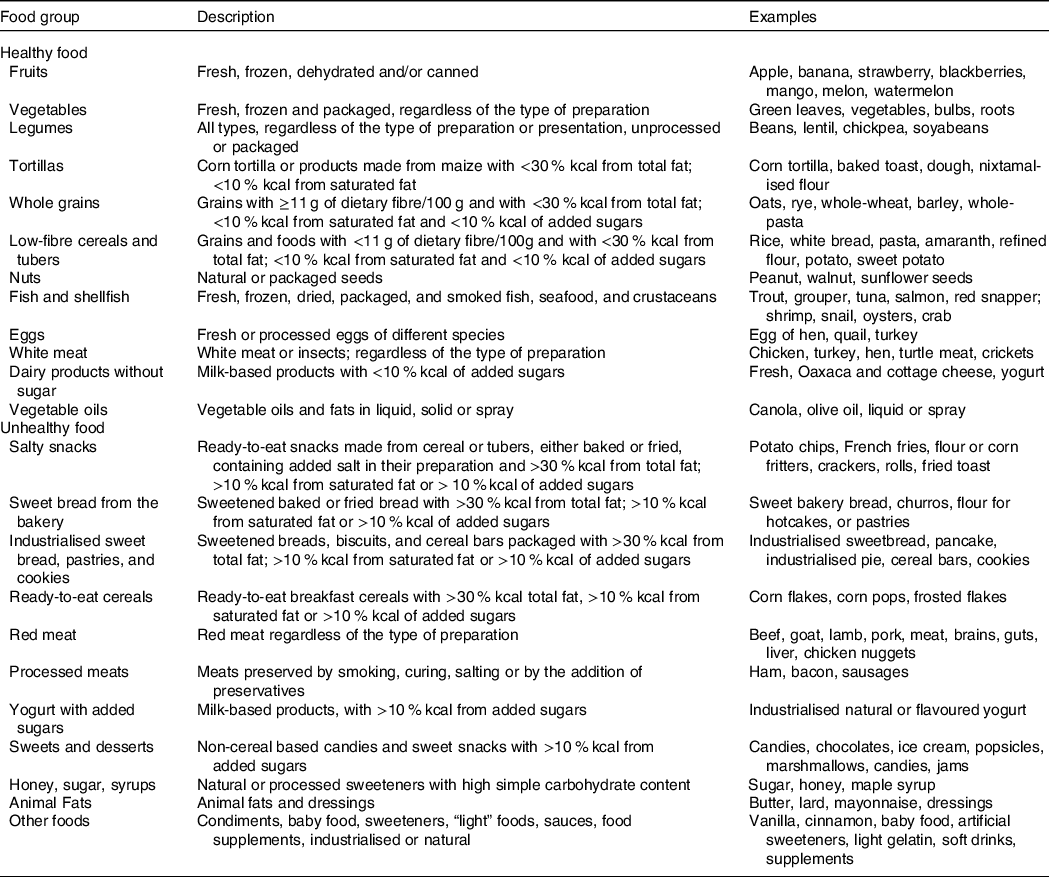
Foods (excluding beverages) were classified into twenty-three groups according to their nutritional characteristics. Healthy groups included: (1) fruits; (2) vegetables; (3) legumes; (4) tortilla (corn tortilla and other products mainly made of maize); (5) whole grains (≥11 g of fibre/100 g)(20); (6) low-fibre cereals and tubers (<11 g of fibre/100 g); (7) nuts; (8) fish and shellfish; (9) eggs; (10) white meat; (11) dairy products without sugar and (12) vegetable oils. Unhealthy foods included: (13) salty snacks; (14) sweet bread from the bakery; (15) industrialised sweet bread, pastry and crackers; (16) ready-to-eat cereals; (17) red meat; (18) processed meat; (19) yogurt with added sugar; (20) sweets and desserts; (21) honey, sugar and syrups and (22) animal fats. Additionally, we had a 23rd group with other foods (spices, coffee, tea, salt, sweeteners, light food and sauces). Due to its low nutrient contribution, it was not considered in the analysis.
The overall classification into healthy/unhealthy foods was based on the food groups that are encouraged or discouraged in the Mexican Dietary Guidelines(Reference Bonvecchio, Fernández-Gaxiola and Plazas21). However, because these guidelines do not have specific cut-off points for certain nutrients, we used the ‘nutrient profile model’ proposed by the Pan-American Health Organization(20,22) . According to this, all cereals included in the healthy category (e.g. tortilla; whole grains; and low-fibre cereals and tubers) had <30 % kcal from fat, <10 % kcal from saturated fat and <10 % kcal from added sugars, while all cereals included in the unhealthy category (e.g. salty snacks; sweet bread from the bakery; industrialised sweet bread, pastries and crackers; and ready-to-eat cereals) did not comply with these criteria. Similarly, the dairy healthy group ‘dairy products without sugar’ had <10 % kcal from added sugars, whereas the unhealthy group ‘yogurt with added sugar’ did not comply with these criteria (see Table 1, which shows a detailed description and the principal food items in each food group).
Healthy and unhealthy food groups
Sociodemographic characteristics
In both surveys, age groups were defined as follows: children (2-11 years old); adolescent girls (12-19 years old) and women (20-49 years old). Following the definition of the Mexican National Institute of Statistics and Geography, rural areas were defined as areas with <2500 inhabitants and urban areas were defined as those with >2500 inhabitants. Geographic regions were categorised as North, Central, México City or South (States by region: North: Baja California, Baja California Sur, Coahuila, Chihuahua, Durango, Nuevo León, Sonora and Tamaulipas; Central: Aguascalientes, Colima, Estado de México, Guanajuato, Jalisco, Michoacán, Morelos, Nayarit, Querétaro, San Luis Potosí, Sinaloa and Zacatecas; México City and Metropolitan Area; South: Campeche, Chiapas, Guerrero, Hidalgo, Oaxaca, Puebla, Quintana Roo, Tabasco, Tlaxcala, Veracruz and Yucatán).
Socio-economic status was measured through household characteristics in these surveys. We analysed each household characteristic (flooring material, ceiling, walls and basic services such as kitchen and water disposal) separately and not as a composite score to be able to understand more clearly the changes in these socio-economic status conditions over time. For women aged 20–49 years, educational level was measured as the last year of approved studies and was categorised as: no studies, elementary school, middle school, high school and college or more.
Statistical analysis
All analyses were stratified by age group (children; adolescent girls and adult women). First, we compared the distribution of sociodemographic characteristics in each survey with a χ 2 test. Then, we estimated total energy intake (kcal/d per capita) and the percentage of energy (%kcal) from solid foods and beverages in each survey (MNS-1999 and MHNS-2012). In addition, only for solid foods, we estimated the percentage of energy from carbohydrates, proteins, lipids and added sugars (%kcal), as well as the fibre intake (g/1000 kcal per capita). Finally, also for solid foods, we estimated the percentage of energy from each food group as well as for the overall healthy and unhealthy solid food categories.
We used simple and multivariable linear regression models to estimate the change in total energy, and the energy contribution of nutrients and food groups between 1999 and 2012. The covariates included in the regression models were age, sex (for children), household conditions, education level (for women 20-49 years old), urban/rural area and region. We also ran simple and multivariable regression models including a survey × area (urban/rural) interaction term, to identify if changes between 1999 and 2012 were different by urbanicity.
Finally, we conducted an additional analysis to understand the net (unadjusted) dietary changes among specific birth cohorts of females considering the course of 13 years between both surveys. We analysed individuals born in 1980–1984 in each survey and compared the %kcal from healthy food groups among individuals aged 15–19 years old in 1999 v. those aged 28–32 years old in 2012. Similarly, we analysed individuals born in 1993–1997 in each survey and compared the % kcal from healthy food groups among individuals aged 2–6 years old in 1999 v. those aged 15–19 years old in 2012. We selected these generations because we wanted to make comparisons 13 years apart, which correspond to the age periods originally analysed (childhood, adolescence and adulthood).
All energy percentages (%kcal) were estimated at the individual level, and then we estimated the mean of these individual’s proportions (i.e. mean proportion)(Reference Krebs-Smith, Kott and Guenther23). All analyses were conducted in STATA version 13, using the ‘svy’ commands to consider the complex design of each survey(24). A P < 0·05 value was considered statistically significant for the χ 2 test and survey coefficients (2012 v. 1999 difference), and a P < 0·10 value was used for interaction terms(Reference Greenland, Rothman and Lash25).
Results
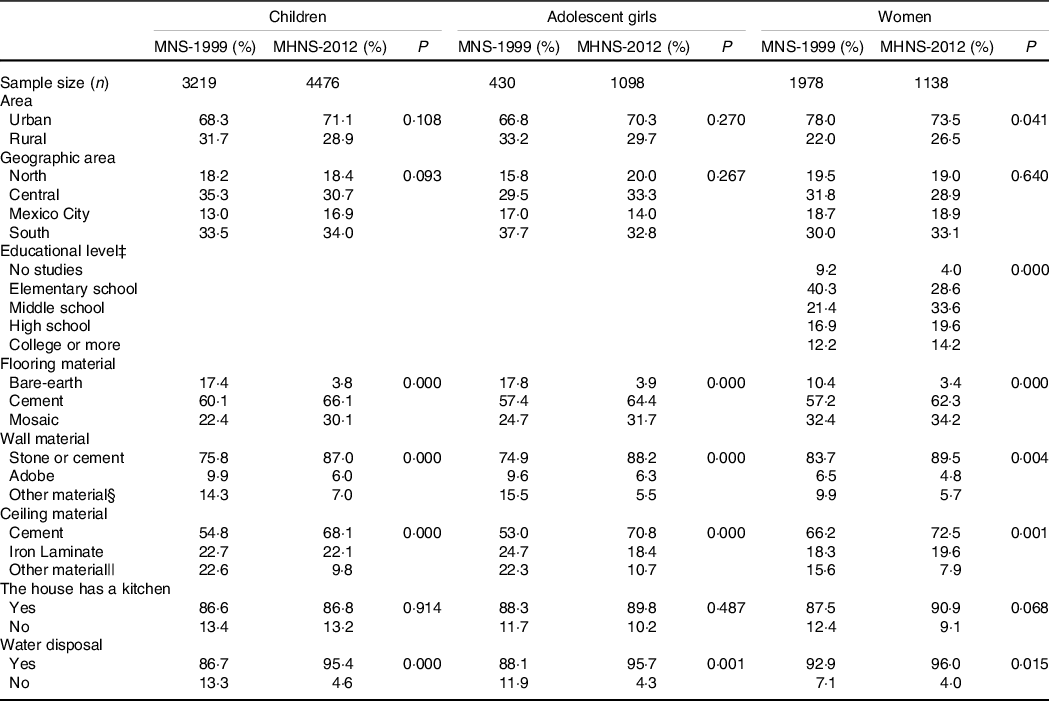
Descriptive sociodemographic characteristics of the sample from the MSN-1999 and MHNS-2012 surveys stratified by age group are presented in Table 2. The proportion of women living in urban areas and those with no studies and with elementary school showed a significant decrease from 1999 to 2012 (P < 0·05). In the same period, the proportion of households with bare-earth floors decreased 13 percentage points (pp) among children and adolescent girls, while the proportion increased 7 pp among women (P < 0·05), whereas walls and ceilings made from stone or cement increased across all age groups. The proportion of households with water disposal significantly increased among all age groups (children +8·7 pp; adolescent girls +7·6 pp; women +3·1 pp).
Sociodemographic characteristics of children and women of the Mexican Nutrition Survey 1999 (MNS-1999) and Mexican Health and Nutrition Survey 2012 (MHNS-2012)*,† (Percentages)
* Estimates were weighted to adjust for unequal probability of sampling and to be nationally representative.
† Significant differences by age group and sociodemographic category between each year of study. χ 2 test, P < 0·05.
‡ Educational level was only considered for women between 20 and 49 years.
§ Bamboo, wood, palm and iron laminate.
|| Palm, wood and roof clay tile.
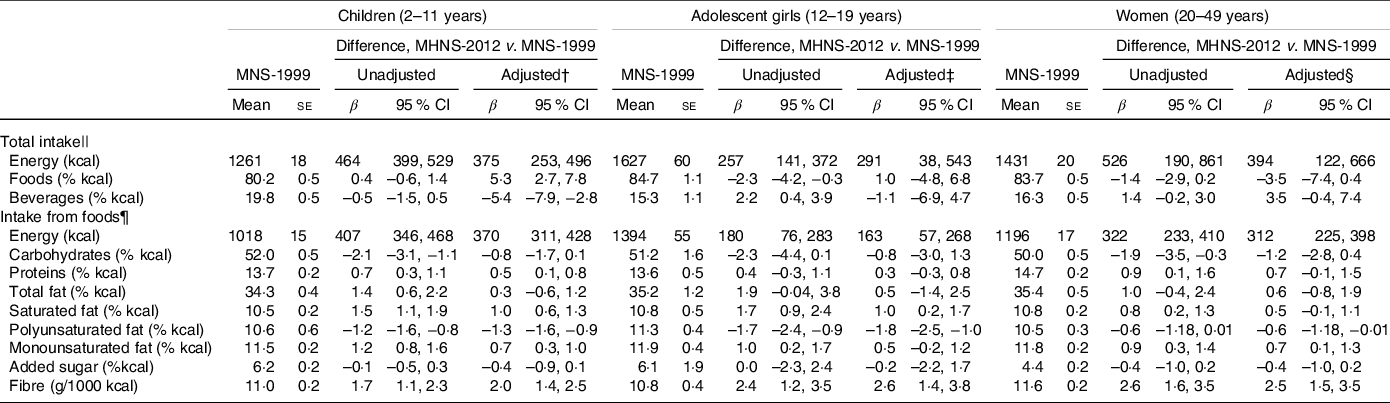
We observed a large increase in total energy intake across all age groups (range: +257 to +526 kcal/d) (Table 3). Hence, we analyse the contribution of solid foods and beverages and the nutrients provided by solid foods as a percentage of energy intake (%kcal). The %kcal from solid foods had a statistically significant decrease only among adolescents (–2·3 pp). The contribution of carbohydrates from solid foods decreased among children and adult women; meanwhile, polyunsaturated fat from solid foods decreased only among children and adolescent girls. Although not significant, the same trends were observed for the %kcal of added sugar among children and adult women. In contrast, the %kcal of the remaining nutrients from solid foods increased in all age groups. All these differences describe the unadjusted estimates; however, adjusted differences were attenuated and, in some cases, no longer statistically significant.
Difference in means of total energy and percentage of energy contributed by nutrients from foods in Mexican children, adolescent girls and women between 1999 and 2012*
(Mean values with their standard errors; β-coefficient and 95 % confidence intervals)
MHNS-2012, Mexican Health and Nutrition Survey 2012; MNS-1999, Mexican Nutrition Survey 1999.
* Estimates were weighted to adjust for unequal probability of sampling and to be nationally representative. The sample size is 7695 children, 1528 adolescent girls and 3116 women in both unadjusted and adjusted models.
† Differences adjusted by sex, age, urbanicity, geographic area, flooring material, ceiling, walls, kitchen and water disposal.
‡ Differences adjusted by age, urbanicity, geographic area, flooring material, ceiling, walls, kitchen and water disposal.
§ Differences adjusted by age, urbanicity, geographic area, flooring material, ceiling, walls, kitchen, water disposal and educational level.
|| Considering foods and beverages.
¶ Not considering beverages.
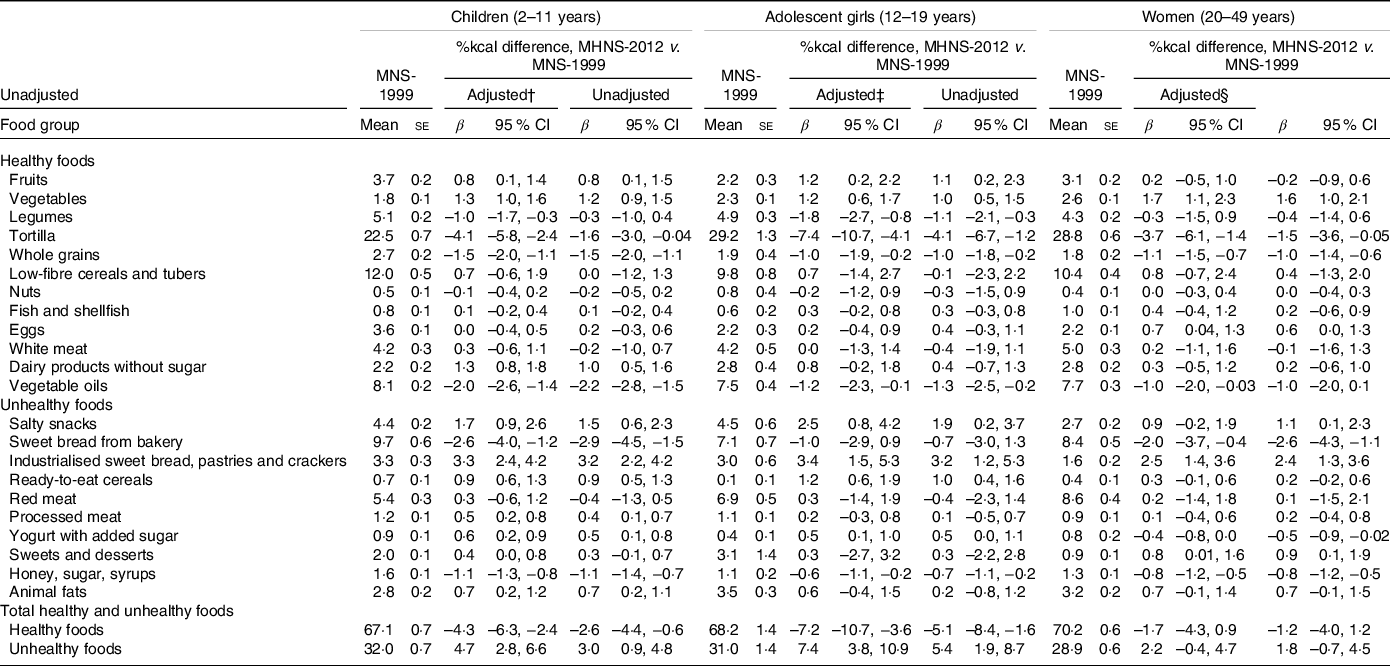
Across all age groups and in both surveys, the food groups that had the highest energy contribution to the total energy consumed from solid foods were tortilla, low-fibre cereals and tubers, vegetable oils, sweet bread from the bakery and red meat (Table 4). In unadjusted analyses from 1999 to 2012, in all age groups, there was a statistically significant increase in the percentage of energy contributed by vegetables (range across age groups: +1·2 to +1·7 pp); salty snacks (+0·9 to +2·5 pp); industrialised sweet bread, pastry and crackers (+2·5 to +3·4 pp) and ready-to-eat cereal (+0·3 to +1·2 pp). On the other hand, there was a statistically significant decrease in legumes (–0·3 to −1·8 pp); tortilla (–3·7 to −7·4 pp); whole grains (–1·0 to −1·5 pp); vegetable oils (–1·0 to −2·0 pp) and honey, sugar and syrups (–0·6 to −1·1 pp). Additionally, there were statistically significant increases in the percentage of energy of fruit among children and adolescents (+0·8 and +1·2, respectively); dairy products without sugar (+1·3 pp), processed meat (+0·5 pp), animal fats (+0·7 pp) among children; and eggs and sweets and desserts among adult women (+0·7 pp and +0·8, respectively). On the other hand, there was a statistically significant reduction in sweet bread from the bakery in children and adult women (–2·6 and −2·0 pp, respectively). No age group showed statistically significant changes in the intake of low-fibre cereals and tubers; nuts; fish and shellfish; white meat, and red meat.
Percentage and differences in the % of energy content per capita per food group, grouped in healthy and unhealthy foods from solid foods in Mexican children, adolescent girls and women between 1999 and 2012*
(Mean values with their standard errors; β-coefficient and 95 % confidence intervals)
MNS-1999, Mexican Nutrition Survey 1999; MHNS-2012, Mexican Health and Nutrition Survey 2012.
* Linear regression models were used to predict the mean values with their standard errors and 95 % CI. Estimates were weighted to adjust for unequal probability of sampling and to be nationally representative. The sample size is 7695 children, 1528 adolescent girls, 3116 women in both unadjusted and adjusted models.
† Differences adjusted by sex, age, urbanicity, geographic area, flooring material, ceiling, walls, kitchen and water disposal.
‡ Differences adjusted by age, urbanicity, geographic area, flooring material, ceiling, walls, kitchen and water disposal.
§ Differences adjusted by age, urbanicity, geographic area, flooring material, ceiling, walls, kitchen, water disposal and educational level.
When adjusting for sociodemographic variables, we observed the same trends, except for some food groups. For tortilla, the change was attenuated considerably in all age groups in the adjusted model in comparison with the unadjusted model (children (-1·6 v. −4·1 pp); adolescents (-4·1 v. −7·4 pp); adult women (-1·5 v. −3·7 pp)). Moreover, the difference was smaller and was no longer statistically significant at least in one age group for legumes and yogurt with added sugar. We observed that in 1999, total intake of healthy foods ranged from 67·0 to 70·0 %kcal across all age groups, and from 1999 to 2012, it decreased by −4·3 pp in children and −7·2 pp in adolescents, whereas there was no statistically significant change among adult women (Table 4). Similar to the food groups, the changes estimated with the adjusted model in the healthy and unhealthy food groups were attenuated compared with the unadjusted model but remained significant.
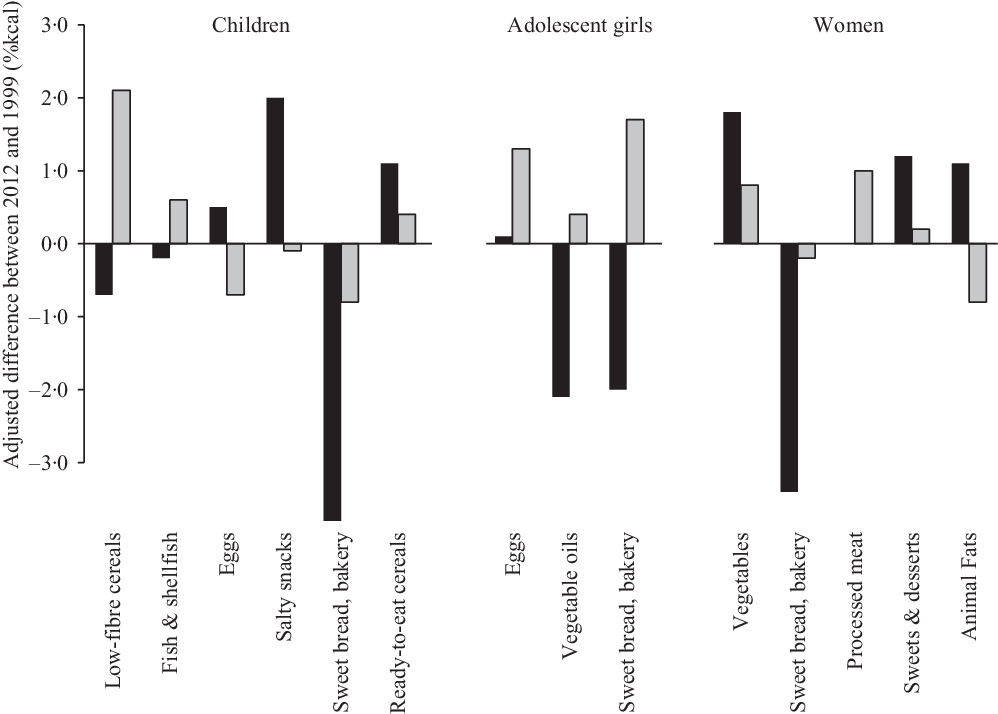
In online Supplemental Tables S1-S3, we present the results from the unadjusted and adjusted models that included a survey × area (urban/rural) interaction term and, in Fig. 1, we present the adjusted differences between 2012 and 1999 by urban and rural areas only where the interaction between survey and urban/rural had a P-value < 0·10. Overall, changes in solid food intake were less healthful in urban than in rural areas. For instance, many unhealthy food groups increased more from 1999 to 2012 in urban than in rural areas (salty snacks, ready-to-eat cereals (children), sweets & desserts and animal fats (women)), while healthy foods decreased more (low-fibre bread, fish & shellfish (children) and vegetable oils (women)). However, there were also some cases in which unhealthy foods decreased more in urban than in rural areas (sweet bread from the bakery (all age groups), and processed meats (women)) and healthy foods increased more (vegetables (women)). Furthermore, change in egg consumption varied by age group: the %kcal increased more in urban than in rural areas among children, inversely, increased more in rural than in urban areas among adolescents.
Adjusted differences between 1999 and 2012 in the energy contribution of food groups by rural and urban areas in Mexico. a,b. aOnly differences with a survey × urbanicity interaction term with a P-value < 0·10 are presented. bDifferences adjusted by sex, age, urbanicity, geographic area, flooring material, ceiling, walls, kitchen and water disposal; and education level among adult women.  Urban;
  Rural.
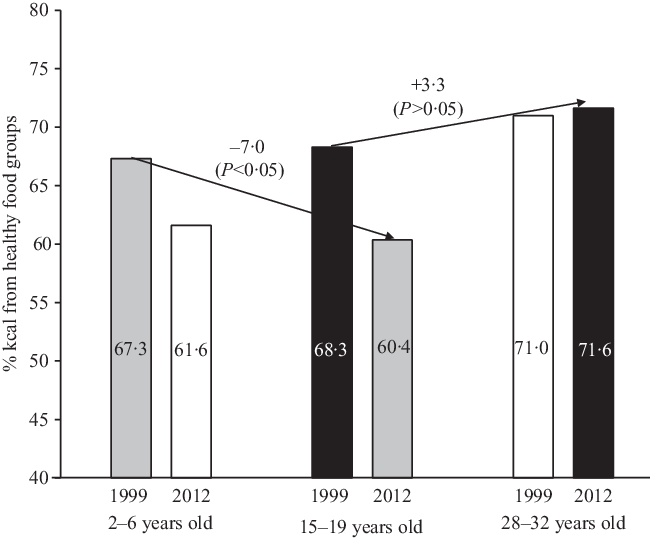
We found that the 1993–1997 generation of females decreased their energy intake (%kcal) from healthy food groups by −7·0 pp (P < 0·05) from 1999 (2–6 years old) to 2012 (15–19 years old), whereas the 1980–1984 generation of females did not change their solid food intake from 1999 (15–19 years old) to 2012 (28–32 years old) (Fig. 2).
Percentage of energy from healthy food groups among the 1993–1997 generation of females (at 2–6 years of age in 1999 and 15–19 years of age in 2012) and the 1980–1984 generation of females (at 15–19 years of age in 1999 and 28–32 years of age in 2012). 1993–1997 generation; 1980–1984 generation.
Discussion
We aimed to identify changes in energy contribution of solid foods from 1999 to 2012 in Mexico. We found that among children and adolescent girls, there was an increase in the intake of unhealthy foods. However, among adult women, the differences, though similar in direction, were small in magnitude and were not statistically significant. Hence, over the 1999–2012 period, the energy contribution of healthy solid foods increased among older generations (1980–1984). In contrast, among younger generations (1994–1997), we observed that the energy contribution of healthy solid foods decreased in the same period. Moreover, many changes in the solid food group’s intake were more unfavourable in urban v. rural areas: we observed an increase in the intake of salty snacks, ready-to-eat cereals, sweets and desserts, and animal fats.
Our results from Mexico are consistent with trends in the food group’s consumption in other countries. In the USA, between 1991 and 2012, the energy contribution of pastries, salty and sweet snacks, and fruit increased among children and adolescents according to 24-h recall data(Reference Slining, Mathias and Popkin26). Whereas total energy content per d provided by the aggregate food supply increased (+530 kcal), in addition, energy contribution of refined cereal (+9 % kcal), fats (+9 % kcal), added sugar (+4·7 % kcal), fruit and vegetables together (+1·5 % kcal) also increased(27). Moreover, estimates of food group consumption in Latin America between 2000 and 2013 showed similar increases in sales of salty and sweet snacks, ready-to-eat cereal, pastries, industrial bread and cookies, as well as candies and desserts(28), while the energy contribution of whole cereals (–3 % kcal) and legumes (–6 % kcal) decreased(Reference Bermudez and Tucker29).
Previous studies on dietary trends between 1999 and 2012 in the Mexican population also found that dietary intake is becoming less healthful. For instance, Duffey et al. reported an increase in the salty and sweet snacks consumed between main meals(Reference Duffey, Rivera and Popkin16). Furthermore, Stern et al. reported an increase in sugar-sweetened beverages and a decrease in healthier beverages such as plain water and unsweetened coffee and tea(Reference Stern, Piernas and Barquera17). Analyses from other data sources also showed similar trends. According to the National Household Income and Expenditure Survey, the expenditures on bakery sweet bread decreased 5 pp between 1994 and 2002(Reference Duana and Benítez30). In addition, between 2008 and 2012, there was a slight rise in expenditure on vegetables and fruit purchases(Reference Duana and Benítez30,31) . Moreover, according to national sales data, ultraprocessed food (salty snacks, pastries, ready-to-eat cereal; candies, desserts and cookies) increased 34 % in Mexico between 2000 and 2013(28). Jointly, these results confirm an unhealthy trend in the Mexican diet characterised by increases in the intake of industrialised food products, who is replacing the traditional Mexican diet (tortilla, whole cereals, legumes, bakery sweet bread). However, there was also an increase in fruit and vegetable consumption.
The changes we observed in the food groups were reflected in the changes in nutrients intake from solid foods. There was an increase in the energy contribution of protein, total fat, saturated and monounsaturated fats, and fibre (g/1000 kcal) and a decrease in the energy contribution of polyunsaturated fats and carbohydrates, whereas the energy contribution of added sugar from foods remained constant. The percentage of energy from saturated fats increased, possibly due to an increase in %kcal from red meat, processed meats, animal fats, salty snacks and industrial pastries. Based on a previous study that showed an increase in sugary beverages(Reference Stern, Piernas and Barquera17), it is expected that the energy contribution from added sugar in the total diet increased between 1999 and 2012; however, this was mainly driven by the consumption of beverages, since we did not observe the same change in solid foods between surveys. A possible explanation is that although the energy contribution of sweet bread, industrial pastries and cookies, and sugar-added yogurt increased, the energy contribution of raw sugar, honey, syrups and bakery sweet bread decreased in all age groups. The intake of fibre (g/1000 kcal) increased over time, despite the decrease in the %kcal from legumes, tortilla and high-fibre cereal. Nevertheless, the rise in the fibre density can be a result of the increase in the energy contribution of fruits and vegetables.
Although the overall energy contribution of healthy foods decreased and unhealthy foods increased, it is important to emphasise that for some food, this was not the case. For example, healthy food groups such as fruits, vegetables, cheese and no-sugar-added yogurt increased, while unhealthy food groups such as the bakery sweet bread, sugar, honey and syrups decreased. However, despite the positive changes in these food groups, their consumption in 2012 was still far away from meeting the dietary recommendations(Reference Aburto, Pedraza and Sánchez-Pimienta32,Reference Batis, Aburto and Sánchez-Pimienta33) . Yet, the fact that positive changes are occurring is encouraging. Thus, further research should study in detail the drivers that influenced these positive changes, and whether this information could be applied to improve the population’s dietary habits.
Previously, it has been described that changes in sociodemographic conditions lead to changes in dietary intake(Reference Popkin34–Reference Khandpur, Cediel and Obando37). However, in our results, the size of the differences between unadjusted and adjusted models (by sex, age, area, geographic area, household conditions, educational level) was evident only for tortilla and legumes intake. In these food groups, the differences between surveys were attenuated and were no longer significant in the adjusted model. This suggests that the consumption of these foods is greatly influenced by the sociodemographic factors included in the analysis, particularly by educational level and household conditions, which had the greatest change between surveys. However, for the rest of the food groups, changes could be attributed to other unmeasured factors such as marketing, advertising or cultural aspects not captured in the variables that were adjusted for.
Among adult women, we observed no statistically significant changes in the aggregated healthy and unhealthy foods categories between surveys. Even though there were some changes in the food group distribution in each category, all changes were small compared with the other age groups. This could imply that what changed the most is the food environment to which children and adolescents were exposed (e.g. foods and beverages availability in schools, advertisements directed to children). These heterogeneous trends by age groups implied that the changes experienced in 13 years within a generation differ largely by the age that the generation had in 1999. Those that transitioned from childhood to adolescence from 1999 to 2012 had a large drop in the healthfulness of their diet, whereas those who transitioned from adolescence to adulthood from 1999 to 2000 did not change their diet. These results highlight the importance of conducting future studies looking at ageing v. period effects. We also found that the trends in some food groups differed between urban and rural areas. For example, key unhealthy highly processed foods such as salty snacks, ready-to-eat cereals, and sweets and desserts increased more in urban areas in comparison with rural areas. This suggests that dietary changes are occurring at different rates within subpopulations of the country, opening a window of opportunity to prevent unhealthy dietary changes in rural areas.
Our study is not without limitations. In the MNS-1999, there was a clear underestimation of energy intake, probably due to the lack of an automated multiple-pass method in the paper-based format(Reference Moshfegh, Rhodes and Baaer38). To address the total energy underestimation in the 1999 survey, we analysed the energy contribution (%kcal) of food groups, independently from the absolute energy change. However, it is unclear if the underestimation of total energy intake was uniform across food groups or there was a higher underestimation of some food groups, which could affect our conclusions. Yet, findings from food expenditure and sales data show consistencies with our results. Another limitation is that because the MNS 1999 did not collect information on adolescent and adult men, thus it was not possible to study food consumption trends in these subpopulations. Our study also has strengths. We used a representative database at the national level of the age/sex groups included, as well as a comparable food group categorisation between surveys. Furthermore, the use of 24-h recalls as the dietary assessment method is a strength because it is the best dietary instrument available to monitor the population’s diet(Reference Moshfegh, Rhodes and Baaer38,Reference Willett39) . Although a single 24-h recall does not characterise the usual diet of each individual due to day-to-day variations, a single 24-h recall is appropriate for estimating the population mean intake(Reference Biró, Hulshof and Ovesen40).
In conclusion, we found that there was a mix of positive and negative changes in the consumption of solid foods in Mexico, characterised by a decrease in the energy contribution of healthy food groups. This trend mainly affecting children and adolescents. Altogether, these findings highlight the need to reinforce the programmes and policies aimed at improving the dietary intake of the population, particularly those that are targeting the younger age groups.
Acknowledgements
This research received no specific grant from any funding agency, commercial or not-for-profit sectors.
A. R.-G. and C. B. were responsible for study design, results interpretation, and drafting and editing of the manuscript. A. R.-G. was responsible of performing statistical analysis. D. S. and J. R.-D. made comments to the design and several drafts of the manuscript. All authors approved the final manuscript. A. R.-G. and C. B. have final responsibility of this study. The authors declare that they have no conflicts of interests. This study was conducted according to the guidelines laid down in the Declaration of Helsinki, and all procedures involving human subjects/patients were approved by the Ethics Committee of the Mexican National Institute of Public Health. Written informed consent was obtained from all subjects/patients under study.
Supplementary material
For supplementary material referred to in this article, please visit https://doi.org/10.1017/S000711452100088X



