Human gut microbiota contributes to health by regulating host metabolism. Dysbiotic composition and decreased diversity of this microbial organ are linked to inflammatory diseases of the gut and to systemic conditions, such as obesity and type 2 diabetes( Reference Arora and Bäckhed 1 , Reference Graham, Mullen and Whelan 2 ). Of particular significance are the possible health effects of maternal microbiota composition and function on the health of both the mother and child.
Pregnancy may affect the mother’s gut microbiota composition and richness( Reference Koren, Goodrich and Cullender 3 ). A recent study suggest that the colonisation of a child’s gut begins in utero ( Reference Collado, Rautava and Aakko 4 ), and as early microbiota may affect a child’s health in later life, maintaining balanced microbiota in the mother during pregnancy is important. Pregnancy is a particularly critical period of life in which the health of the fetus is consolidated( Reference Barker 5 ), and the effects of pregnancy can be observed in the offspring throughout later life( Reference Gluckman, Hanson and Buklijas 6 ). Furthermore, metabolic complications manifested during pregnancy also affect the mother’s long-term health( Reference Rayanagoudar, Hashi and Zamora 7 ). Thus, pregnancy offers a window of opportunity to improve the health of both the mother and child by potentially modifying gut microbiota composition and activity. To this end, a better understanding of the diet–microbiota–metabolism relationship during pregnancy is warranted.
Although the adult gut microbiota is generally considered consolidated, external factors, such as antibiotic treatment, diseases and diet, may modify the composition and activity of the gut ecosystem( Reference Voreades, Kozil and Weir 8 ). Diet and dietary patterns have significant effects on the composition of the microbiota and the metabolites produced. Short-term dietary interventions are shown to rapidly alter the structure and function of the microbiota: for example, the inclusion of high-fibre or high-fat intakes, as well as increased protein and animal-based foods in dietary interventions, results in rapid changes in the relative abundance of microbial phyla and genera in study subjects( Reference Walker, Ince and Duncan 9 – Reference Kovatcheva-Datchary, Nilsson and Akrami 11 ). Moreover, long-term dietary patterns containing high amounts of fibre, fruit and vegetables lead to the accumulation of carbohydrate-digesting bacteria in the gut( Reference Wu, Chen and Hoffmann 12 , Reference Kong, Holmes and Cotillard 13 ), and the original African diet( Reference De Filippo, Cavalieri and Di Paola 14 ) and the Mediterranean diet( Reference De Filippis, Pellegrini and Vannini 15 ) promote a different type of microbiota compared with that promoted by the ‘typical’ Western diet. Thus, diets that vary heavily in their content of plant-derived fibre and animal-derived fat and protein may significantly affect the composition and divergence of gut microbiota. The current Nordic nutritional recommendations encourage people to consume more fruit, vegetables and whole-grain products to increase their fibre intake and to consume more fish, nuts, seeds and vegetable oils and to limit their intake of SFA( 16 ). A generally healthy and diverse diet with a high-fibre and moderate-fat intake is also considered beneficial regarding microbiota composition( Reference Heiman and Greenway 17 ) and richness( Reference Kong, Holmes and Cotillard 13 ). Nevertheless, the effects of the recommended diet on microbiota during pregnancy have not yet been investigated to a large extent.
In addition to gut microbiota richness and composition, differing dietary components and variability of the micronutrients and macronutrients may affect the metabolites produced by the gut microbiota. Microbes convert dietary ingredients into new molecules that interact with the host and generate a repertoire of signals that have systemic effects. For example, SCFA produced mainly from dietary carbohydrates are important sources of energy for epithelial cells locally, having thus a beneficial impact on intestinal epithelial integrity. In our previous study, we observed that higher dietary intake of fibre was related to lower concentration of serum zonulin – that is lower intestinal permeability( Reference Mokkala, Röytiö and Munukka 18 ). SCFA are also related to the release of satiety hormones, which play a role in food digestion, insulin actions and feelings of satiety( Reference Heiman and Greenway 17 ). Although not well understood, certain metabolites can have negative or positive effects on systemic health depending on the microbiota composition and its fermentation capabilities( Reference Zhu, Gregory and Org 19 , Reference Gregory, Buffa and Org 20 ). One means of evaluating the metabolic functionality of the microbiota is to measure the metabolic profile from serum.
An exploration of the interactions of the diet with microbiota and of microbiota with serum metabolic activity may offer novel insights and opportunities for dietary manipulation with the aim of improving the health of the mother and child. The aim of this study was to explore the effects of habitual diet and adherence to the recommended diet on gut microbiota, serum lipidomics and low-grade inflammation and further the relationship of gut microbiota composition to serum lipidomics and inflammatory markers in overweight and obese pregnant women.
Methods
In all, 100 overweight women in early pregnancy (≤17 weeks of gestation) were included in this study, of which complete data for microbiota, diet and lipidomics were available from eighty-eight subjects. The women were participating in an ongoing mother–infant dietary intervention trial (ClinicalTrials.gov, NCT01922791) conducted in southwest Finland. This study was conducted according to the guidelines laid down in the Declaration of Helsinki, and all procedures involving human subjects were approved by the Ethics Committee of the Hospital District of Southwest Finland (permission no. 115/180/2012). Written informed consent was obtained from all subjects. The samples and data were collected at their first study visit, which served as the baseline of the intervention trial. The characteristics of the women are shown in Table 1.
Characteristics of the pregnant, overweight women (n 100) (Mean values and standard deviations)
Gut microbiota profiling
Faecal samples from mothers were collected in sterile plastic pots. Samples were collected the morning of the study visit or the previous evening, delivered to the study unit and kept at +4C until DNA extraction. DNA was extracted and the DNA samples were sequenced as previously described( Reference Mokkala, Röytiö and Munukka 18 ) (the Sequencing and Bioinformatics Service at the Fundaciónpara el Fomento de la Investigación Sanitaria y Biomédica de la Comunitat Valenciana, Valencia, Spain).
Raw sequences, 41 000–118 000/sample, were processed using the QIIME software package. Operational taxonomic units (OTU) were picked at 97 % similarity against the Greengenes database and matched with known bacterial genomes to identify members of the faecal community. On the basis of the sequences, a total of 731 OTU were detected, and the relative abundance was determined using these OTU. The α diversity, measured as Chao1, observed OTU, phylogenetic diversity (PD) and the Shannon index( Reference Lozupone and Knight 21 ), was calculated using α rarefaction values at sequence 36 382. The abundance of bacteria >1 % of total microbiota was considered to be reliable and taken into further analyses.
Dietary intake
Food diaries, 3 d, were recorded by the women within the week before the study visit. The subjects were provided oral and written instructions regarding how to record food intake, and during the study visit the diaries were checked for completeness and accuracy with the help of a portion picture booklet. Mean daily intakes of energy, energy-yielding nutrients (primary measure) and vitamins and minerals were calculated using computerised software (Aivo diet 2.0.2.3; Aivo Finland Oy).
Serum metabolites
On the morning of the study visit, a 10-h fasting blood sample was drawn from the antecubital vein of the participants. Lipidomics and glycoprotein acetylation (GlycA) were quantified from serum samples using a commercial high-throughput proton NMR metabolomics platform (Brainshake Ltd). Details of the experimentation and applications of the NMR metabolomics platform have been previously described( Reference Soininen, Kangas and Würtz 22 , Reference Kettunen, Demirkan and Würtz 23 ).
The fourteen lipoprotein subclass sizes were defined as follows: six VLDL subclasses (particle diameters 75nm (XXL) and upwards and average particle diameters of 64·0 (XL), 53·6 (L), 44·5 (M), 36·8 (S) and 31·3 (XS)nm); intermediate-density lipoproteins (28·6nm); three LDL subclasses (25·5 (L), 23·0 (M) and 18 (S)nm); and four HDL subclasses (14·3 (XL), 12·1 (L), 10·9 (M) and 8·7 (S)nm). The mean sizes of the VLDL, LDL and HDL particles were calculated by weighing the corresponding subclass diameters with their particle concentrations.
High-sensitivity C-reactive protein (hs-CRP) was determined using an automated colorimetric immunoassay on the Dade Behring Dimension RXL autoanalyzer (Siemens Healthcare), GlycA was determined by NMR, serum lipopolysaccharide (LPS) activity measured by Limulus amebocyte lysate assay and zonulin by ELISA, as reported in Mokkala et al. ( Reference Mokkala, Pellonperä and Röytiö 24 ). GlycA is a novel inflammatory biomarker that is composed of a complex of heterogeneous NMR signal containing N-acetyl sugar groups originating from multiple acute-phase circulating glycoproteins: α1-acid glycoprotein, haptoglobin, α1-antitrypsin, α1-antichymotrypsin and transferrin( Reference Otvos, Shalaurova and Wolak-Dinsmore 25 ).
Statistics
All of the statistical analyses were performed using SAS version 9.4 (SAS Institute Inc.) and SPSS version 22.0 (IBM Inc.). The Kolmogorov–Smirnov test and graphical analysis of histograms was used to determine the normality of the data. Not all of the variables were normally distributed, and parametric and non-parametric tests were used accordingly. Pearson’s and Spearman’s correlations were used to determine the associations between parameters. P values (impact of dietary intake on relative abundance of gut microbiota and impact of gut microbiota on serum lipidomics) were adjusted for multiple comparison using the Benjamini–Hochberg method to control the false discovery rate at each taxonomic level. Similarly, when comparing the gut microbiota richness with serum lipidomics and the markers of low-grade inflammation with nutrient intakes Benjamini–Hochberg method was used. Adjusted P<0·05 was considered significant in correlation analysis. The associations between dietary intakes and gut microbiota richness were also analysed after adjustment for pre-pregnancy BMI using linear regression analysis. In group comparisons, Tukey’s honest significant difference (HSD) tests were performed following significant one-way ANOVA for comparing dietary intake and serum zonulin concentration and Mann–Whitney U tests using Bonferroni corrections following significant Kruskal–Wallis tests for comparing inflammatory markers, serum lipidomics and relative abundance of gut microbiota and gut microbiota richness among the three diet groups. When comparing the relative abundance of the gut microbiota and lipidomics among the three dietary groups in Kruskal–Wallis test, the bacteria with adjusted P<0·05 were considered significant and were chosen for pairwise comparison by Mann–Whitney U test. This study was an exploratory analysis of the observational study, and thus no calculations for required sample size were performed.
Results
Dietary intake of nutrients relates to microbiota diversity and composition and low-grade inflammation
The intakes of dietary fibre (g) and fat (as percentage of total energy intake (E%)) were correlated with indexes describing the gut microbiota diversity and richness, as presented in Fig. 1. The intakes of fibre were consistently positively and the intakes of total fat and different fat types were negatively associated with gut microbiota diversity and richness. Dietary fat quality appeared to manifest diverse impact to microbiota as SFA were statistically significantly negatively associated with all indexes, whereas n-3 long-chain PUFA (LC-PUFA) showed no correlation. No statistically significant correlations were observed between protein or total energy intakes with indexes of gut microbiota richness. Further evaluations by linear regression analyses showed that after adjustment for BMI the observed associations remained statistically significant (online Supplementary Table S1).
Pearson’s correlations between microbiota diversity and richness (Shannon index (![]() ), observed number of operational taxonomic units (
), observed number of operational taxonomic units (![]() ), Chao 1 (
), Chao 1 (![]() ) and phylogenetic diversity (
) and phylogenetic diversity (![]() )) and the intakes of energy-yielding nutrients and dietary fats (percentage of total energy intake (E%)) and carbohydrates and fibre (g/d). LC-PUFA, long-chain PUFA. Statistically significant: * P<0·05, ** P<0·01.
)) and the intakes of energy-yielding nutrients and dietary fats (percentage of total energy intake (E%)) and carbohydrates and fibre (g/d). LC-PUFA, long-chain PUFA. Statistically significant: * P<0·05, ** P<0·01.

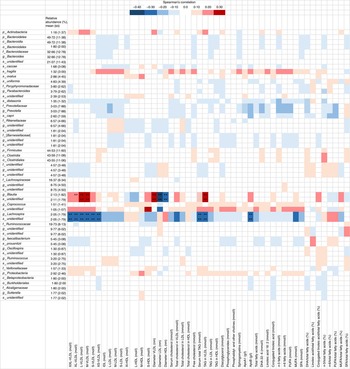
The significant associations between gut microbiota and different dietary nutrients are shown in a heatmap (Fig. 2). Intriguingly, most striking correlations were found in intakes of fibre (g) and fat (E%). Fibre intake was correlated with the phylum Firmicutes in unidentified family of order Clostridiales and in the Barnciellaceae family, belonging to the phylum Bacteroidetes. Negative correlations were found between the intake of fat (E%) and SFA (E%) and relative abundance in the family Barnsiellaceae.
Heatmap showing correlations between gut microbes and dietary nutrients (n 88). The intensity of the colours represents the degree of Spearman’s correlation between the microbial groups and the nutrients as grams and percentage of total energy (E%). Red, positive correlation; Blue, negative correlation; LC-PUFA, long-chain PUFA. ** Benjamini–Hochberg-adjusted P<0·05. Vitamin A: retinol activity equivalents comprising retinols and carotenoids. p, Phylum; c, class; o, order; f, family; g, genus; s, species.

Of the vitamins and minerals, fewer associations were detected compared with energy-yielding nutrients; the strongest correlations were seen for the phylum Firmicutes that correlated positively with the intake of vitamin A (vitamin A expressed as retinol activity equivalents, comprising the retinols and carotenoids) and β-carotene, although no associations remained statistically significant after adjusting for multiple testing. When evaluating the association between the intake of dietary nutrients and markers of low-grade inflammation, multiple nutrients correlated with GlycA including fibre, LC-PUFA and n-3 LC-PUFA and several vitamins and minerals (Table 2), but no correlations were detected between any of the nutrient and hs-CRP (adjusted P>0·2 for all; data not shown) and LPS (adjusted P>0·7 for all; data not shown).
Statistically significant correlations between dietary intakes of nutrients and glycoprotein acetylation (n 95)
LC-PUFA, long-chain PUFA.
* Spearman’s correlation coefficient.
† Benjamini–Hochberg-adjusted P value.
High-fibre and high-fat consumers differ significantly in their microbiota
Because of the opposing relations of dietary fibre and fatty acids on gut microbiota richness (Fig. 1), the microbiota data were further analysed in relation to adherence with nutritional recommendations. The subjects were grouped according to adherence to the dietary reference values( 16 ) (Table 3); group 1 was the low-fibre/moderate-fat group (n 57) and consisted of women whose fibre intake was below the reference value (<25 g/d) and whose total fat intake was within the reference intakes (25–40 E%). Group 2 was the high-fibre/moderate-fat group (n 18), and these women consumed the recommended level of fibre (≥25 g/d), and the total fat intake was within the reference intake. Group 3 was the low-fibre/high-fat group (n 13), and their fat intake exceeded the reference level of total fat intake – that is ≥40 % of total energy. Furthermore, their SFA consumption also exceeded the reference intake (<10 E%), and the consumption of each fat type, that is, the SFA, MUFA and PUFA intakes, in addition to total fat, was statistically significantly higher than that in the other two groups. They also consumed less fibre and total carbohydrates than recommended (45–60 % of total energy), indicating that they had a high-fat and low-fibre diet. Total energy intake significantly differed among the groups: the high-fibre group had a higher energy intake than the other two groups.
Daily intakes of energy, energy-yielding nutrients and fibre in the three identified diet groupsFootnote ‡ (Mean values and standard deviations)

E%, percentage of total energy intake.
*** Significant difference between the low-fibre/moderate-fat group and the high-fibre/moderate-fat or low-fibre/high-fat group (P<0·001; Tukey’s honest significant difference test following a significant one-way ANOVA). Significant difference between the high-fibre/moderate-fat and low-fibre/high-fat groups: †† P<0·01, ††† P<0·001 (Tukey’s honest significant difference test following a significant one-way ANOVA).
‡ Only three subjects recorded a high daily intake of both fibre and fat: the two subjects with the lowest fibre intake (26·3 and 27·1 g/d) and the highest fat intake (43·2 and 41·9 E%) were placed in the high-fat group, and the subject with the highest fibre and the lowest fat intake (29 g/d and 41·7 E%) was placed in the high-fibre group.
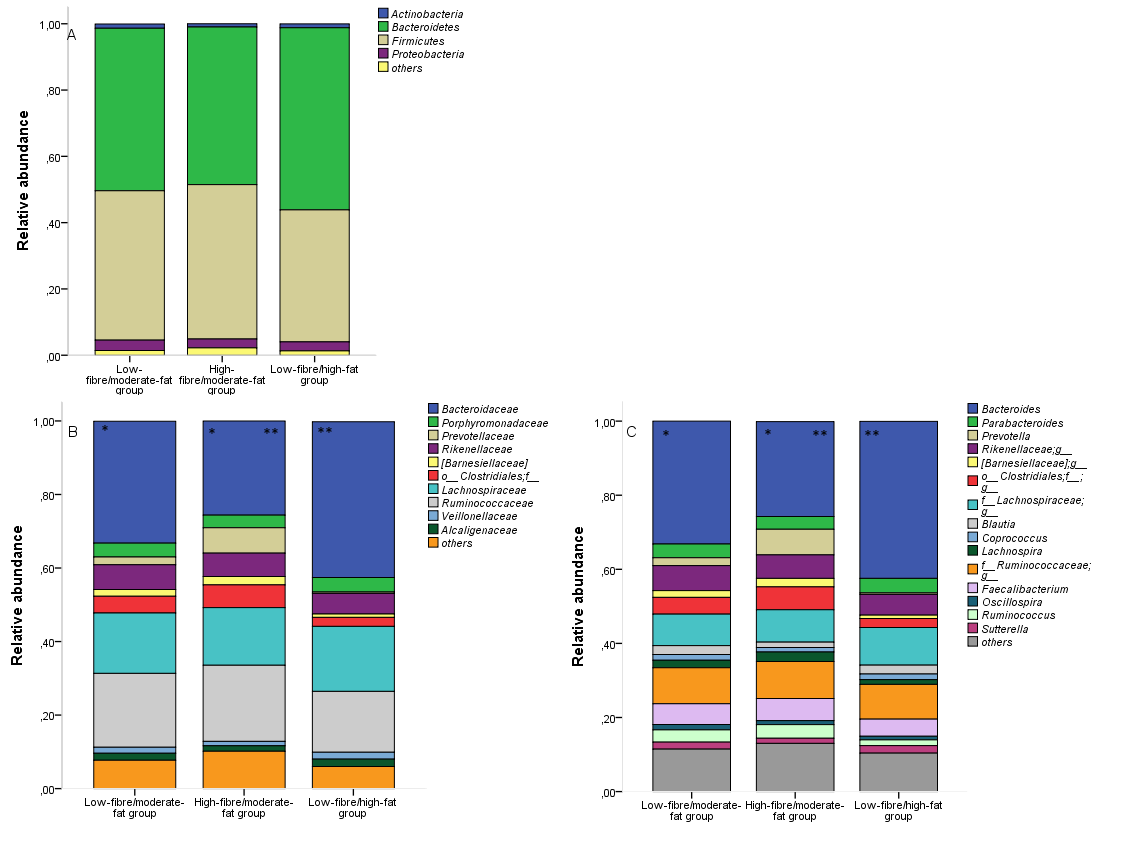
The identified dietary groups were compared with respect to their gut microbiota richness and composition, and statistically significant differences were observed. Chao1 index (mean 406·2 (sd 44·4) v. 341·0 (sd 57·9), P=0·006), PD (39·0 (sd 4·5) v. 31·3 (sd 6·7), P=0·003) and observed number of OTU (355·8 (sd 38·7) v. 293·8 (sd 59·0), P=0·003) were higher in the high-fibre/moderate-fat group compared with the low-fibre/high-fat group, whereas low-fibre/moderate-fat group did not differ from the other groups (Chao 1 index: 380·0 (sd 57·3), PD: 35·8 (sd 5·9), observed number of OTU: 333·0 (sd 55·2), P>0·084 for high-fibre/moderate-fat group, P>0·09 for low-fibre/high-fat group). Moreover, the relative abundance of specific microbial phyla, families and genera were significantly different among the three dietary groups (online Supplementary Fig. S1). After adjustment for multiple testing, the difference among the dietary groups was evident in the Bacteroidaceae family: the high-fibre/moderate-fat group had a lower relative abundance of Bacteroidaceae (25·6 (sd 10·6) %) in comparison with the low-fibre/high-fat group (42·4 (sd 14·6) %, P=0·01) and the low-fibre/moderate-fat group (33·2 (sd 11·9) %, P=0·02). Similar differences were detected in the genus Bacteroides, where differences were observed between high-fibre/moderate-fat and low-fibre/moderate-fat (25·6 (sd 10·6) v. 33·2 (sd 11·9) %, P=0·02) and between high-fibre/moderate-fat and low-fibre/high-fat group (25·6 (sd 10·6) v. 42·4 (14·6) %, P=0·01) (Table 4). No statistically significant differences were detected in markers of low-grade inflammation (hs-CRP: P=0·58, GlycA: P=0·16, LPS activity: P=0·1), serum lipidomic variables (adjusted P<0·07 after Kruskal–Wallis test) or zonulin concentration (P=0·40) among the three diet groups (online Supplementary Table S2).
Relative abundance of gut microbiota between the three dietary groups (Mean values and standard deviations)

* Significant P value that takes into account Benjamini–Hochberg adjustment.
Gut microbiota richness correlates with low-grade inflammation
Higher Chao1 index (r −0·28, P=0·007, Spearman’s correlation coefficients), PD (r −0·24, P=0·022) and observed number of OTU (r −0·27, P=0·009) correlated with lower concentration of GlycA, but no association was detected between any of the indexes of gut microbiota richness and hs-CRP (P=0·22, P=0·27 and P=0·26, respectively) or serum LPS activity (P=0·82, P=0·83 and P=0·80, respectively).
Gut microbiota correlates with serum lipidomics
Several correlations were observed (Fig. 3) between relative abundance of gut microbiota and serum lipidomics profiles, especially in genus levels of the family of Lachnospiraceae, which belongs to phylum Firmicutes. Opposite findings were found in genus level of this family: Lachnospira was negatively and Blautia positively correlated with concentrations of various sized VLDL particles and TAG in VLDL. Genus Lachnospira was also negatively associated with serum TAG. Genus Blautia was positively associated with VLDL diameter, but negatively with the diameters of LDL and HDL. No statistically significant correlations were detected between gut microbiota richness indexes and serum lipidomics variables (all adjusted P>0·59, Spearman’s correlation analysis).
Heatmap showing correlations between gut microbes and lipidomics (n 92) from the serum lipidomics analysis. The intensity of the colours represents the degree of Spearman’s correlation between the genera and the nutrients. Red, positive correlation; blue, negative correlations; IDL, intermediate-density lipoproteins. ** False discovery rate<0·05. XXL, extremely large; XL, very large; L, large; S, small; L, large; M, medium; p, phylum; c, class; o, order; f, family; g, genus; s, species.
Discussion
This study showed that diet composition, particularly fibre and fat, affects the gut microbiota diversity and relative abundance of gut microbes of overweight, pregnant women. Furthermore, specific bacterial groups were associated with serum lipoprotein concentrations. We also demonstrated that higher gut microbiota richness is negatively linked with low-grade inflammation marker GlycA, which was further related to intake of several nutrients including fibre and LC-PUFA. We did not observe similar relationship between hs-CRP and gut microbiota richness, suggesting that GlycA may have distinct inflammatory pathway compared with CRP. This study highlights the importance of diet in modulating both beneficially and detrimentally gut microbiota composition and again metabolism. This opens novel opportunities in designing approaches for diet modification to induce beneficial changes in microbiota because decreased diversity of the microbiota has been consistently linked to metabolic disturbances, such as obesity and type 2 diabetes( Reference Wu, Tremaroli and Bäckhed 26 , Reference Le Chatelier, Nielsen and Qin 27 ). Instead, high diversity is the hallmark of a well-functioning, healthy gut ecosystem( Reference Lozupone and Knight 21 ).
The dietary intake of the pregnant women was similar to that previously reported( Reference Meinilä, Koivusalo and Valkama 28 ). In the present study, the deviations from the dietary reference intakes were most evident regarding intakes of fibre and SFA; most of the pregnant women had a fibre intake that was too low and a SFA intake that was too high. These factors also had the strongest correlations with the gut microbiota richness. The absolute daily intake of fibre was positively associated with increased gut microbiota richness, whereas the intakes of total fat, SFA, MUFA and n-6 LC-PUFA (E%) were inversely associated with these parameters. Similar associations were also observed when comparing the identified dietary groups: the high-fibre intake (high-fibre/moderate-fat group), and adherence to the dietary reference intake overall, was linked with a higher richness of the gut microbiota; however, a high-fat consumption together with low-fibre and low-carbohydrate consumption (low-fibre/high-fat group) was linked to significantly lower richness. Consistent evidence was found that, in addition to the total dietary fat intake, the quality of fat (particularly a high intake of SFA) may be potentially harmful. Negative associations were evident with SFA and all indexes describing the gut microbiota richness. n-3 LC-PUFA is of potential interest, as it appeared to differ from other fatty acid types with positive correlation with one of the richness indexes, although not statistically significantly. In previous studies, healthy eating patterns( Reference Kong, Holmes and Cotillard 13 ) and dietary diversity( Reference Heiman and Greenway 17 ) have been associated with increased diversity of the gut microbiota. In addition, an experimental evidence indicates an impact of diet fat quality with microbiota composition( Reference Bentley-Hewitt, De Guzman and Ansell 29 ); however, no effect on maternal gut microbiota composition at late pregnancy was detected when mothers consumed salmon, rich in PUFA, from mid-pregnancy until delivery( Reference Urwin, Miles and Noakes 30 ).
When we evaluated the dietary nutrients and specific microbial groups, the most striking correlations were found for fibre and fat. Fibre intake was correlated with microbes of the Firmicutes and Bacteroidetes phylum; both negative and positive correlations were found in family and genus levels of Bacteroidetes phylum. After adjusting for multiple testing, the negative association between Bacteroidetes and fibre did not remain statistically significant; however, the lowest relative abundance of the family Bacteroidaceae, belonging to the phylum Bacteroidetes, was detected in the diet group with high-fibre/moderate-fat intake. Similar associations were detected in a previous study, in which Firmicutes were positively and Bacteroidetes negatively associated with fibre intake in non-pregnant population( Reference Wu, Chen and Hoffmann 12 ). Of the association of specific microbiota on nutrient intake, Barnesiellaceae responded mostly on nutrient intake; in addition to the negative correlation with fat intake, Barnesiellaceae showed a positive correlation with fibre. Also fibre intake was positively correlated with an unknown family of order Clostridiales. In a recent study with pregnant women, higher intake of vitamin D and retinol at the second trimester was associated with an increase in the relative abundance of Proteobacteria after delivery( Reference Mandal, Godfrey and McDonald 31 ). In our study, we did not observe any associations between relative abundances of gut microbiota and vitamins, when conducting the analyses using robust multiple testing corrections.
When the serum lipidomics results were evaluated against the microbiota data, strongest associations were observed with Lachnospiraceae family, with genus Lachnospira having negative association with different lipoprotein particles and serum TAG and Blautia having a positive association with different lipoprotein particles. Lachnospira relative abundance was inversely associated with serum VLDL particles, which together with small-sized LDL particles are considered the most harmful types of lipoproteins in regard to atherosclerosis development( Reference Schaefer, Tsunoda and Diffenderfer 32 ). Recent findings have linked gut microbiota with lipid metabolism in humans and in mice, and causality has been supported by animal trials, as reviewed in Wang et al. ( Reference Wang, Koonen and Hofker 33 ). Another recent study( Reference Fu, Bonder and Cenit 34 ) showed that the gut microbiota explains part of the variation in blood lipid concentrations in humans; the presence or absence of certain species in the gut may be the root cause for aberrant blood lipid levels.
We also detected a relation between gut microbiota and low-grade inflammation as higher microbiota richness was linked to lower level of GlycA. GlycA has been related to chronic inflammation( Reference Ritchie, Würtz and Nath 35 ) and clinical manifestations including type 2 diabetes and CVD in non-pregnant subjects( Reference Akinkuolie, Pradhan and Ridker 36 – Reference Connelly, Gruppen and Wolak-Dinsmore 38 ). GlycA has also been associated with metabolic risk markers in pregnant women( Reference Mokkala, Pellonperä and Röytiö 24 ). We also observed an association between lower intake of multiple nutrients, including fibre, and higher GlycA. Therefore, we would like to propose that the beneficial impact of higher dietary fibre intake may thus take place through the effect on gut microbiota richness. The other nutrients correlating with GlycA, including n-3 LC-PUFA and vitamins and minerals, may have immunomodulatory effects via different mechanisms; n-3 LC-PUFA serve as precursors for anti-inflammatory eicosanoid synthesis and vitamins act as antioxidants( Reference Calder, Ahluwalia and Brouns 39 ). Yet, the mechanisms may also be mediated through modulating gut microbiota composition( Reference Kaliannan, Wang and Li 40 ). Intriguingly, we did not detect the relationship between microbiota or intakes of nutrients and serum LPS activity or the more traditionally used marker of low-grade inflammation, hs-CRP.
There are some limitations in the current study that should be considered when interpreting the results. First, the overweight study participants may have underreported their dietary intake( Reference Subar, Freedman and Tooze 41 ). In the comparison of the subject groups according to the adherence to the dietary recommendations, significant differences in total energy intake, but not in BMI or body weight, were observed among the three generated groups: total energy intake was the lowest in the low-fibre/moderate-fat group, and if this was a result of underreporting the group division may have been affected, and thus the observed differences in microbiota richness and composition. However, we used the proportional intake of energy-yielding nutrients (E%) as a primary measure, which is unlikely affected by underreporting. Indeed, the division of the subjects into three different dietary groups according to adherence to nutritional recommendations based on the food diary data resulted in significant differences in several measured parameters and was reflected in the richness and diversity, as well as composition, of the gut microbiota of these women. The benefit of the study setting is that the study population was very homogeneous; for example, none of the women used metformin or any other medication. This fact is of importance because metformin treatment is known to cause uniform microbiome shifts in type 2 diabetic patients( Reference Forslund, Hildebrand and Nielsen 42 ).
Pregnancy offers a window of opportunity to affect the health of both the mother and child. A disturbed balance of major microbial groups and the decreased numbers of, for example, anti-inflammatory species detected in obesity leads to an altered metabolite profile and anti- and proinflammatory factors produced by the microbiota( Reference Graham, Mullen and Whelan 2 , Reference Wu, Tremaroli and Bäckhed 26 , Reference Chakraborti 43 ). During pregnancy, obesity and altered microbiota composition may be of high importance because these factors affect the health of the developing child( Reference Soderborg, Borengasser and Barbour 44 ) also shown in recent experimental study in obese rats( Reference Paul, Bomhof and Vogel 45 ). Therefore, targeting the maternal microbiota may offer opportunities to effectively and safely improve the long-term health of both the mother and child.
The findings from the current study support the association of diet and dietary patterns with the gut microbiota and further with a novel inflammatory marker, GlycA. Our results illustrate that adherence to dietary reference intake was linked to a richer gut microbiota, which further related to lower maternal inflammatory status, measured as GlycA. In addition, diet quantity, particularly absolute amount of fibre and fat consumed, and further the fat quality are related to the composition of the gut microbiota. Even subtle differences in the typical Western diet may result in significant differences in the gut microbiota of an otherwise homogeneous population; adherence to dietary reference intake was linked to a richer gut microbiota. Thus, dietary manipulation of the microbiota could be an effective and easily applicable means for improving the balanced microbiota during pregnancy, a crucial time that may have long-term effects on the future health of the next generation.
Acknowledgements
Funding was received from the Academy of Finland (no. 258606), Diabetes Research Foundation, State research funding for university-level health research of the Turku University Hospital Expert Responsibility Area, the Juho Vainio foundation, Päivikki and Sakari Sohlberg Foundation (personal funding for K. M.) and the Finnish Cultural Foundation (Varsinais-Suomi Regional Fund) (personal funding for K. M.).
K. L. and K. M. designed the study; H. R. contributed to the design; H. R. and K. M. analysed the data; H. R., K. M. and T. V. conducted statistical analyses; H. R. wrote the first draft of the paper; all the authors contributed to writing the paper and accepted the final version.
None of the authors has any conflicts of interest to declare.
Supplementary material
For supplementary material/s referred to in this article, please visit https://doi.org/10.1017/S0007114517002100