





1 Introduction
External flow past an isolated airfoil is relevant in the context of a variety of engineering applications, such as micro or unmanned air vehicles, small wind turbines and low-speed aircraft. Key aerodynamic quantities such as the lift and drag coefficients, of relevance to engineering applications, have been the focus of several experimental investigations (Abbott, Doenhoff & Stivers Reference Abbott, Doenhoff and Stivers1945; Lissaman Reference Lissaman1983; Laitone Reference Laitone1997) at different Reynolds numbers ( $Re_{c}$
) and angles of attack (
$Re_{c}$
) and angles of attack ( $AoA$
). Recently, a growing body of experimental studies focusing on the boundary layer separation and transition process have been reported (Nakano, Fujisawa & Lee Reference Nakano, Fujisawa and Lee2006; Yarusevych, Sullivan & Kawall Reference Yarusevych, Sullivan and Kawall2006, Reference Yarusevych, Sullivan and Kawall2009; Boutilier & Yarusevych Reference Boutilier and Yarusevych2012). It is found that the complex flow patterns (i.e. separation, transition and reattachment) on the suction side deteriorate aerodynamic performance by negatively affecting airfoil lift and drag (Yarusevych et al.
Reference Yarusevych, Sullivan and Kawall2009). These studies imply that a detailed analysis of the unsteady flow dynamics is required for further shape optimization and flow control.
$AoA$
). Recently, a growing body of experimental studies focusing on the boundary layer separation and transition process have been reported (Nakano, Fujisawa & Lee Reference Nakano, Fujisawa and Lee2006; Yarusevych, Sullivan & Kawall Reference Yarusevych, Sullivan and Kawall2006, Reference Yarusevych, Sullivan and Kawall2009; Boutilier & Yarusevych Reference Boutilier and Yarusevych2012). It is found that the complex flow patterns (i.e. separation, transition and reattachment) on the suction side deteriorate aerodynamic performance by negatively affecting airfoil lift and drag (Yarusevych et al.
Reference Yarusevych, Sullivan and Kawall2009). These studies imply that a detailed analysis of the unsteady flow dynamics is required for further shape optimization and flow control.
High Reynolds unsteady flow past an airfoil is characterized by boundary layer separation, laminar–turbulent transition, wall-bounded turbulence under pressure gradients and turbulent wake flow. Methods to simulate this full three-dimensional (3-D) unsteady flow include: direct numerical simulation (DNS), large-eddy simulation (LES), detached-eddy simulation (DES) and Reynolds-averaged Navier–Stokes models (RANS). All the near-wall turbulent scales are resolved in DNS, requiring mesh resolution that scales as $Re^{37/14}$
(Choi & Moin Reference Choi and Moin2012): this restriction on resolution proves to be untenable for high
$Re^{37/14}$
(Choi & Moin Reference Choi and Moin2012): this restriction on resolution proves to be untenable for high $Re$
wall-bounded flows. Recently, Hosseini et al. (Reference Hosseini, Vinuesa, Schlatter, Hanifi and Henningson2016) performed DNS of flow past a NACA4412 airfoil at a Reynolds number based on free-stream velocity
$Re$
wall-bounded flows. Recently, Hosseini et al. (Reference Hosseini, Vinuesa, Schlatter, Hanifi and Henningson2016) performed DNS of flow past a NACA4412 airfoil at a Reynolds number based on free-stream velocity $U_{\infty }$
and chord length
$U_{\infty }$
and chord length $C$
of
$C$
of $Re_{c}=4\times 10^{5}$
. To the best of our knowledge, this is by far the highest
$Re_{c}=4\times 10^{5}$
. To the best of our knowledge, this is by far the highest $Re_{c}$
airflow case simulated with DNS. A viable alternative to DNS is LES in which the large scales are resolved while the effects of small scales are modelled using a subgrid-scale (SGS) model. LES of wall-bounded turbulent flows can be classified into wall-resolved large-eddy simulations (WRLES) and wall-modelled large-eddy simulations (WMLES). In wall-bounded turbulent flows, the near-wall eddies scale with wall units, imposing a significant computational cost to sufficiently resolve them in practical simulations. The near-wall resolution problem is exacerbated for high
$Re_{c}$
airflow case simulated with DNS. A viable alternative to DNS is LES in which the large scales are resolved while the effects of small scales are modelled using a subgrid-scale (SGS) model. LES of wall-bounded turbulent flows can be classified into wall-resolved large-eddy simulations (WRLES) and wall-modelled large-eddy simulations (WMLES). In wall-bounded turbulent flows, the near-wall eddies scale with wall units, imposing a significant computational cost to sufficiently resolve them in practical simulations. The near-wall resolution problem is exacerbated for high $Re$
turbulent flows. Choi & Moin (Reference Choi and Moin2012) estimated that the number of mesh points for WRLES is
$Re$
turbulent flows. Choi & Moin (Reference Choi and Moin2012) estimated that the number of mesh points for WRLES is $O(Re^{13/7})$
, while for WMLES, the mesh points requirement scales linearly with increasingly
$O(Re^{13/7})$
, while for WMLES, the mesh points requirement scales linearly with increasingly $Re$
, i.e.
$Re$
, i.e. $N_{wm}\sim O(Re)$
, where
$N_{wm}\sim O(Re)$
, where $N_{wm}$
is the number of mesh points needed in WMLES. Hence, the wall-modelling approach is a tenable solution for LES of high
$N_{wm}$
is the number of mesh points needed in WMLES. Hence, the wall-modelling approach is a tenable solution for LES of high $Re$
wall-bounded turbulent flows.
$Re$
wall-bounded turbulent flows.
In the past four decades, several wall models have been proposed for canonical flows in simple geometries (Schumann Reference Schumann1975; Grötzbach Reference Grötzbach1987; Piomelli et al. Reference Piomelli, Ferziger, Moin and Kim1989; Marusic, Kunkel & Porté-Agel Reference Marusic, Kunkel and Porté-Agel2001; Piomelli & Balaras Reference Piomelli and Balaras2002). However, there are a couple of primary challenges when it comes to practical engineering simulations. First, most wall models follow the equilibrium stress assumption and imply a log-law profile in the near-wall region, which is a questionable assumption for turbulent boundary layers subjected to strong adverse pressure gradients (APG) leading to separation, extra strains due to curvature, etc. (Diurno Reference Diurno2001). Second, most wall-modelling strategies including DES fall into the hybrid RANS/LES methodology in complex geometries, which solves the simplified or full RANS equations in the inner layer and provides wall shear stress boundary conditions for the outer LES region (Cabot & Moin Reference Cabot and Moin1999; Piomelli & Balaras Reference Piomelli and Balaras2002; Kawai & Asada Reference Kawai and Asada2013; Park & Moin Reference Park and Moin2016). This hybrid method is not only sensitive to the choice of the RANS model and its associated model coefficients, but also leads to the so-called ‘scale disparity’ problem on the nominal interfaces between the RANS and LES regions (Germano Reference Germano2004; Piomelli Reference Piomelli2008). Recently, Bose & Moin (Reference Bose and Moin2014) proposed a differential filter-based wall model with a specific choice of the filter kernel, in which a local slip length parameter is introduced and computed via a dynamic procedure. This differential model offers the Robin (slip) boundary condition, and has been tested in both canonical flows and NACA4412 airflows (Bose & Moin Reference Bose and Moin2014; Bae et al. Reference Bae, Lozano-Durán, Bose and Moin2019). Although no a priori coefficients are specified, the accuracy of the slip wall model is not only limited by the robustness of the dynamic procedure to compute the slip length, but also sensitive to the SGS models and numerical methods (Bose & Park Reference Bose and Park2018).
An alternative to the hybrid RANS/LES approach is the virtual wall model proposed by Chung & Pullin (Reference Chung and Pullin2009). In this approach one dynamically couples the outer resolved LES region with the inner wall region, and offers a slip velocity boundary condition for the filtered LES velocity field on the ‘virtual wall’. This wall model was successfully applied in canonical flows without separation (Inoue & Pullin Reference Inoue and Pullin2011; Saito, Pullin & Inoue Reference Saito, Pullin and Inoue2012), and then extended by Cheng, Pullin & Samtaney (Reference Cheng, Pullin and Samtaney2015) to simulate the flat-plate turbulent boundary layer flows with separation and reattachment. Although the above wall models developed by Pullin and co-authors have been shown to successfully predict flat-plate wall-bounded flows and related phenomena, a missing part, which plays a key role in aerodynamical applications, is the effect of curvature due to the local geometry, and corresponding effects such as pressure gradient and turbulent transition. Development of a systematic framework for wall models of turbulent flows around extruded two-dimensional (2-D) or 3-D bodies with arbitrary geometry, would constitute an essential contribution to turbulent flow simulations, paving the way for WMLES for more realistic aerodynamic applications. Indeed, the present study is a starting point for the development of a general WMLES framework.
In the present investigation, we emphasize two main objectives. One of the main objectives of this work is to extend the virtual wall model to the generalized curvilinear coordinates. Since we incorporate both momentum equations for both wall-parallel directions, the present general wall model naturally possesses the ability to handle most of the significant turbulent flow features along a curved surface, not only the wall attached flows with either a zero pressure gradient (ZPG) or varying pressure gradient, but also the separation/reattachment and its related phenomena such as turbulent transition on the top side of a separation bubble. The present implementation is on body-fitted structured meshes that are commonly employed for complex geometries. We emphasize strong validation of our WMLES results. By ‘strong’ we mean going beyond the comparisons of pressure coefficient, and lift and drag coefficients and present detailed comparisons of our results with experiments of skin-friction coefficient and Reynolds stresses wherever available.
Another major objective of this work is to examine the details of unsteady separation for turbulent flow past airfoils. Recent work by Cheng et al. (Reference Cheng, Pullin, Samtaney, Zhang and Gao2017), Cheng, Pullin & Samtaney (Reference Cheng, Pullin and Samtaney2018a
) in WRLES of flow past a smooth and grooved cylinder at subcritical and supercritical Reynolds numbers, emphasized the role of unsteady separation and the dynamics of separation bubbles in the phenomenon of the drag crisis. Their explanation is that the drag crisis, mainly due to a large change in form drag, is due to the topology change induced by the movement of the location of curvature-controlled large-scale separation. Furthermore, although near-wall shear-layer turbulent transition is observed in flow over a smooth cylinder, it does not occur in flow past a grooved cylinder. In the present study, we note the airfoil geometry may be considered as a combination of large curvature (near the front stagnation part) and small curvature near the trailing edge portion of the airfoil. This geometric complexity, accompanied by different $AoA$
, will no doubt result in rich flow physics, especially insofar as separation and transition are concerned. We employ several diagnostic tools, including instantaneous surface skin-friction lines and invariant maps of anisotropy, to reveal the flow patterns due to dynamic interaction of local separation and transition. These flow analyses aim to provide a clear physical flow description of high Reynolds number airfoil flow up to
$AoA$
, will no doubt result in rich flow physics, especially insofar as separation and transition are concerned. We employ several diagnostic tools, including instantaneous surface skin-friction lines and invariant maps of anisotropy, to reveal the flow patterns due to dynamic interaction of local separation and transition. These flow analyses aim to provide a clear physical flow description of high Reynolds number airfoil flow up to $Re_{c}=2.1\times 10^{6}$
, in ways that has not been fully examined in past several decades. In addition, we place a strong emphasis on validating our results against previous experiments.
$Re_{c}=2.1\times 10^{6}$
, in ways that has not been fully examined in past several decades. In addition, we place a strong emphasis on validating our results against previous experiments.
The paper is organized as follows: in § 2, we provide a brief summary on the LES of flow past airfoils, analysing the available datasets in cited references, and emphasize the important flow properties examined in the present study. In § 3, the general formulation of the wall model for arbitrary curvilinear coordinate system is developed, with some details relegated to appendices A and B. Following the wall model formulation, we briefly explain the SGS model and the numerical methods employed for implementation of the wall model in LES of flow over airfoils. Large-eddy simulation results are summarized in the next several sections. In § 5, the proposed model is verified against corresponding DNS (for case at $Re_{c}=10^{4}$
), followed by detailed validation by comparing time- and spanwise-averaged quantities against experiments (for higher Reynolds number cases at
$Re_{c}=10^{4}$
), followed by detailed validation by comparing time- and spanwise-averaged quantities against experiments (for higher Reynolds number cases at $Re_{c}=10^{5}$
and
$Re_{c}=10^{5}$
and $2.1\times 10^{6}$
). In § 6, we analyse the anisotropy of the near-wall flow based on the time- and spanwise-averaged Reynolds stresses. This part provides a clear physics of the flow pattern transition around the airfoil. Later in § 7, instantaneous flow field in the form of surface streamlines is analysed, with emphasis on local and large-scale separation, and also related turbulent transition behaviour. Some conclusions are finally drawn in § 8.
$2.1\times 10^{6}$
). In § 6, we analyse the anisotropy of the near-wall flow based on the time- and spanwise-averaged Reynolds stresses. This part provides a clear physics of the flow pattern transition around the airfoil. Later in § 7, instantaneous flow field in the form of surface streamlines is analysed, with emphasis on local and large-scale separation, and also related turbulent transition behaviour. Some conclusions are finally drawn in § 8.
2 LES of flow past an airfoil: background
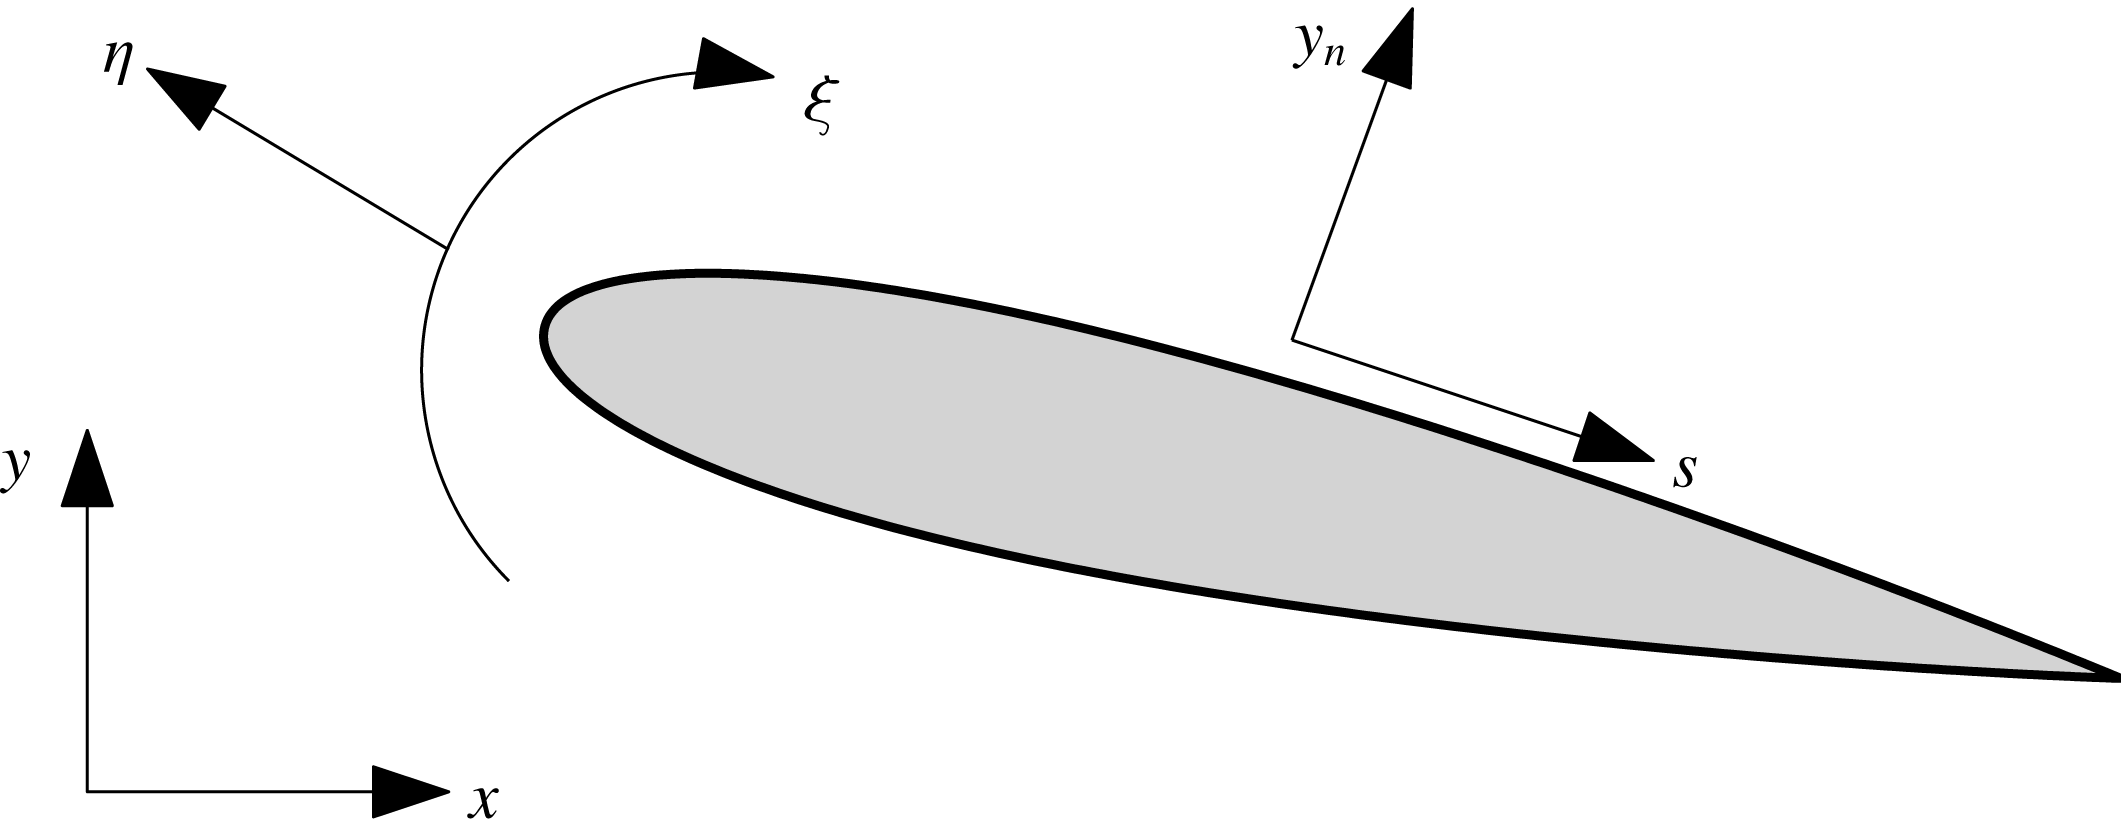
To facilitate the presentation of our results, three coordinate systems are employed, as shown in figure 1: $(x,y,z)=(x_{1},x_{2},x_{3})$
are Cartesian coordinates with corresponding velocity components
$(x,y,z)=(x_{1},x_{2},x_{3})$
are Cartesian coordinates with corresponding velocity components $(u_{1},u_{2},u_{3})=(u,v,w)$
;
$(u_{1},u_{2},u_{3})=(u,v,w)$
; $(\unicode[STIX]{x1D709},\unicode[STIX]{x1D702},\unicode[STIX]{x1D701})=(\unicode[STIX]{x1D709}^{1},\unicode[STIX]{x1D709}^{2},\unicode[STIX]{x1D709}^{3})$
are generalized curvilinear coordinates. The spanwise geometry is uniform in the present research, thus the
$(\unicode[STIX]{x1D709},\unicode[STIX]{x1D702},\unicode[STIX]{x1D701})=(\unicode[STIX]{x1D709}^{1},\unicode[STIX]{x1D709}^{2},\unicode[STIX]{x1D709}^{3})$
are generalized curvilinear coordinates. The spanwise geometry is uniform in the present research, thus the $\unicode[STIX]{x1D701}$
-direction is congruent with the
$\unicode[STIX]{x1D701}$
-direction is congruent with the $z$
-direction. In addition, we denote
$z$
-direction. In addition, we denote $(s,y_{n},z)$
as coordinates with origin located at the leading edge (same as the Cartesian coordinates), where the
$(s,y_{n},z)$
as coordinates with origin located at the leading edge (same as the Cartesian coordinates), where the $s$
-coordinate denotes the streamwise direction (parallel to the airfoil surface), and
$s$
-coordinate denotes the streamwise direction (parallel to the airfoil surface), and $y_{n}$
denotes the local wall normal to the airfoil surface. The corresponding velocity components are
$y_{n}$
denotes the local wall normal to the airfoil surface. The corresponding velocity components are $(u_{s},u_{n},w)$
.
$(u_{s},u_{n},w)$
.
Sketch of the coordinate systems.
For flows past airfoils, aerodynamic quantities of interest are the integrated forces characterized by the overall lift coefficient $C_{L}$
and drag coefficient
$C_{L}$
and drag coefficient $C_{D}$
; and surface quantities such as pressure coefficient scalar
$C_{D}$
; and surface quantities such as pressure coefficient scalar $C_{p}$
and surface skin friction (2-D vector on the airfoil surface)
$C_{p}$
and surface skin friction (2-D vector on the airfoil surface) $\boldsymbol{C}_{\boldsymbol{f}}(C_{f},C_{fz})$
, where
$\boldsymbol{C}_{\boldsymbol{f}}(C_{f},C_{fz})$
, where $C_{f}$
and
$C_{f}$
and $C_{fz}$
denote the streamwise and spanwise skin friction coefficients, respectively. These aforementioned quantities require the flow field on the surface and near wall for computations of gradients. The off-wall flow quantities of interest include velocity vector
$C_{fz}$
denote the streamwise and spanwise skin friction coefficients, respectively. These aforementioned quantities require the flow field on the surface and near wall for computations of gradients. The off-wall flow quantities of interest include velocity vector $\boldsymbol{u}(u,v,w)$
and Reynolds stress tensor with key components
$\boldsymbol{u}(u,v,w)$
and Reynolds stress tensor with key components $u^{\prime }u^{\prime }$
,
$u^{\prime }u^{\prime }$
, $v^{\prime }v^{\prime }$
and
$v^{\prime }v^{\prime }$
and $u^{\prime }v^{\prime }$
. In both numerical and experimental studies of airfoil flows,
$u^{\prime }v^{\prime }$
. In both numerical and experimental studies of airfoil flows, $C_{p}$
,
$C_{p}$
, $C_{f}$
,
$C_{f}$
, $\overline{u^{\prime }u^{\prime }}$
,
$\overline{u^{\prime }u^{\prime }}$
, $\overline{v^{\prime }v^{\prime }}$
and
$\overline{v^{\prime }v^{\prime }}$
and $\overline{u^{\prime }v^{\prime }}$
are computed by both spanwise and time averaging (the overbar indicates averaging for Reynolds stress tensor components). We further note that available data of velocity components and Reynolds stress components may be presented in Cartesian coordinate or body-fitted coordinates.
$\overline{u^{\prime }v^{\prime }}$
are computed by both spanwise and time averaging (the overbar indicates averaging for Reynolds stress tensor components). We further note that available data of velocity components and Reynolds stress components may be presented in Cartesian coordinate or body-fitted coordinates.
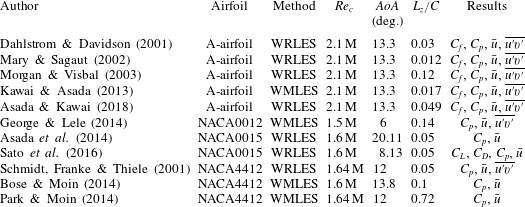
Although many LES have been performed to investigate the flow dynamics past an airfoil at low $Re_{c}$
, few results have been published at high
$Re_{c}$
, few results have been published at high $Re_{c}$
(
$Re_{c}$
( $Re_{c}\geqslant 10^{6}$
). Here we tabulate previous LES studies of flows past isolated airfoils for
$Re_{c}\geqslant 10^{6}$
). Here we tabulate previous LES studies of flows past isolated airfoils for $Re_{c}\geqslant 10^{6}$
(see table 1). It is noted that the skin-friction coefficient (
$Re_{c}\geqslant 10^{6}$
(see table 1). It is noted that the skin-friction coefficient ( $C_{f}$
) and Reynolds stress (
$C_{f}$
) and Reynolds stress ( $\overline{u^{\prime }v^{\prime }}$
) are mostly reported for wall-resolved LES, whereas most wall-modelled LES focus on the mean quantities, i.e. velocity profiles (
$\overline{u^{\prime }v^{\prime }}$
) are mostly reported for wall-resolved LES, whereas most wall-modelled LES focus on the mean quantities, i.e. velocity profiles ( $\bar{u}$
), lift coefficient (
$\bar{u}$
), lift coefficient ( $C_{L}$
), drag coefficient (
$C_{L}$
), drag coefficient ( $C_{D}$
) and pressure coefficient (
$C_{D}$
) and pressure coefficient ( $C_{p}$
). Notable exceptions are Kawai & Asada (Reference Kawai and Asada2013) which reports
$C_{p}$
). Notable exceptions are Kawai & Asada (Reference Kawai and Asada2013) which reports $C_{f}$
and
$C_{f}$
and $\overline{u^{\prime }v^{\prime }}$
in WMLES of flow past the A-airfoil, and George & Lele (Reference George and Lele2014) which reports on diagonal components of the Reynolds stress tensor in WMLES of flow past a NACA0012 airfoil. One may discern from these studies that accurate predictions of the skin-friction coefficient and Reynolds stresses are somewhat challenging. Also listed in table 1 is the spanwise domain extent
$\overline{u^{\prime }v^{\prime }}$
in WMLES of flow past the A-airfoil, and George & Lele (Reference George and Lele2014) which reports on diagonal components of the Reynolds stress tensor in WMLES of flow past a NACA0012 airfoil. One may discern from these studies that accurate predictions of the skin-friction coefficient and Reynolds stresses are somewhat challenging. Also listed in table 1 is the spanwise domain extent $L_{z}/C$
. It was noted in DNS of flow past an airfoil (Zhang & Samtaney Reference Zhang and Samtaney2016), that the spanwise domain size has a significant impact on the results.
$L_{z}/C$
. It was noted in DNS of flow past an airfoil (Zhang & Samtaney Reference Zhang and Samtaney2016), that the spanwise domain size has a significant impact on the results.
Summary of LES performed in flow past an airfoil at high $Re_{c}$
. Here suffix ‘M’ refers to million;
$Re_{c}$
. Here suffix ‘M’ refers to million; $\bar{u}$
denotes the velocity,
$\bar{u}$
denotes the velocity, $\overline{u^{\prime }v^{\prime }}$
refers to the Reynolds stress tensor components,
$\overline{u^{\prime }v^{\prime }}$
refers to the Reynolds stress tensor components, $C_{p}$
is the pressure coefficient,
$C_{p}$
is the pressure coefficient, $C_{f}$
is the skin-friction coefficient and
$C_{f}$
is the skin-friction coefficient and $L_{z}/C$
is the ratio of the spanwise domain size to chord length.
$L_{z}/C$
is the ratio of the spanwise domain size to chord length.
3 Wall modelling in complex geometry
In this section, starting with the Navier–Stokes equations in the generalized curvilinear coordinates, we apply near-wall filtering along with the assumption of inner scaling to derive an ordinary differential equation (ODE) governing the local wall-normal velocity gradient, and a slip Dirichlet boundary condition for velocity at a virtual wall.
3.1 Navier–Stokes equations
The incompressible Navier–Stokes (N–S) equations in the generalized curvilinear coordinates are
 $$\begin{eqnarray}\displaystyle & \displaystyle \frac{\unicode[STIX]{x2202}U^{m}}{\unicode[STIX]{x2202}\unicode[STIX]{x1D709}^{m}}=0, & \displaystyle\end{eqnarray}$$
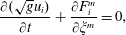 $$\begin{eqnarray}\displaystyle & \displaystyle \frac{\unicode[STIX]{x2202}(\sqrt{g}u_{i})}{\unicode[STIX]{x2202}t}+\frac{\unicode[STIX]{x2202}F_{i}^{m}}{\unicode[STIX]{x2202}\unicode[STIX]{x1D709}^{m}}=0, & \displaystyle\end{eqnarray}$$
where $U^{m}$
(the volume flux normal to the surface of constant
$U^{m}$
(the volume flux normal to the surface of constant $\unicode[STIX]{x1D709}^{m}$
) and
$\unicode[STIX]{x1D709}^{m}$
) and $F_{i}^{m}$
are given by
$F_{i}^{m}$
are given by
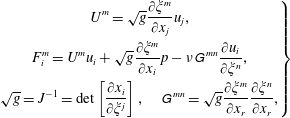 $$\begin{eqnarray}\displaystyle \left.\begin{array}{@{}c@{}}\displaystyle U^{m}=\sqrt{g}\frac{\unicode[STIX]{x2202}\unicode[STIX]{x1D709}^{m}}{\unicode[STIX]{x2202}x_{j}}u_{j},\\ \displaystyle F_{i}^{m}=U^{m}u_{i}+\sqrt{g}\frac{\unicode[STIX]{x2202}\unicode[STIX]{x1D709}^{m}}{\unicode[STIX]{x2202}x_{i}}p-\unicode[STIX]{x1D708}\unicode[STIX]{x1D60E}^{\,mn}\frac{\unicode[STIX]{x2202}u_{i}}{\unicode[STIX]{x2202}\unicode[STIX]{x1D709}^{n}},\\ \displaystyle \sqrt{g}=J^{-1}=\det \left[\frac{\unicode[STIX]{x2202}x_{i}}{\unicode[STIX]{x2202}\unicode[STIX]{x1D709}^{j}}\right],\quad \unicode[STIX]{x1D60E}^{\,mn}=\sqrt{g}\frac{\unicode[STIX]{x2202}\unicode[STIX]{x1D709}^{m}}{\unicode[STIX]{x2202}x_{r}}\frac{\unicode[STIX]{x2202}\unicode[STIX]{x1D709}^{n}}{\unicode[STIX]{x2202}x_{r}},\end{array}\right\} & & \displaystyle\end{eqnarray}$$
where $p$
is the pressure,
$p$
is the pressure, $u_{i}$
is the velocity in the Cartesian coordinates,
$u_{i}$
is the velocity in the Cartesian coordinates, $\unicode[STIX]{x1D708}$
is the kinematic viscosity,
$\unicode[STIX]{x1D708}$
is the kinematic viscosity, $J^{-1}$
is the Jacobian of the transformation,
$J^{-1}$
is the Jacobian of the transformation, $\unicode[STIX]{x1D60E}^{\,mn}$
is the mesh skewness tensor.
$\unicode[STIX]{x1D60E}^{\,mn}$
is the mesh skewness tensor.
Applying a nominal filter to the N–S equations, the filtered LES equations have a form similar to (3.1) and (3.2), and are written below in terms of the resolved velocity field,
 $$\begin{eqnarray}\displaystyle & \displaystyle \tilde{U} ^{m}=\sqrt{g}\frac{\unicode[STIX]{x2202}\unicode[STIX]{x1D709}^{m}}{\unicode[STIX]{x2202}x_{j}}\tilde{u} _{j}, & \displaystyle\end{eqnarray}$$
 $$\begin{eqnarray}\displaystyle & \displaystyle \tilde{F}_{i}^{m}=\tilde{U} ^{m}\tilde{u} _{i}+\sqrt{g}\frac{\unicode[STIX]{x2202}\unicode[STIX]{x1D709}^{m}}{\unicode[STIX]{x2202}x_{i}}\tilde{p}-\unicode[STIX]{x1D708}\unicode[STIX]{x1D60E}^{\,mn}\frac{\unicode[STIX]{x2202}\tilde{u} _{i}}{\unicode[STIX]{x2202}\unicode[STIX]{x1D709}^{n}}+\sqrt{g}\frac{\unicode[STIX]{x2202}\unicode[STIX]{x1D709}^{m}}{\unicode[STIX]{x2202}x_{j}}\unicode[STIX]{x1D61B}_{ij}, & \displaystyle\end{eqnarray}$$
where ${\sim}$
denote filtered quantities,
${\sim}$
denote filtered quantities, $\unicode[STIX]{x1D61B}_{ij}=\widetilde{u_{i}u_{j}}-\tilde{u} _{i}\tilde{u} _{j}$
is the SGS stress tensor.
$\unicode[STIX]{x1D61B}_{ij}=\widetilde{u_{i}u_{j}}-\tilde{u} _{i}\tilde{u} _{j}$
is the SGS stress tensor.
3.2 Near-wall filtering
Following Chung & Pullin (Reference Chung and Pullin2009), we define two near-wall filters in the near-wall region,
 $$\begin{eqnarray}\displaystyle & \displaystyle \tilde{\unicode[STIX]{x1D719}}(\unicode[STIX]{x1D709},\unicode[STIX]{x1D702},\unicode[STIX]{x1D701},t)=\iint \unicode[STIX]{x1D719}(\unicode[STIX]{x1D709},\unicode[STIX]{x1D702},\unicode[STIX]{x1D701},t)G(\unicode[STIX]{x1D709}-\unicode[STIX]{x1D709}^{\prime },\unicode[STIX]{x1D6E5}_{f})G(\unicode[STIX]{x1D701}-\unicode[STIX]{x1D701}^{\prime },\unicode[STIX]{x1D6E5}_{f})\,\text{d}\unicode[STIX]{x1D709}^{\prime }\,\text{d}\unicode[STIX]{x1D701}^{\prime }, & \displaystyle\end{eqnarray}$$
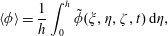 $$\begin{eqnarray}\displaystyle & \displaystyle \langle \unicode[STIX]{x1D719}\rangle =\frac{1}{h}\int _{0}^{h}\tilde{\unicode[STIX]{x1D719}}(\unicode[STIX]{x1D709},\unicode[STIX]{x1D702},\unicode[STIX]{x1D701},t)\,\text{d}\unicode[STIX]{x1D702}, & \displaystyle\end{eqnarray}$$
where (3.6) and (3.7) define the wall-parallel filter and the wall-normal averaging filter, respectively. The planar filtering (with filtering function $G$
) is purely formal; we do not perform such a filtering operation and indeed no explicit filtering of the velocity or pressure fields is employed in the present approach. It should be noted that, consistent with other approaches involving body-fitted mesh computations, the computational mesh is constrained to be locally orthogonal to the airfoil surface for wall-normal averaging, and the wall-normal distance is denoted as
$G$
) is purely formal; we do not perform such a filtering operation and indeed no explicit filtering of the velocity or pressure fields is employed in the present approach. It should be noted that, consistent with other approaches involving body-fitted mesh computations, the computational mesh is constrained to be locally orthogonal to the airfoil surface for wall-normal averaging, and the wall-normal distance is denoted as $y_{n}$
. As shown in figure 2, the distance,
$y_{n}$
. As shown in figure 2, the distance, $h$
above is typically chosen as the distance of the first grid point from the airfoil surface or the solid wall; and
$h$
above is typically chosen as the distance of the first grid point from the airfoil surface or the solid wall; and $h_{0}$
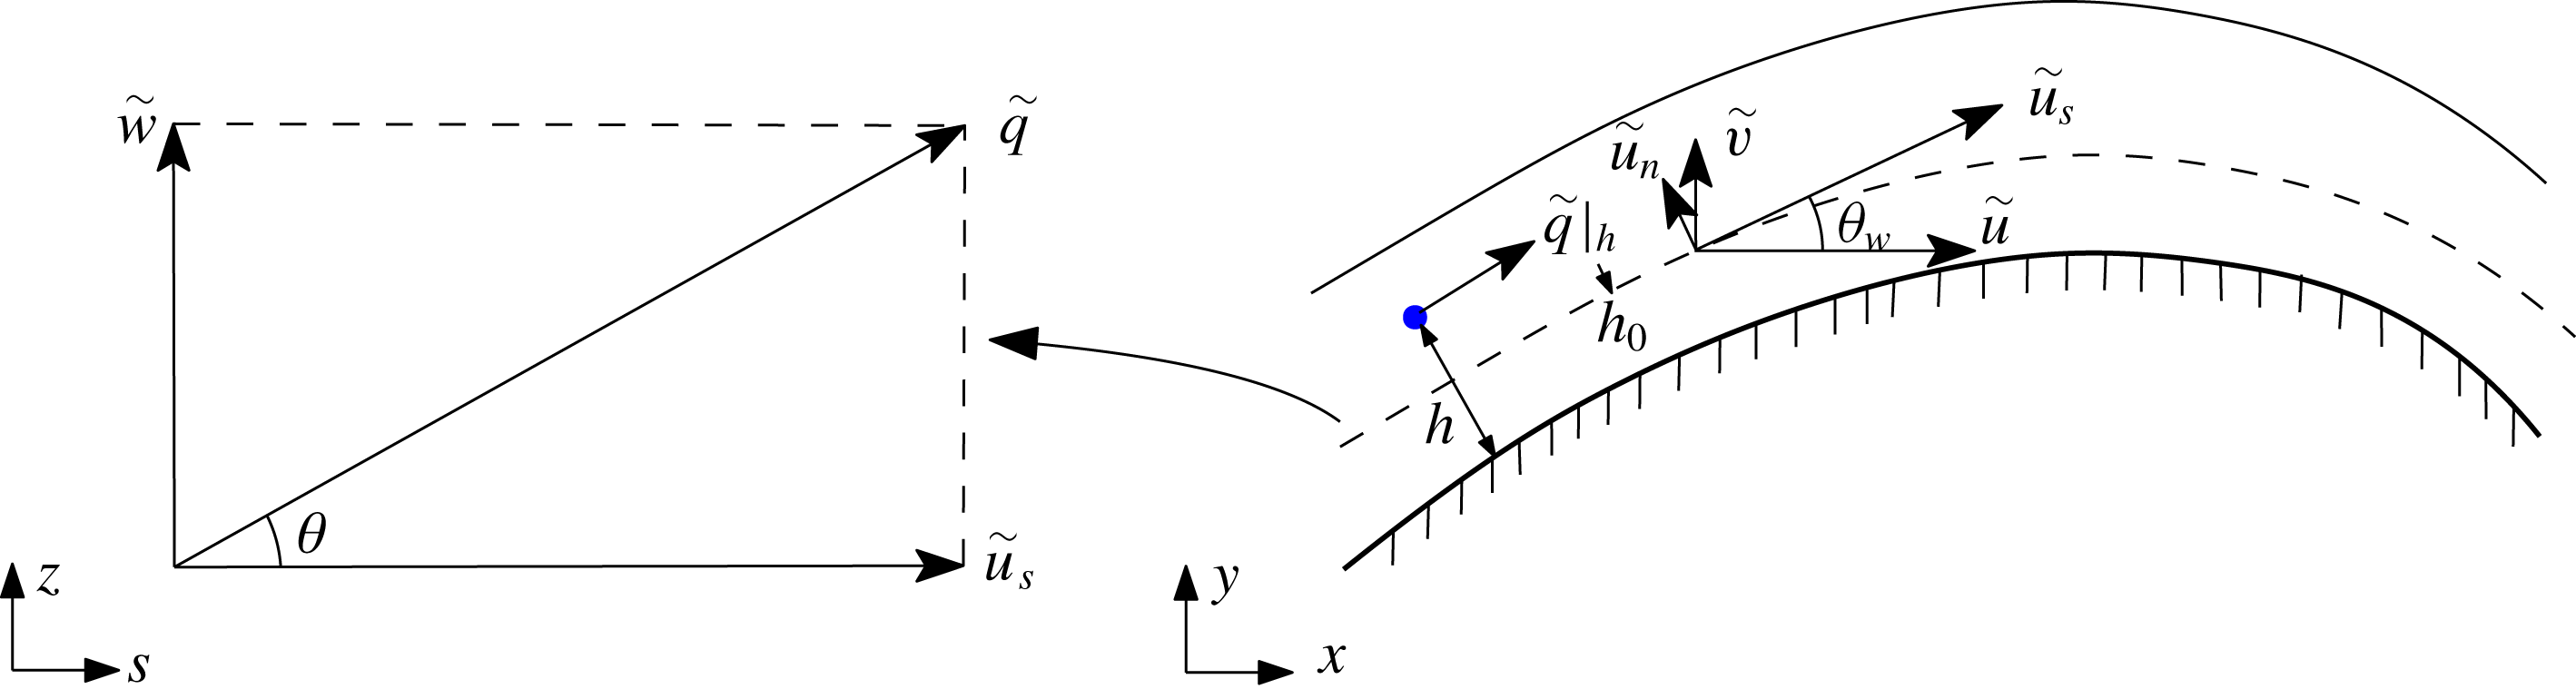
is the height of the virtual wall that is further discussed below. Applying the wall-parallel filter (3.6) to the momentum equations (3.2), we obtain
$h_{0}$
is the height of the virtual wall that is further discussed below. Applying the wall-parallel filter (3.6) to the momentum equations (3.2), we obtain
 $$\begin{eqnarray}\displaystyle & \displaystyle \frac{\unicode[STIX]{x2202}\tilde{u} }{\unicode[STIX]{x2202}t}=-\frac{1}{\sqrt{g}}\frac{\unicode[STIX]{x2202}}{\unicode[STIX]{x2202}\unicode[STIX]{x1D709}^{m}}\left(\widetilde{U^{m}u}+\sqrt{g}\frac{\unicode[STIX]{x2202}\unicode[STIX]{x1D709}^{m}}{\unicode[STIX]{x2202}x}\tilde{p}-\unicode[STIX]{x1D708}\unicode[STIX]{x1D60E}^{\,mn}\frac{\unicode[STIX]{x2202}\tilde{u} }{\unicode[STIX]{x2202}\unicode[STIX]{x1D709}^{n}}\right), & \displaystyle\end{eqnarray}$$
 $$\begin{eqnarray}\displaystyle & \displaystyle \frac{\unicode[STIX]{x2202}\tilde{v}}{\unicode[STIX]{x2202}t}=-\frac{1}{\sqrt{g}}\frac{\unicode[STIX]{x2202}}{\unicode[STIX]{x2202}\unicode[STIX]{x1D709}^{m}}\left(\widetilde{U^{m}v}+\sqrt{g}\frac{\unicode[STIX]{x2202}\unicode[STIX]{x1D709}^{m}}{\unicode[STIX]{x2202}y}\tilde{p}-\unicode[STIX]{x1D708}\unicode[STIX]{x1D60E}^{\,mn}\frac{\unicode[STIX]{x2202}\tilde{v}}{\unicode[STIX]{x2202}\unicode[STIX]{x1D709}^{n}}\right), & \displaystyle\end{eqnarray}$$
 $$\begin{eqnarray}\displaystyle & \displaystyle \frac{\unicode[STIX]{x2202}\tilde{w}}{\unicode[STIX]{x2202}t}=-\frac{1}{\sqrt{g}}\frac{\unicode[STIX]{x2202}}{\unicode[STIX]{x2202}\unicode[STIX]{x1D709}^{m}}\left(\widetilde{U^{m}w}+\sqrt{g}\frac{\unicode[STIX]{x2202}\unicode[STIX]{x1D709}^{m}}{\unicode[STIX]{x2202}z}\tilde{p}-\unicode[STIX]{x1D708}\unicode[STIX]{x1D60E}^{\,mn}\frac{\unicode[STIX]{x2202}\tilde{w}}{\unicode[STIX]{x2202}\unicode[STIX]{x1D709}^{n}}\right), & \displaystyle\end{eqnarray}$$ $(u,v,w)=(u_{1},u_{2},u_{3})$
denote the velocity components in the Cartesian coordinates.
$(u,v,w)=(u_{1},u_{2},u_{3})$
denote the velocity components in the Cartesian coordinates.3.3 Inner scaling assumption and governing equation for $\unicode[STIX]{x1D702}_{0}$

The virtual wall model formulation is essentially based on the inner scaling ansatz, which states that the near-wall turbulent statistics are characterized by the kinematic viscosity $\unicode[STIX]{x1D708}$
and the local friction velocity
$\unicode[STIX]{x1D708}$
and the local friction velocity $u_{\unicode[STIX]{x1D70F}}(x,y,z,t)$
. For attached boundary layers, the inner scaling ansatz works well until the end of the log-law region (
$u_{\unicode[STIX]{x1D70F}}(x,y,z,t)$
. For attached boundary layers, the inner scaling ansatz works well until the end of the log-law region ( $15\,\%$
of boundary layer thickness and somewhat less for APG boundary layers), which is certainly sufficient for WMLES. For separated flows, a modified wall model, still essentially based on the inner scaling ansatz, was successfully tested by Cheng et al. (Reference Cheng, Pullin and Samtaney2015) for a flat-plate turbulent boundary layer with separation/reattachment.
$15\,\%$
of boundary layer thickness and somewhat less for APG boundary layers), which is certainly sufficient for WMLES. For separated flows, a modified wall model, still essentially based on the inner scaling ansatz, was successfully tested by Cheng et al. (Reference Cheng, Pullin and Samtaney2015) for a flat-plate turbulent boundary layer with separation/reattachment.
Presently, we define the magnitude of the resultant velocity $\tilde{q}$
and velocity angle
$\tilde{q}$
and velocity angle $\unicode[STIX]{x1D703}$
on the wall-parallel plane as
$\unicode[STIX]{x1D703}$
on the wall-parallel plane as
 $$\begin{eqnarray}\displaystyle \tilde{q}=\sqrt{\tilde{u} _{s}^{2}+\tilde{w}^{2}},\quad \unicode[STIX]{x1D703}=\arccos (\tilde{u} _{s}/\tilde{q}), & & \displaystyle\end{eqnarray}$$
where $\tilde{u} _{s}$
is the streamwise velocity along the airfoil surface (as shown in figure 2),
$\tilde{u} _{s}$
is the streamwise velocity along the airfoil surface (as shown in figure 2),
 $$\begin{eqnarray}\displaystyle \tilde{u} _{s}=\tilde{u} \cos \unicode[STIX]{x1D703}_{w}+\tilde{v}\sin \unicode[STIX]{x1D703}_{w}, & & \displaystyle\end{eqnarray}$$
where $\unicode[STIX]{x1D703}_{w}$
denotes the local angle between the airfoil surface and the
$\unicode[STIX]{x1D703}_{w}$
denotes the local angle between the airfoil surface and the $x$
-coordinate. We assume
$x$
-coordinate. We assume $\tilde{q}$
follows inner scaling, i.e.
$\tilde{q}$
follows inner scaling, i.e.
 $$\begin{eqnarray}\displaystyle \tilde{q}(\unicode[STIX]{x1D709},\unicode[STIX]{x1D702},\unicode[STIX]{x1D701},t)=u_{\unicode[STIX]{x1D70F}}(\unicode[STIX]{x1D709},\unicode[STIX]{x1D701},t)F(y_{n}^{+}),\quad y_{n}^{+}=u_{\unicode[STIX]{x1D70F}}y_{n}/\unicode[STIX]{x1D708}, & & \displaystyle\end{eqnarray}$$
where $F(y_{n}^{+})$
is an unknown function of the normal distance from the airfoil in wall units,
$F(y_{n}^{+})$
is an unknown function of the normal distance from the airfoil in wall units, $u_{\unicode[STIX]{x1D70F}}=\sqrt{\unicode[STIX]{x1D708}\unicode[STIX]{x1D702}_{0}}$
is the friction velocity and
$u_{\unicode[STIX]{x1D70F}}=\sqrt{\unicode[STIX]{x1D708}\unicode[STIX]{x1D702}_{0}}$
is the friction velocity and $\unicode[STIX]{x1D702}_{0}(\unicode[STIX]{x1D709},\unicode[STIX]{x1D701},t)$
is the wall-normal gradient of
$\unicode[STIX]{x1D702}_{0}(\unicode[STIX]{x1D709},\unicode[STIX]{x1D701},t)$
is the wall-normal gradient of $\tilde{q}$
defined as
$\tilde{q}$
defined as
 $$\begin{eqnarray}\displaystyle \unicode[STIX]{x1D702}_{0}\equiv \left.\frac{\unicode[STIX]{x2202}\tilde{q}}{\unicode[STIX]{x2202}y_{n}}\right|_{w}. & & \displaystyle\end{eqnarray}$$
The following ODEs can then be derived as
 $$\begin{eqnarray}\displaystyle \frac{\unicode[STIX]{x2202}u_{\unicode[STIX]{x1D70F}}}{\unicode[STIX]{x2202}\unicode[STIX]{x1D702}_{0}}=\frac{\unicode[STIX]{x1D708}}{2u_{\unicode[STIX]{x1D70F}}}=\frac{1}{2}\sqrt{\frac{\unicode[STIX]{x1D708}}{\unicode[STIX]{x1D702}_{0}}},\quad \frac{\unicode[STIX]{x2202}y_{n}^{+}}{\unicode[STIX]{x2202}\unicode[STIX]{x1D702}_{0}}=\frac{y_{n}^{+}}{2\unicode[STIX]{x1D702}_{0}}. & & \displaystyle\end{eqnarray}$$
Sketch of the near-wall velocity components. The dashed line upon the solid wall denotes the virtual wall, and the blue point denotes the centre of the first grid cell off the solid wall.
Applying the wall-normal averaging filter (3.7) to the governing equation of $\tilde{q}$
results in
$\tilde{q}$
results in
 $$\begin{eqnarray}\displaystyle \frac{\unicode[STIX]{x2202}\langle q\rangle }{\unicode[STIX]{x2202}t}=\frac{\tilde{q}|_{h}}{2\unicode[STIX]{x1D702}_{0}}\frac{\unicode[STIX]{x2202}\unicode[STIX]{x1D702}_{0}}{\unicode[STIX]{x2202}t}, & & \displaystyle\end{eqnarray}$$
where $\tilde{q}|_{h}=u_{\unicode[STIX]{x1D70F}}F(h^{+})$
is the resolved resultant velocity at a distance
$\tilde{q}|_{h}=u_{\unicode[STIX]{x1D70F}}F(h^{+})$
is the resolved resultant velocity at a distance $h$
from the solid wall (see figure 2). It should be noted that (3.14) is an exact consequence of (3.7) and (3.11). Moreover, an explicit form of
$h$
from the solid wall (see figure 2). It should be noted that (3.14) is an exact consequence of (3.7) and (3.11). Moreover, an explicit form of $F(y_{n}^{+})$
is not required owing to cancellation.
$F(y_{n}^{+})$
is not required owing to cancellation.
From the definition of $\tilde{q}$
, (3.9), we have
$\tilde{q}$
, (3.9), we have
 $$\begin{eqnarray}\displaystyle \frac{\unicode[STIX]{x2202}\langle q\rangle }{\unicode[STIX]{x2202}t}=\frac{1}{h}\int _{0}^{h}\left(\frac{\tilde{u} _{s}}{\tilde{q}}\frac{\unicode[STIX]{x2202}\tilde{u} _{s}}{\unicode[STIX]{x2202}t}+\frac{\tilde{w}}{\tilde{q}}\frac{\unicode[STIX]{x2202}\tilde{w}}{\unicode[STIX]{x2202}t}\right)\text{d}y_{n}. & & \displaystyle\end{eqnarray}$$
Some terms in the above equation may be analytically integrated (see details in appendix A). Then combining (3.14) and (3.15), we arrive at the governing equation for $\unicode[STIX]{x1D702}_{0}$
,
$\unicode[STIX]{x1D702}_{0}$
,
 $$\begin{eqnarray}\displaystyle \frac{\unicode[STIX]{x2202}\unicode[STIX]{x1D702}_{0}}{\unicode[STIX]{x2202}t}=C_{1}\unicode[STIX]{x1D702}_{0}-C_{2}\unicode[STIX]{x1D702}_{0}^{2}, & & \displaystyle\end{eqnarray}$$
where
 $$\begin{eqnarray}\displaystyle C_{1}=\frac{2}{\tilde{q}|_{h}}\left(F_{\unicode[STIX]{x1D709}}+F\unicode[STIX]{x1D701}+M\left.\frac{\unicode[STIX]{x1D708}\unicode[STIX]{x1D60E}^{\,22}}{\sqrt{g}h}\frac{\unicode[STIX]{x2202}\tilde{q}}{\unicode[STIX]{x2202}y_{n}}\right|_{h}\right),\quad C_{2}=\frac{2\unicode[STIX]{x1D708}\unicode[STIX]{x1D60E}^{\,22}}{\sqrt{g}h\tilde{q}|_{h}}. & & \displaystyle\end{eqnarray}$$
Detailed expressions for $F_{\unicode[STIX]{x1D709}}$
,
$F_{\unicode[STIX]{x1D709}}$
, $F_{\unicode[STIX]{x1D701}}$
and
$F_{\unicode[STIX]{x1D701}}$
and $M$
are given by equations (A 3) and (A 5) and (A 7), respectively, in appendix A.
$M$
are given by equations (A 3) and (A 5) and (A 7), respectively, in appendix A.
3.4 Near-wall treatment and solution of the ODE
On the right-hand side of (3.17), $F_{\unicode[STIX]{x1D709}}$
,
$F_{\unicode[STIX]{x1D709}}$
, $F_{\unicode[STIX]{x1D701}}$
and
$F_{\unicode[STIX]{x1D701}}$
and $M$
are unknown, both of which are estimated by resolved-scale quantities at the first grid point
$M$
are unknown, both of which are estimated by resolved-scale quantities at the first grid point $(y_{n}=h)$
above the wall. For example, the first term on the right-hand side of (A 3) is approximated by LES resolved-scale values at
$(y_{n}=h)$
above the wall. For example, the first term on the right-hand side of (A 3) is approximated by LES resolved-scale values at $y_{n}=h$
as
$y_{n}=h$
as
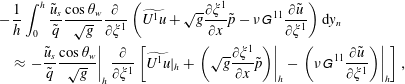 $$\begin{eqnarray}\displaystyle & & \displaystyle -\frac{1}{h}\int _{0}^{h}\frac{\tilde{u} _{s}}{\tilde{q}}\frac{\cos \unicode[STIX]{x1D703}_{w}}{\sqrt{g}}\frac{\unicode[STIX]{x2202}}{\unicode[STIX]{x2202}\unicode[STIX]{x1D709}^{1}}\left(\widetilde{U^{1}u}+\sqrt{g}\frac{\unicode[STIX]{x2202}\unicode[STIX]{x1D709}^{1}}{\unicode[STIX]{x2202}x}\tilde{p}-\unicode[STIX]{x1D708}\unicode[STIX]{x1D60E}^{\,11}\frac{\unicode[STIX]{x2202}\tilde{u} }{\unicode[STIX]{x2202}\unicode[STIX]{x1D709}^{1}}\right)\text{d}y_{n}\nonumber\\ \displaystyle & & \displaystyle \quad \approx \left.-\frac{\tilde{u} _{s}}{\tilde{q}}\frac{\cos \unicode[STIX]{x1D703}_{w}}{\sqrt{g}}\right|_{h}\frac{\unicode[STIX]{x2202}}{\unicode[STIX]{x2202}\unicode[STIX]{x1D709}^{1}}\left[\widetilde{U^{1}u}|_{h}+\left.\left(\sqrt{g}\frac{\unicode[STIX]{x2202}\unicode[STIX]{x1D709}^{1}}{\unicode[STIX]{x2202}x}\tilde{p}\right)\right|_{h}-\left.\left(\unicode[STIX]{x1D708}\unicode[STIX]{x1D60E}^{\,11}\frac{\unicode[STIX]{x2202}\tilde{u} }{\unicode[STIX]{x2202}\unicode[STIX]{x1D709}^{1}}\right)\right|_{h}\right],\end{eqnarray}$$
where
 $$\begin{eqnarray}\displaystyle \left.\begin{array}{@{}c@{}}\displaystyle \widetilde{U^{1}u}|_{h}=\left.\sqrt{g}\frac{\unicode[STIX]{x2202}\unicode[STIX]{x1D709}^{1}}{\unicode[STIX]{x2202}x_{1}}\widetilde{uu}\right|_{h}+\left.\sqrt{g}\frac{\unicode[STIX]{x2202}\unicode[STIX]{x1D709}^{1}}{\unicode[STIX]{x2202}x_{2}}\widetilde{uv}\right|_{h}+\left.\sqrt{g}\frac{\unicode[STIX]{x2202}\unicode[STIX]{x1D709}^{1}}{\unicode[STIX]{x2202}x_{3}}\widetilde{uw}\right|_{h},\\ \displaystyle \widetilde{uu}|_{h}\approx \tilde{u} \tilde{u} |_{h}+\unicode[STIX]{x1D61B}_{xx}|_{h},\widetilde{uv}|_{h}\approx \tilde{u} \tilde{v}|_{h}+\unicode[STIX]{x1D61B}_{xy}|_{h},\widetilde{uw}|_{h}\approx \tilde{u} \tilde{w}|_{h}+\unicode[STIX]{x1D61B}_{xz}|_{h},\end{array}\right\} & & \displaystyle\end{eqnarray}$$
where $\unicode[STIX]{x1D61B}_{xx}$
,
$\unicode[STIX]{x1D61B}_{xx}$
, $\unicode[STIX]{x1D61B}_{xy}$
and
$\unicode[STIX]{x1D61B}_{xy}$
and $\unicode[STIX]{x1D61B}_{xz}$
are the SGS stress tensor components (discussed in § 4.1). The other terms in
$\unicode[STIX]{x1D61B}_{xz}$
are the SGS stress tensor components (discussed in § 4.1). The other terms in $F_{\unicode[STIX]{x1D709}}$
(A 3) and
$F_{\unicode[STIX]{x1D709}}$
(A 3) and $F_{\unicode[STIX]{x1D701}}$
(A 5) and
$F_{\unicode[STIX]{x1D701}}$
(A 5) and $M$
(A 7) are approximated in a similar manner.
$M$
(A 7) are approximated in a similar manner.
If coefficients $C_{1}$
and
$C_{1}$
and $C_{2}$
in equation (3.16) are weakly dependent on
$C_{2}$
in equation (3.16) are weakly dependent on $t$
, then assuming these to be constant, equation (3.16) may be interpreted as a second-order linear ODE for
$t$
, then assuming these to be constant, equation (3.16) may be interpreted as a second-order linear ODE for $\unicode[STIX]{x1D702}_{0}$
which can be solved analytically (details are in appendix B).
$\unicode[STIX]{x1D702}_{0}$
which can be solved analytically (details are in appendix B).
Once $\unicode[STIX]{x1D702}_{0}(\unicode[STIX]{x1D709},\unicode[STIX]{x1D701},t)$
is known, and the velocity angle
$\unicode[STIX]{x1D702}_{0}(\unicode[STIX]{x1D709},\unicode[STIX]{x1D701},t)$
is known, and the velocity angle $\unicode[STIX]{x1D703}(\unicode[STIX]{x1D709},\unicode[STIX]{x1D701},t)$
is estimated as
$\unicode[STIX]{x1D703}(\unicode[STIX]{x1D709},\unicode[STIX]{x1D701},t)$
is estimated as $\arccos (\tilde{u} _{s}|_{h}/\tilde{q}|_{h})$
(meaning that streamline orientation on the virtual wall is determined by the first grid cell from the resolved LES field, an approximation justified below based on the work of Cheng et al. (Reference Cheng, Pullin and Samtaney2015)), the local wall shear stress components may then be computed as
$\arccos (\tilde{u} _{s}|_{h}/\tilde{q}|_{h})$
(meaning that streamline orientation on the virtual wall is determined by the first grid cell from the resolved LES field, an approximation justified below based on the work of Cheng et al. (Reference Cheng, Pullin and Samtaney2015)), the local wall shear stress components may then be computed as
 $$\begin{eqnarray}\displaystyle \unicode[STIX]{x1D70F}_{w,s}=\unicode[STIX]{x1D707}\unicode[STIX]{x1D702}_{0}\cos \unicode[STIX]{x1D703},\quad \unicode[STIX]{x1D70F}_{w,z}=\unicode[STIX]{x1D707}\unicode[STIX]{x1D702}_{0}\sin \unicode[STIX]{x1D703}. & & \displaystyle\end{eqnarray}$$
Here $\unicode[STIX]{x1D707}=\unicode[STIX]{x1D70C}\unicode[STIX]{x1D708}$
is the dynamic viscosity, and
$\unicode[STIX]{x1D707}=\unicode[STIX]{x1D70C}\unicode[STIX]{x1D708}$
is the dynamic viscosity, and $\unicode[STIX]{x1D749}_{w}\equiv (\unicode[STIX]{x1D70F}_{w,s},\unicode[STIX]{x1D70F}_{w,z})$
is the LES representation of the surface stress vector. Above, we make the approximation that the velocity angle
$\unicode[STIX]{x1D749}_{w}\equiv (\unicode[STIX]{x1D70F}_{w,s},\unicode[STIX]{x1D70F}_{w,z})$
is the LES representation of the surface stress vector. Above, we make the approximation that the velocity angle $\unicode[STIX]{x1D703}$
is assumed to be constant within the first grid cell,
$\unicode[STIX]{x1D703}$
is assumed to be constant within the first grid cell, $0\leqslant y_{n}\leqslant h$
. Cheng et al. (Reference Cheng, Pullin and Samtaney2015) proposed an algebraic model for
$0\leqslant y_{n}\leqslant h$
. Cheng et al. (Reference Cheng, Pullin and Samtaney2015) proposed an algebraic model for $\unicode[STIX]{x1D703}$
in turbulent boundary layer simulations and concluded that there is little difference between the constant velocity angle model and the algebraic model. In the present paper, the constant velocity angle model is adopted for simplicity.
$\unicode[STIX]{x1D703}$
in turbulent boundary layer simulations and concluded that there is little difference between the constant velocity angle model and the algebraic model. In the present paper, the constant velocity angle model is adopted for simplicity.
3.5 Slip velocity boundary conditions
Once $\unicode[STIX]{x1D702}_{0}$
is solved using (3.16), we complete the wall model with a slip velocity at a raised virtual wall plane located at
$\unicode[STIX]{x1D702}_{0}$
is solved using (3.16), we complete the wall model with a slip velocity at a raised virtual wall plane located at $\unicode[STIX]{x1D702}=h_{0}$
, which scales with the boundary layer thickness but remains small, i.e.
$\unicode[STIX]{x1D702}=h_{0}$
, which scales with the boundary layer thickness but remains small, i.e. $h_{0}\leqslant 0.1\unicode[STIX]{x1D6FF}$
. Typically,
$h_{0}\leqslant 0.1\unicode[STIX]{x1D6FF}$
. Typically, $h_{0}$
is chosen as a small fraction of the near-wall cell size. In previous studies, both in channel flow by Chung & Pullin (Reference Chung and Pullin2009) and turbulent boundary layer flows (ZPG and APG) by Inoue & Pullin (Reference Inoue and Pullin2011) and Cheng et al. (Reference Cheng, Pullin and Samtaney2015),
$h_{0}$
is chosen as a small fraction of the near-wall cell size. In previous studies, both in channel flow by Chung & Pullin (Reference Chung and Pullin2009) and turbulent boundary layer flows (ZPG and APG) by Inoue & Pullin (Reference Inoue and Pullin2011) and Cheng et al. (Reference Cheng, Pullin and Samtaney2015), $h_{0}/\unicode[STIX]{x0394}\unicode[STIX]{x1D702}=0.18$
is fixed with respect to the first off-wall grid cell and the sensitivity to changes was documented in Chung & Pullin (Reference Chung and Pullin2009). Their verifications and validations capture the near-wall flow physics well, and we follow this choice in the present research.
$h_{0}/\unicode[STIX]{x0394}\unicode[STIX]{x1D702}=0.18$
is fixed with respect to the first off-wall grid cell and the sensitivity to changes was documented in Chung & Pullin (Reference Chung and Pullin2009). Their verifications and validations capture the near-wall flow physics well, and we follow this choice in the present research.
We model the resultant slip velocity $\tilde{q}|_{h_{0}}$
on the virtual wall as
$\tilde{q}|_{h_{0}}$
on the virtual wall as
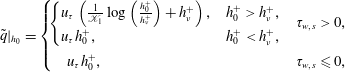 $$\begin{eqnarray}\displaystyle \tilde{q}|_{h_{0}}=\left\{\begin{array}{@{}ll@{}}\!\left\{\begin{array}{@{}ll@{}}u_{\unicode[STIX]{x1D70F}}\left(\frac{1}{\mathscr{K}_{1}}\log \left(\frac{h_{0}^{+}}{h_{\unicode[STIX]{x1D708}}^{+}}\right)+h_{\unicode[STIX]{x1D708}}^{+}\right),\quad & h_{0}^{+}>h_{\unicode[STIX]{x1D708}}^{+},\\ u_{\unicode[STIX]{x1D70F}}h_{0}^{+},\quad & h_{0}^{+}<h_{\unicode[STIX]{x1D708}}^{+},\end{array}\right.\quad & \unicode[STIX]{x1D70F}_{w,s}>0,\\ \quad u_{\unicode[STIX]{x1D70F}}h_{0}^{+},\quad & \unicode[STIX]{x1D70F}_{w,s}\leqslant 0,\end{array}\right. & & \displaystyle\end{eqnarray}$$
where $h_{0}^{+}=u_{\unicode[STIX]{x1D70F}}h_{0}/\unicode[STIX]{x1D708}$
,
$h_{0}^{+}=u_{\unicode[STIX]{x1D70F}}h_{0}/\unicode[STIX]{x1D708}$
, $h_{\unicode[STIX]{x1D708}}^{+}$
is the intercept between the linear and log components in the law of the wall. Experimental research shows that the outer edge of the viscous sublayer is located at
$h_{\unicode[STIX]{x1D708}}^{+}$
is the intercept between the linear and log components in the law of the wall. Experimental research shows that the outer edge of the viscous sublayer is located at $h_{\unicode[STIX]{x1D708}}^{+}\approx 11$
, which is approximately equivalent to the offset
$h_{\unicode[STIX]{x1D708}}^{+}\approx 11$
, which is approximately equivalent to the offset $(=5.0)$
in the classical log law. This value was adopted by Chung & Pullin (Reference Chung and Pullin2009) and Inoue & Pullin (Reference Inoue and Pullin2011), and also by Cheng et al. (Reference Cheng, Pullin and Samtaney2015) in modelling the turbulent boundary layer flows with separation and reattachment. Presently,
$(=5.0)$
in the classical log law. This value was adopted by Chung & Pullin (Reference Chung and Pullin2009) and Inoue & Pullin (Reference Inoue and Pullin2011), and also by Cheng et al. (Reference Cheng, Pullin and Samtaney2015) in modelling the turbulent boundary layer flows with separation and reattachment. Presently, $h_{\unicode[STIX]{x1D708}}^{+}=11$
is used as an empirical parameter in the wall model. In the attached region (
$h_{\unicode[STIX]{x1D708}}^{+}=11$
is used as an empirical parameter in the wall model. In the attached region ( $\unicode[STIX]{x1D70F}_{w,s}>0$
), the linear–log relation is essentially the same as Chung & Pullin (Reference Chung and Pullin2009), which is derived from stretched-vortex SGS model (discussed below) based on the detached/attached eddy concepts of Townsend (Reference Townsend1976). The Kármán-like constant
$\unicode[STIX]{x1D70F}_{w,s}>0$
), the linear–log relation is essentially the same as Chung & Pullin (Reference Chung and Pullin2009), which is derived from stretched-vortex SGS model (discussed below) based on the detached/attached eddy concepts of Townsend (Reference Townsend1976). The Kármán-like constant $\mathscr{K}_{1}$
is dynamically computed (refer to Chung & Pullin (Reference Chung and Pullin2009) for more details). In the separated region, (
$\mathscr{K}_{1}$
is dynamically computed (refer to Chung & Pullin (Reference Chung and Pullin2009) for more details). In the separated region, ( $\unicode[STIX]{x1D70F}_{w,s}\leqslant 0$
), the log-like relation is no longer valid and Cheng et al. (Reference Cheng, Pullin and Samtaney2015) proposed a linear relationship which appears to work reasonably well in regions of flow separation. Presently, we follow the linear law by Cheng et al. (Reference Cheng, Pullin and Samtaney2015).
$\unicode[STIX]{x1D70F}_{w,s}\leqslant 0$
), the log-like relation is no longer valid and Cheng et al. (Reference Cheng, Pullin and Samtaney2015) proposed a linear relationship which appears to work reasonably well in regions of flow separation. Presently, we follow the linear law by Cheng et al. (Reference Cheng, Pullin and Samtaney2015).
3.6 Summary of the wall model
The wall model is summarized as follows: in the near-wall region, equation (3.16) is solved for $\unicode[STIX]{x1D702}_{0}$
, in which the coefficients on the right-hand side are approximated with the resolved LES field at the first grid cell, i.e.
$\unicode[STIX]{x1D702}_{0}$
, in which the coefficients on the right-hand side are approximated with the resolved LES field at the first grid cell, i.e. $h=h_{0}+\unicode[STIX]{x0394}y_{n}/2$
, equation (3.21) is then used to compute the resultant velocity
$h=h_{0}+\unicode[STIX]{x0394}y_{n}/2$
, equation (3.21) is then used to compute the resultant velocity $\tilde{q}|_{h_{0}}$
on the virtual wall with the streamwise and spanwise velocity components given by
$\tilde{q}|_{h_{0}}$
on the virtual wall with the streamwise and spanwise velocity components given by
 $$\begin{eqnarray}\displaystyle \tilde{u} _{s}|_{h_{0}}=\tilde{q}|_{h_{0}}\cos \unicode[STIX]{x1D703},\quad \tilde{w}|_{h_{0}}=\tilde{q}|_{h_{0}}\sin \unicode[STIX]{x1D703}. & & \displaystyle\end{eqnarray}$$
The contribution of the wall-normal velocity component $\tilde{u} _{n}|_{h_{0}}$
to
$\tilde{u} _{n}|_{h_{0}}$
to $\tilde{u}$
and
$\tilde{u}$
and $\tilde{v}$
is assumed to be small compared with
$\tilde{v}$
is assumed to be small compared with $\tilde{u} _{s}|_{h_{0}}$
, and presently we use
$\tilde{u} _{s}|_{h_{0}}$
, and presently we use $\tilde{u} _{n}|_{h_{0}}=0$
. Finally, the slip velocity boundary condition on the virtual wall
$\tilde{u} _{n}|_{h_{0}}=0$
. Finally, the slip velocity boundary condition on the virtual wall $\unicode[STIX]{x1D702}=h_{0}$
is
$\unicode[STIX]{x1D702}=h_{0}$
is
 $$\begin{eqnarray}\displaystyle \tilde{u} |_{h_{0}}=\tilde{q}|_{h_{0}}\cos \unicode[STIX]{x1D703}\cos \unicode[STIX]{x1D703}_{w},\quad \tilde{v}|_{h_{0}}=\tilde{q}|_{h_{0}}\cos \unicode[STIX]{x1D703}\sin \unicode[STIX]{x1D703}_{w}, & & \displaystyle\end{eqnarray}$$
with the spanwise velocity component $\tilde{w}|_{h_{0}}$
given by (3.22).
$\tilde{w}|_{h_{0}}$
given by (3.22).
4 SGS model and numerical set-up
4.1 Stretched-vortex SGS model
The stretched-vortex SGS model has been previously widely deployed in LES of wall-bounded turbulent flows by Pullin and co-workers. Here, for the sake of completeness, we present the essential features of this structure-based SGS model, which assumes that the turbulent fine scales are composed of tube-like structures with spiral vortices (Lundgren Reference Lundgren1982). In each computational cell, the ensemble dynamics is dominated by a stretched vortex with orientation $\boldsymbol{e}^{\unicode[STIX]{x1D708}}$
, taken from a delta-function probability density function (Misra & Pullin Reference Misra and Pullin1997). Consequently, the SGS stress tensor
$\boldsymbol{e}^{\unicode[STIX]{x1D708}}$
, taken from a delta-function probability density function (Misra & Pullin Reference Misra and Pullin1997). Consequently, the SGS stress tensor $\unicode[STIX]{x1D61B}_{ij}$
is modelled as (Chung & Pullin Reference Chung and Pullin2009)
$\unicode[STIX]{x1D61B}_{ij}$
is modelled as (Chung & Pullin Reference Chung and Pullin2009)
 $$\begin{eqnarray}\displaystyle \unicode[STIX]{x1D61B}_{ij}=(\unicode[STIX]{x1D6FF}_{ij}-e_{i}^{v}e_{j}^{v})K,\quad K=\int _{k_{c}}^{\infty }E(k)\,\text{d}k, & & \displaystyle\end{eqnarray}$$
where $K$
is the SGS kinetic energy,
$K$
is the SGS kinetic energy, $k_{c}=\unicode[STIX]{x03C0}/\unicode[STIX]{x1D6E5}_{c}$
is the cutoff wavenumber (
$k_{c}=\unicode[STIX]{x03C0}/\unicode[STIX]{x1D6E5}_{c}$
is the cutoff wavenumber ( $\unicode[STIX]{x1D6E5}_{c}=(\unicode[STIX]{x1D6E5}_{x}\unicode[STIX]{x1D6E5}_{y}\unicode[STIX]{x1D6E5}_{z})^{1/3}$
) and
$\unicode[STIX]{x1D6E5}_{c}=(\unicode[STIX]{x1D6E5}_{x}\unicode[STIX]{x1D6E5}_{y}\unicode[STIX]{x1D6E5}_{z})^{1/3}$
) and $E(k)$
is the SGS energy spectrum given by Lundgren (Reference Lundgren1982). The integration of the energy spectrum gives
$E(k)$
is the SGS energy spectrum given by Lundgren (Reference Lundgren1982). The integration of the energy spectrum gives
 $$\begin{eqnarray}\displaystyle K={\textstyle \frac{1}{2}}{\mathcal{K}}_{0}^{\prime }\unicode[STIX]{x1D6E4}[-1/3,\unicode[STIX]{x1D705}_{c}^{2}],\quad {\mathcal{K}}_{0}^{\prime }={\mathcal{K}}_{0}\unicode[STIX]{x1D716}^{2/3}\unicode[STIX]{x1D706}_{v}^{2/3},\quad \unicode[STIX]{x1D706}_{v}=(2\unicode[STIX]{x1D708}/3|\tilde{a}|)^{1/2},\quad \unicode[STIX]{x1D705}_{c}=k_{c}\unicode[STIX]{x1D706}_{v},\qquad \quad & & \displaystyle\end{eqnarray}$$
where $\unicode[STIX]{x1D6E4}$
is the incomplete gamma function,
$\unicode[STIX]{x1D6E4}$
is the incomplete gamma function, $\tilde{a}=e_{i}^{v}e_{j}^{v}\tilde{\unicode[STIX]{x1D61A}}_{ij}$
is the stretching felt along the subgrid vortex axis imposed by the resolved scales and
$\tilde{a}=e_{i}^{v}e_{j}^{v}\tilde{\unicode[STIX]{x1D61A}}_{ij}$
is the stretching felt along the subgrid vortex axis imposed by the resolved scales and $\tilde{\unicode[STIX]{x1D61A}}_{ij}$
is the resolved SGS strain tensor. The composite parameter
$\tilde{\unicode[STIX]{x1D61A}}_{ij}$
is the resolved SGS strain tensor. The composite parameter ${\mathcal{K}}_{0}^{\prime }$
is obtained dynamically by structure-function matching at the grid-scale cutoff (Voelkl, Pullin & Chan Reference Voelkl, Pullin and Chan2000), i.e.
${\mathcal{K}}_{0}^{\prime }$
is obtained dynamically by structure-function matching at the grid-scale cutoff (Voelkl, Pullin & Chan Reference Voelkl, Pullin and Chan2000), i.e. ${\mathcal{K}}_{0}^{\prime }=\langle F_{2}\rangle /\langle Q(\unicode[STIX]{x1D705}_{c},d)\rangle$
, where
${\mathcal{K}}_{0}^{\prime }=\langle F_{2}\rangle /\langle Q(\unicode[STIX]{x1D705}_{c},d)\rangle$
, where $\langle .\rangle$
denotes a local-averaging operator computed from the neighbouring
$\langle .\rangle$
denotes a local-averaging operator computed from the neighbouring $26$
points,
$26$
points, $F_{2}$
is the second-order velocity structure function from the resolved LES field, and the calculation of
$F_{2}$
is the second-order velocity structure function from the resolved LES field, and the calculation of $Q(\unicode[STIX]{x1D705}_{c},d)$
is similar to Voelkl et al. (Reference Voelkl, Pullin and Chan2000), Chung & Pullin (Reference Chung and Pullin2009) with
$Q(\unicode[STIX]{x1D705}_{c},d)$
is similar to Voelkl et al. (Reference Voelkl, Pullin and Chan2000), Chung & Pullin (Reference Chung and Pullin2009) with $\unicode[STIX]{x1D705}_{c}=r/\unicode[STIX]{x1D6E5}_{c}$
and
$\unicode[STIX]{x1D705}_{c}=r/\unicode[STIX]{x1D6E5}_{c}$
and $r$
is the distance from the neighbouring point to the vortex axis.
$r$
is the distance from the neighbouring point to the vortex axis.
The stretched-vortex SGS model coupled with the virtual wall model have been together applied to several canonical turbulent flows relevant to the present flow: Chung & Pullin (Reference Chung and Pullin2009) for turbulent channel flow; Inoue & Pullin (Reference Inoue and Pullin2011) for turbulent boundary layer flow at arbitrarily large $Re$
; Inoue et al. (Reference Inoue, Mathis, Marusic and Pullin2012) for combining a predictive-wall model with LES; Inoue et al. (Reference Inoue, Pullin, Harun and Marusic2013) for adverse-pressure turbulent boundary layers; Saito et al. (Reference Saito, Pullin and Inoue2012), Saito & Pullin (Reference Saito and Pullin2014) and Sridhar, Pullin & Cheng (Reference Sridhar, Pullin and Cheng2017) for rough-wall turbulent boundary layers; Cheng et al. (Reference Cheng, Pullin and Samtaney2015) for separated–reattached turbulent boundary layers. However, all the previous works based on this approach are applied to simple canonical geometries. The extension and testing of the models to complex geometries are necessary to pave the way to more engineering applications.
$Re$
; Inoue et al. (Reference Inoue, Mathis, Marusic and Pullin2012) for combining a predictive-wall model with LES; Inoue et al. (Reference Inoue, Pullin, Harun and Marusic2013) for adverse-pressure turbulent boundary layers; Saito et al. (Reference Saito, Pullin and Inoue2012), Saito & Pullin (Reference Saito and Pullin2014) and Sridhar, Pullin & Cheng (Reference Sridhar, Pullin and Cheng2017) for rough-wall turbulent boundary layers; Cheng et al. (Reference Cheng, Pullin and Samtaney2015) for separated–reattached turbulent boundary layers. However, all the previous works based on this approach are applied to simple canonical geometries. The extension and testing of the models to complex geometries are necessary to pave the way to more engineering applications.
4.2 Numerical method
The governing equations (3.4) and (3.5) are discretized as
 $$\begin{eqnarray}\displaystyle \left.\begin{array}{@{}c@{}}\displaystyle \frac{\unicode[STIX]{x1D6FF}\tilde{U} ^{m}}{\unicode[STIX]{x1D6FF}\unicode[STIX]{x1D709}^{m}}=0,\\ \displaystyle \sqrt{g}\frac{\tilde{u} _{i}^{n+1}-\tilde{u} _{i}^{n}}{\unicode[STIX]{x0394}t}=\frac{3}{2}(C_{i}^{n}+S_{i}^{n})-\frac{1}{2}(C_{i}^{n-1}+S_{i}^{n-1})+R_{i}(\,\tilde{p}^{n+1})+D_{i}(\tilde{u} ^{n+1}),\end{array}\right\} & & \displaystyle\end{eqnarray}$$
where $\unicode[STIX]{x1D6FF}/\unicode[STIX]{x1D6FF}\unicode[STIX]{x1D709}^{m}$
represents the energy conservative fourth-order finite difference operator (Morinishi et al.
Reference Morinishi, Lund, Vasilyev and Moin1998),
$\unicode[STIX]{x1D6FF}/\unicode[STIX]{x1D6FF}\unicode[STIX]{x1D709}^{m}$
represents the energy conservative fourth-order finite difference operator (Morinishi et al.
Reference Morinishi, Lund, Vasilyev and Moin1998), $C_{i}$
and
$C_{i}$
and $S_{i}$
represent the convective term and SGS term,
$S_{i}$
represent the convective term and SGS term, $D_{i}$
and
$D_{i}$
and $R_{i}$
are discrete operators for the viscous term and the pressure gradient term, respectively. These quantities are
$R_{i}$
are discrete operators for the viscous term and the pressure gradient term, respectively. These quantities are
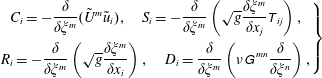 $$\begin{eqnarray}\displaystyle \left.\begin{array}{@{}c@{}}\displaystyle C_{i}=-\frac{\unicode[STIX]{x1D6FF}}{\unicode[STIX]{x1D6FF}\unicode[STIX]{x1D709}^{m}}(\tilde{U} ^{m}\tilde{u} _{i}),\quad S_{i}=-\frac{\unicode[STIX]{x1D6FF}}{\unicode[STIX]{x1D6FF}\unicode[STIX]{x1D709}^{m}}\left(\sqrt{g}\frac{\unicode[STIX]{x1D6FF}\unicode[STIX]{x1D709}^{m}}{\unicode[STIX]{x1D6FF}x_{j}}\unicode[STIX]{x1D61B}_{ij}\right),\\ \displaystyle R_{i}=-\frac{\unicode[STIX]{x1D6FF}}{\unicode[STIX]{x1D6FF}\unicode[STIX]{x1D709}^{m}}\left(\sqrt{g}\frac{\unicode[STIX]{x1D6FF}\unicode[STIX]{x1D709}^{m}}{\unicode[STIX]{x1D6FF}x_{i}}\right),\quad D_{i}=\frac{\unicode[STIX]{x1D6FF}}{\unicode[STIX]{x1D6FF}\unicode[STIX]{x1D709}^{m}}\left(\unicode[STIX]{x1D708}\unicode[STIX]{x1D60E}^{\,mn}\frac{\unicode[STIX]{x1D6FF}}{\unicode[STIX]{x1D6FF}\unicode[STIX]{x1D709}^{n}}\right),\end{array}\right\} & & \displaystyle\end{eqnarray}$$
where the convective term is computed in the skew-symmetric form to minimize the aliasing error (Zang Reference Zang1991; Morinishi et al.
Reference Morinishi, Lund, Vasilyev and Moin1998). The fractional step method (Zang, Street & Koseff Reference Zang, Street and Koseff1994; Zhang et al.
Reference Zhang, Cheng, Gao, Qamar and Samtaney2015) is used to solve the governing equations. This method follows the predictor–corrector procedure, and the pressure Poisson equation is solved using the multigrid method with line-relaxed Gauss–Seidel as a smoother. The code is parallelized using standard MPI-protocol. To achieve near-optimal load balancing, the mesh is divided into blocks of equal size and each of them is assigned to a unique processor. All the simulations are performed on the Shaheen-Cray XC40 at KAUST. The DNS code (without the SGS stress terms) with the same method is described in Zhang et al. (Reference Zhang, Cheng, Gao, Qamar and Samtaney2015) for flow past an airfoil, and is the one used for verification in the low $Re_{c}$
case in the present paper. The WRLES code with the same method was previously applied successfully in flow past smooth and grooved cylinders (Cheng et al.
Reference Cheng, Pullin, Samtaney, Zhang and Gao2017, Reference Cheng, Pullin and Samtaney2018a
).
$Re_{c}$
case in the present paper. The WRLES code with the same method was previously applied successfully in flow past smooth and grooved cylinders (Cheng et al.
Reference Cheng, Pullin, Samtaney, Zhang and Gao2017, Reference Cheng, Pullin and Samtaney2018a
).
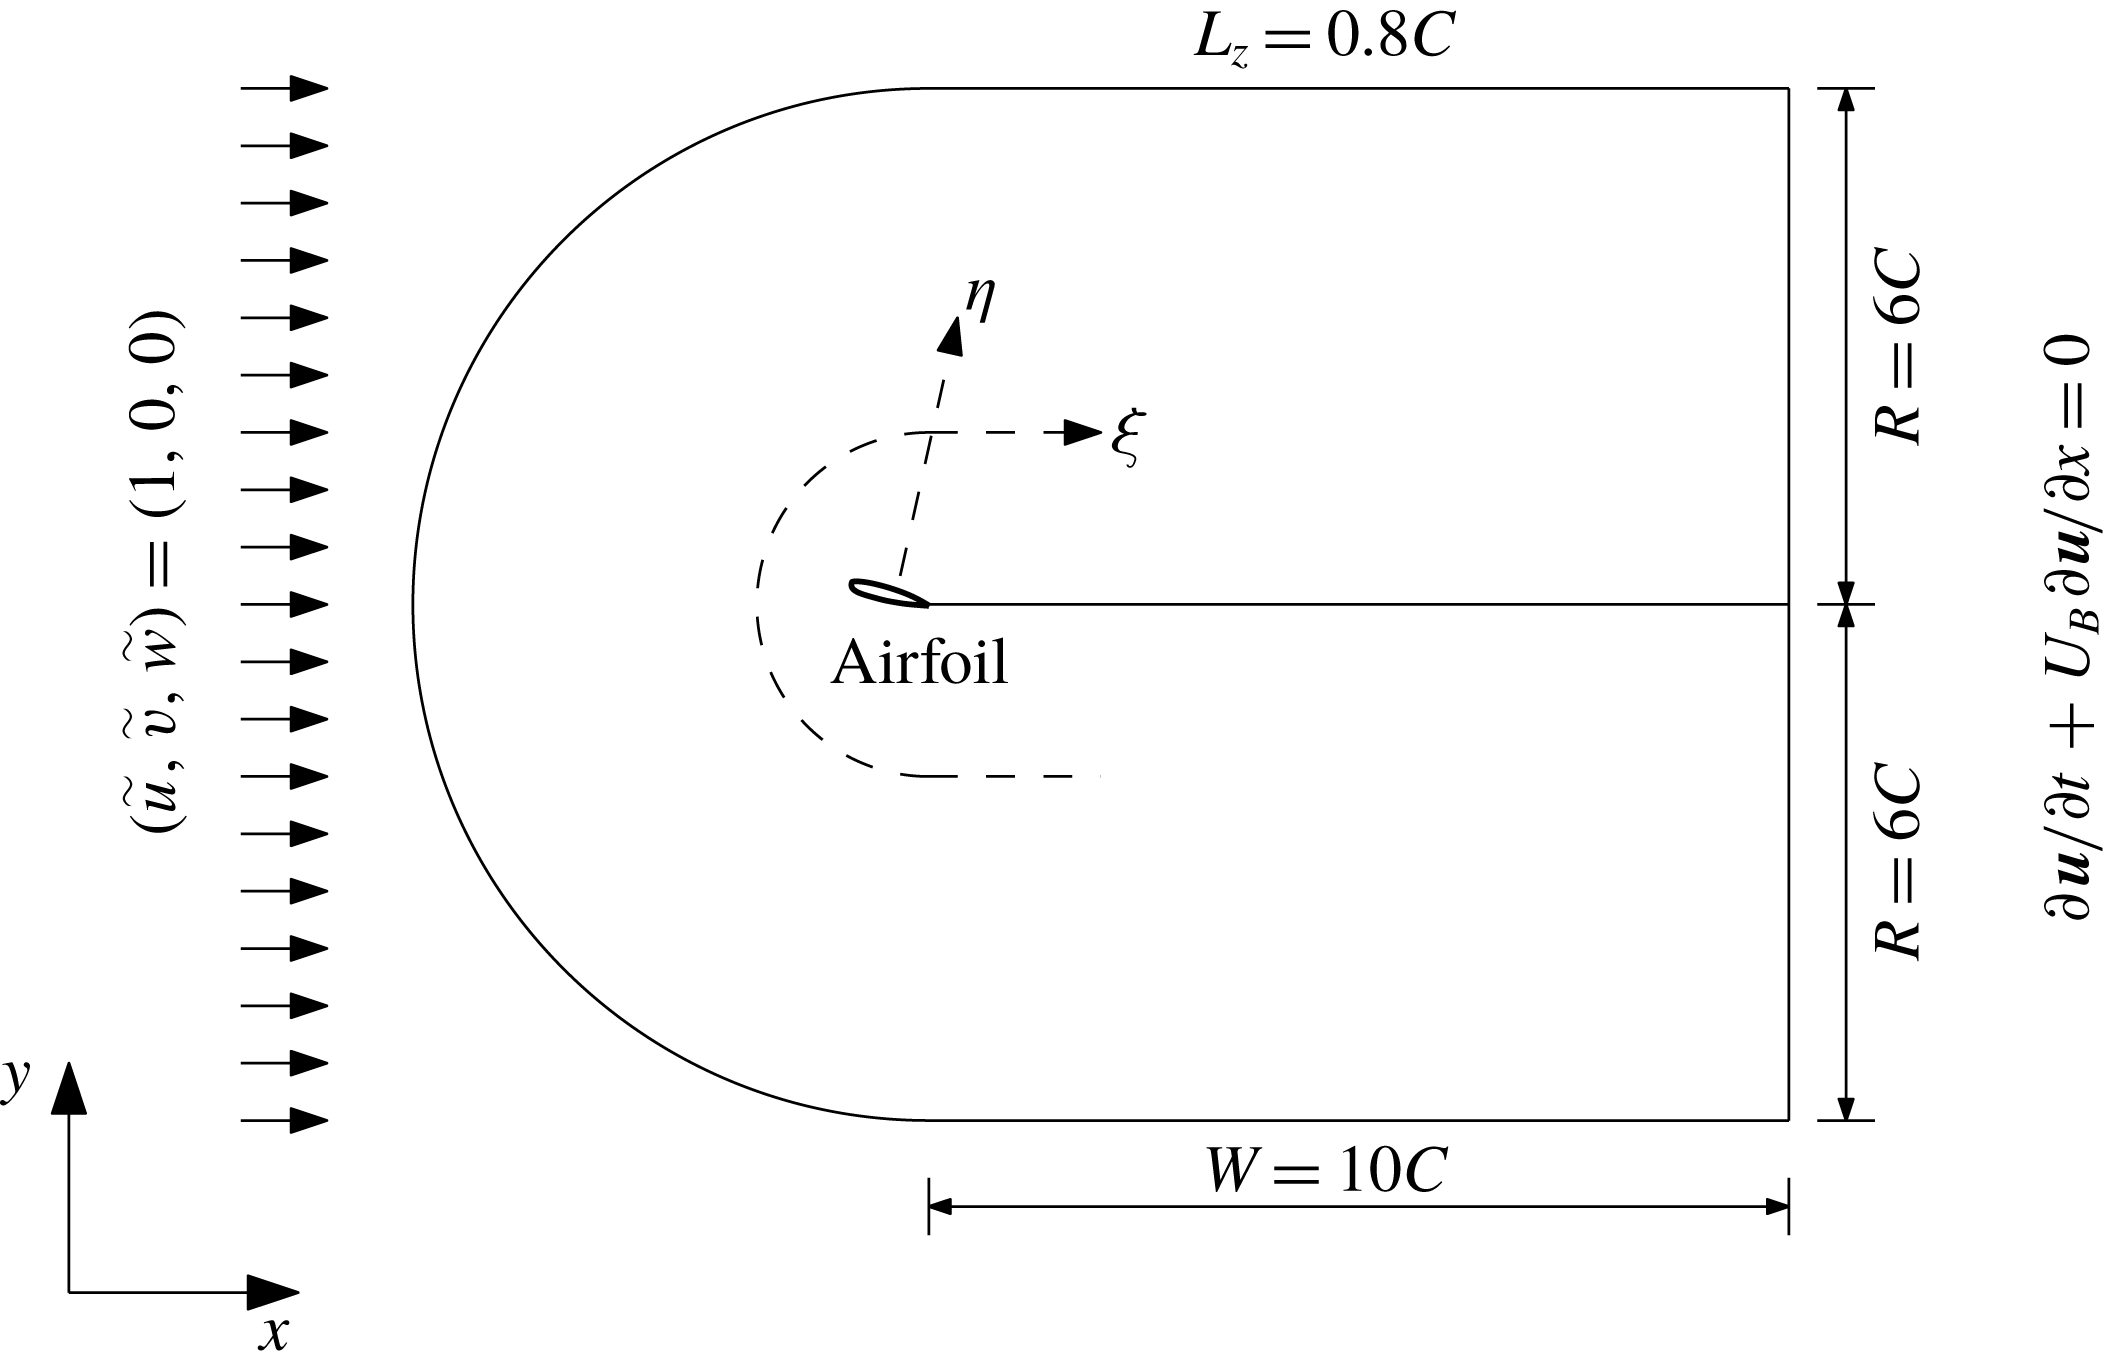
Sketch of the numerical set-up and computational domain.
Summary of the performed numerical cases.

4.3 Numerical set-up
The numerical set-up and domain size are illustrated in figure 3. It should be noted that a sufficiently long spanwise domain size ( $L_{z}$
) is important for the proper development of 3-D turbulent structures, and the associated turbulent statistics. Kitsios et al. (Reference Kitsios, Cordier, Bonnet, Ooi and Soria2011) performed LES of flow past the NACA0015 airfoil at
$L_{z}$
) is important for the proper development of 3-D turbulent structures, and the associated turbulent statistics. Kitsios et al. (Reference Kitsios, Cordier, Bonnet, Ooi and Soria2011) performed LES of flow past the NACA0015 airfoil at $Re_{c}=3\times 10^{4}$
with different
$Re_{c}=3\times 10^{4}$
with different $L_{z}$
and found that
$L_{z}$
and found that $L_{z}=0.66C$
was adequate. It was concluded that the impact of large-scale structures reduces as
$L_{z}=0.66C$
was adequate. It was concluded that the impact of large-scale structures reduces as $Re_{c}$
increases. Zhang & Samtaney (Reference Zhang and Samtaney2016) presented a comprehensive assessment of domain size effects in DNS of flow past the NACA0012 airfoil at
$Re_{c}$
increases. Zhang & Samtaney (Reference Zhang and Samtaney2016) presented a comprehensive assessment of domain size effects in DNS of flow past the NACA0012 airfoil at $Re_{c}=5\times 10^{4}$
, and recommended a spanwise size of
$Re_{c}=5\times 10^{4}$
, and recommended a spanwise size of $L_{z}=0.8C$
. It is found that a smaller
$L_{z}=0.8C$
. It is found that a smaller $L_{z}$
tends to under-predict the turbulent fluctuations near the separation point but over-predict them inside the separation bubble. Presently,
$L_{z}$
tends to under-predict the turbulent fluctuations near the separation point but over-predict them inside the separation bubble. Presently, $L_{z}=0.8C$
is adopted in all the simulations to enforce the correct spanwise periodicity and capture large-scale turbulent structures. It is by far the largest spanwise extent in LES of airfoil flows at high
$L_{z}=0.8C$
is adopted in all the simulations to enforce the correct spanwise periodicity and capture large-scale turbulent structures. It is by far the largest spanwise extent in LES of airfoil flows at high $Re_{c}$
(see table 1).
$Re_{c}$
(see table 1).
For boundary conditions, a uniform flow $(\tilde{u} ,\tilde{v},\tilde{w})=(U_{\infty },0,0)$
,
$(\tilde{u} ,\tilde{v},\tilde{w})=(U_{\infty },0,0)$
, $U_{\infty }=1$
is imposed at the inlet, and the convective boundary condition
$U_{\infty }=1$
is imposed at the inlet, and the convective boundary condition $\unicode[STIX]{x2202}\boldsymbol{u}/\unicode[STIX]{x2202}t+U_{B}\unicode[STIX]{x2202}\boldsymbol{u}/\unicode[STIX]{x2202}x=0$
is used at the outflow plane, where
$\unicode[STIX]{x2202}\boldsymbol{u}/\unicode[STIX]{x2202}t+U_{B}\unicode[STIX]{x2202}\boldsymbol{u}/\unicode[STIX]{x2202}x=0$
is used at the outflow plane, where $U_{B}$
is the bulk velocity. The slip velocity from the wall model is specified at the virtual wall, and the periodic boundary condition is assumed in the spanwise direction.
$U_{B}$
is the bulk velocity. The slip velocity from the wall model is specified at the virtual wall, and the periodic boundary condition is assumed in the spanwise direction.
Three cases as summarized in table 2 are performed to verify and validate the wall model. The low $Re_{c}$
case (NACA0012,
$Re_{c}$
case (NACA0012, $Re_{c}=10^{4}$
,
$Re_{c}=10^{4}$
, $AoA=5^{\circ }$
) is performed with both DNS and WMLES, and the numerical results from DNS are utilized to verify the performance of the wall model at low
$AoA=5^{\circ }$
) is performed with both DNS and WMLES, and the numerical results from DNS are utilized to verify the performance of the wall model at low $Re_{c}$
. To check the effects of mesh resolution on the WMLES, a mesh convergence study of this case with WMLES is presented in appendix C. For the higher Reynolds number cases, DNS becomes computationally prohibitive, and for these cases we compare results from WMLES with experiments with an emphasis on strong validation. This somewhat limits our choice of experiments to those which have presented skin-friction coefficient and Reynolds stress components. The relatively moderate
$Re_{c}$
. To check the effects of mesh resolution on the WMLES, a mesh convergence study of this case with WMLES is presented in appendix C. For the higher Reynolds number cases, DNS becomes computationally prohibitive, and for these cases we compare results from WMLES with experiments with an emphasis on strong validation. This somewhat limits our choice of experiments to those which have presented skin-friction coefficient and Reynolds stress components. The relatively moderate $Re_{c}$
case (NACA0018,
$Re_{c}$
case (NACA0018, $Re_{c}=10^{5}$
,
$Re_{c}=10^{5}$
, $AoA=5^{\circ }$
) is validated with the experimental results from Boutilier & Yarusevych (Reference Boutilier and Yarusevych2012) and Kirk & Yarusevych (Reference Kirk and Yarusevych2017). The Aérospatiale A-airfoil near stall condition (
$AoA=5^{\circ }$
) is validated with the experimental results from Boutilier & Yarusevych (Reference Boutilier and Yarusevych2012) and Kirk & Yarusevych (Reference Kirk and Yarusevych2017). The Aérospatiale A-airfoil near stall condition ( $Re_{c}=2.1\times 10^{6}$
,
$Re_{c}=2.1\times 10^{6}$
, $AoA=13.3^{\circ }$
) is a benchmark case from the Brite-Euram project LESFOIL (Mellen, Frögrave & Rodi Reference Mellen, Frögrave and Rodi2003; Mary & Sagaut Reference Mary and Sagaut2002). This somewhat challenging case has been extensively used to assess RANS and LES models (Schmidt & Thiele Reference Schmidt and Thiele2003; Chaouat Reference Chaouat2006; Kawai & Asada Reference Kawai and Asada2013), and is also for validation in the present paper. In the experiment of the A-airfoil, the boundary layer of the pressure surface is tripped at around
$AoA=13.3^{\circ }$
) is a benchmark case from the Brite-Euram project LESFOIL (Mellen, Frögrave & Rodi Reference Mellen, Frögrave and Rodi2003; Mary & Sagaut Reference Mary and Sagaut2002). This somewhat challenging case has been extensively used to assess RANS and LES models (Schmidt & Thiele Reference Schmidt and Thiele2003; Chaouat Reference Chaouat2006; Kawai & Asada Reference Kawai and Asada2013), and is also for validation in the present paper. In the experiment of the A-airfoil, the boundary layer of the pressure surface is tripped at around $x/C=0.3$
(Dahlstrom & Davidson Reference Dahlstrom and Davidson2001). These trips, whose height is smaller than the first wall-adjacent grid spacing, are not included in the our simulations. The numerical noise would act as the perturbation source, and allow natural transition to turbulence. This choice is same as Park & Moin (Reference Park and Moin2014) in WMLES of the NACA4412 airfoil at
$x/C=0.3$
(Dahlstrom & Davidson Reference Dahlstrom and Davidson2001). These trips, whose height is smaller than the first wall-adjacent grid spacing, are not included in the our simulations. The numerical noise would act as the perturbation source, and allow natural transition to turbulence. This choice is same as Park & Moin (Reference Park and Moin2014) in WMLES of the NACA4412 airfoil at $Re_{c}=1.64\times 10^{6}$
, in which reasonable prediction of transition onset was reported without special treatment of the boundary layer trips.
$Re_{c}=1.64\times 10^{6}$
, in which reasonable prediction of transition onset was reported without special treatment of the boundary layer trips.
5 Verification and validation
In this section, we provide verification of one case ( $Re_{c}=10^{4}$
) with DNS, and then strong validation of the larger
$Re_{c}=10^{4}$
) with DNS, and then strong validation of the larger $Re_{c}$
cases against experimental results.
$Re_{c}$
cases against experimental results.
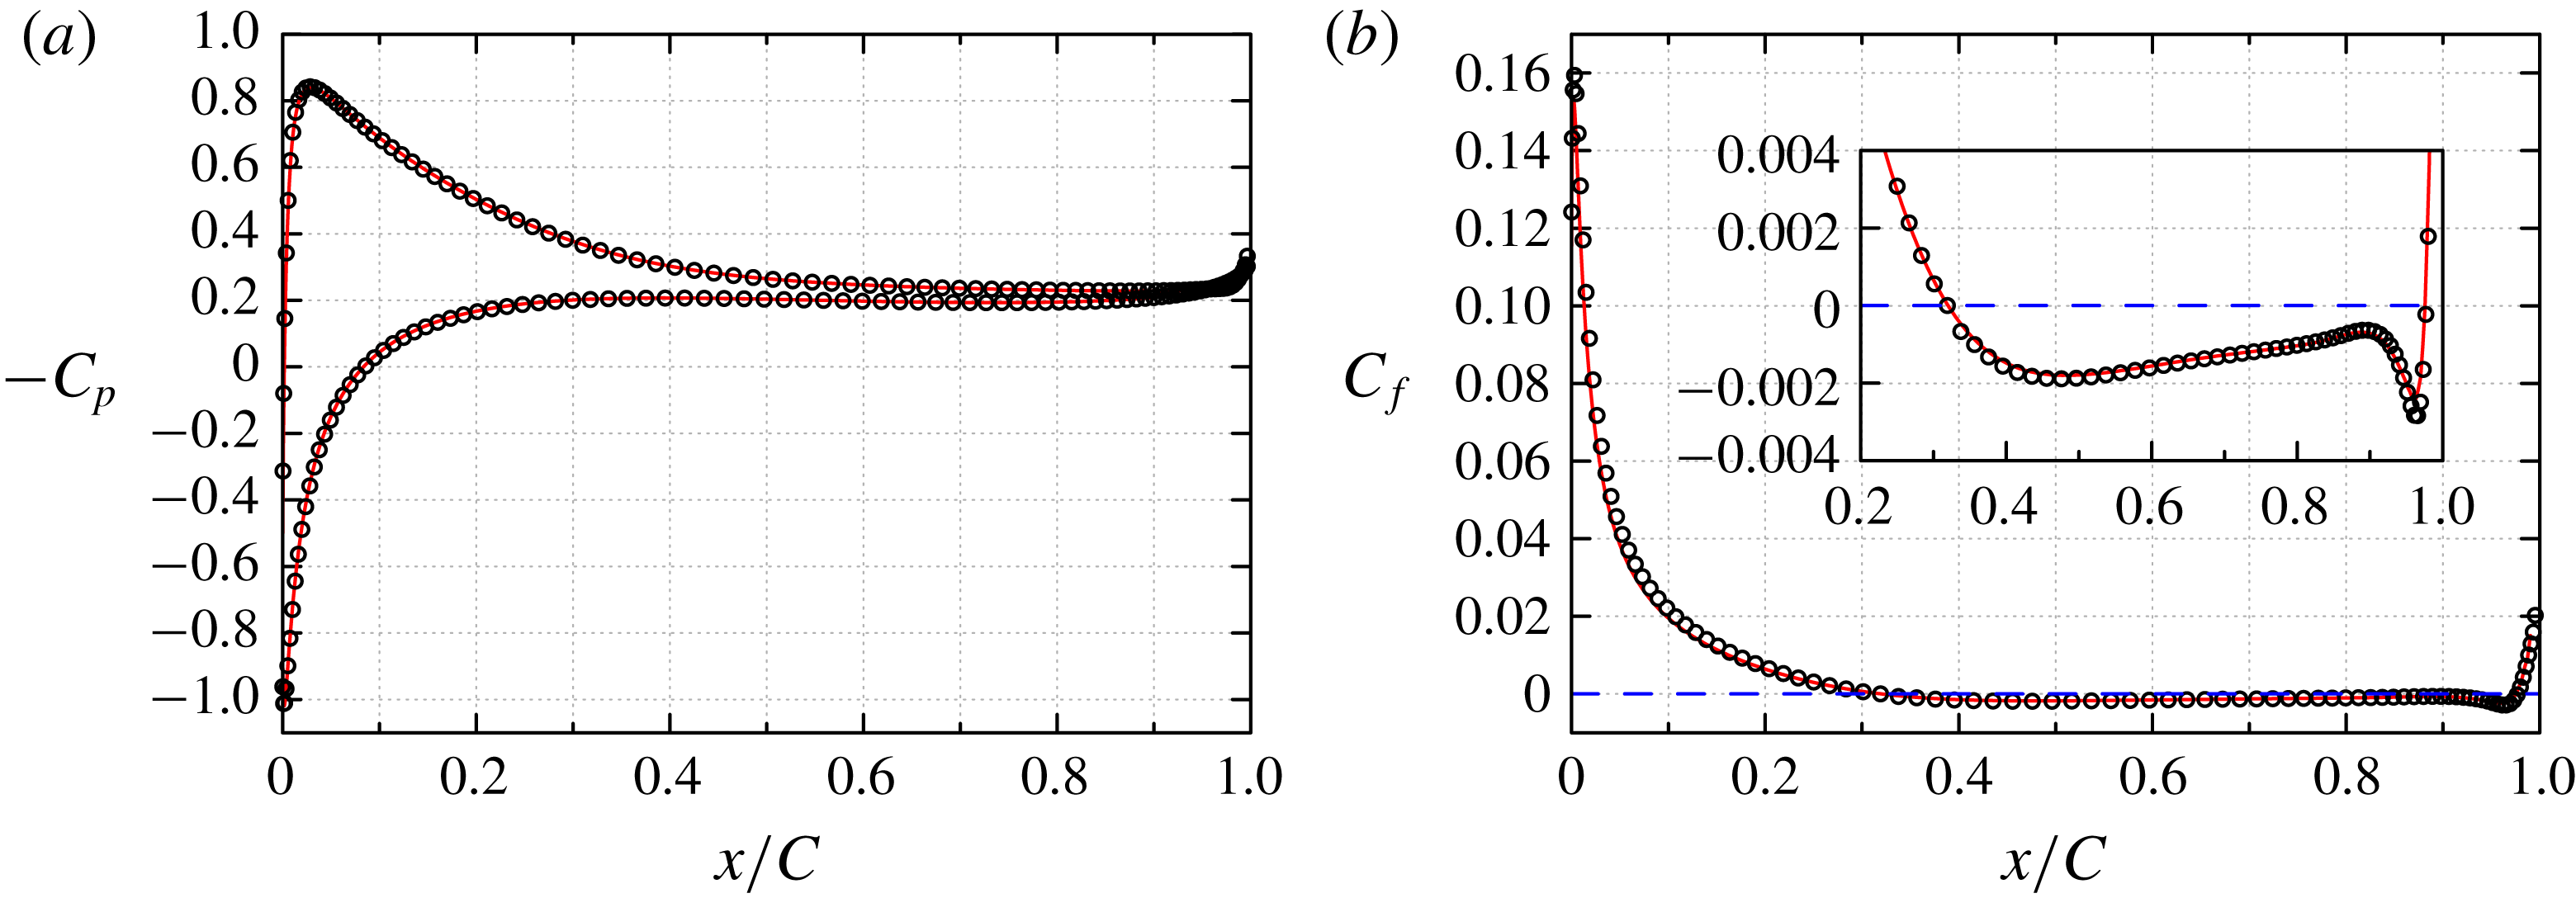
NACA0012, $Re_{c}=10^{4}$
. (a) Distribution of the pressure coefficient
$Re_{c}=10^{4}$
. (a) Distribution of the pressure coefficient $C_{p}$
around the airfoil, and (b) skin-friction coefficient
$C_{p}$
around the airfoil, and (b) skin-friction coefficient $C_{f}$
on the suction surface. ——, present DNS; ○, present WMLES. The - - - - line
$C_{f}$
on the suction surface. ——, present DNS; ○, present WMLES. The - - - - line $C_{f}=0$
is shown for convenience: zero crossing of this line indicates separation and reattachment.
$C_{f}=0$
is shown for convenience: zero crossing of this line indicates separation and reattachment.
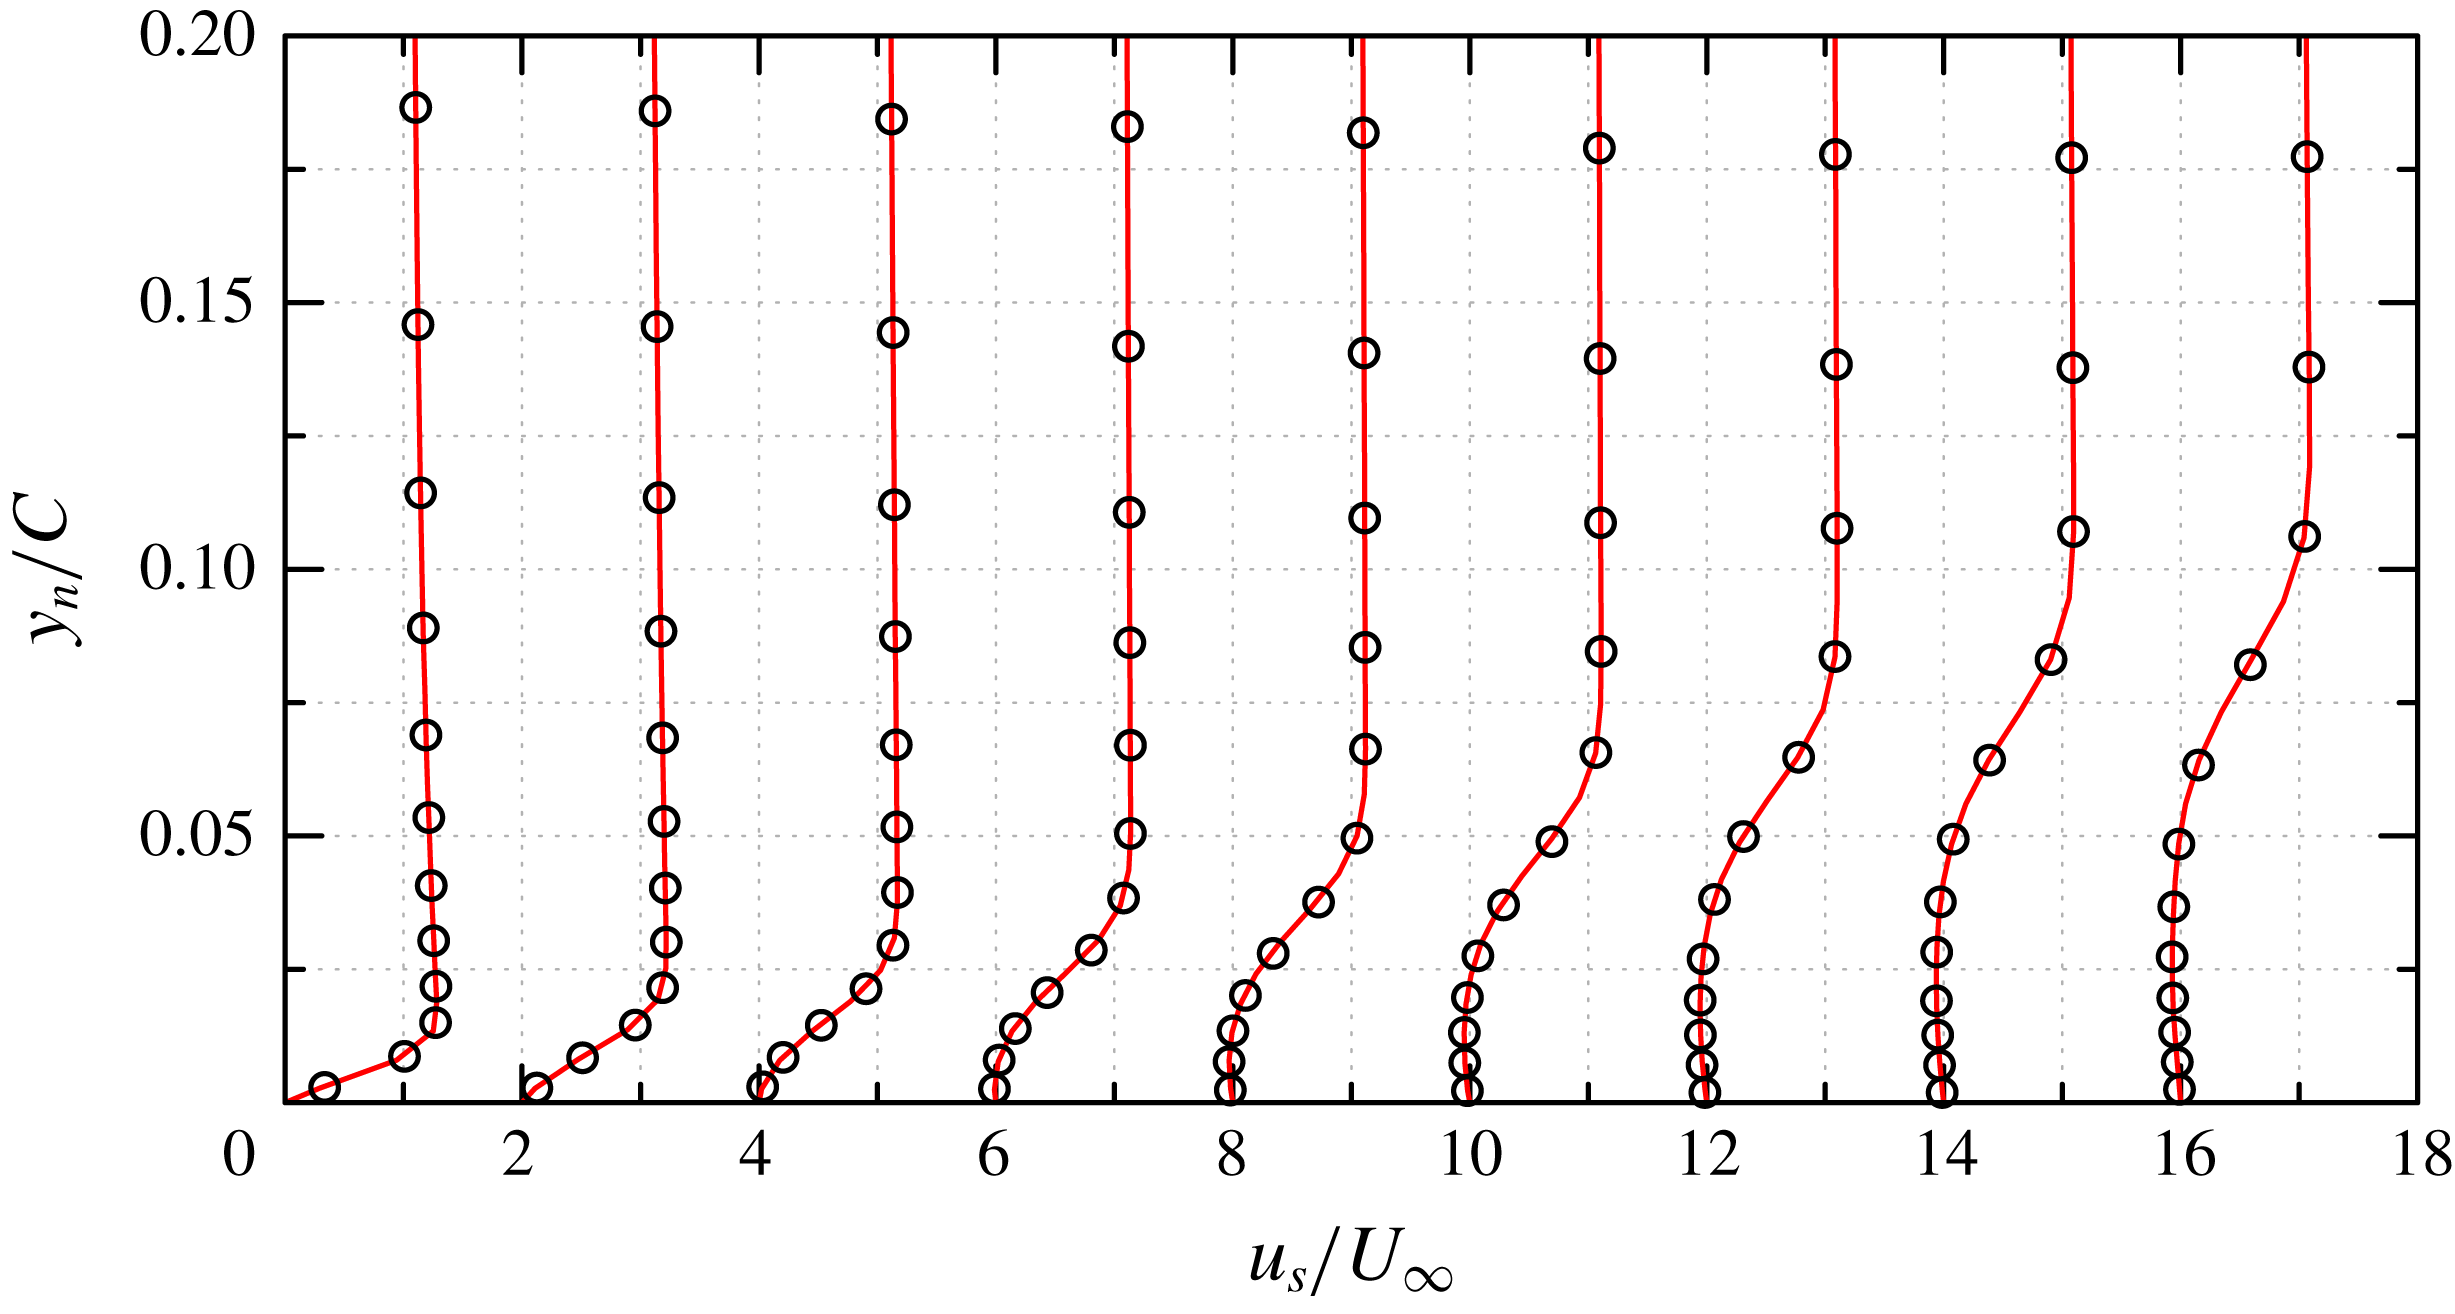
NACA0012, $Re_{c}=10^{4}$
. The mean streamwise velocity profiles along the wall-normal lines at nine locations. From left to right,
$Re_{c}=10^{4}$
. The mean streamwise velocity profiles along the wall-normal lines at nine locations. From left to right, $x/C=0.1{-}0.9$
with equal distances of 0.1. The plots are shifted by
$x/C=0.1{-}0.9$
with equal distances of 0.1. The plots are shifted by $0,2,\ldots ,16$
for clarity. ——, present DNS; ○, present WMLES.
$0,2,\ldots ,16$
for clarity. ——, present DNS; ○, present WMLES.
NACA0012, $Re_{c}=10^{4}$
. Distribution of the time- and spanwise-averaged Reynolds stress
$Re_{c}=10^{4}$
. Distribution of the time- and spanwise-averaged Reynolds stress $-\overline{u^{\prime }v^{\prime }}/U_{\infty }^{2}=[0.001,0.06]$
: (a) DNS result, and (b) present WMLES result. The transition onset is indicated by the threshold value 0.001.
$-\overline{u^{\prime }v^{\prime }}/U_{\infty }^{2}=[0.001,0.06]$
: (a) DNS result, and (b) present WMLES result. The transition onset is indicated by the threshold value 0.001.

5.1 Comparison between DNS and WMLES:
$Re_{c}=10^{4}$

The time- and spanwise-averaged pressure coefficient ( $C_{p}$
) and skin-friction coefficient (
$C_{p}$
) and skin-friction coefficient ( $C_{f}$
) are computed as
$C_{f}$
) are computed as
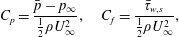 $$\begin{eqnarray}\displaystyle C_{p}=\frac{\bar{p}-p_{\infty }}{\frac{1}{2}\unicode[STIX]{x1D70C}U_{\infty }^{2}},\quad C_{f}=\frac{\bar{\unicode[STIX]{x1D70F}}_{w,s}}{\frac{1}{2}\unicode[STIX]{x1D70C}U_{\infty }^{2}}, & & \displaystyle\end{eqnarray}$$
where $\bar{p}$
and
$\bar{p}$
and $\bar{\unicode[STIX]{x1D70F}}_{w,s}$
are the time- and spanwise-averaged wall pressure and streamwise wall shear stress,
$\bar{\unicode[STIX]{x1D70F}}_{w,s}$
are the time- and spanwise-averaged wall pressure and streamwise wall shear stress, $p_{\infty }$
is the reference pressure taken at the outlet boundary. The
$p_{\infty }$
is the reference pressure taken at the outlet boundary. The $C_{p}$
and
$C_{p}$
and $C_{f}$
for this NACA0012 case are shown in figure 4. The present WMLES results compare well with the DNS results with negligible difference. The skin-friction coefficient profile indicates separation and reattachment at
$C_{f}$
for this NACA0012 case are shown in figure 4. The present WMLES results compare well with the DNS results with negligible difference. The skin-friction coefficient profile indicates separation and reattachment at $x/C=0.32$
and
$x/C=0.32$
and $x/C=0.98$
, respectively. The streamwise mean velocity profiles at nine locations along the suction surface (
$x/C=0.98$
, respectively. The streamwise mean velocity profiles at nine locations along the suction surface ( $x/C=0.1{-}0.9$
with equal distances of
$x/C=0.1{-}0.9$
with equal distances of $0.1$
) are shown in figure 5. The present WMLES results indicate that its prediction of both separation and reattachment are in good agreement with that of the DNS predictions.
$0.1$
) are shown in figure 5. The present WMLES results indicate that its prediction of both separation and reattachment are in good agreement with that of the DNS predictions.
Colour contours of time- and spanwise-averaged off-diagonal Reynolds stress $-\overline{u^{\prime }v^{\prime }}/U_{0}^{2}$
within the range
$-\overline{u^{\prime }v^{\prime }}/U_{0}^{2}$
within the range $[0.001,0.06]$
superimposed on average streamline contours are shown in figure 6. Here the threshold value of
$[0.001,0.06]$
superimposed on average streamline contours are shown in figure 6. Here the threshold value of $0.001$
is chosen as an indicator for transition onset, which is commonly used in various numerical (Zhou & Wang Reference Zhou and Wang2012) and experimental investigations (Buchmannand, Atkinson & Soria Reference Buchmannand, Atkinson and Soria2013) of flow past bluff bodies. The transition onset occurs near the trailing edge, i.e.
$0.001$
is chosen as an indicator for transition onset, which is commonly used in various numerical (Zhou & Wang Reference Zhou and Wang2012) and experimental investigations (Buchmannand, Atkinson & Soria Reference Buchmannand, Atkinson and Soria2013) of flow past bluff bodies. The transition onset occurs near the trailing edge, i.e. $x/C=0.92$
and
$x/C=0.92$
and $x/C=0.91$
for DNS and WMLES, respectively.
$x/C=0.91$
for DNS and WMLES, respectively.
5.2 Validation of WMLES:
$Re_{c}=10^{5}$

NACA0018, $Re_{c}=10^{5}$
. (a) Distribution of the pressure coefficient
$Re_{c}=10^{5}$
. (a) Distribution of the pressure coefficient $C_{p}$
, and (b) skin-friction coefficient
$C_{p}$
, and (b) skin-friction coefficient $C_{f}$
around the airfoil. ○, experimental data from Kirk & Yarusevych (Reference Kirk and Yarusevych2017); ——, corresponding results from the present WMLES; — ⋅ —,
$C_{f}$
around the airfoil. ○, experimental data from Kirk & Yarusevych (Reference Kirk and Yarusevych2017); ——, corresponding results from the present WMLES; — ⋅ —, $C_{f}$
on the pressure side from the present WMLES. The - - - - line
$C_{f}$
on the pressure side from the present WMLES. The - - - - line $C_{f}=0$
is shown for convenience: zero crossing of this line indicates separation and reattachment. The experimental values of the separation and reattachment point on the suction side are estimated to be located at
$C_{f}=0$
is shown for convenience: zero crossing of this line indicates separation and reattachment. The experimental values of the separation and reattachment point on the suction side are estimated to be located at $x/C=0.24\pm 0.02,0.52\pm 0.02$
, respectively (Kirk & Yarusevych Reference Kirk and Yarusevych2017).
$x/C=0.24\pm 0.02,0.52\pm 0.02$
, respectively (Kirk & Yarusevych Reference Kirk and Yarusevych2017).

NACA0018, $Re_{c}=10^{5}$
. The mean velocity profiles in the
$Re_{c}=10^{5}$
. The mean velocity profiles in the $x$
-direction,
$x$
-direction, $u$
along the vertical lines at different locations of the suction side. From left to right, (a)
$u$
along the vertical lines at different locations of the suction side. From left to right, (a) $x/\bar{C}=0.2{-}0.48$
with equal distances of
$x/\bar{C}=0.2{-}0.48$
with equal distances of $0.02$
, shifted by
$0.02$
, shifted by $0,2,\ldots ,28$
; (b)
$0,2,\ldots ,28$
; (b) $x/\bar{C}=0.50,0.52,0.54,0.56,0.60,0.66,0.73,0.87$
, shifted by
$x/\bar{C}=0.50,0.52,0.54,0.56,0.60,0.66,0.73,0.87$
, shifted by $0,2,\ldots ,14$
. ——, present WMLES; ○, experimental data from Kirk & Yarusevych (Reference Kirk and Yarusevych2017) and Boutilier & Yarusevych (Reference Boutilier and Yarusevych2012).
$0,2,\ldots ,14$
. ——, present WMLES; ○, experimental data from Kirk & Yarusevych (Reference Kirk and Yarusevych2017) and Boutilier & Yarusevych (Reference Boutilier and Yarusevych2012).

The pressure coefficient $C_{p}$
and skin-friction coefficient
$C_{p}$
and skin-friction coefficient $C_{f}$
for the NACA0018 case are shown in figure 7. The WMLES
$C_{f}$
for the NACA0018 case are shown in figure 7. The WMLES $C_{p}$
results compare well with the experiment. The separation and reattachment on the pressure side occur at
$C_{p}$
results compare well with the experiment. The separation and reattachment on the pressure side occur at $x/C=0.67,0.99$
, and
$x/C=0.67,0.99$
, and $x/C=0.21,0.45$
on the suction side. In the experiment by Kirk & Yarusevych (Reference Kirk and Yarusevych2017), the separation and reattachment points on the suction side are estimated to be located at
$x/C=0.21,0.45$
on the suction side. In the experiment by Kirk & Yarusevych (Reference Kirk and Yarusevych2017), the separation and reattachment points on the suction side are estimated to be located at $x/C=0.24\pm 0.02,0.52\pm 0.02$
: these are inferred indirectly from the pressure distributions – a flat distribution is expected within the recirculating region. The trailing edge separation on the pressure side is not investigated in the experimental research, however, our WMLES predicts a trailing edge separation on the pressure side, in qualitative agreement with another experiment by Nakano et al. (Reference Nakano, Fujisawa and Lee2006) with the same airfoil geometry but slightly different
$x/C=0.24\pm 0.02,0.52\pm 0.02$
: these are inferred indirectly from the pressure distributions – a flat distribution is expected within the recirculating region. The trailing edge separation on the pressure side is not investigated in the experimental research, however, our WMLES predicts a trailing edge separation on the pressure side, in qualitative agreement with another experiment by Nakano et al. (Reference Nakano, Fujisawa and Lee2006) with the same airfoil geometry but slightly different $Re_{c}(=1.6\times 10^{5})$
and
$Re_{c}(=1.6\times 10^{5})$
and $AoA(=6^{\circ })$
.
$AoA(=6^{\circ })$
.
NACA0018, $Re_{c}=10^{5}$
. The Reynolds stress profiles,
$Re_{c}=10^{5}$
. The Reynolds stress profiles, $\sqrt{\overline{u^{\prime }u^{\prime }}}/U_{\infty }$
along the vertical lines at different locations of the suction side. From left to right, (a)
$\sqrt{\overline{u^{\prime }u^{\prime }}}/U_{\infty }$
along the vertical lines at different locations of the suction side. From left to right, (a) $x/\bar{C}=0.2{-}0.48$
with equal distances of
$x/\bar{C}=0.2{-}0.48$
with equal distances of $0.02$
, shifted by
$0.02$
, shifted by $0,0.3,\ldots ,4.2$
; (b)
$0,0.3,\ldots ,4.2$
; (b) $x/\bar{C}=0.50,0.52,0.54,0.56,0.60,0.66,0.73,0.87$
, shifted by
$x/\bar{C}=0.50,0.52,0.54,0.56,0.60,0.66,0.73,0.87$
, shifted by $0,0.3,\ldots ,2.1$
. ——, present WMLES; ○, experimental data from Kirk & Yarusevych (Reference Kirk and Yarusevych2017) and Boutilier & Yarusevych (Reference Boutilier and Yarusevych2012).
$0,0.3,\ldots ,2.1$
. ——, present WMLES; ○, experimental data from Kirk & Yarusevych (Reference Kirk and Yarusevych2017) and Boutilier & Yarusevych (Reference Boutilier and Yarusevych2012).
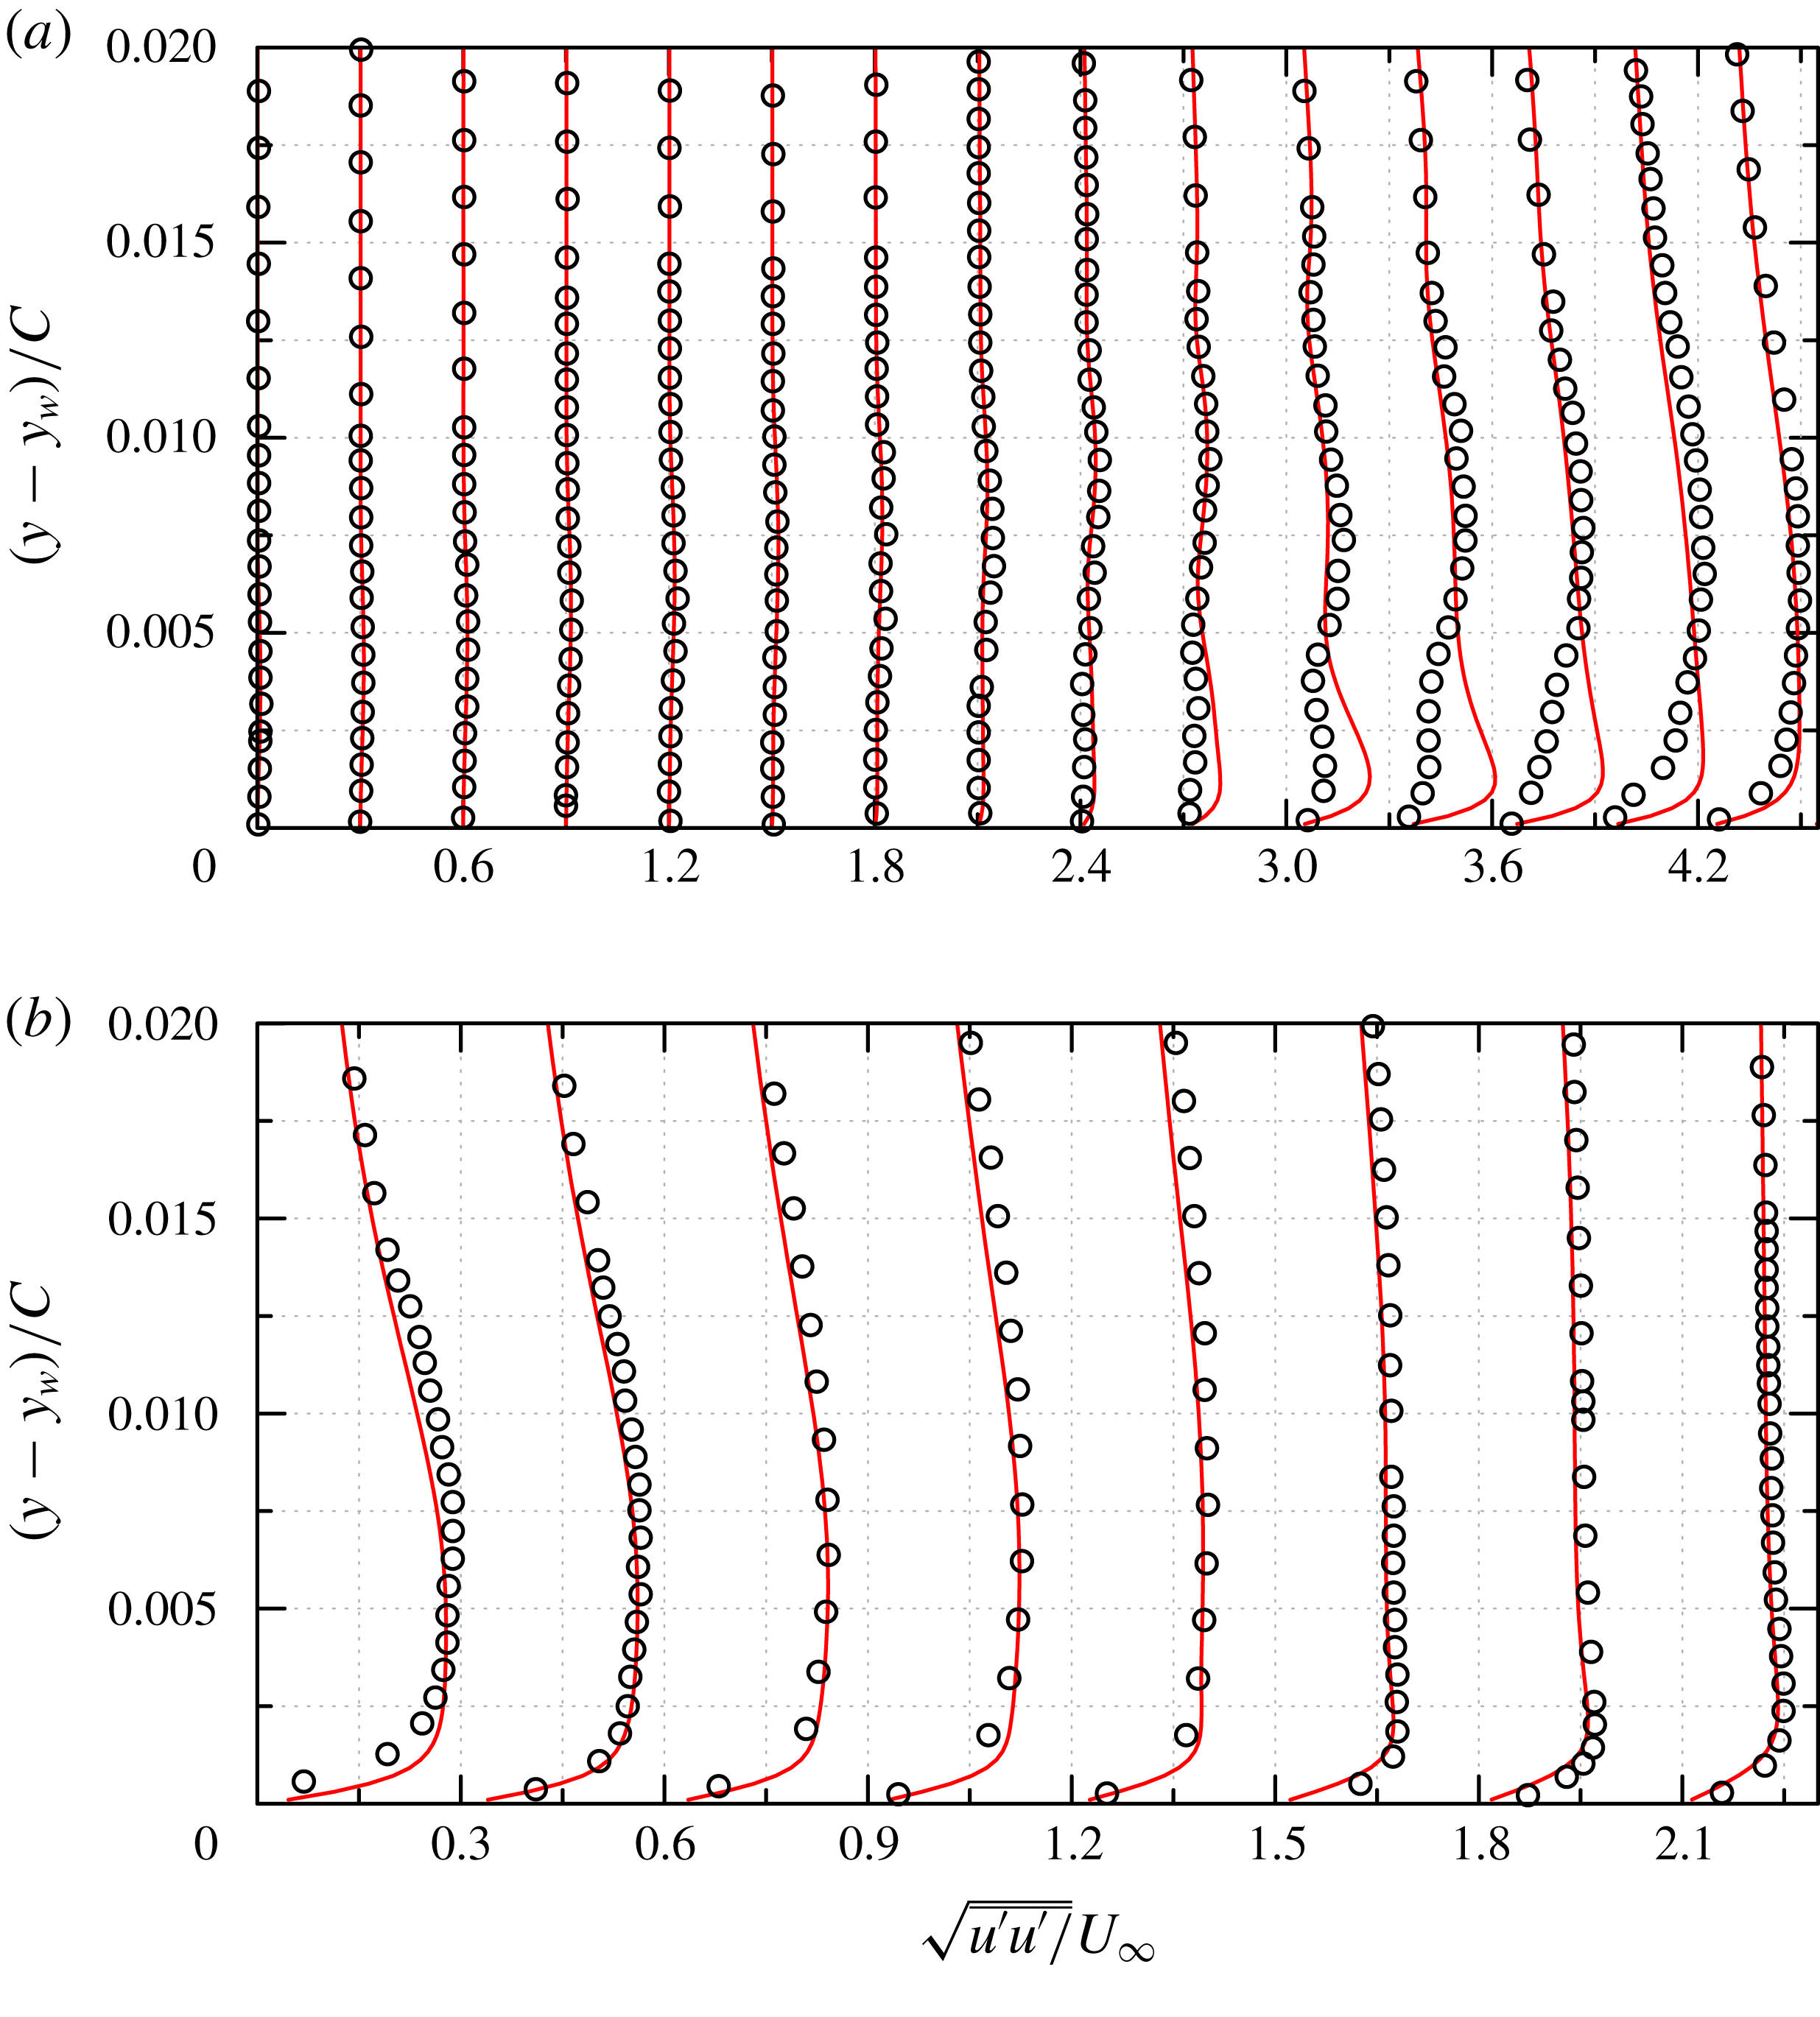
The mean velocity profiles in the $x$
-direction at different locations along the suction surface (
$x$
-direction at different locations along the suction surface ( $x/\bar{C}=0.2{-}0.48$
with equal distances of
$x/\bar{C}=0.2{-}0.48$
with equal distances of $0.02$
) are shown in figure 8(a), here
$0.02$
) are shown in figure 8(a), here $\bar{C}$
is the
$\bar{C}$
is the $x$
-axis projection of the chord length. The mean velocity profiles in the attached zone, i.e.
$x$
-axis projection of the chord length. The mean velocity profiles in the attached zone, i.e. $x/\bar{C}=0.50,0.52,0.54,0.56,0.60,0.66,0.73,0.87$
are shown in figure 8(b). Good agreement between our WMLES results and the experiment is noted.
$x/\bar{C}=0.50,0.52,0.54,0.56,0.60,0.66,0.73,0.87$
are shown in figure 8(b). Good agreement between our WMLES results and the experiment is noted.
The Reynolds stress component, $\sqrt{\overline{u^{\prime }u^{\prime }}}/U_{\infty }$
, on the suction side is shown in figure 9, at the same locations as the mean velocity profiles. The LES results match quite well with the experimental data in the range of
$\sqrt{\overline{u^{\prime }u^{\prime }}}/U_{\infty }$
, on the suction side is shown in figure 9, at the same locations as the mean velocity profiles. The LES results match quite well with the experimental data in the range of $[0.2,0.38]$
and
$[0.2,0.38]$
and $[0.5,0.87]$
. We note difference between LES and experiments in the range of
$[0.5,0.87]$
. We note difference between LES and experiments in the range of $[0.38,0.48]$
, close to the reattachment point. It should be emphasized that both the present LES and experiments in this range show a sharp drop in pressure coefficient distributions (see figure 7
a). This sharp drop may be explained by examining the LES results in detail: it is attributed to a separation bubble connected by turbulent transition as observed in the skin-friction plot in figure 7(b). It is reported in the experiment by Kirk & Yarusevych (Reference Kirk and Yarusevych2017) that the onset of turbulent transition occurs at
$[0.38,0.48]$
, close to the reattachment point. It should be emphasized that both the present LES and experiments in this range show a sharp drop in pressure coefficient distributions (see figure 7
a). This sharp drop may be explained by examining the LES results in detail: it is attributed to a separation bubble connected by turbulent transition as observed in the skin-friction plot in figure 7(b). It is reported in the experiment by Kirk & Yarusevych (Reference Kirk and Yarusevych2017) that the onset of turbulent transition occurs at $x/C=0.44\pm 0.02$
, discerned from the dip in the
$x/C=0.44\pm 0.02$
, discerned from the dip in the $C_{p}$
-profile. The WMLES shows larger fluctuations at locations
$C_{p}$
-profile. The WMLES shows larger fluctuations at locations $x/C\in [0.38,0.48]$
in comparison with the experiment, and the source of this difference remains to be explored further.
$x/C\in [0.38,0.48]$
in comparison with the experiment, and the source of this difference remains to be explored further.
5.3 Validation of WMLES: high
$Re_{c}$
case,
$Re_{c}=2.1\times 10^{6}$


The time- and spanwise-averaged $C_{f}$
and
$C_{f}$
and $C_{p}$
for the high Reynolds number case of the A-airfoil are shown in figure 10 for the present WMLES, the experiment by Gleyzes (Reference Gleyzes1988) and also WRLES results by Mary & Sagaut (Reference Mary and Sagaut2002) and Asada & Kawai (Reference Asada and Kawai2018). The pressure coefficient compares well with the experiment, and the separation near the trailing edge, as indicated by
$C_{p}$
for the high Reynolds number case of the A-airfoil are shown in figure 10 for the present WMLES, the experiment by Gleyzes (Reference Gleyzes1988) and also WRLES results by Mary & Sagaut (Reference Mary and Sagaut2002) and Asada & Kawai (Reference Asada and Kawai2018). The pressure coefficient compares well with the experiment, and the separation near the trailing edge, as indicated by $C_{f}$
-plot (see figure 10
b), is also well captured by the present WMLES. The trailing edge separation occurs at approximately
$C_{f}$
-plot (see figure 10
b), is also well captured by the present WMLES. The trailing edge separation occurs at approximately $x/\bar{C}=0.90$
compared with the experimental observation (
$x/\bar{C}=0.90$
compared with the experimental observation ( $x/\bar{C}\approx 0.82$
) (Gleyzes Reference Gleyzes1988). In the experiment a tiny separation bubble close to the leading edge, which reattaches at
$x/\bar{C}\approx 0.82$
) (Gleyzes Reference Gleyzes1988). In the experiment a tiny separation bubble close to the leading edge, which reattaches at $x/\bar{C}=0.12$
is observed. In the present WMLES, although instantaneous velocity contours clearly show a local reversal flow in this region, the time- and spanwise-averaged
$x/\bar{C}=0.12$
is observed. In the present WMLES, although instantaneous velocity contours clearly show a local reversal flow in this region, the time- and spanwise-averaged $C_{f}$
does not capture this tiny separation bubble.
$C_{f}$
does not capture this tiny separation bubble.
The streamwise mean velocity profiles on the suction side are shown in figure 11. The flow reversal in the separation zone ( $x/\bar{C}=0.93,0.99$
) is well captured by the WMLES. The Reynolds stress profiles corresponding to the root mean square (r.m.s.) streamwise fluctuations, wall-normal fluctuations and off-diagonal terms are shown in figure 12. Overall the WMLES predicted values of the Reynolds stress components are in general agreement and follow the trends in the experimental data.
$x/\bar{C}=0.93,0.99$
) is well captured by the WMLES. The Reynolds stress profiles corresponding to the root mean square (r.m.s.) streamwise fluctuations, wall-normal fluctuations and off-diagonal terms are shown in figure 12. Overall the WMLES predicted values of the Reynolds stress components are in general agreement and follow the trends in the experimental data.
Aérospatiale A-airfoil, $Re_{c}=2.1\times 10^{6}$
. (a) Distribution of the pressure coefficient
$Re_{c}=2.1\times 10^{6}$
. (a) Distribution of the pressure coefficient $C_{p}$
, and (b) skin-friction coefficient
$C_{p}$
, and (b) skin-friction coefficient $C_{f}$
on the suction surface. ○, experimental data from Gleyzes (Reference Gleyzes1988);
$C_{f}$
on the suction surface. ○, experimental data from Gleyzes (Reference Gleyzes1988); $\times$
, WRLES from Mary & Sagaut (Reference Mary and Sagaut2002);
$\times$
, WRLES from Mary & Sagaut (Reference Mary and Sagaut2002); $+$
, WRLES from Asada & Kawai (Reference Asada and Kawai2018); ——, present WMLES. The - - - - line
$+$
, WRLES from Asada & Kawai (Reference Asada and Kawai2018); ——, present WMLES. The - - - - line $C_{f}=0$
is shown for convenience: zero crossing of this line indicates separation and reattachment.
$C_{f}=0$
is shown for convenience: zero crossing of this line indicates separation and reattachment.
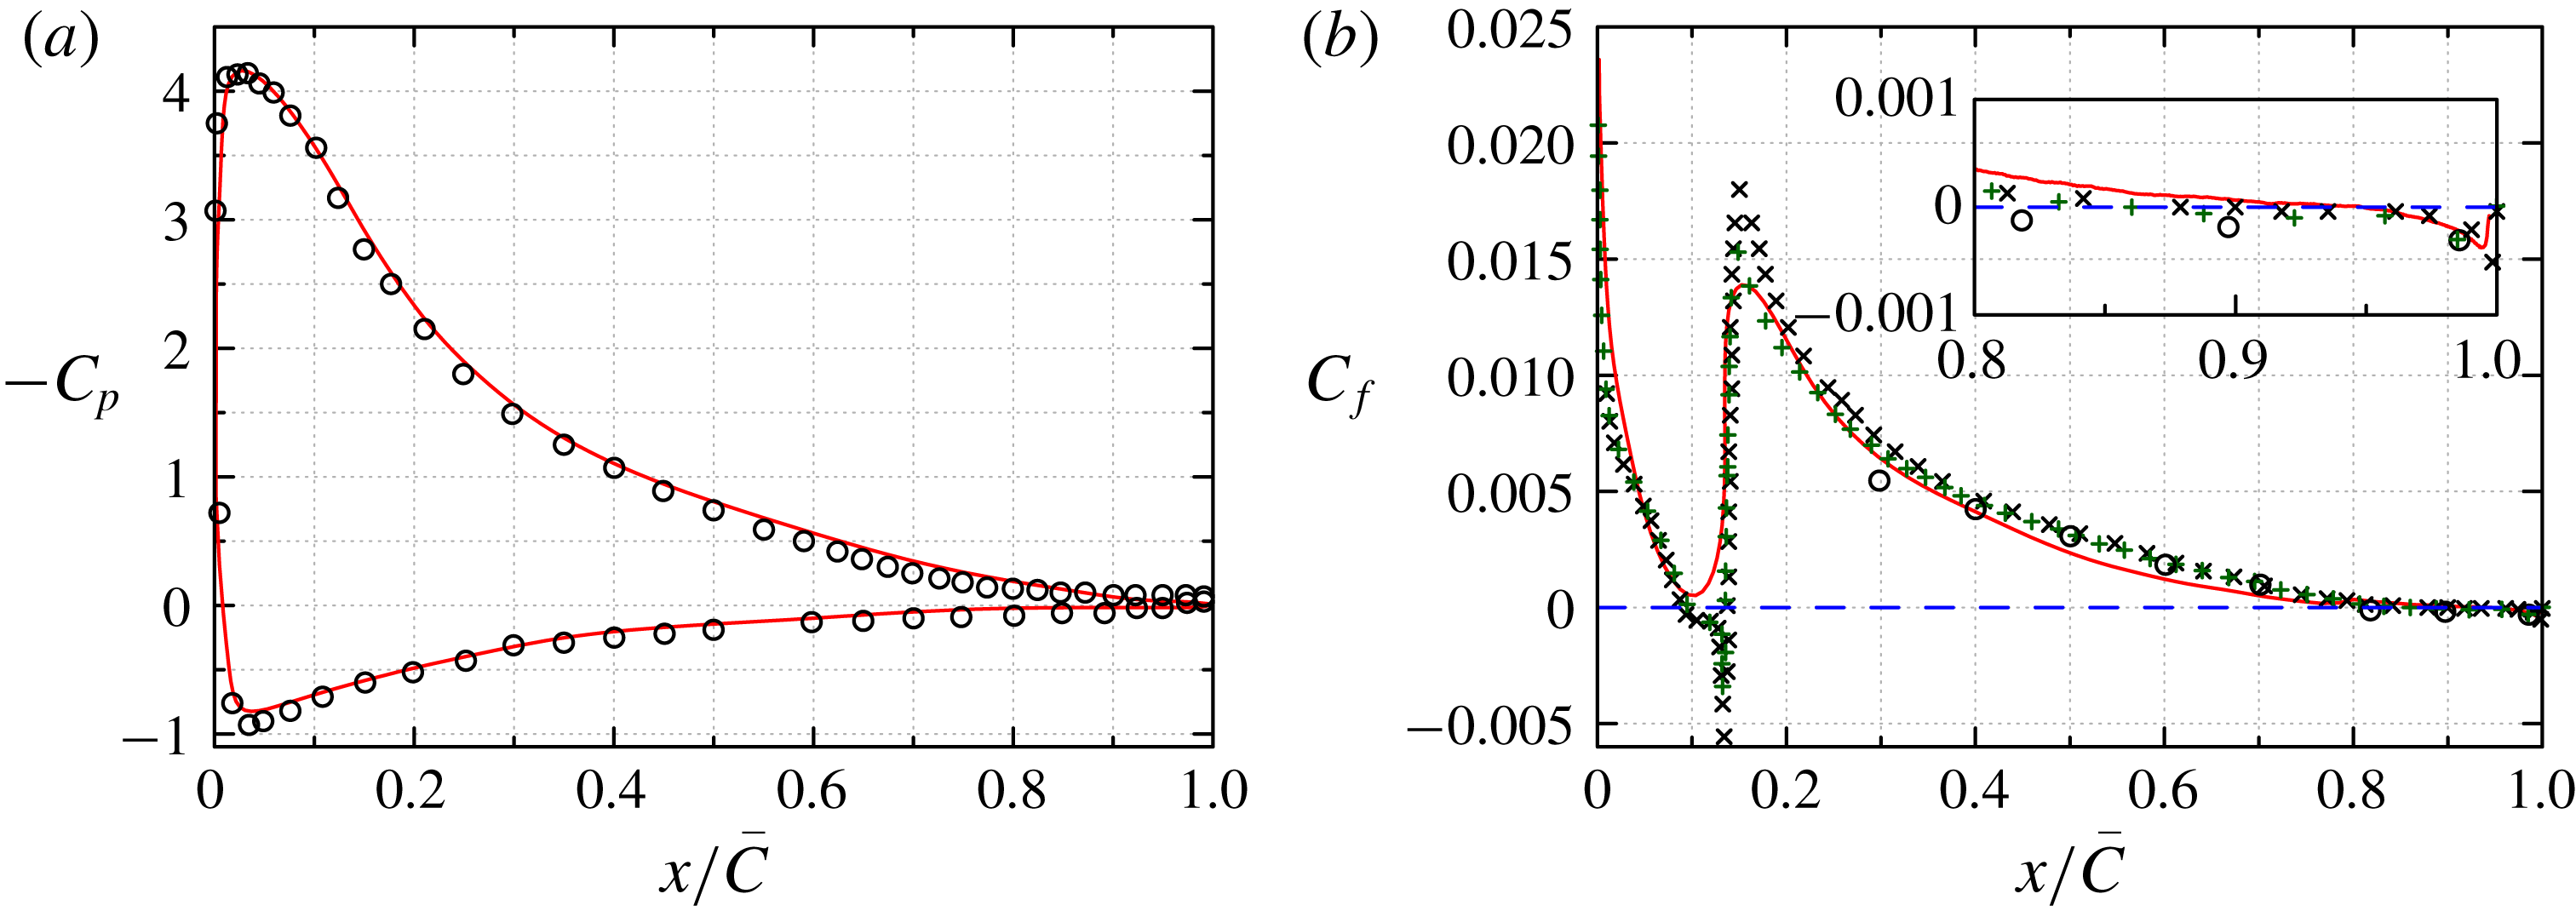
Aérospatiale A-airfoil, $Re_{c}=2.1\times 10^{6}$
. The mean streamwise velocity profiles,
$Re_{c}=2.1\times 10^{6}$
. The mean streamwise velocity profiles, $u_{s}$
along the wall-normal lines at different locations of the suction side. From left to right,
$u_{s}$
along the wall-normal lines at different locations of the suction side. From left to right, $x/\bar{C}=0.3,0.5,0.7,0.825,0.87,0.93,0.99$
. Profiles are shifted by
$x/\bar{C}=0.3,0.5,0.7,0.825,0.87,0.93,0.99$
. Profiles are shifted by $0,2,\ldots ,12$
for clarity. ○, experimental data from Gleyzes (Reference Gleyzes1988); ——, present WMLES. Note that the profiles on the left-hand side of the vertical dashed lines use the left
$0,2,\ldots ,12$
for clarity. ○, experimental data from Gleyzes (Reference Gleyzes1988); ——, present WMLES. Note that the profiles on the left-hand side of the vertical dashed lines use the left $y$
-axis, while the others use the right
$y$
-axis, while the others use the right $y$
-axis.
$y$
-axis.
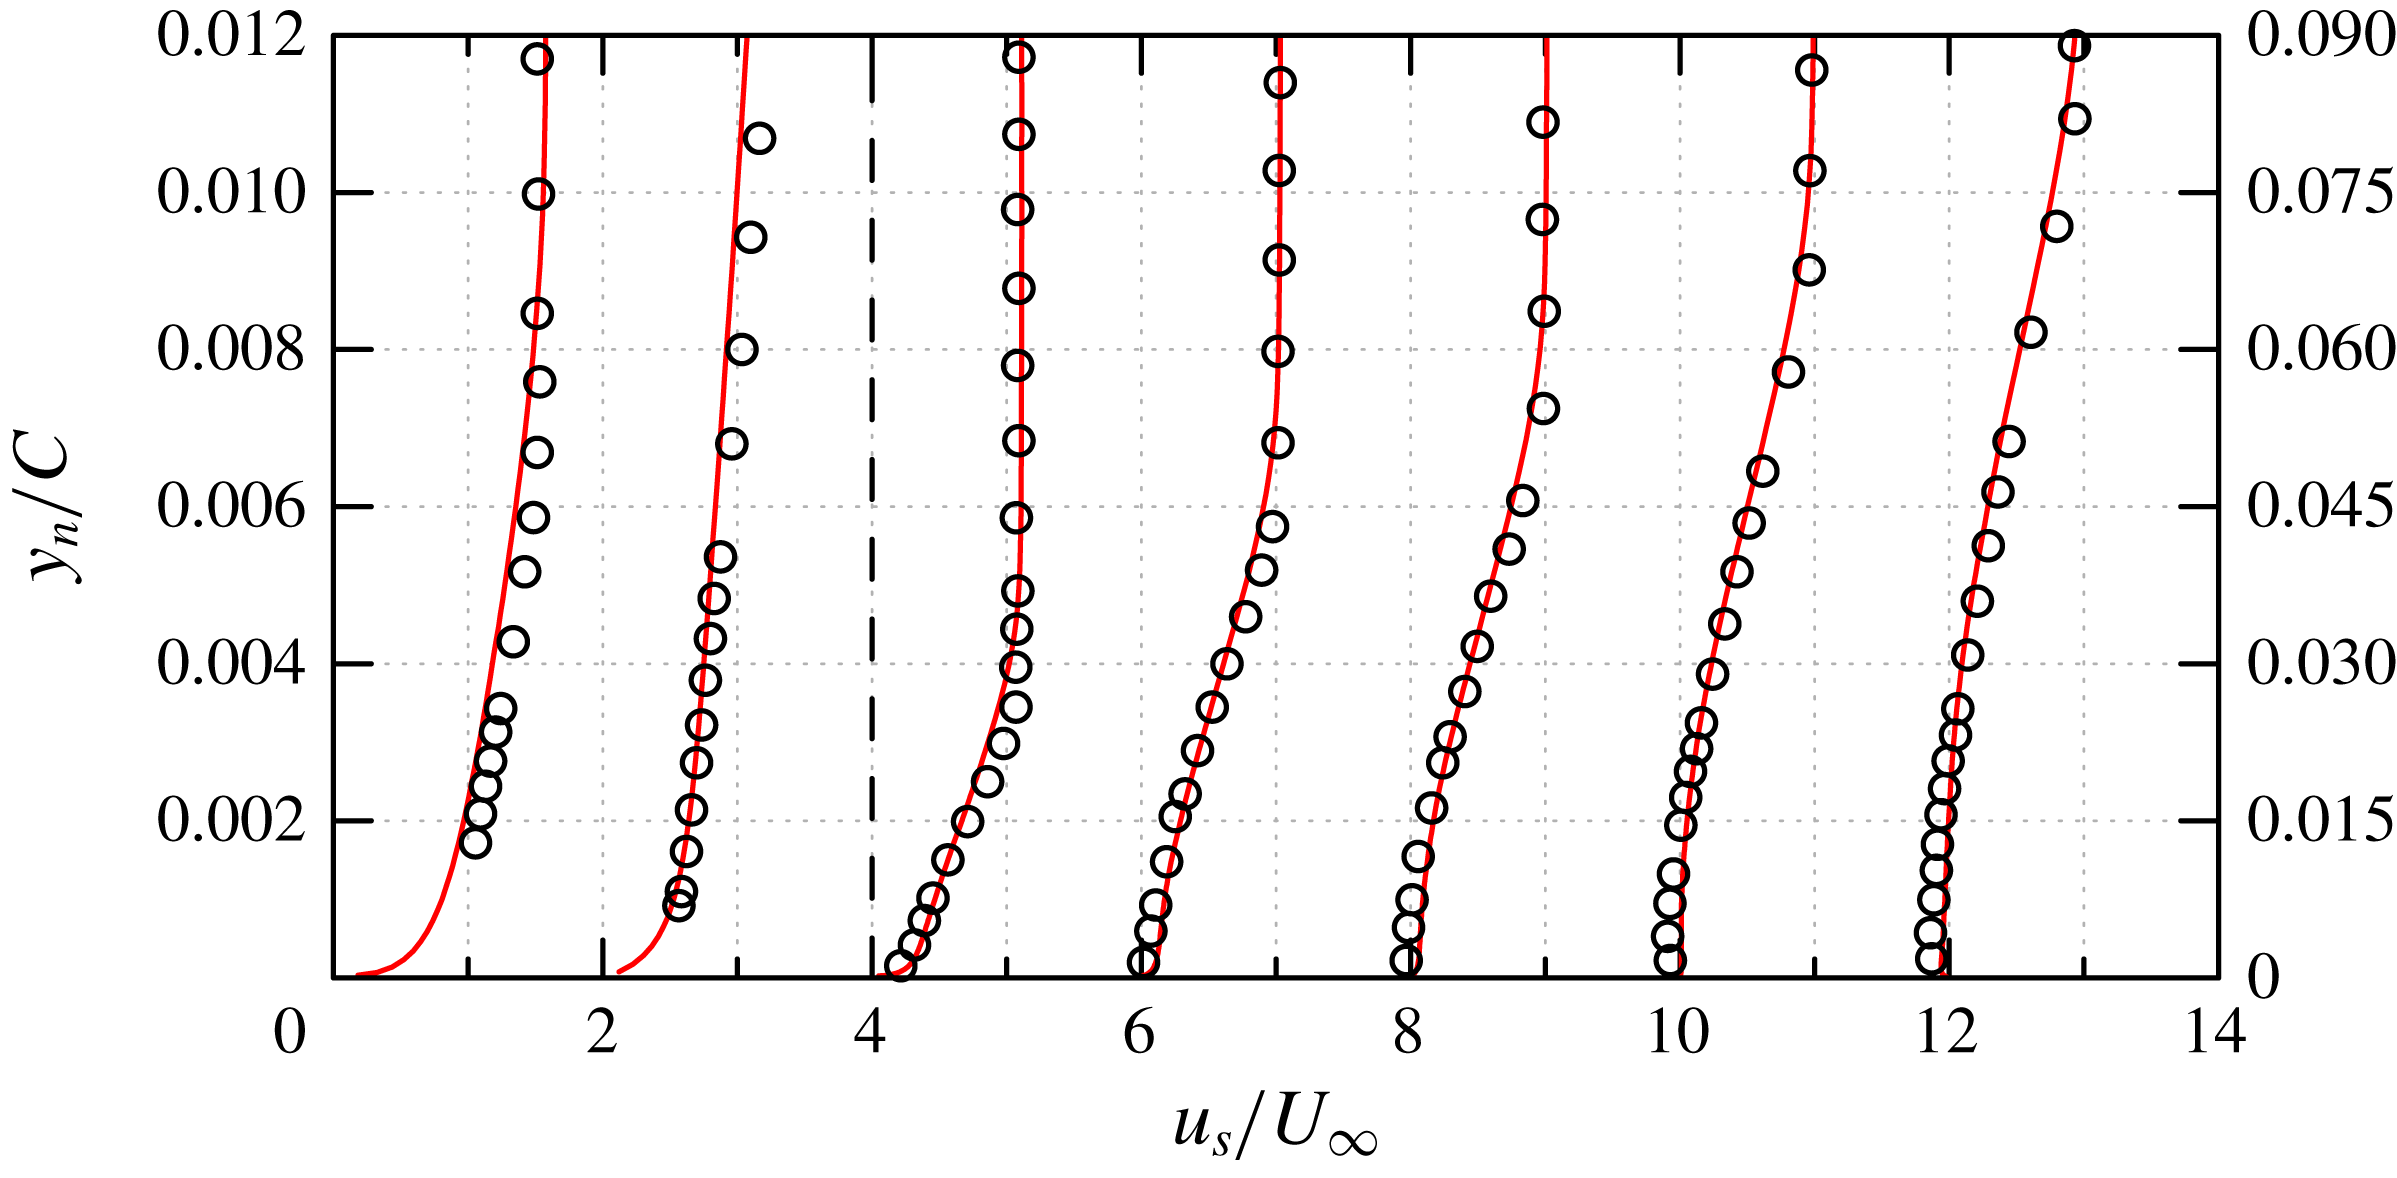
Aérospatiale A-airfoil, $Re_{c}=2.1\times 10^{6}$
. The Reynolds stress profiles, (a)
$Re_{c}=2.1\times 10^{6}$
. The Reynolds stress profiles, (a) $\sqrt{\overline{u_{s}^{\prime }u_{s}^{\prime }}}/U_{\infty }$
, (b)
$\sqrt{\overline{u_{s}^{\prime }u_{s}^{\prime }}}/U_{\infty }$
, (b) $\sqrt{\overline{u_{n}^{\prime }u_{n}^{\prime }}}/U_{\infty }$
and (c)
$\sqrt{\overline{u_{n}^{\prime }u_{n}^{\prime }}}/U_{\infty }$
and (c) $\overline{u_{s}^{\prime }u_{n}^{\prime }}/U_{\infty }^{2}$
along the wall-normal lines at different locations of the suction side. From left to right,
$\overline{u_{s}^{\prime }u_{n}^{\prime }}/U_{\infty }^{2}$
along the wall-normal lines at different locations of the suction side. From left to right, $x/\bar{C}=0.3,0.5,0.7,0.825,0.87,0.93,0.99$
. Profiles are shifted by
$x/\bar{C}=0.3,0.5,0.7,0.825,0.87,0.93,0.99$
. Profiles are shifted by $0,0.3,\ldots ,1.8$
in (a) and (b), and shifted by
$0,0.3,\ldots ,1.8$
in (a) and (b), and shifted by $0,0.1,\ldots ,0.6$
in (c) for clarity. ○, experimental data from Gleyzes (Reference Gleyzes1988); ——, present WMLES.
$0,0.1,\ldots ,0.6$
in (c) for clarity. ○, experimental data from Gleyzes (Reference Gleyzes1988); ——, present WMLES.
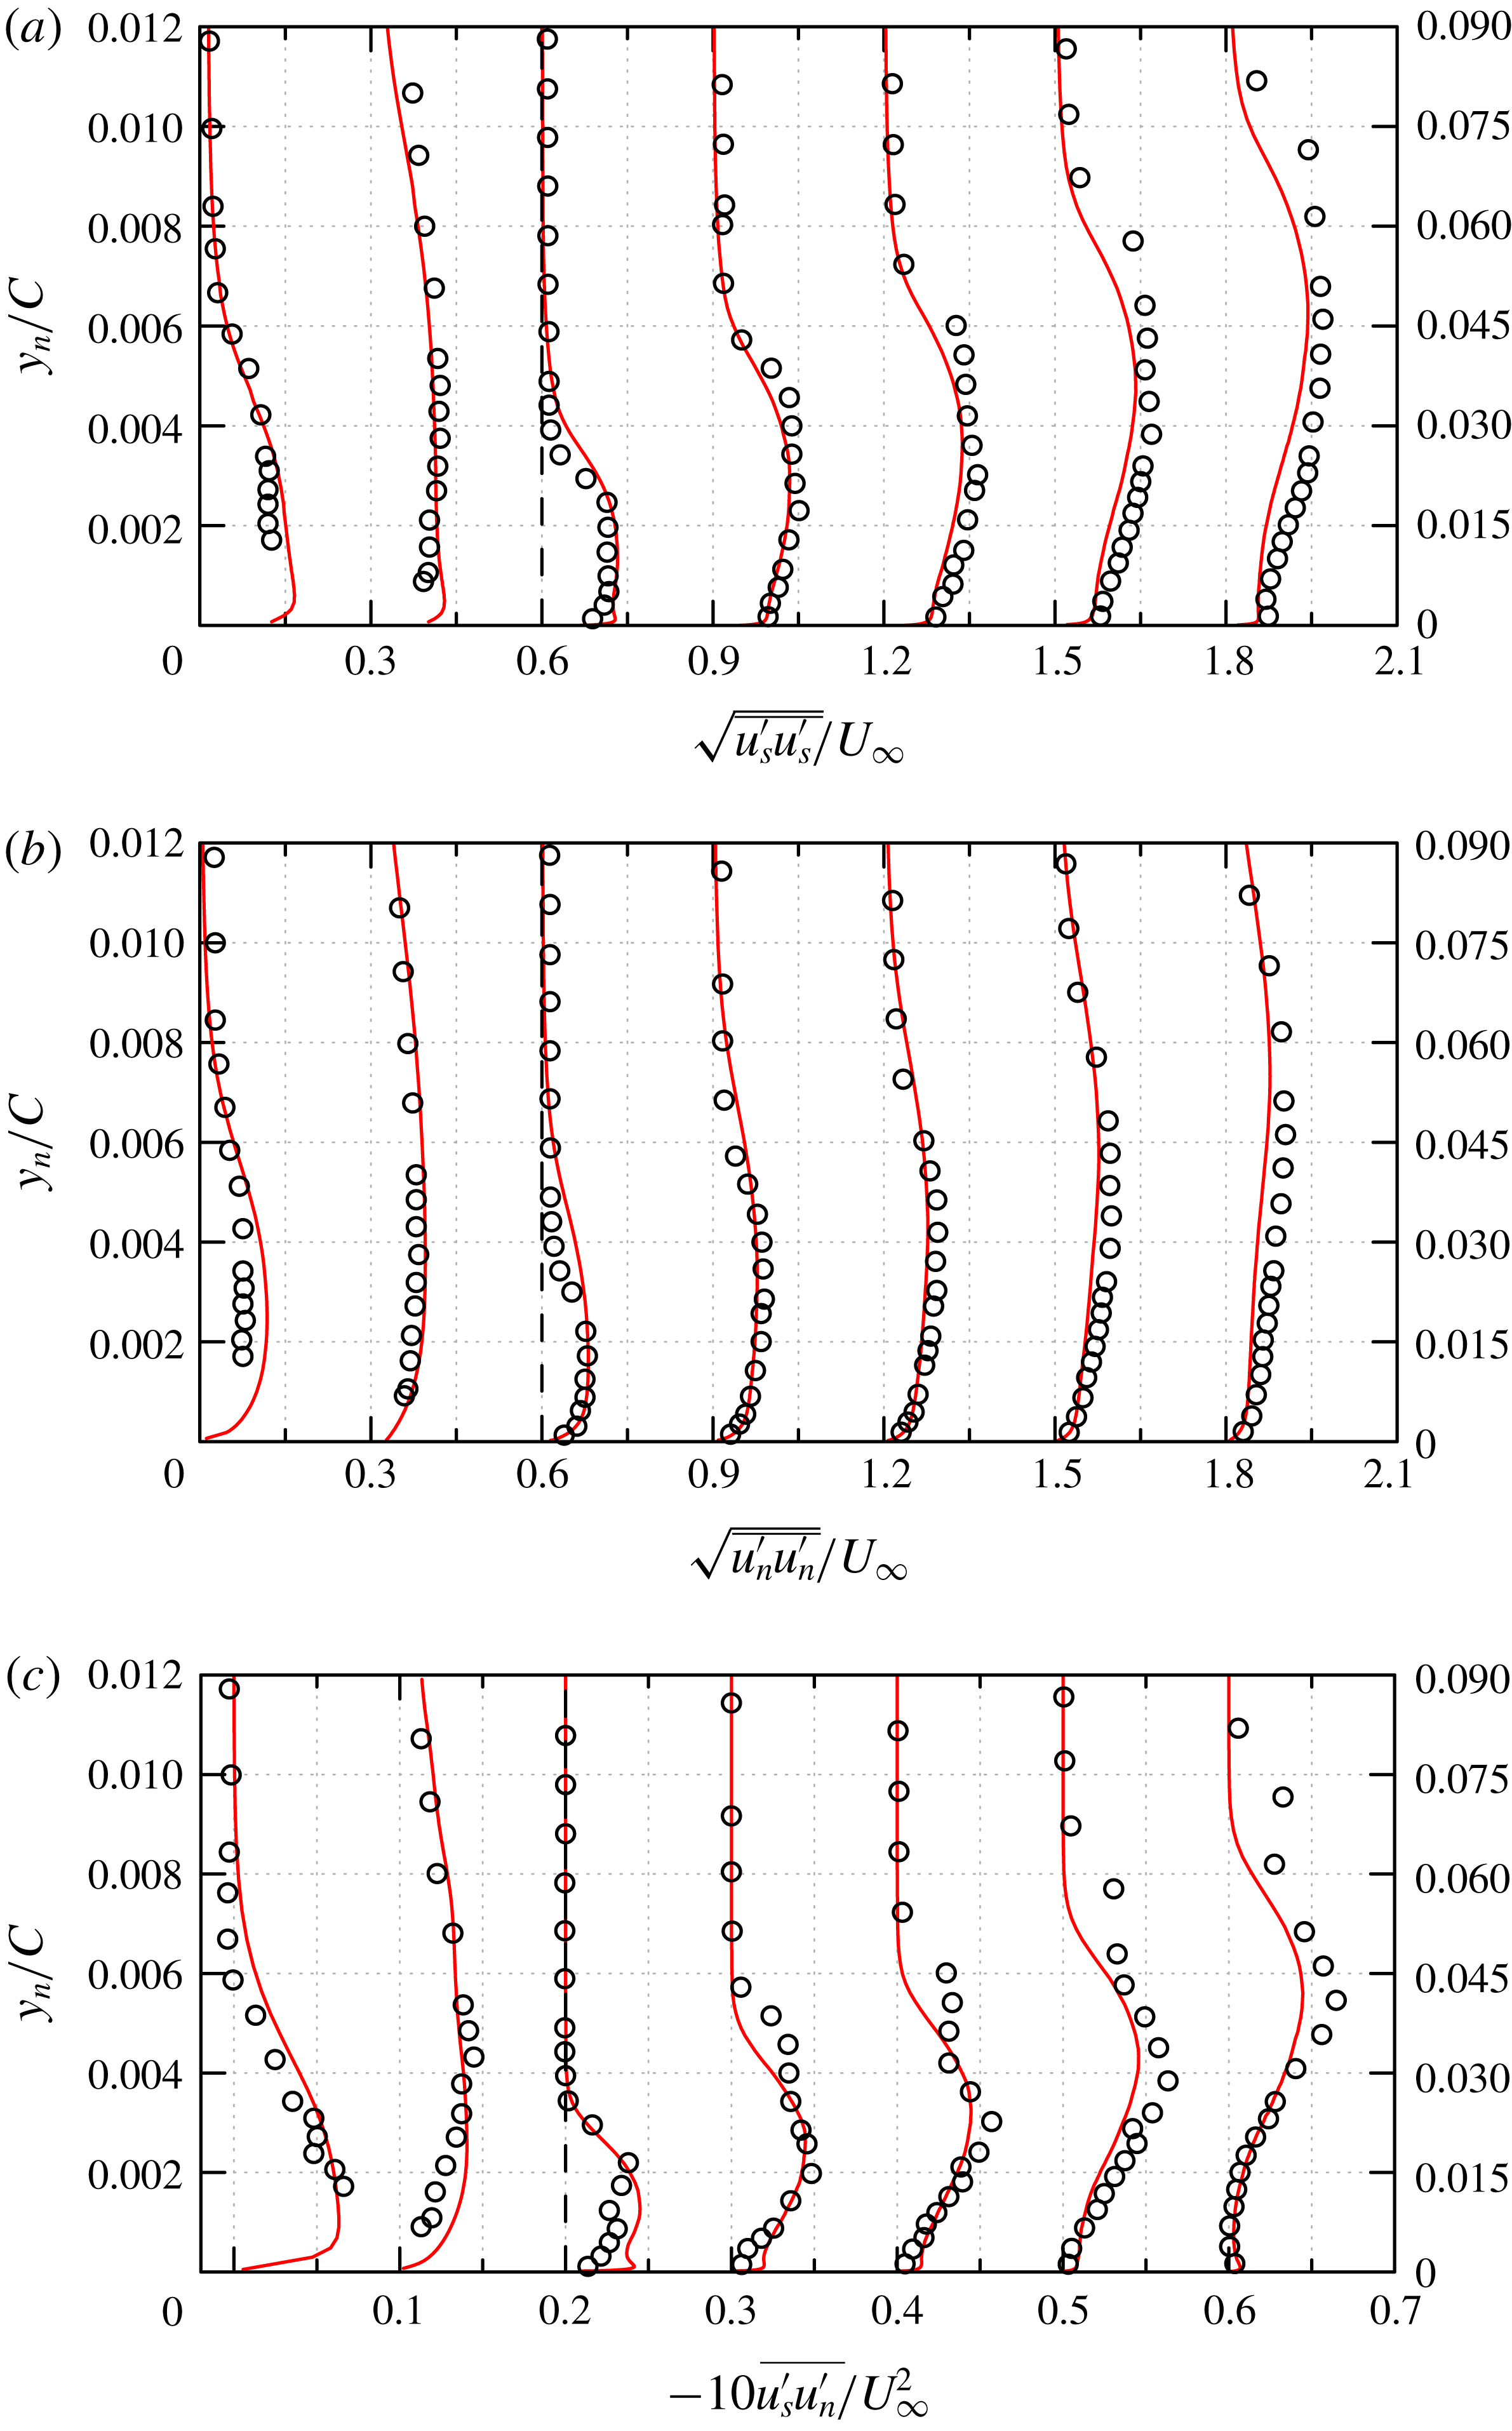
6 Anisotropy of the flow
In the above section, we noted that the Reynolds stress components for all three WMLES cases (ranging from low to high $Re_{c}$
) are found to be in reasonable agreement: the prediction location of transition onset is very close to DNS for
$Re_{c}$
) are found to be in reasonable agreement: the prediction location of transition onset is very close to DNS for $Re_{c}=10^{4}$
, the WMLES results agree with experimental data by Boutilier & Yarusevych (Reference Boutilier and Yarusevych2012) and Kirk & Yarusevych (Reference Kirk and Yarusevych2017) for
$Re_{c}=10^{4}$
, the WMLES results agree with experimental data by Boutilier & Yarusevych (Reference Boutilier and Yarusevych2012) and Kirk & Yarusevych (Reference Kirk and Yarusevych2017) for $Re_{c}=10^{5}$
and follow the general trend of experiments by Gleyzes (Reference Gleyzes1988) for
$Re_{c}=10^{5}$
and follow the general trend of experiments by Gleyzes (Reference Gleyzes1988) for $Re_{c}=2.1\times 10^{6}$
. It is, therefore, interesting to further analyse the LES data to recognize the flow patterns around the airfoil. The objective of the present section is to examine the anisotropy in these wall-bounded flows.
$Re_{c}=2.1\times 10^{6}$
. It is, therefore, interesting to further analyse the LES data to recognize the flow patterns around the airfoil. The objective of the present section is to examine the anisotropy in these wall-bounded flows.
6.1 Definition of anisotropy
The non-dimensional anisotropy tensor introduced by Lumley & Newman (Reference Lumley and Newman1977) and Lumley (Reference Lumley1979) is defined as
 $$\begin{eqnarray}\displaystyle \unicode[STIX]{x1D623}_{ij}=\overline{u_{i}^{\prime }u_{j}^{\prime }}/\overline{u_{k}^{\prime }u_{k}^{\prime }}-\unicode[STIX]{x1D6FF}_{ij}/3. & & \displaystyle\end{eqnarray}$$
It has a zero trace ( $\unicode[STIX]{x1D623}_{ii}=0$
) and is characterized by two invariants, viz.,
$\unicode[STIX]{x1D623}_{ii}=0$
) and is characterized by two invariants, viz.,
 $$\begin{eqnarray}\displaystyle II=-\unicode[STIX]{x1D623}_{ij}\unicode[STIX]{x1D623}_{ij}/2,\quad III=\unicode[STIX]{x1D623}_{ij}\unicode[STIX]{x1D623}_{jk}\unicode[STIX]{x1D623}_{ki}/3, & & \displaystyle\end{eqnarray}$$
which allow a simple graphical evaluation, i.e. $(III,II)$
-plane, of possible states of turbulence. It is more convenient to identify the anisotropy by
$(III,II)$
-plane, of possible states of turbulence. It is more convenient to identify the anisotropy by
 $$\begin{eqnarray}\displaystyle \unicode[STIX]{x1D719}=\left(\frac{III}{2}\right)^{1/3},\quad \unicode[STIX]{x1D713}=\left(-\frac{II}{3}\right)^{1/2} & & \displaystyle\end{eqnarray}$$
(Pope Reference Pope2000). At any location in a turbulent flow, $\unicode[STIX]{x1D719}$
and
$\unicode[STIX]{x1D719}$
and $\unicode[STIX]{x1D713}$
are determined from the Reynolds stress components, which correspond to points in the
$\unicode[STIX]{x1D713}$
are determined from the Reynolds stress components, which correspond to points in the $(\unicode[STIX]{x1D719},\unicode[STIX]{x1D713})$
-plane, as shown in figure 13. All realizable states of the anisotropy tensor are found within a triangular region in the
$(\unicode[STIX]{x1D719},\unicode[STIX]{x1D713})$
-plane, as shown in figure 13. All realizable states of the anisotropy tensor are found within a triangular region in the $(\unicode[STIX]{x1D719},\unicode[STIX]{x1D713})$
-plane, which is the anisotropy invariant map (AIM) and often referred to as the Lumley triangle (figure 13). The origin of the triangle, i.e.
$(\unicode[STIX]{x1D719},\unicode[STIX]{x1D713})$
-plane, which is the anisotropy invariant map (AIM) and often referred to as the Lumley triangle (figure 13). The origin of the triangle, i.e. $(0,0)$
corresponds to 3-D isotropic turbulence, the left-hand corner point of the triangle, i.e.
$(0,0)$
corresponds to 3-D isotropic turbulence, the left-hand corner point of the triangle, i.e. $(-1/6,1/6)$
corresponds to two-component (2C) isotropic turbulence, the right-hand corner point of the triangle, i.e.
$(-1/6,1/6)$
corresponds to two-component (2C) isotropic turbulence, the right-hand corner point of the triangle, i.e. $(1/3,1/3)$
corresponds to one-component (1C) turbulence. The turbulence along the upper line connecting the 2C isotropic turbulence and 1C turbulence is the 2C turbulence state, in which
$(1/3,1/3)$
corresponds to one-component (1C) turbulence. The turbulence along the upper line connecting the 2C isotropic turbulence and 1C turbulence is the 2C turbulence state, in which
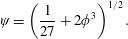 $$\begin{eqnarray}\displaystyle \unicode[STIX]{x1D713}=\left(\frac{1}{27}+2\unicode[STIX]{x1D719}^{3}\right)^{1/2}. & & \displaystyle\end{eqnarray}$$
The left-hand line $\unicode[STIX]{x1D713}=-\unicode[STIX]{x1D719}$
and right-hand line
$\unicode[STIX]{x1D713}=-\unicode[STIX]{x1D719}$
and right-hand line $\unicode[STIX]{x1D713}=\unicode[STIX]{x1D719}$
correspond to the ‘axisymmetric contraction’ and ‘axisymmetric expansion’ state, respectively (Choi & Lumley Reference Choi and Lumley2001). This classification of turbulence is formally based on the shape of the energy ellipsoid, and details of the analysis may be obtained from Lumley (Reference Lumley1979).
$\unicode[STIX]{x1D713}=\unicode[STIX]{x1D719}$
correspond to the ‘axisymmetric contraction’ and ‘axisymmetric expansion’ state, respectively (Choi & Lumley Reference Choi and Lumley2001). This classification of turbulence is formally based on the shape of the energy ellipsoid, and details of the analysis may be obtained from Lumley (Reference Lumley1979).
NACA0012, $Re_{c}=10^{4}$
. Invariant maps of WMLES results along vertical lines at six locations along the suction surface: (a)
$Re_{c}=10^{4}$
. Invariant maps of WMLES results along vertical lines at six locations along the suction surface: (a) $x/C=0.8$
; (b)
$x/C=0.8$
; (b) $x/C=0.9$
; (c)
$x/C=0.9$
; (c) $x/C=0.92$
; (d)
$x/C=0.92$
; (d) $x/C=0.94$
; (e)
$x/C=0.94$
; (e) $x/C=0.96$
; (f)
$x/C=0.96$
; (f) $x/C=0.98$
.
$x/C=0.98$
. $\longrightarrow$
denotes the direction away from the airfoil surface. The line partly outside the triangle at the upper boundary is due to the connection of two neighbouring points.
$\longrightarrow$
denotes the direction away from the airfoil surface. The line partly outside the triangle at the upper boundary is due to the connection of two neighbouring points.
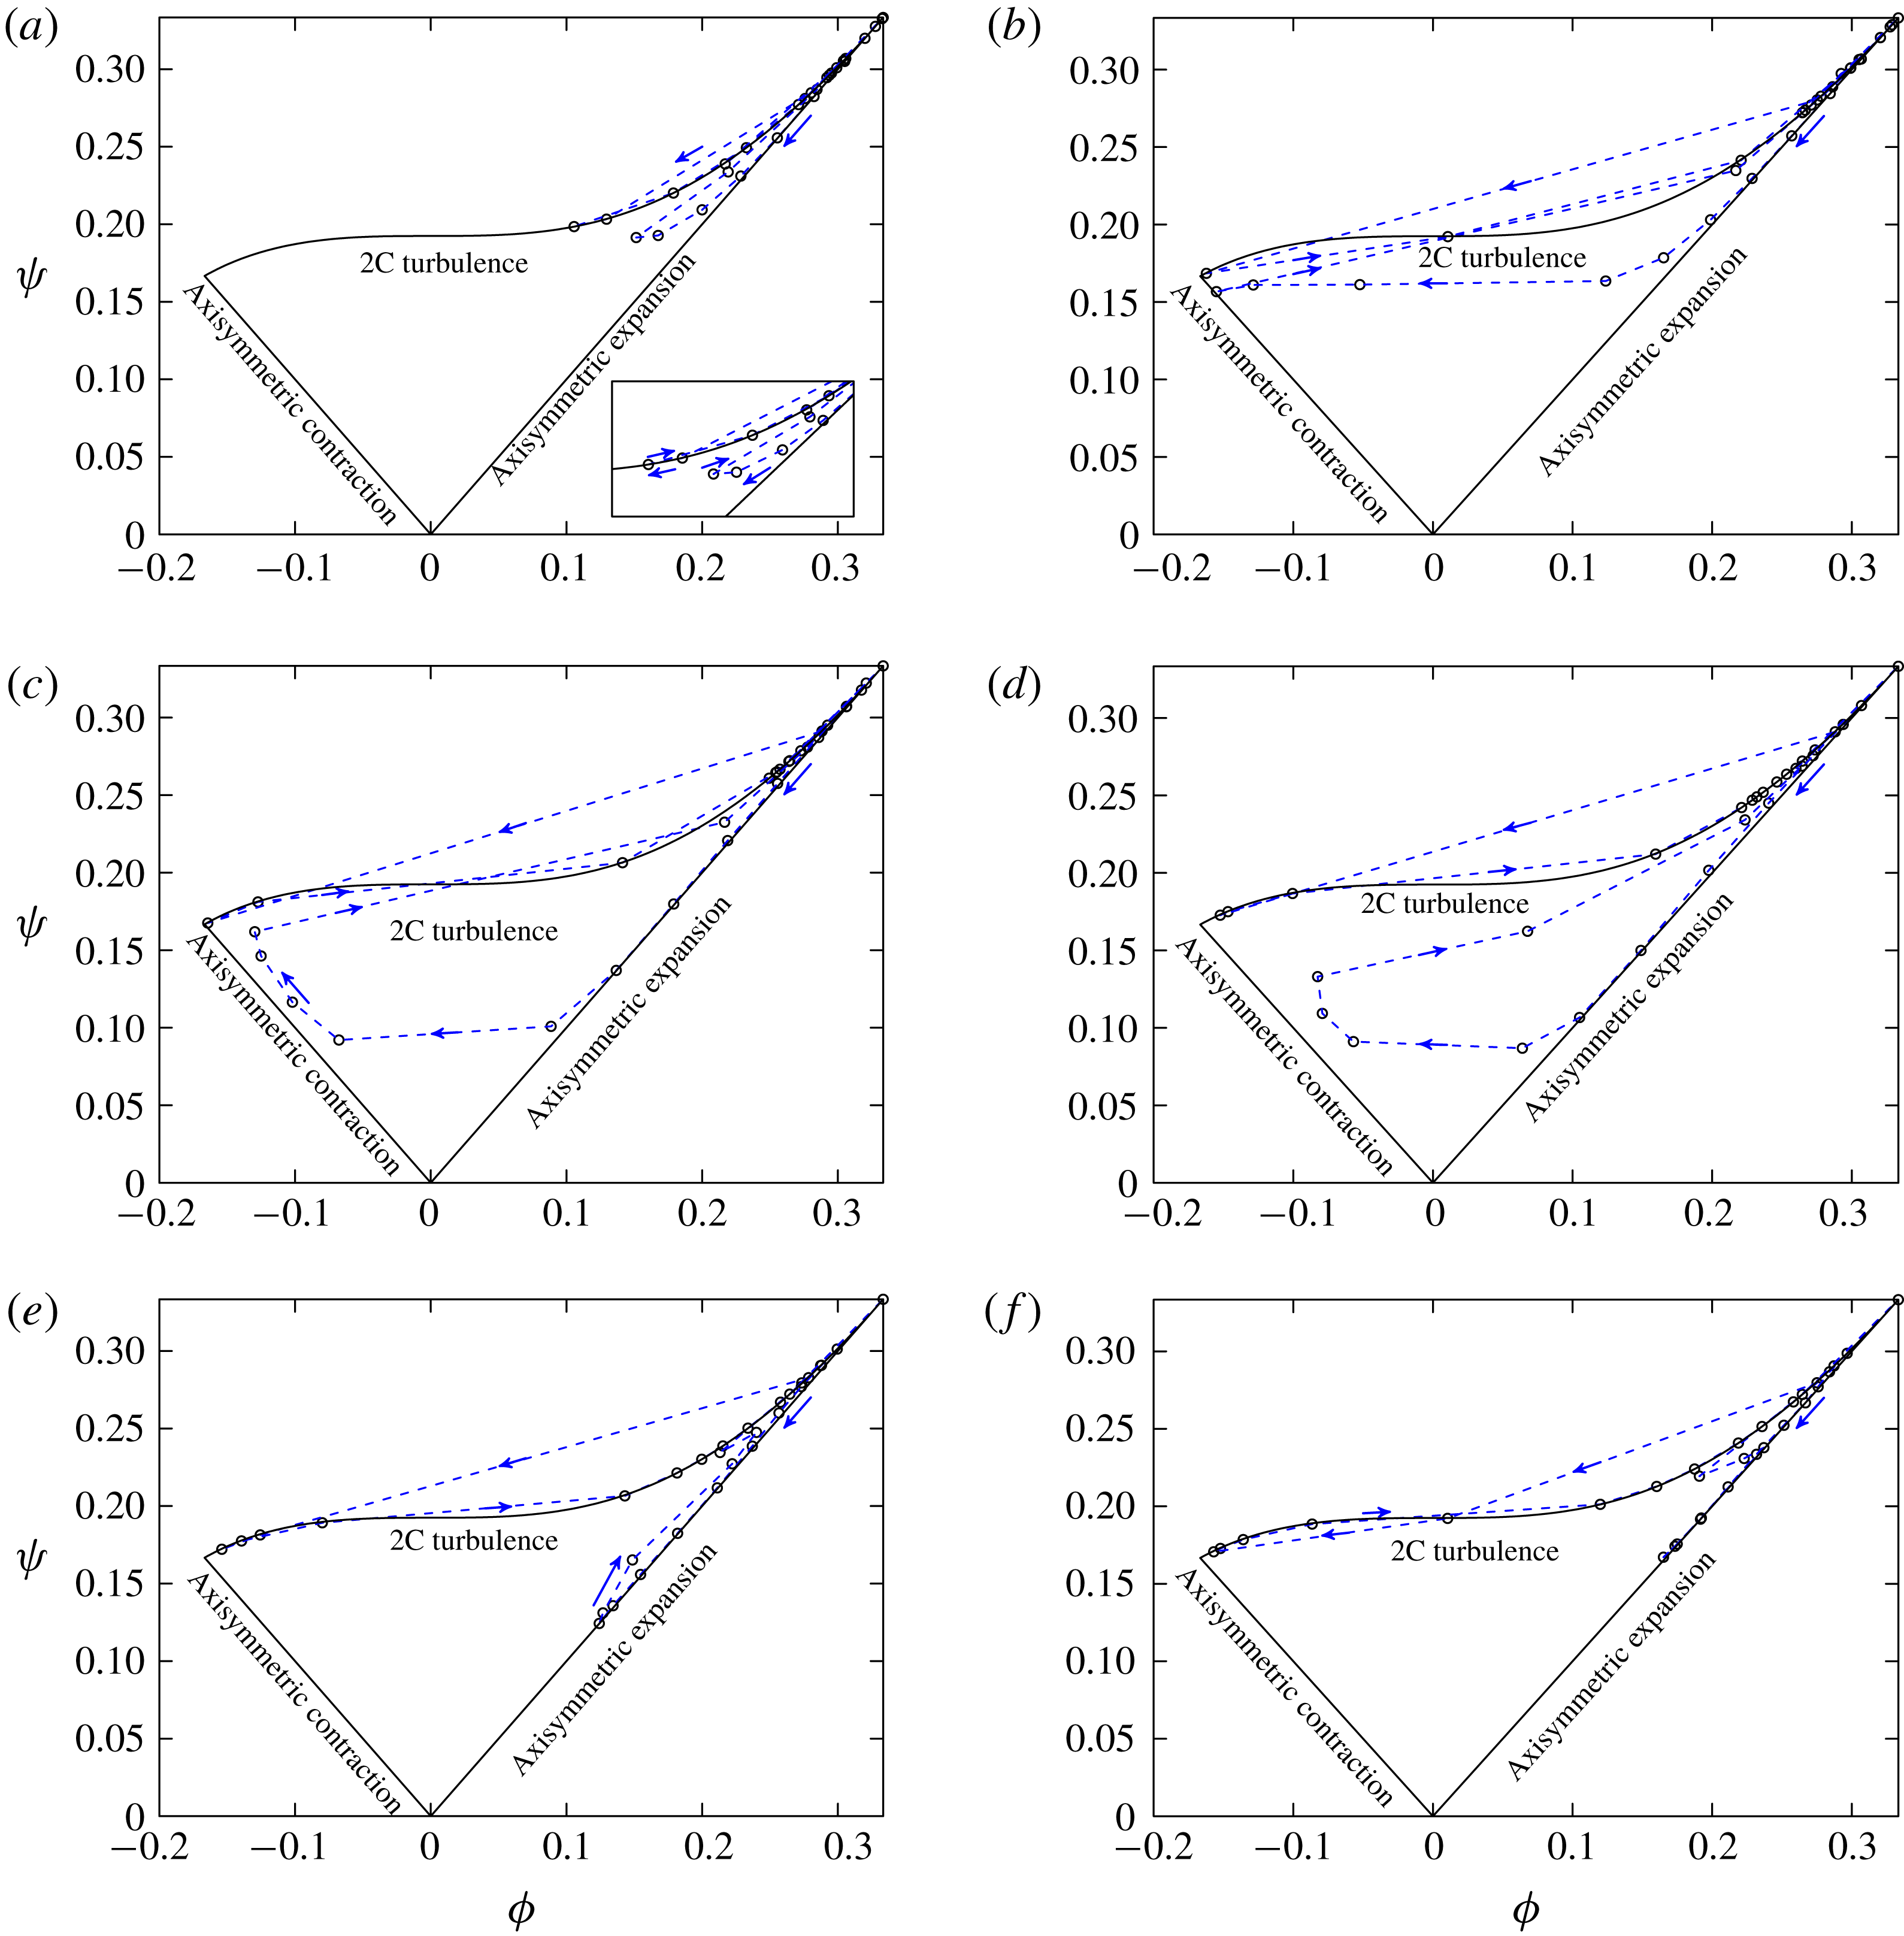
NACA0012, $Re_{c}=10^{4}$
. Invariant maps of DNS results along vertical lines at six locations along the suction surface: (a)
$Re_{c}=10^{4}$
. Invariant maps of DNS results along vertical lines at six locations along the suction surface: (a) $x/C=0.8$
; (b)
$x/C=0.8$
; (b) $x/C=0.9$
; (c)
$x/C=0.9$
; (c) $x/C=0.92$
; (d)
$x/C=0.92$
; (d) $x/C=0.94$
; (e)
$x/C=0.94$
; (e) $x/C=0.96$
; (f)
$x/C=0.96$
; (f) $x/C=0.98$
.
$x/C=0.98$
. $\longrightarrow$
denotes the direction away from the airfoil surface. The line partly outside the triangle at the upper boundary is due to the connection of two neighbouring points.
$\longrightarrow$
denotes the direction away from the airfoil surface. The line partly outside the triangle at the upper boundary is due to the connection of two neighbouring points.

NACA0018, $Re_{c}=10^{5}$
. Invariant maps of WMLES results along vertical lines at six locations along the suction surface: (a)
$Re_{c}=10^{5}$
. Invariant maps of WMLES results along vertical lines at six locations along the suction surface: (a) $x/C=0.4$
; (b)
$x/C=0.4$
; (b) $x/C=0.45$
; (c)
$x/C=0.45$
; (c) $x/C=0.5$
; (d)
$x/C=0.5$
; (d) $x/C=0.65$
; (e)
$x/C=0.65$
; (e) $x/C=0.8$
; (f)
$x/C=0.8$
; (f) $x/C=0.95$
.
$x/C=0.95$
. $\longrightarrow$
denotes the direction away from the airfoil surface. The line partly outside the triangle at the upper boundary in (a) is due to the connection of two neighbouring points.
$\longrightarrow$
denotes the direction away from the airfoil surface. The line partly outside the triangle at the upper boundary in (a) is due to the connection of two neighbouring points.
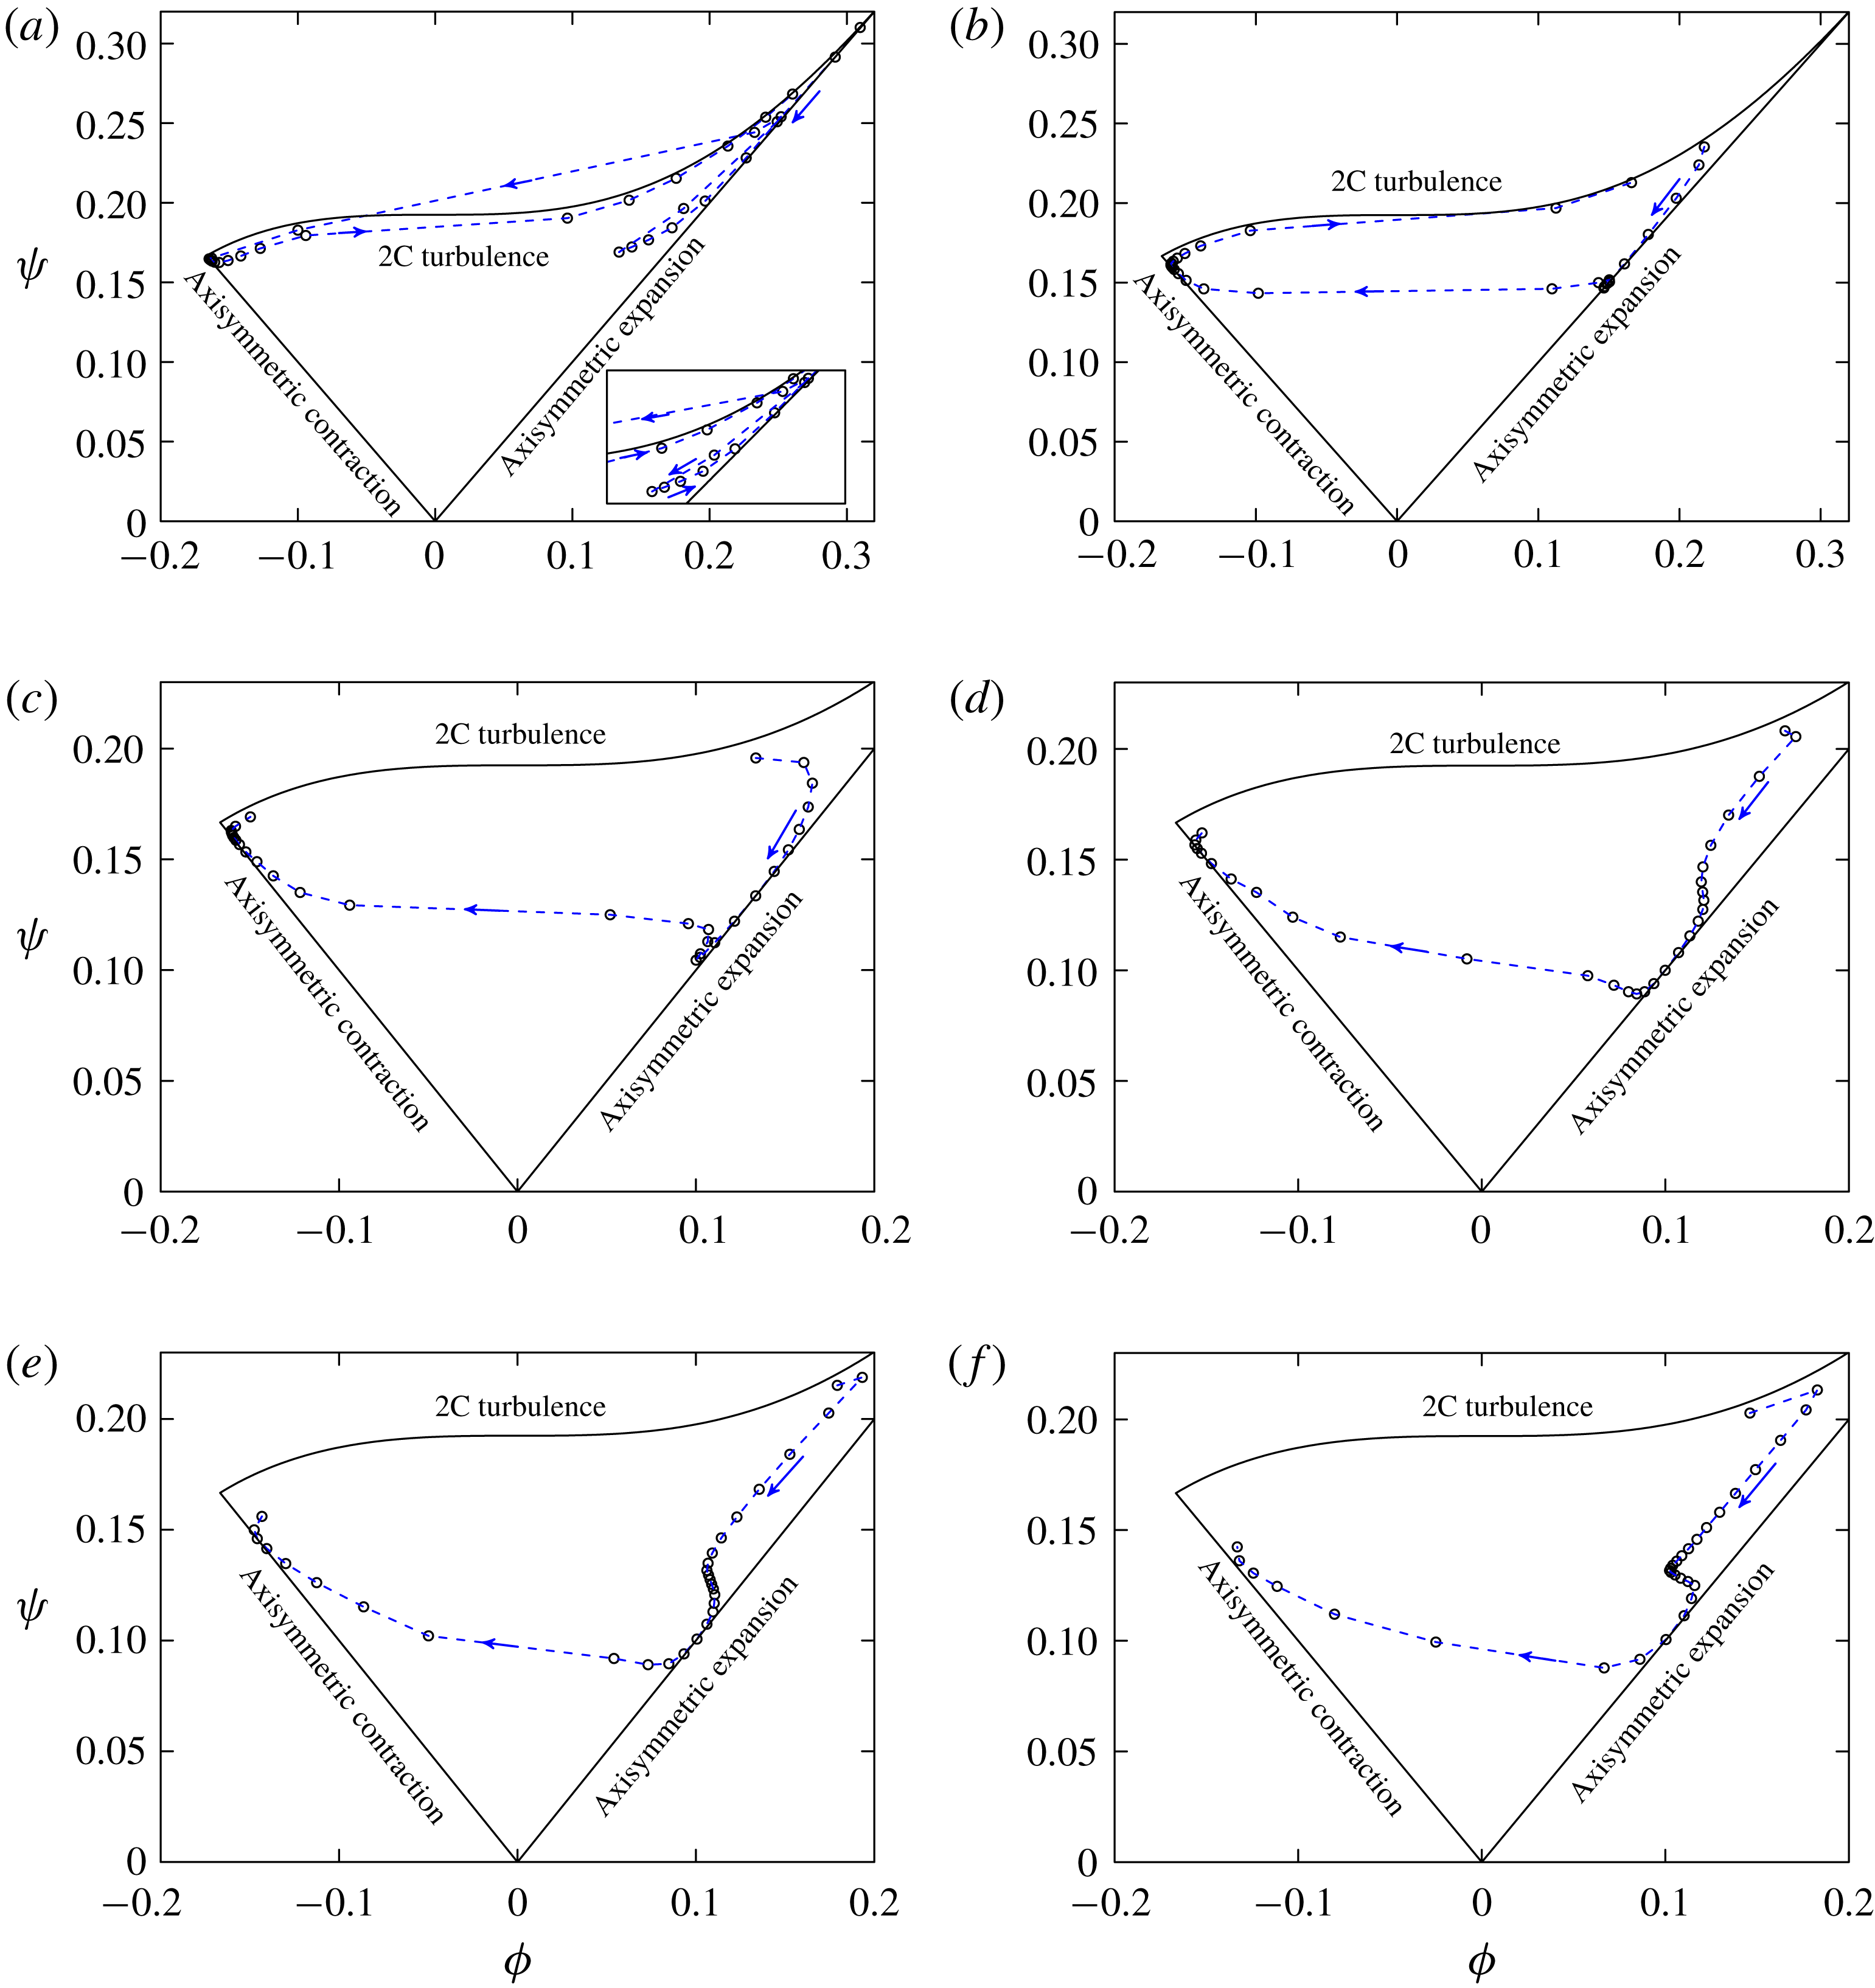
A-airfoil, $Re_{c}=2.1\times 10^{6}$
. Invariant maps of WMLES results along vertical lines at eight locations along the suction surface: (a)
$Re_{c}=2.1\times 10^{6}$
. Invariant maps of WMLES results along vertical lines at eight locations along the suction surface: (a) $x/C=0.35$
; (b)
$x/C=0.35$
; (b) $x/C=0.55$
; (c)
$x/C=0.55$
; (c) $x/C=0.70$
; (d)
$x/C=0.70$
; (d) $x/C=0.80$
; (e)
$x/C=0.80$
; (e) $x/C=0.85$
; (f)
$x/C=0.85$
; (f) $x/C=0.90$
; (g)
$x/C=0.90$
; (g) $x/C=0.94$
; (h)
$x/C=0.94$
; (h) $x/C=0.96$
.
$x/C=0.96$
. $\longrightarrow$
denotes the direction away from the airfoil surface.
$\longrightarrow$
denotes the direction away from the airfoil surface.
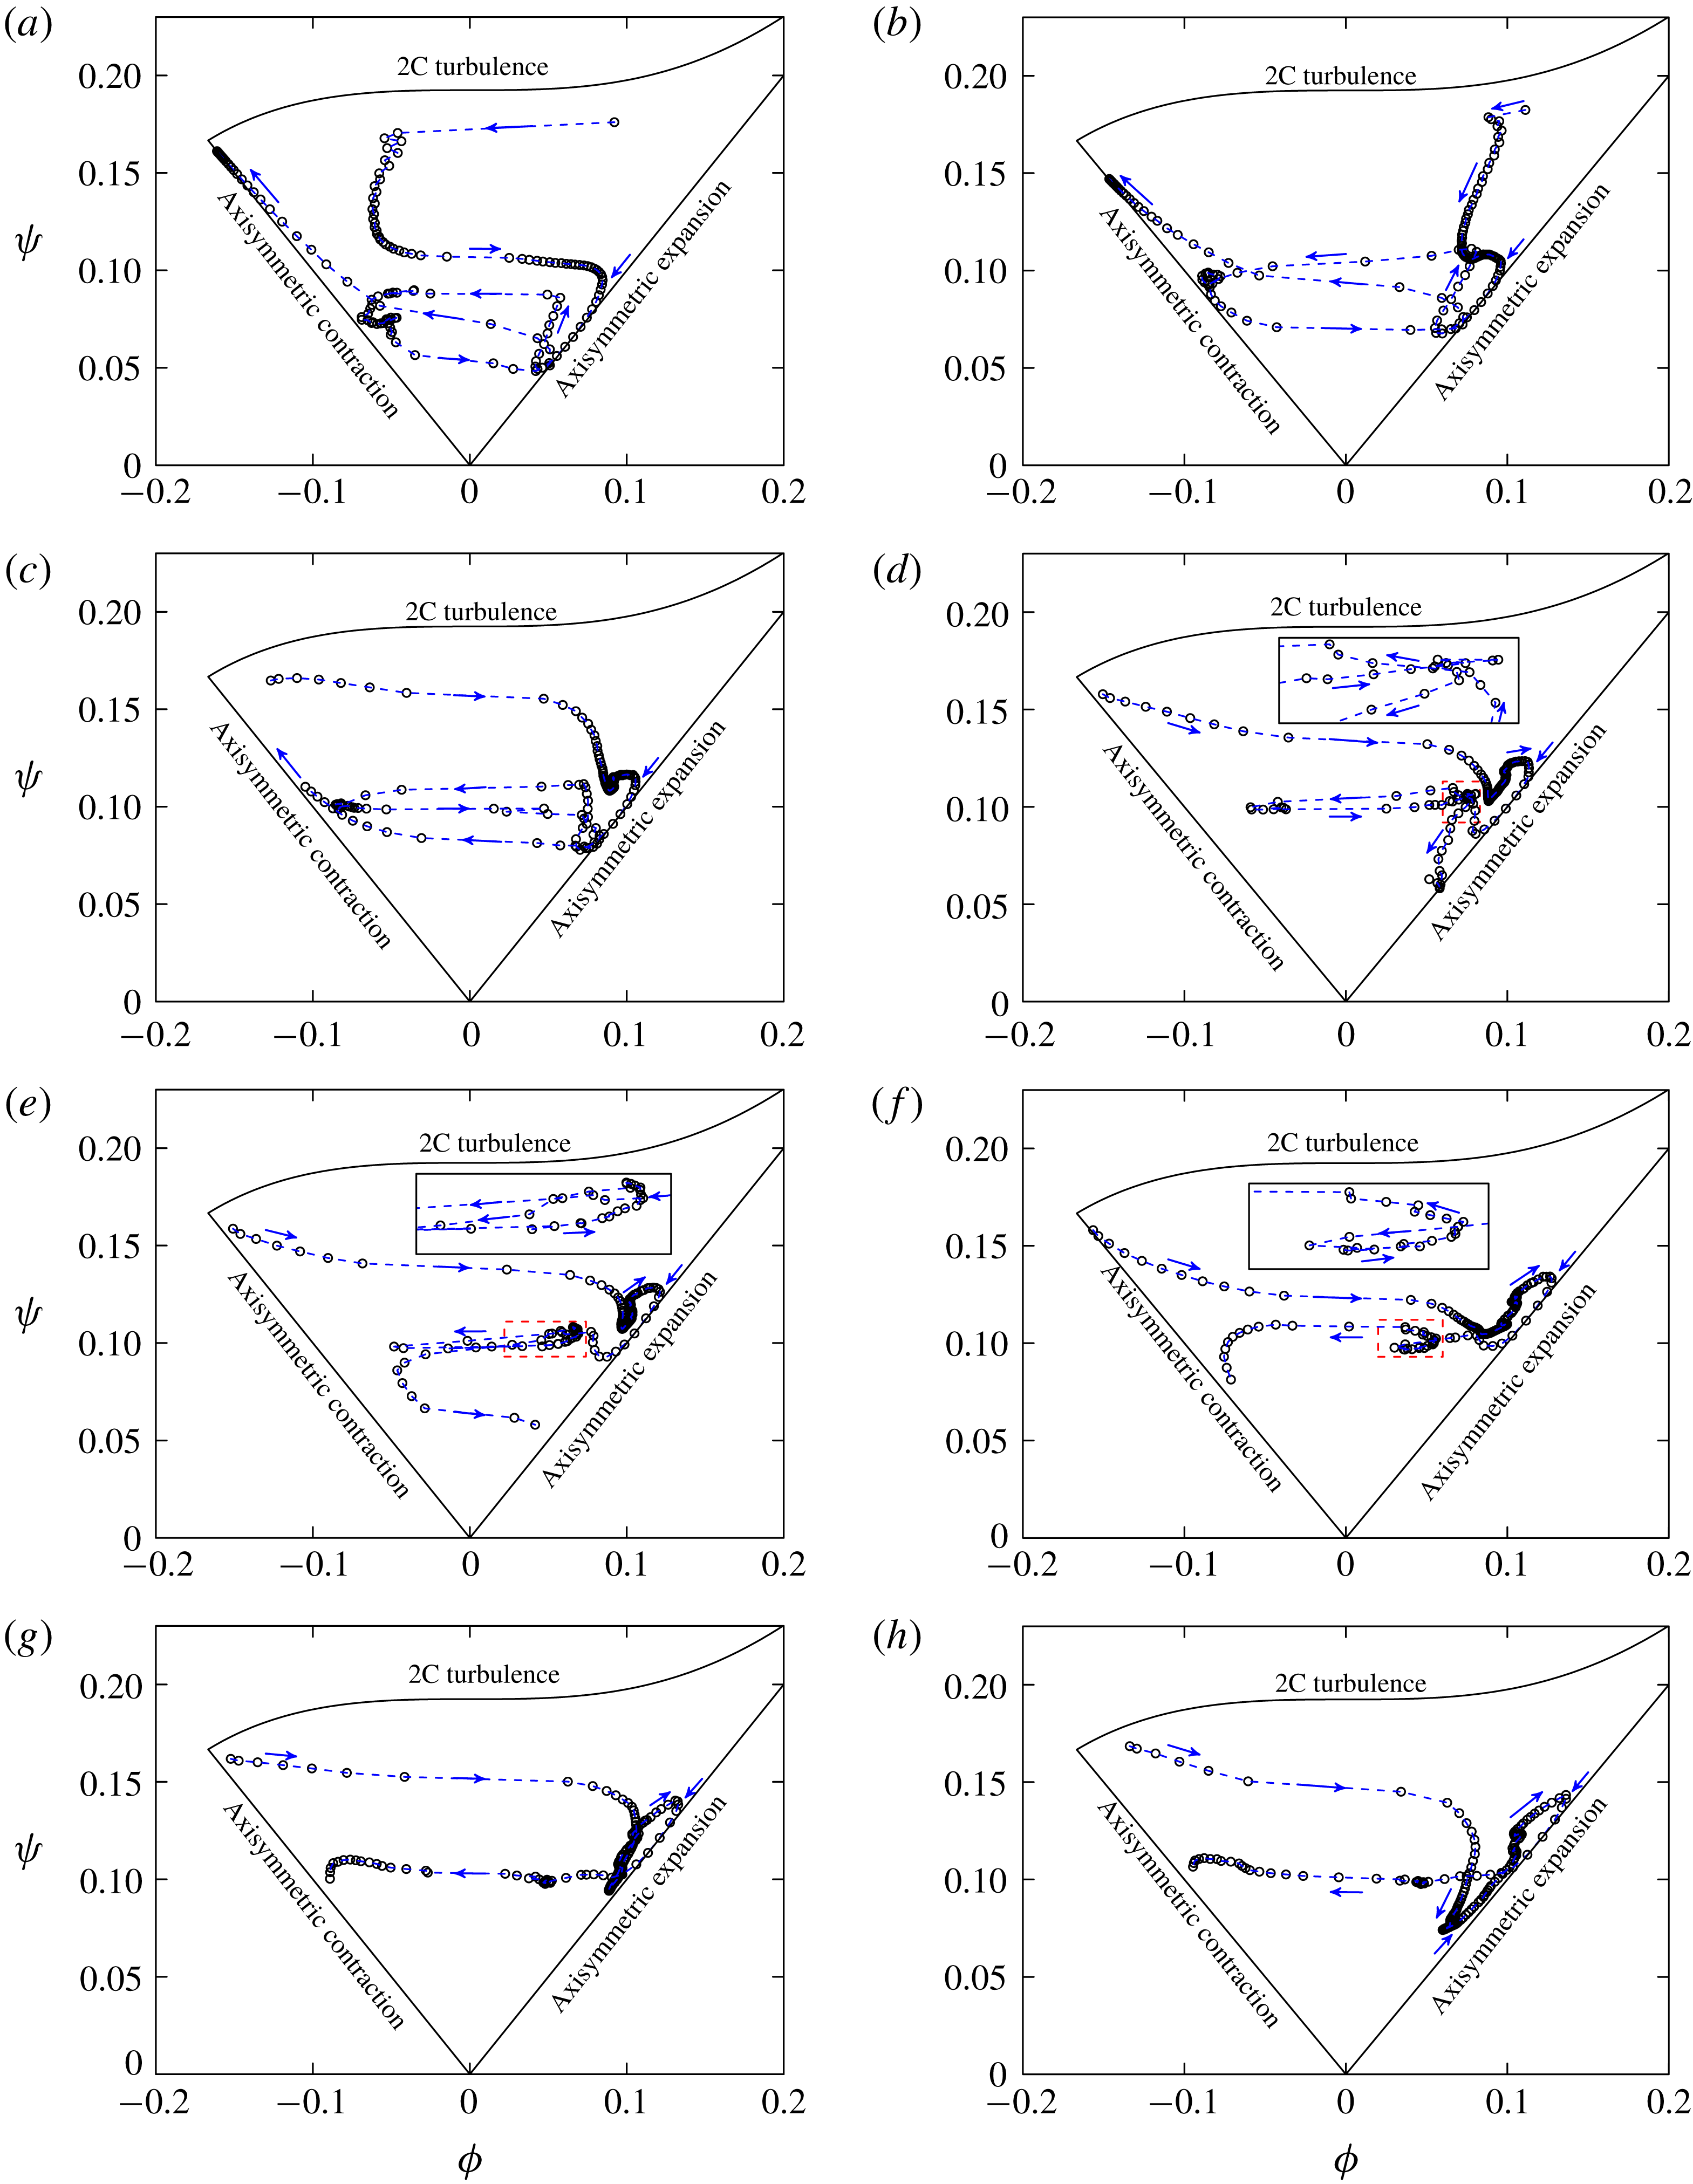
The above anisotropy invariants find many uses in the turbulence modelling community. First, they help to define realizable states of the Reynolds stress tensor, i.e. all physically realizable turbulence is bounded in the AIM. Second, it is desirable to ensure that the simulated turbulence field can only pass through a succession of realizable states, which helps improve the anisotropy-resolving turbulence closures especially at second-moment level. Furthermore, the invariants should satisfy some specific relations or bounds at the limiting states.
6.2 Low Reynolds number
$Re_{c}=10^{4}$
case

Figures 13 (WMLES) and 14 (DNS) show the loci associated with traversals in the vertical direction at six locations ( $x/C=0.8,0.9,0.92,0.94,0.96,0.98$
) along the suction surface of the NACA0012 airfoil. Overall, the loci behave similarly in both WMLES and DNS at the same locations. It is observed that all states indeed lie within the triangle, which is required by realizability constraints. For
$x/C=0.8,0.9,0.92,0.94,0.96,0.98$
) along the suction surface of the NACA0012 airfoil. Overall, the loci behave similarly in both WMLES and DNS at the same locations. It is observed that all states indeed lie within the triangle, which is required by realizability constraints. For $x/C=0.8$
as shown in figures 13(a) and 14(a), all the turbulence states are concentrated at the right corner of the Lumley triangle. This indicates that most of the turbulence at this location, before the transition onset occurs (see figure 6), corresponds to 1C and 2C turbulence. For the near-wall region, the turbulence state is seen to approach the two-component state at all six locations and then progresses along the ‘axisymmetric expansion’ line (similar to that in the log region of a channel flow (Pope Reference Pope2000)) and ending in the upper portion of the ‘two-component turbulence’ line. However, the manner in which this process takes place varies at different locations. Within the separation zone close to the reattachment point,
$x/C=0.8$
as shown in figures 13(a) and 14(a), all the turbulence states are concentrated at the right corner of the Lumley triangle. This indicates that most of the turbulence at this location, before the transition onset occurs (see figure 6), corresponds to 1C and 2C turbulence. For the near-wall region, the turbulence state is seen to approach the two-component state at all six locations and then progresses along the ‘axisymmetric expansion’ line (similar to that in the log region of a channel flow (Pope Reference Pope2000)) and ending in the upper portion of the ‘two-component turbulence’ line. However, the manner in which this process takes place varies at different locations. Within the separation zone close to the reattachment point, $x/C=0.92$
and
$x/C=0.92$
and $x/C=0.94$
, some points are close to the ‘axisymmetric contraction’ line, similar to observations in a developed free shear layer (Bell & Mehta Reference Bell and Mehta1990). For flow close to the trailing edge (
$x/C=0.94$
, some points are close to the ‘axisymmetric contraction’ line, similar to observations in a developed free shear layer (Bell & Mehta Reference Bell and Mehta1990). For flow close to the trailing edge ( $x/C=0.96$
and
$x/C=0.96$
and $x/C=0.98$
), the upper-right pointing arrow along the ‘axisymmetric expansion’ line (log-law region) signifies a state very different from that in a free shear layer.
$x/C=0.98$
), the upper-right pointing arrow along the ‘axisymmetric expansion’ line (log-law region) signifies a state very different from that in a free shear layer.
6.3 Moderate Reynolds number
$Re_{c}=10^{5}$
case

Figure 15 shows the loci associated with traversals in the vertical direction at six locations ( $x/C=0.4,0.45,0.5,0.65,0.8,0.95$
) along the suction surface of the NACA0018 airfoil. Substantially, the state of turbulence follows the same locus as observed in the NACA0012 case. A point of difference is that most turbulence states are concentrated on the ‘two-component turbulence’ line in the NACA0012 case, while most points concentrate near the ‘axisymmetric expansion’ and ‘axisymmetric contraction’ lines except for the flow in the separation zone (
$x/C=0.4,0.45,0.5,0.65,0.8,0.95$
) along the suction surface of the NACA0018 airfoil. Substantially, the state of turbulence follows the same locus as observed in the NACA0012 case. A point of difference is that most turbulence states are concentrated on the ‘two-component turbulence’ line in the NACA0012 case, while most points concentrate near the ‘axisymmetric expansion’ and ‘axisymmetric contraction’ lines except for the flow in the separation zone ( $x/C=0.4$
). This is very similar to the observation in the post-recirculation zone of channel flow with periodic hills at
$x/C=0.4$
). This is very similar to the observation in the post-recirculation zone of channel flow with periodic hills at $Re_{h}=10\,595$
(Fröhlich et al.
Reference Fröhlich, Mellen, Rodi, Temmerman and Leschziner2005). The backward-moving shear flow in the separation zone behaves similarly to a thin boundary layer as the wall is approached, and thus the flow structure has to approach the two-component limit at the wall. After the separation bubble, the shear layer develops, with more points concentrated on the ‘axisymmetric contraction’ line after the log-law region.
$Re_{h}=10\,595$
(Fröhlich et al.
Reference Fröhlich, Mellen, Rodi, Temmerman and Leschziner2005). The backward-moving shear flow in the separation zone behaves similarly to a thin boundary layer as the wall is approached, and thus the flow structure has to approach the two-component limit at the wall. After the separation bubble, the shear layer develops, with more points concentrated on the ‘axisymmetric contraction’ line after the log-law region.
6.4 High Reynolds number
$Re_{c}=2.1\times 10^{6}$
case

Figure 16 shows the loci associated with traversals in the vertical direction at eight locations ( $x/C=0.35,0.55,0.7,0.8,0.85,0.90,0.94,0.96$
) along the suction surface of the A-airfoil. The loci vary significantly at different locations. In the attached zone,
$x/C=0.35,0.55,0.7,0.8,0.85,0.90,0.94,0.96$
) along the suction surface of the A-airfoil. The loci vary significantly at different locations. In the attached zone, $x/C=0.35,0.55,0.7,0.8,0.85$
, the locus of the turbulence state follows a similar approach beyond the wall, i.e. from 2C turbulence to log-law region, and then free shear-layer region. As the location moves closer towards the separation point fewer points concentrate along the ‘axisymmetric contraction’ line. In the recirculation zone,
$x/C=0.35,0.55,0.7,0.8,0.85$
, the locus of the turbulence state follows a similar approach beyond the wall, i.e. from 2C turbulence to log-law region, and then free shear-layer region. As the location moves closer towards the separation point fewer points concentrate along the ‘axisymmetric contraction’ line. In the recirculation zone, $x/C=0.9,0.94,0.96$
, most of the states are clustered along the ‘axisymmetric expansion’ line although a portion of the locus approaches the ‘axisymmetric contraction’ line. In the present case, the anisotropy in a free shear layer is considerably lower than that in a near-wall layer, and thus the turbulence state never approaches the two-component state at the end.
$x/C=0.9,0.94,0.96$
, most of the states are clustered along the ‘axisymmetric expansion’ line although a portion of the locus approaches the ‘axisymmetric contraction’ line. In the present case, the anisotropy in a free shear layer is considerably lower than that in a near-wall layer, and thus the turbulence state never approaches the two-component state at the end.
7 Unsteady flow separation and reattachment
It is evident that the time- and spanwise-averaged skin friction (i.e. $C_{f}$
-plot) at the airfoil surface provides much useful information for interpreting separation and reattachment behaviour. However, these mean-flow concepts are insufficient to fully understand the flow physics in its entirety including the unsteady force load and temporal turbulent transition that are seen in these aerodynamic flows. Such unsteady flow behaviour manifested near the trailing edge may result in detrimental phenomena such as airfoil vibration. In the present section, we attempt to understand the unsteady flow behaviour through a presentation of skin-friction lines, i.e. curves tangent to the local skin-friction vector and interpreted as limiting streamlines for the near-wall flow. We also use the plot of the spanwise-averaged flow field to illustrate the skin-friction lines.
$C_{f}$
-plot) at the airfoil surface provides much useful information for interpreting separation and reattachment behaviour. However, these mean-flow concepts are insufficient to fully understand the flow physics in its entirety including the unsteady force load and temporal turbulent transition that are seen in these aerodynamic flows. Such unsteady flow behaviour manifested near the trailing edge may result in detrimental phenomena such as airfoil vibration. In the present section, we attempt to understand the unsteady flow behaviour through a presentation of skin-friction lines, i.e. curves tangent to the local skin-friction vector and interpreted as limiting streamlines for the near-wall flow. We also use the plot of the spanwise-averaged flow field to illustrate the skin-friction lines.
We briefly digress to discuss flow past circular smooth, and grooved cylinders referring to the recent work by Cheng et al. (Reference Cheng, Pullin, Samtaney, Zhang and Gao2017, Reference Cheng, Pullin and Samtaney2018a
). In this series of study, the sudden change of aerodynamic force (the drag crisis) around the cylinder is ascribed to the unsteady interaction of primary separation and secondary separation behaviour. This unsteady separation interaction effect and the turbulent transition effect both appear in the drag crisis of flow past a smooth cylinder. On the other hand, for the grooved cylinder the unsteady separation interaction effect still dominates the flow and results in a similar drag crisis phenomenon, but the turbulent transition effect is difficult to discern. In the present study of flow past airfoils, we note that the airfoil itself has smoothly varying curvature along its surface ranging from large curvature near the stagnation point to zero curvature near the trailing edge (excluding the sharp trailing edge point). While the airfoil is clearly different from a smooth cylinder of constant curvature, and also different from a grooved cylinder with larger curvature change over short distances, it is nonetheless interesting and instructive to examine the instantaneous flow field. The discussion presented here focuses on time sequences of the flow and examines the correspondences between the spanwise-averaged streamlines, the spanwise-averaged skin-friction coefficient $C_{f}$
and the surface streamlines on the upper or suction side of the airfoil under consideration.
$C_{f}$
and the surface streamlines on the upper or suction side of the airfoil under consideration.
Time history of $\tilde{u} (t)/U_{\infty }$
at the first grid point at specified streamwise locations. (a) NACA0012,
$\tilde{u} (t)/U_{\infty }$
at the first grid point at specified streamwise locations. (a) NACA0012, $Re_{c}=10^{4}$
,
$Re_{c}=10^{4}$
, $x/C=0.96$
; (b) NACA0018,
$x/C=0.96$
; (b) NACA0018, $Re_{c}=10^{5}$
,
$Re_{c}=10^{5}$
, $x/C=0.35$
; (c) Aérospatiale A-airfoil,
$x/C=0.35$
; (c) Aérospatiale A-airfoil, $Re_{c}=2.1\times 10^{6}$
,
$Re_{c}=2.1\times 10^{6}$
, $x/C=0.882$
. The marked points denote the selected time instances for analysing the unsteady separation behaviour in the near-wall regions.
$x/C=0.882$
. The marked points denote the selected time instances for analysing the unsteady separation behaviour in the near-wall regions.
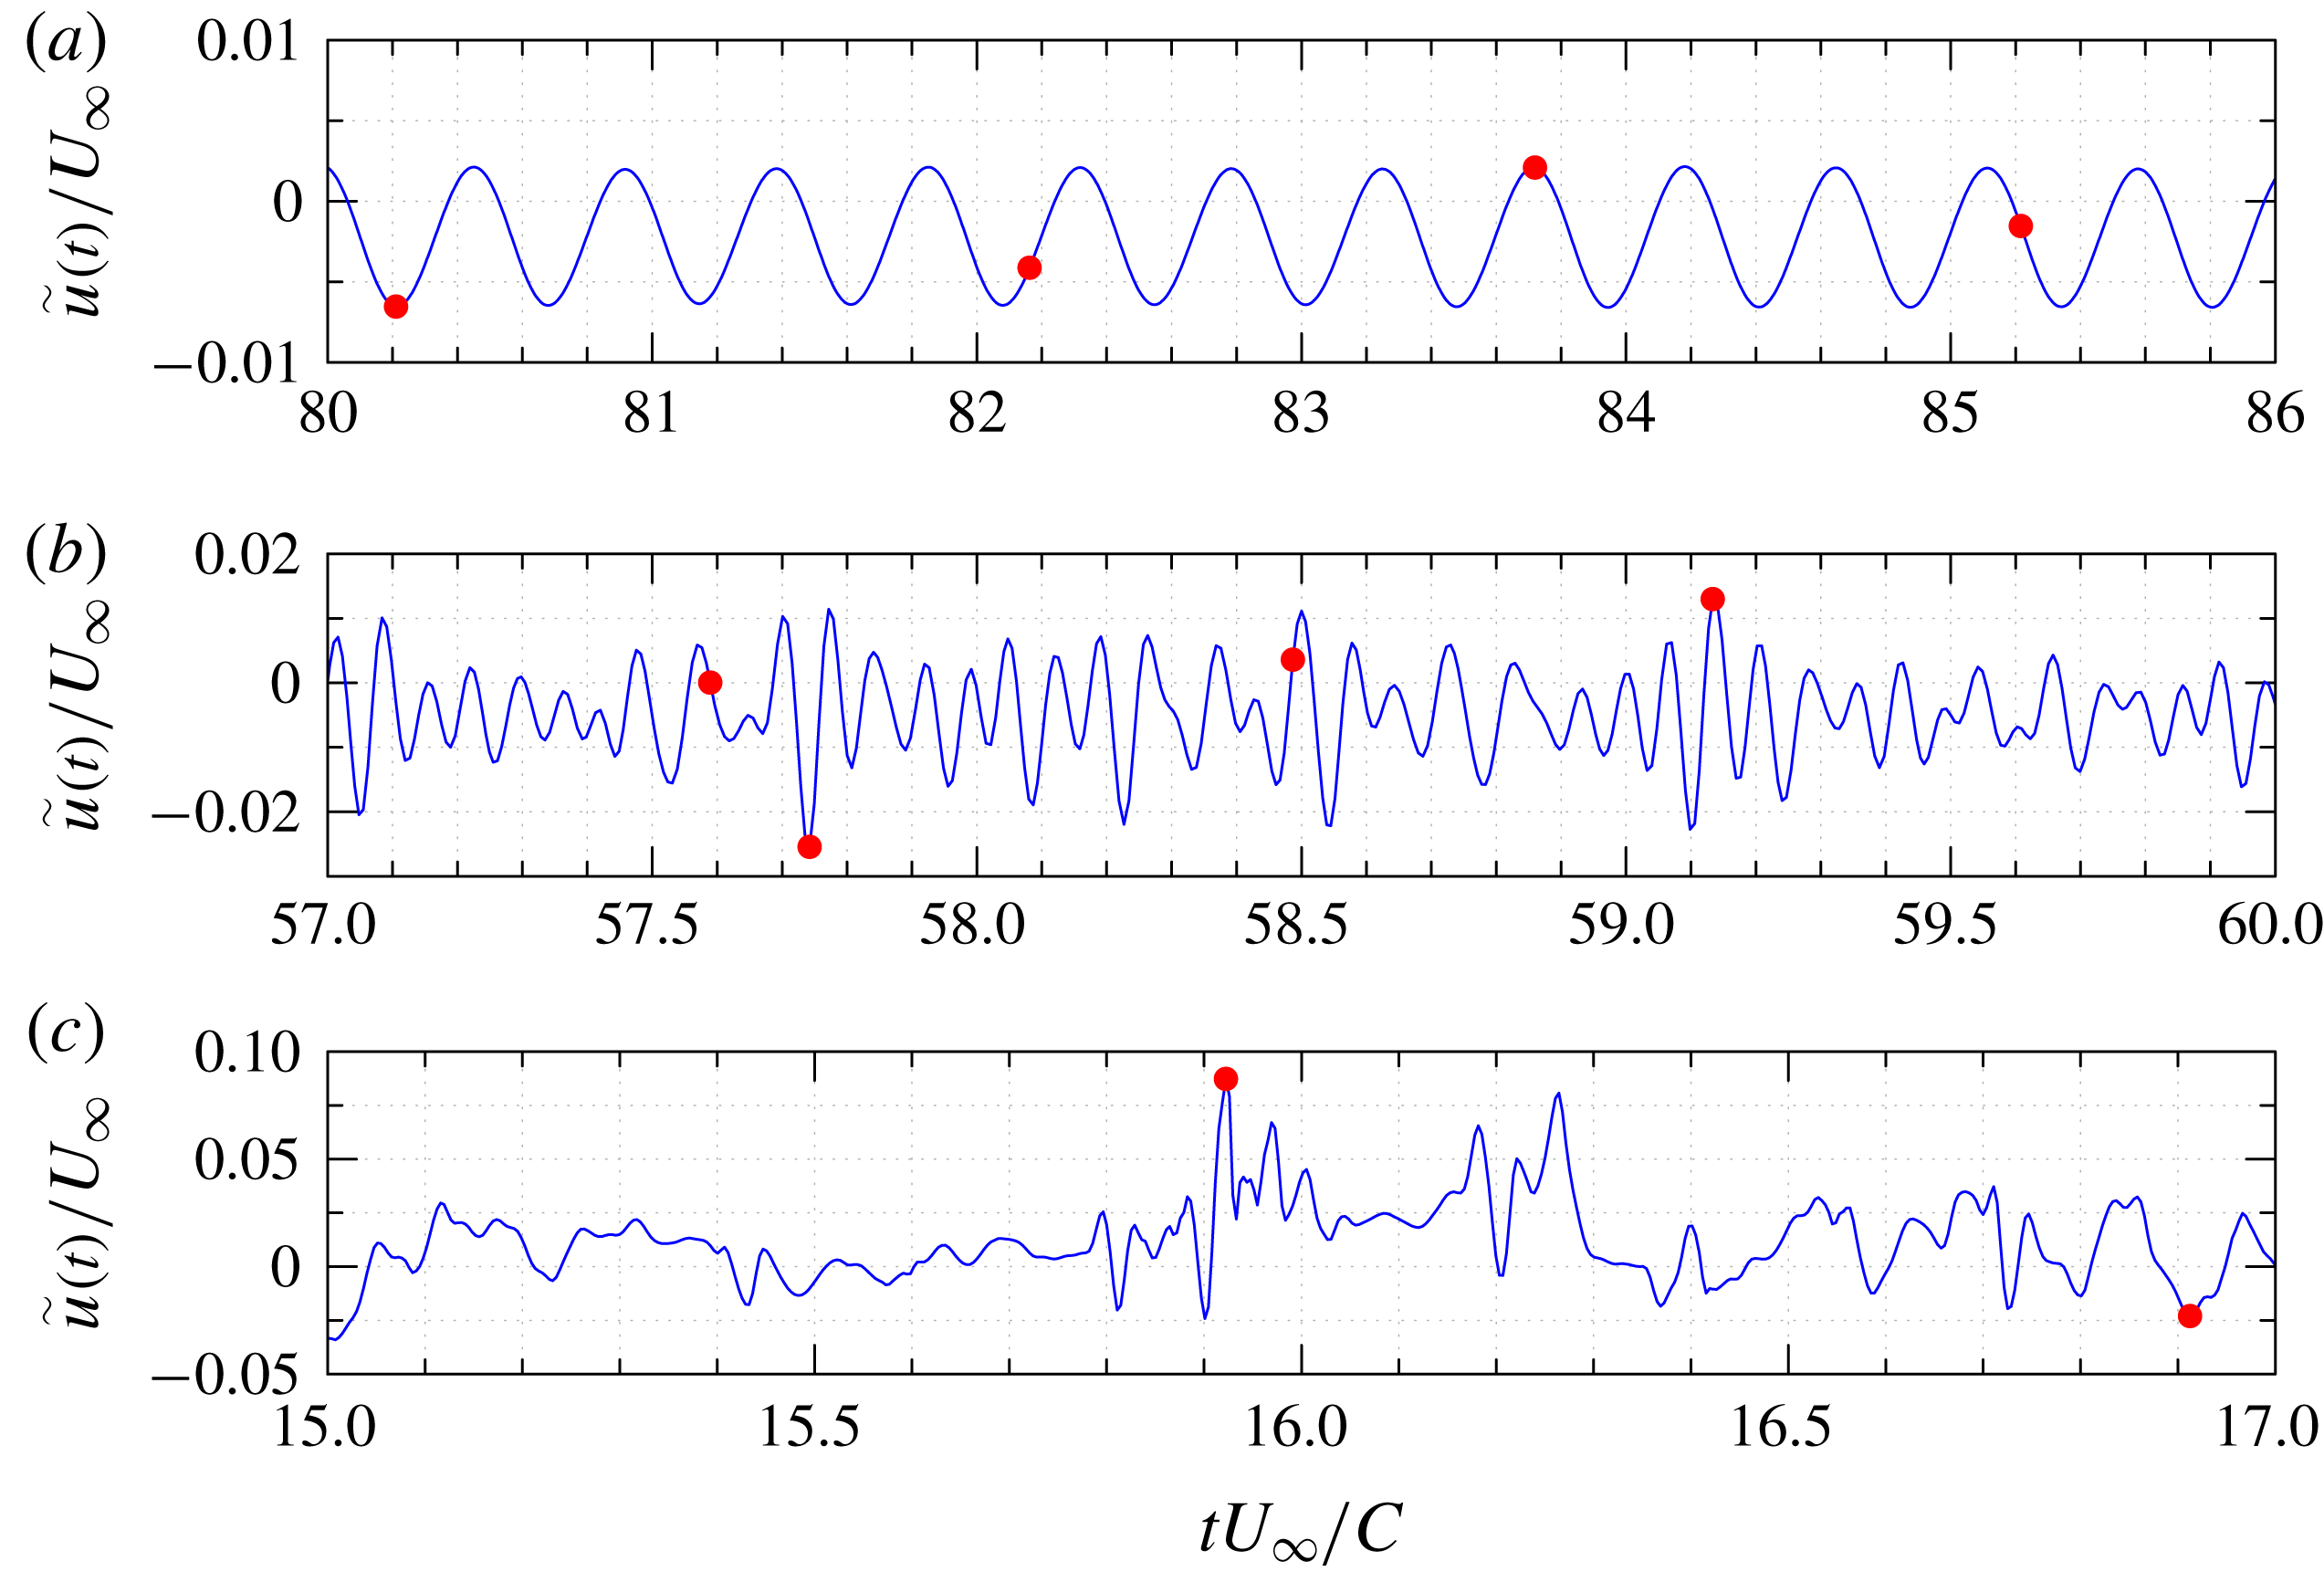
NACA0012, $Re_{c}=10^{4}$
. The separation behaviour on the suction side at different instants. (a)
$Re_{c}=10^{4}$
. The separation behaviour on the suction side at different instants. (a) $t=80.21C/U_{\infty }$
; (b)
$t=80.21C/U_{\infty }$
; (b) $t=82.16C/U_{\infty }$
; (c)
$t=82.16C/U_{\infty }$
; (c) $t=83.72C/U_{\infty }$
; (d)
$t=83.72C/U_{\infty }$
; (d) $t=85.22C/U_{\infty }$
. For each panel: top, the instantaneous spanwise-averaged friction coefficient
$t=85.22C/U_{\infty }$
. For each panel: top, the instantaneous spanwise-averaged friction coefficient $C_{f}$
; middle, streamlines of the instantaneous spanwise-averaged flow filed; bottom, the skin-friction trajectories.
$C_{f}$
; middle, streamlines of the instantaneous spanwise-averaged flow filed; bottom, the skin-friction trajectories.

NACA0018, $Re_{c}=10^{5}$
. The separation behaviour on the suction side at different instants: (a)
$Re_{c}=10^{5}$
. The separation behaviour on the suction side at different instants: (a) $t=57.59C/U_{\infty }$
; (b)
$t=57.59C/U_{\infty }$
; (b) $t=57.74C/U_{\infty }$
; (c)
$t=57.74C/U_{\infty }$
; (c) $t=58.49C/U_{\infty }$
; (d)
$t=58.49C/U_{\infty }$
; (d) $t=59.13C/U_{\infty }$
. For each panel: top, the instantaneous spanwise-averaged friction coefficient
$t=59.13C/U_{\infty }$
. For each panel: top, the instantaneous spanwise-averaged friction coefficient $C_{f}$
; middle, streamlines of the instantaneous spanwise-averaged flow filed; bottom, the skin-friction trajectories.
$C_{f}$
; middle, streamlines of the instantaneous spanwise-averaged flow filed; bottom, the skin-friction trajectories.
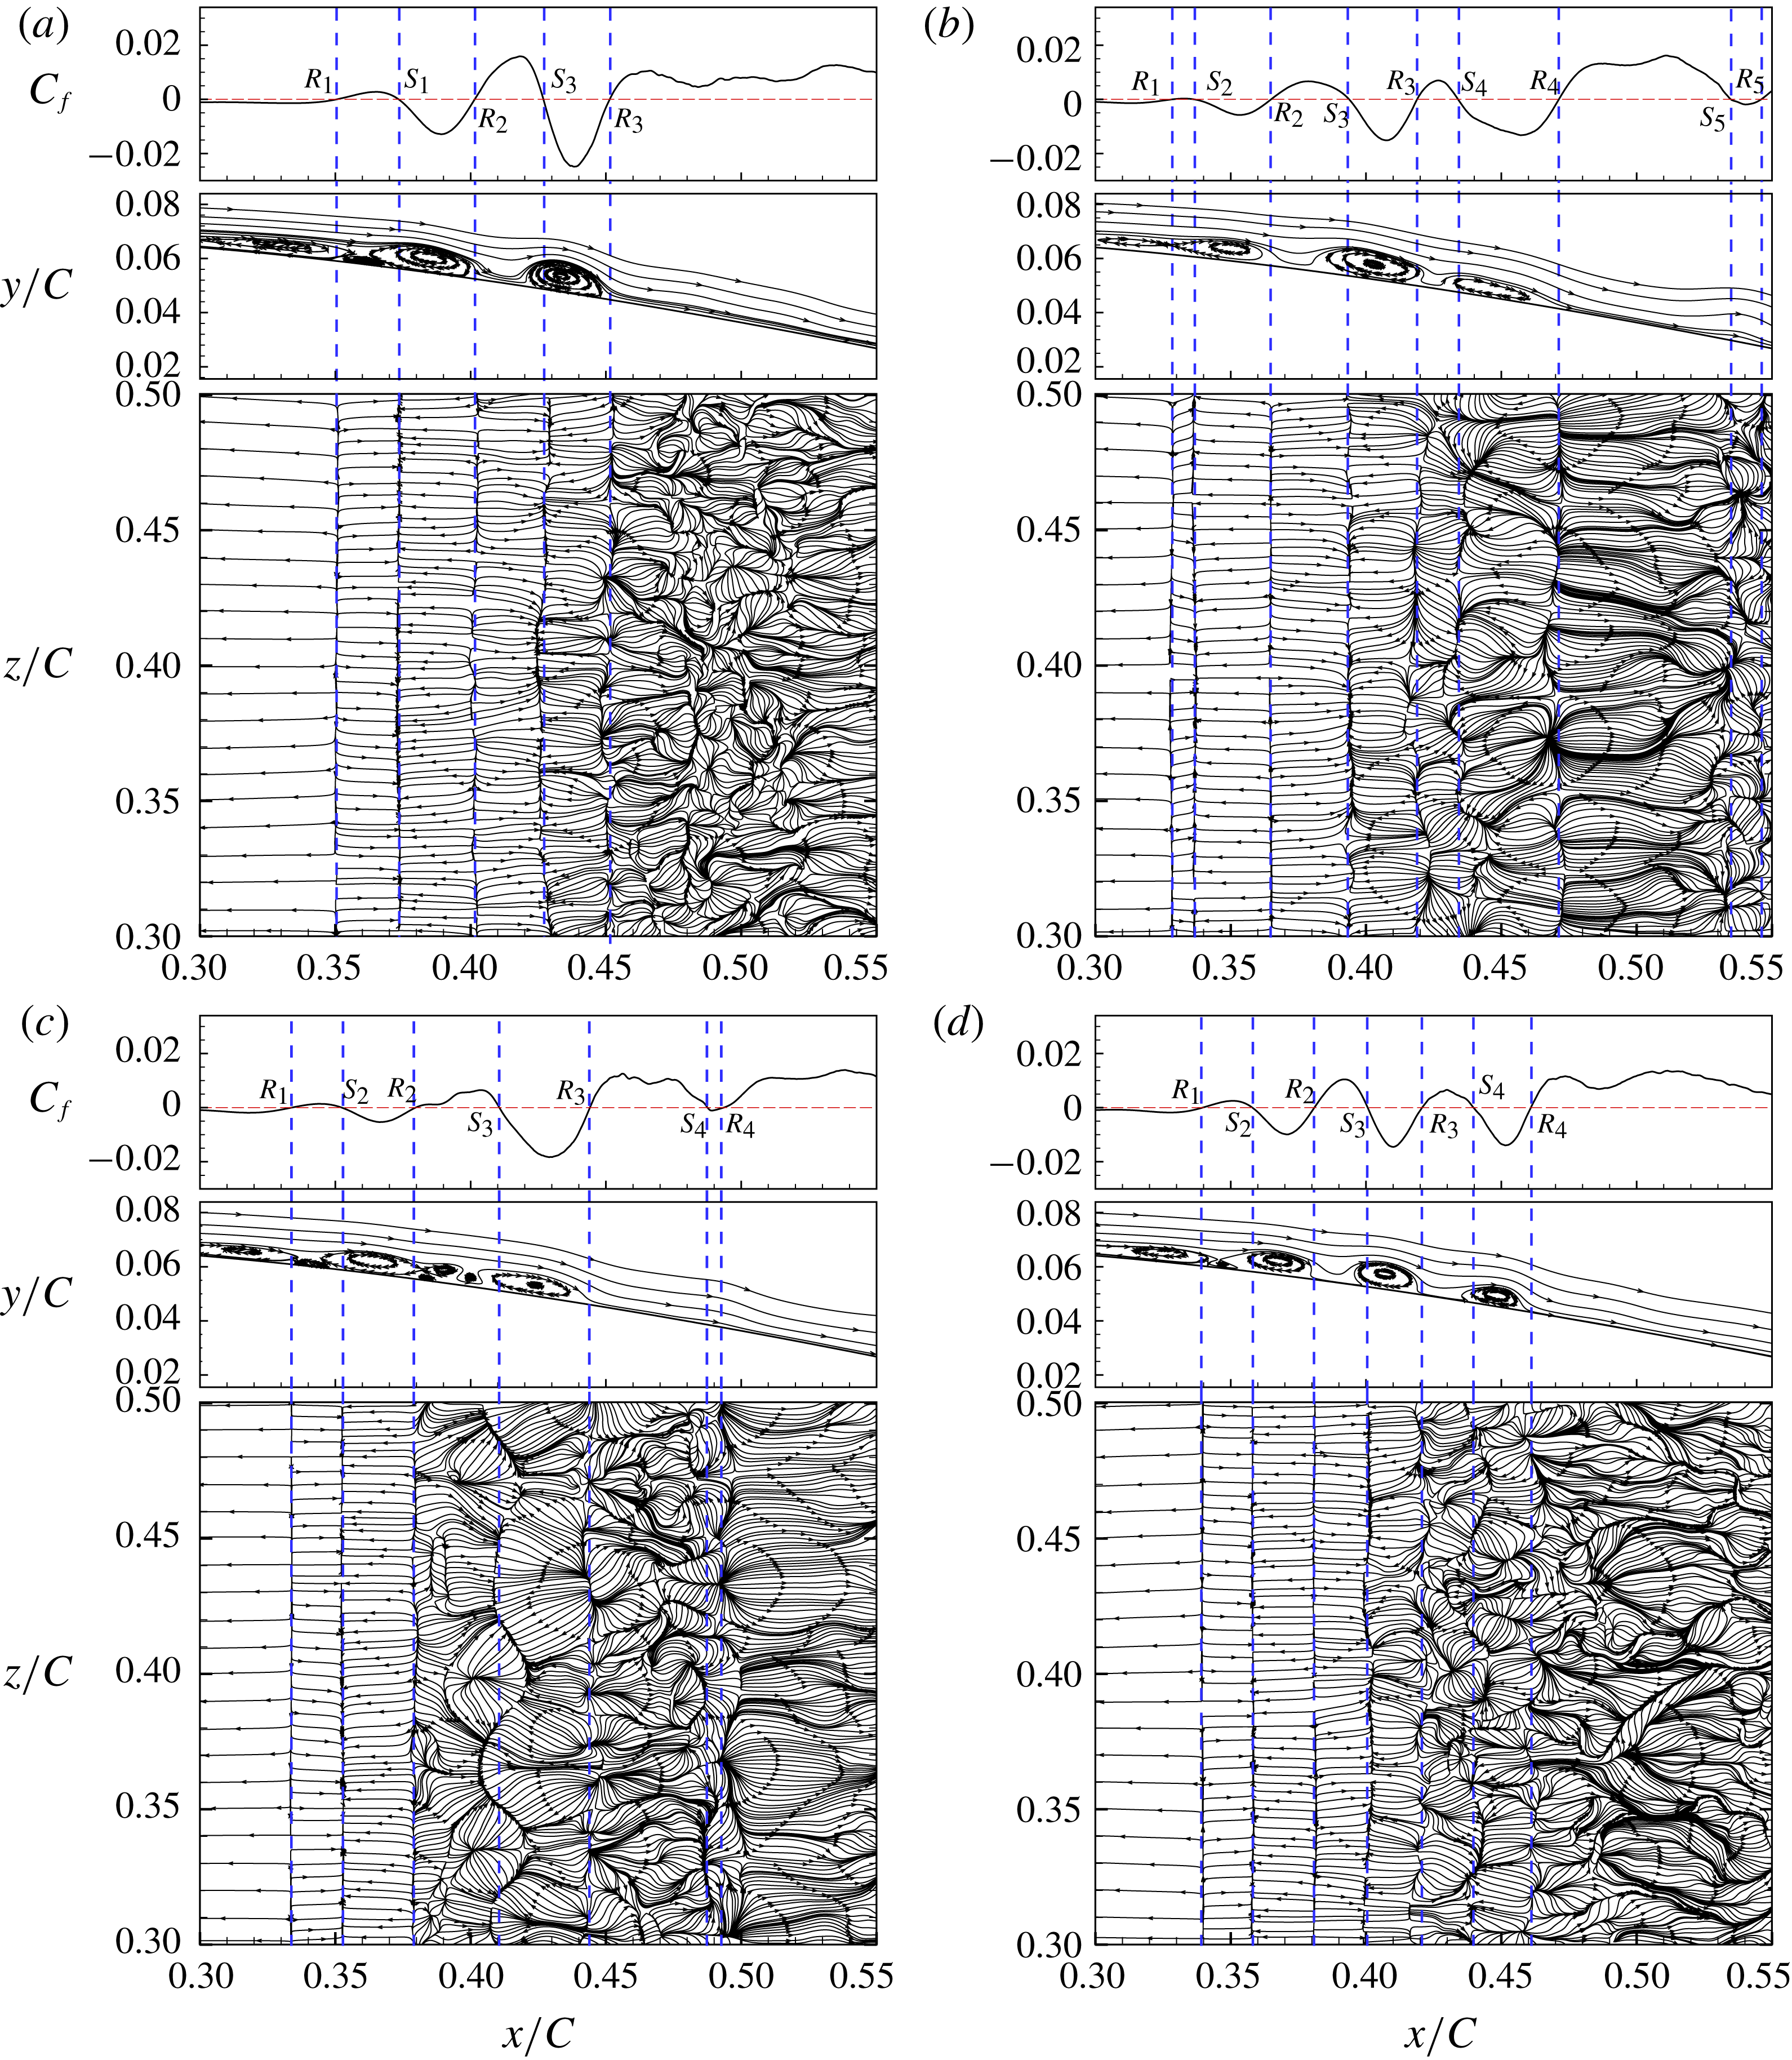
Analysing the unsteady flow patterns is a challenging task owing to the vast amount of data generated in these unsteady 3-D simulations. A rational approach is warranted to identifying key time instants where the flow separation behaviour shows significant differences. Here we use a time evolution instantaneous $\tilde{u} (t)/U_{\infty }$
for all three cases at specified monitoring points (see figure 17) to aid the selection of specific time instances for a closer examination of surface streamlines (discussed in the ensuing sub-sections).
$\tilde{u} (t)/U_{\infty }$
for all three cases at specified monitoring points (see figure 17) to aid the selection of specific time instances for a closer examination of surface streamlines (discussed in the ensuing sub-sections).
7.1 Data analysis for three cases
For the NACA0012 airfoil, the monitoring point is located at $x/C=0.96$
inside the separation zone. As shown in figure 17(a), which shows a somewhat regular oscillation, four typical instantaneous snapshots of the near-wall flow field are chosen to analyse the surface skin-friction profiles: two corresponding to a local maximum and minimum, and one each corresponding to the upward and downward flow speed.
$x/C=0.96$
inside the separation zone. As shown in figure 17(a), which shows a somewhat regular oscillation, four typical instantaneous snapshots of the near-wall flow field are chosen to analyse the surface skin-friction profiles: two corresponding to a local maximum and minimum, and one each corresponding to the upward and downward flow speed.
For the NACA0018 airfoil, where the flow is still regular but with more than one dominant frequency, the monitoring point is located at $x/C=0.35$
. Four typical instantaneous snapshot of the near-wall flow field are adopted, as shown in figure 17(b), similar to the choice of the NACA0012 airfoil.
$x/C=0.35$
. Four typical instantaneous snapshot of the near-wall flow field are adopted, as shown in figure 17(b), similar to the choice of the NACA0012 airfoil.
For the A-airfoil, the monitoring point is located at $x/C=0.882$
. Only two typical instantaneous snapshot of the near-wall flow field are chosen: one at a local maximum and the other at a local minimum (see figure 17
c), due to strongly random variations of
$x/C=0.882$
. Only two typical instantaneous snapshot of the near-wall flow field are chosen: one at a local maximum and the other at a local minimum (see figure 17
c), due to strongly random variations of $\tilde{u} (t)/U_{\infty }$
.
$\tilde{u} (t)/U_{\infty }$
.
For every time instant analysed in the next several plots, we use the spanwise-averaged wall-parallel skin-friction coefficient $C_{f}$
, spanwise-averaged streamlines and skin-friction lines of the instantaneous skin-friction vector
$C_{f}$
, spanwise-averaged streamlines and skin-friction lines of the instantaneous skin-friction vector $\boldsymbol{C}_{\boldsymbol{f}}$
. These include figure 18 for the case of
$\boldsymbol{C}_{\boldsymbol{f}}$
. These include figure 18 for the case of $Re_{c}=10^{4}$
, figure 19 for the case of
$Re_{c}=10^{4}$
, figure 19 for the case of $Re_{c}=10^{5}$
and figure 20 for the case of
$Re_{c}=10^{5}$
and figure 20 for the case of $Re_{c}=2.1\times 10^{6}$
.
$Re_{c}=2.1\times 10^{6}$
.
In every plot, we show a dashed line to represent every zero-crossing point in the spanwise-averaged $C_{f}$
plot, and label it as
$C_{f}$
plot, and label it as $S_{i}$
if the flow is separating or
$S_{i}$
if the flow is separating or $R_{i}$
if reattaching. It should be emphasized that, due to the prevalence of many local separation/reattachment bubbles, sometimes it is difficult to recognize the separation point and reattachment for a given specific bubble and thus the subscript is not exactly related to a fixed bubble. We label the subscript
$R_{i}$
if reattaching. It should be emphasized that, due to the prevalence of many local separation/reattachment bubbles, sometimes it is difficult to recognize the separation point and reattachment for a given specific bubble and thus the subscript is not exactly related to a fixed bubble. We label the subscript $i$
only for counting the critical points along the flow direction.
$i$
only for counting the critical points along the flow direction.
7.2
$Re_{c}=10^{4}$

In § 5.1 where the WMLES results are verified against DNS of the NACA0012 case at $Re_{c}=10^{4}$
, we observe shear layer turbulent transition at approximately
$Re_{c}=10^{4}$
, we observe shear layer turbulent transition at approximately $x/C=0.92$
, which is very close to the trailing edge. In figure 18, there is a primary separation point, denoted
$x/C=0.92$
, which is very close to the trailing edge. In figure 18, there is a primary separation point, denoted $S_{1}$
in all the figures at
$S_{1}$
in all the figures at $x/C=0.32$
: this is identified as the first zero crossing of
$x/C=0.32$
: this is identified as the first zero crossing of $C_{f}$
and remains virtually unchanged for the entire time sequence. The correspondence between the spanwise-averaged streamlines,
$C_{f}$
and remains virtually unchanged for the entire time sequence. The correspondence between the spanwise-averaged streamlines, $C_{f}$
and surface streamlines, marked by a dashed blue line, is clear. Moreover, in the neighbourhood of the separation line on the airfoil surface, the surface streamlines are straight with no spanwise components, and converge at
$C_{f}$
and surface streamlines, marked by a dashed blue line, is clear. Moreover, in the neighbourhood of the separation line on the airfoil surface, the surface streamlines are straight with no spanwise components, and converge at $x/C=0.32$
. This is indicative of the fact that the flow is virtually two-dimensional with no spanwise variation until the primary separation line
$x/C=0.32$
. This is indicative of the fact that the flow is virtually two-dimensional with no spanwise variation until the primary separation line $S_{1}$
. This separation point
$S_{1}$
. This separation point $S_{1}$
marks the beginning of the globally separated flow, and constitutes the ‘primary separation bubble’ (PSB). This bubble reattaches near the trailing edge, at point
$S_{1}$
marks the beginning of the globally separated flow, and constitutes the ‘primary separation bubble’ (PSB). This bubble reattaches near the trailing edge, at point $R_{2}$
in figure 18(a,b,d), but not in figure 18(c).
$R_{2}$
in figure 18(a,b,d), but not in figure 18(c).
Inside the PSB, the flow shows a small secondary separated zone which separates at $S_{2}$
and reattaches at
$S_{2}$
and reattaches at $R_{1}$
. On surface streamline plots, these near-wall separation and reattachment flows degenerate to bundles of diverging/converging streamlines. This secondary separation bubble is also observed in figure 18(a,b,d), while it is not observed in 18(c). It is clear that during the shedding process, part of the vorticity is extracted from the primary separation bubble and the secondary separation bubble. We note that the separation points (
$R_{1}$
. On surface streamline plots, these near-wall separation and reattachment flows degenerate to bundles of diverging/converging streamlines. This secondary separation bubble is also observed in figure 18(a,b,d), while it is not observed in 18(c). It is clear that during the shedding process, part of the vorticity is extracted from the primary separation bubble and the secondary separation bubble. We note that the separation points ( $S_{2}$
) of the secondary separation bubble, if it exists, remain at around
$S_{2}$
) of the secondary separation bubble, if it exists, remain at around $x/C=0.87$
,
$x/C=0.87$
, $0.94$
,
$0.94$
, $0.96$
; points which are close to the observed turbulent transition point through
$0.96$
; points which are close to the observed turbulent transition point through $-\overline{u^{\prime }v^{\prime }}$
. From this viewpoint, it is plausible to conclude the secondary separation bubble is related to shear-layer turbulent transition. Instead of considering the secondary separation bubble as a signature of turbulent transition, we prefer to suggest that the wall-attached bubble is a source of perturbations leading to the shear layer turbulent transition.
$-\overline{u^{\prime }v^{\prime }}$
. From this viewpoint, it is plausible to conclude the secondary separation bubble is related to shear-layer turbulent transition. Instead of considering the secondary separation bubble as a signature of turbulent transition, we prefer to suggest that the wall-attached bubble is a source of perturbations leading to the shear layer turbulent transition.
A-airfoil, $Re_{c}=2.1\times 10^{6}$
. The separation behaviour on the suction side at different instants. (a)
$Re_{c}=2.1\times 10^{6}$
. The separation behaviour on the suction side at different instants. (a) $t=15.92C/U_{\infty }$
; (b)
$t=15.92C/U_{\infty }$
; (b) $t=16.91C/U_{\infty }$
. For each panel: top, the instantaneous spanwise-averaged friction coefficient
$t=16.91C/U_{\infty }$
. For each panel: top, the instantaneous spanwise-averaged friction coefficient $C_{f}$
; middle, streamlines of the instantaneous spanwise-averaged flow filed; bottom, the skin-friction trajectories.
$C_{f}$
; middle, streamlines of the instantaneous spanwise-averaged flow filed; bottom, the skin-friction trajectories.
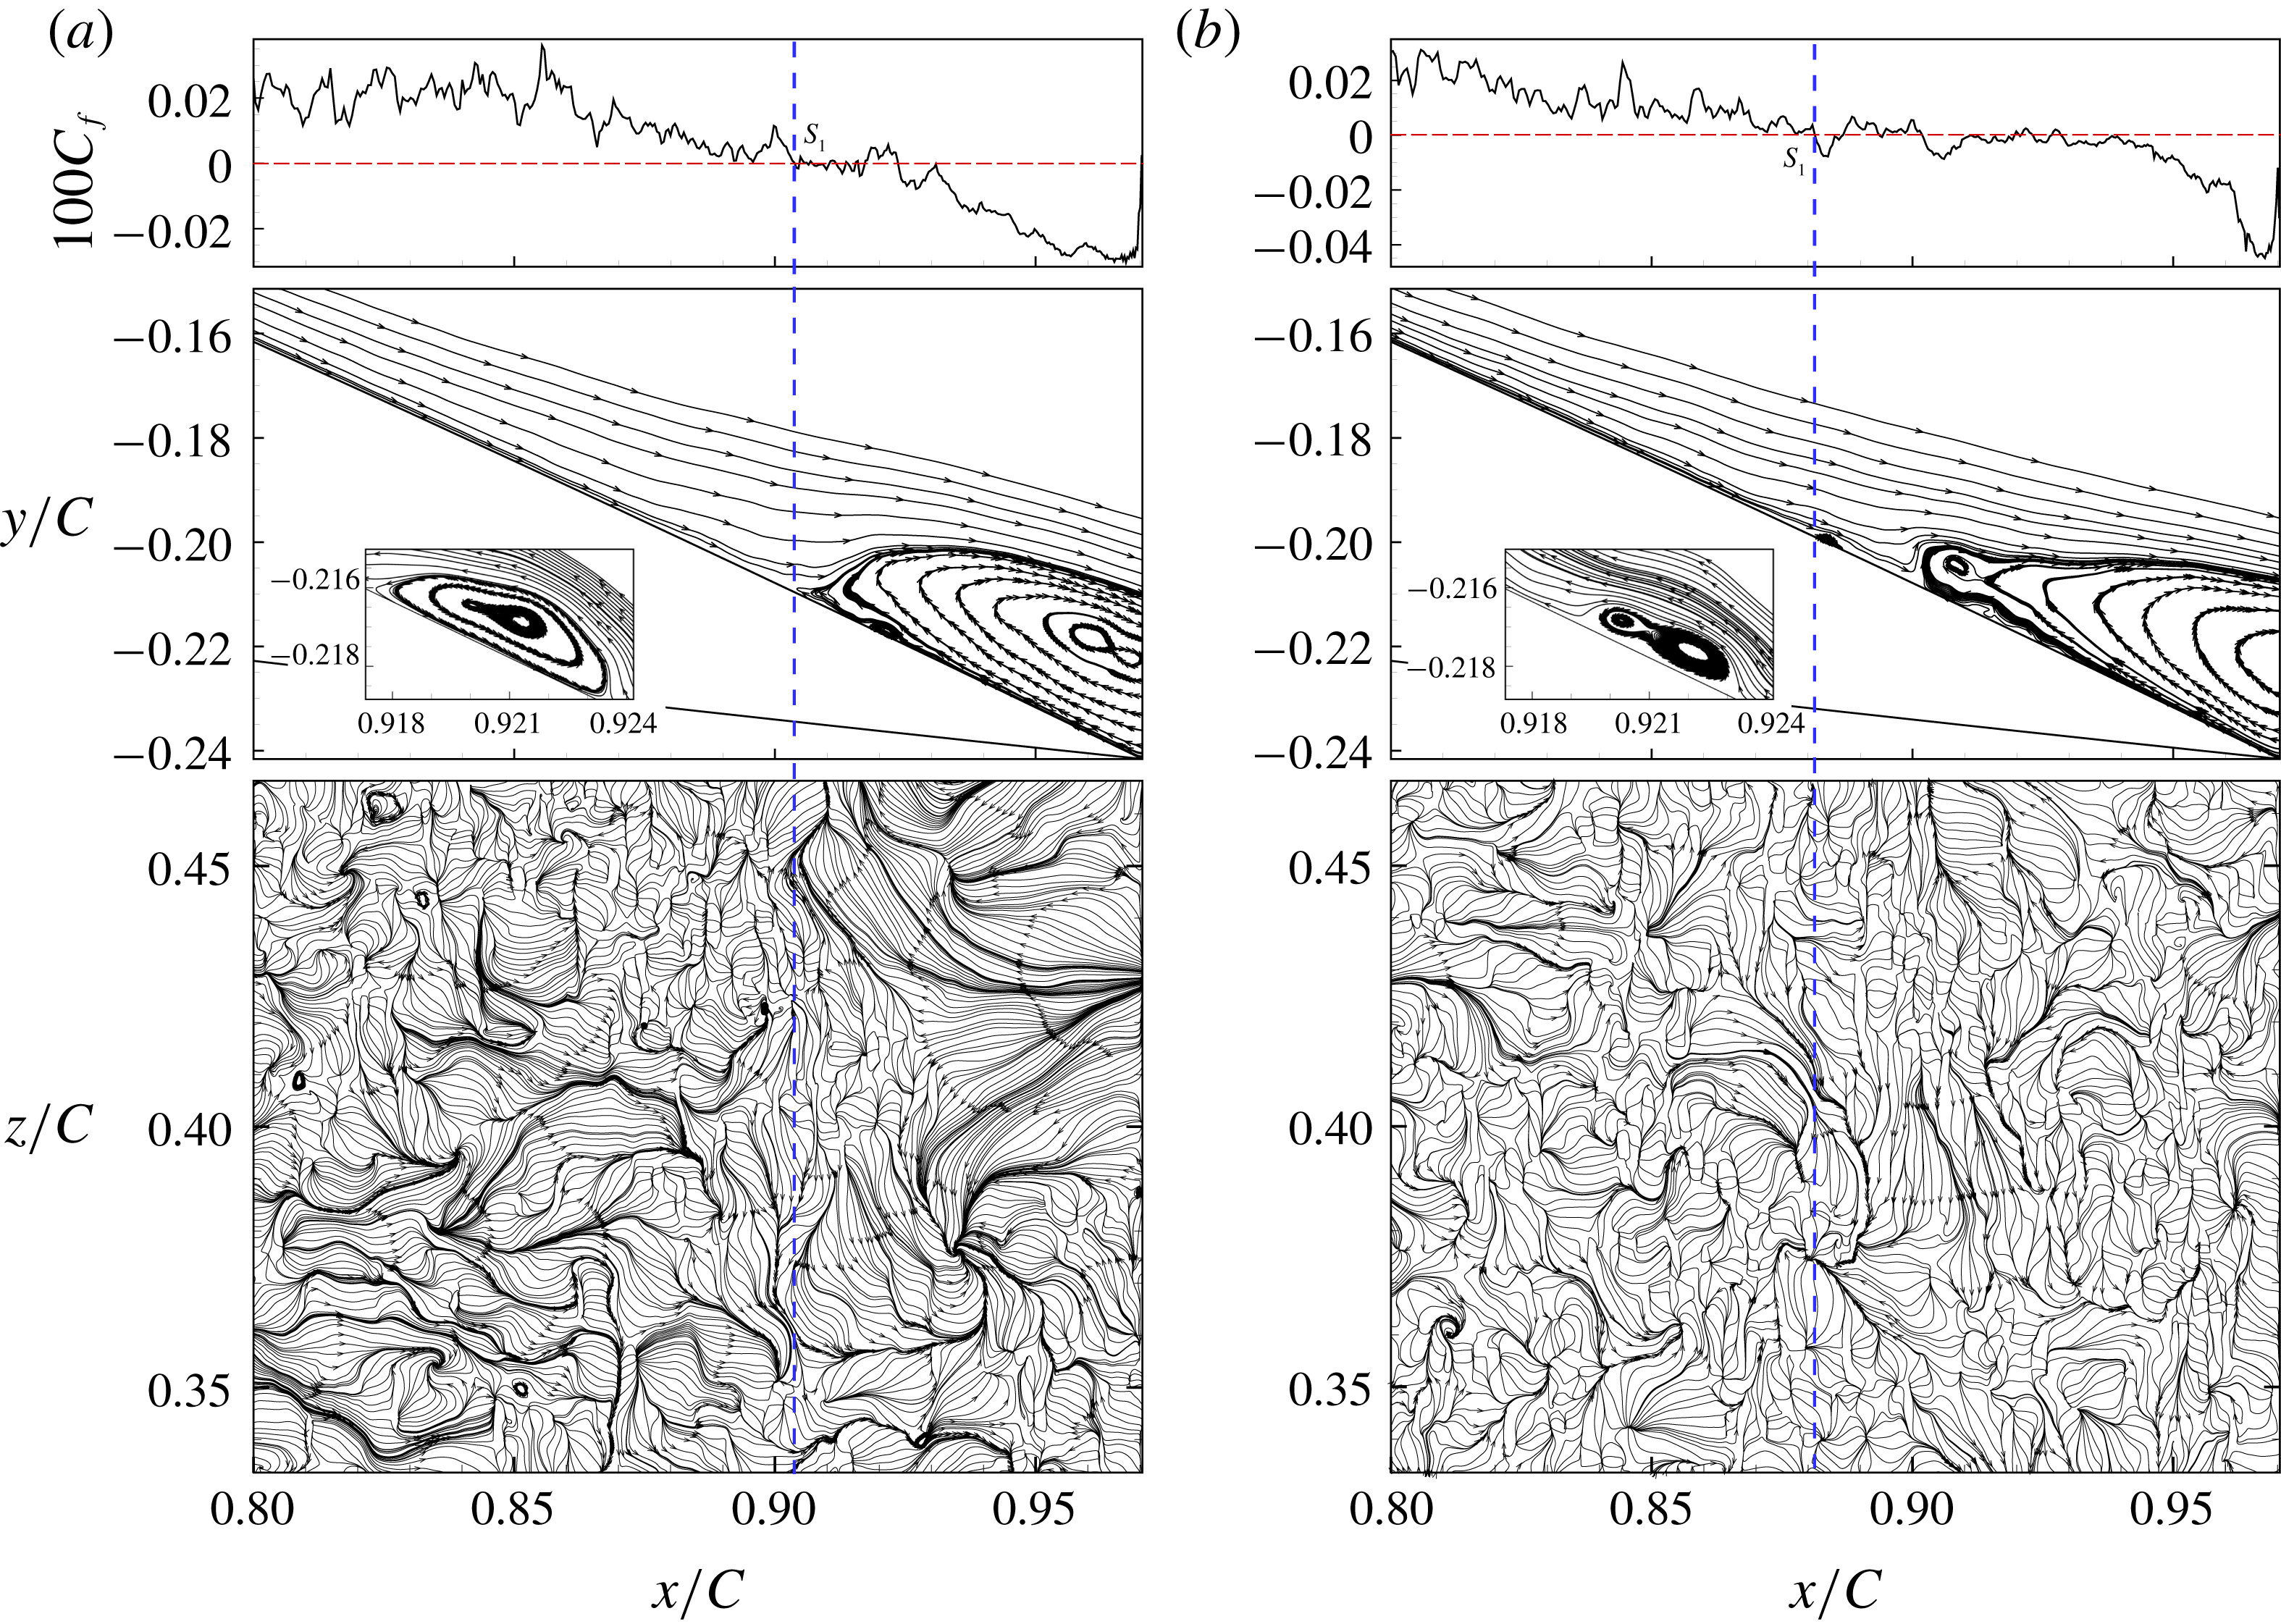
7.3
$Re_{c}=10^{5}$

Based on the time- and spanwise-averaged $(C_{p},C_{f})$
as plotted in figure 7 for the NACA0018 airfoil case, the turbulent boundary layer flow forms starting at approximately
$(C_{p},C_{f})$
as plotted in figure 7 for the NACA0018 airfoil case, the turbulent boundary layer flow forms starting at approximately $x/C=0.45$
. This turbulent boundary layer remains generally attached until the trailing edge. For this case, we mainly discuss the region of the transition part, which corresponding to the region
$x/C=0.45$
. This turbulent boundary layer remains generally attached until the trailing edge. For this case, we mainly discuss the region of the transition part, which corresponding to the region $x/C\in [0.3,0.55]$
on the suction side of the airfoil, as shown in each plot in figure 19. We note the separation point denoted
$x/C\in [0.3,0.55]$
on the suction side of the airfoil, as shown in each plot in figure 19. We note the separation point denoted $S_{1}$
, which is close to the leading edge, is not visible in the present plots.
$S_{1}$
, which is close to the leading edge, is not visible in the present plots.
A notable difference of the present case from the case of $Re_{c}=10^{4}$
is the disappearance of the primary separation bubble. For the NACA0018 case at
$Re_{c}=10^{4}$
is the disappearance of the primary separation bubble. For the NACA0018 case at $Re_{c}=10^{5}$
, the flow exhibits strong unsteadiness, and the separated flow somewhat breaks up into several small bubbles. Among the four plots of figure 19, we can see points of
$Re_{c}=10^{5}$
, the flow exhibits strong unsteadiness, and the separated flow somewhat breaks up into several small bubbles. Among the four plots of figure 19, we can see points of $R_{1}$
,
$R_{1}$
, $S_{2}$
,
$S_{2}$
, $R_{2}$
,
$R_{2}$
, $S_{3}$
and
$S_{3}$
and $R_{3}$
at all instants, but points
$R_{3}$
at all instants, but points $S_{4}$
,
$S_{4}$
, $R_{4}$
,
$R_{4}$
, $R_{5}$
and
$R_{5}$
and $R_{5}$
are seen only at some instants. Hence for this case, the interaction of several separation bubbles contributes to the shear-layer turbulent transition, and the flow, while more complex, may be considered as an extension of the mechanism in the case of
$R_{5}$
are seen only at some instants. Hence for this case, the interaction of several separation bubbles contributes to the shear-layer turbulent transition, and the flow, while more complex, may be considered as an extension of the mechanism in the case of $Re_{c}=10^{4}$
for NACA0012.
$Re_{c}=10^{4}$
for NACA0012.
Another interesting phenomenon for this case at $Re_{c}=10^{5}$
is the spanwise length scale. In figure 19(c), features with a length scale of a fraction of the spanwise domain size are observed in the plot of skin-friction lines. While the flow remains two-dimensional up to point
$Re_{c}=10^{5}$
is the spanwise length scale. In figure 19(c), features with a length scale of a fraction of the spanwise domain size are observed in the plot of skin-friction lines. While the flow remains two-dimensional up to point $R_{2}$
at approximately
$R_{2}$
at approximately $x/C=0.38$
, the spanwise variation beyond that point grows and a somewhat periodic behaviour in the spanwise direction is observed. At
$x/C=0.38$
, the spanwise variation beyond that point grows and a somewhat periodic behaviour in the spanwise direction is observed. At $x/C\approx 0.41$
, structures with a scale of approximately
$x/C\approx 0.41$
, structures with a scale of approximately $0.08C$
are noted. These structures keep breaking into small-scale structures in the downward region, until reaching the turbulent region. Here we briefly comment on our somewhat larger spanwise domain extent compared with other airfoil simulations in the literature. From the unsteady and irregular surface flow patterns in the higher Reynolds number case, we point out that airfoil simulations employing small spanwise domain sizes may not be able to faithfully reproduce the unsteady flow patterns observed in our LES.
$0.08C$
are noted. These structures keep breaking into small-scale structures in the downward region, until reaching the turbulent region. Here we briefly comment on our somewhat larger spanwise domain extent compared with other airfoil simulations in the literature. From the unsteady and irregular surface flow patterns in the higher Reynolds number case, we point out that airfoil simulations employing small spanwise domain sizes may not be able to faithfully reproduce the unsteady flow patterns observed in our LES.
7.4
$Re_{c}=2.1\times 10^{6}$

Flow at $Re_{c}=2.1\times 10^{6}$
endures not only shear-layer turbulent transition and corresponding attached turbulent boundary layer flow (shear-layer development and log-law region, see figure 16), but also turbulent separation, which is of interest here. In figure 20, we use data at two instants and plot the spanwise-averaged skin-friction coefficient, spanwise-averaged streamlines and surface streamlines, focusing on the turbulent separation region of
$Re_{c}=2.1\times 10^{6}$
endures not only shear-layer turbulent transition and corresponding attached turbulent boundary layer flow (shear-layer development and log-law region, see figure 16), but also turbulent separation, which is of interest here. In figure 20, we use data at two instants and plot the spanwise-averaged skin-friction coefficient, spanwise-averaged streamlines and surface streamlines, focusing on the turbulent separation region of $x/C\in [0.8,1.0]$
.
$x/C\in [0.8,1.0]$
.
Skin-friction lines at this high Reynolds number show features of a distinct length scale. In both plots, we can observe two distinct flows, with some large-scale structures corresponding to typical turbulent flow, and some small-scale structures which are essentially local separation/reattachment cells and are signatures of local flow reversals. The aggregation of those local reversal flows forms separation lines. It should be emphasized in this high $Re_{c}$
case, we do not discern clear instantaneous separation of the turbulent flow or small-scale reversal flows along the flow direction compared with the previous lower Reynolds number cases.
$Re_{c}$
case, we do not discern clear instantaneous separation of the turbulent flow or small-scale reversal flows along the flow direction compared with the previous lower Reynolds number cases.
7.5 Comparisons with other turbulent flows
It is interesting to compare the skin-friction portraits of airfoil flows to other canonical flows. When turbulent separation phenomenon takes place in turbulent boundary layer flow, as described by Chong et al. (Reference Chong, Soria, Perry, Chacin, Cantwell and Na1998), although a clear separation line cannot be observed, a region of small reversal flows is visible around the mean flow separation point. In flow past a circular cylinder, unsteady separation phenomena, especially the secondary separation/reattachment, dominate the mean features of the flow. For high Reynolds number cases, the unsteady secondary separation/reattachment can also be observed from instantaneous skin-friction portraits, revealed by the aggregation of small-scale reversal flows as noted in Cheng et al. (Reference Cheng, Pullin, Samtaney, Zhang and Gao2017), while the spanwise distribution does not show much difference. This kind of effect is artificially enhanced in the grooved cylinder case of Cheng et al. (Reference Cheng, Pullin and Samtaney2018a ), by using grooves distributed in the azimuthal direction while retaining the groove shape in the spanwise direction. Another case which also shows ordered small-scale reversal flows is that of a rotating cylinder as discussed in Cheng, Pullin & Samtaney (Reference Cheng, Pullin and Samtaney2018b ). In rotating cylinder, the lift crisis phenomenon, or so-called reverse Magnus effect, is found to be a result of flow reorganization due to the aggregation of small-scale separation/reattachment cells on the under and leeward parts of the cylinder surface. In this way, an ordered dividing line, which clearly shows upstream attached flow, and downstream small-scale reversal flows, is found to show little difference in the spanwise direction. This is quite similar to the turbulent separation in turbulent boundary layer flows.
However, in the present study of flow over airfoils, we note a stronger dependence or flow distortion in the spanwise distribution. In cases with $Re_{c}=10^{4}$
and
$Re_{c}=10^{4}$
and $10^{5}$
, along the flow evolution, we note the presence of local structures, with a variation in spanwise direction. Such structures show different intensities at different instants, for example, a strong deviation from separation point
$10^{5}$
, along the flow evolution, we note the presence of local structures, with a variation in spanwise direction. Such structures show different intensities at different instants, for example, a strong deviation from separation point $S_{3}$
in figure 19 at around
$S_{3}$
in figure 19 at around $x/C\approx 0.41$
. Strong spanwise distribution is even obvious for the turbulent separation case at
$x/C\approx 0.41$
. Strong spanwise distribution is even obvious for the turbulent separation case at $Re_{c}=2.1\times 10^{6}$
. In this case, a clear dividing line that separates the incoming flow and small-scale reversal flows is hardly observed, which is unlike what is seen in a flat-plate turbulent boundary layer and cylinder flows.
$Re_{c}=2.1\times 10^{6}$
. In this case, a clear dividing line that separates the incoming flow and small-scale reversal flows is hardly observed, which is unlike what is seen in a flat-plate turbulent boundary layer and cylinder flows.
In summary, airfoil flow shows quite similar but still exhibit unique behaviour compared to classical flows such as flow over a cylinder and turbulent boundary layer flow. In the case of $Re_{c}=10^{4}$
, a primary separation bubble and a secondary separation bubble are clearly visible and their interaction forms the source of shear-layer turbulent transition, which is similar to the flow over a smooth cylinder. In the case of
$Re_{c}=10^{4}$
, a primary separation bubble and a secondary separation bubble are clearly visible and their interaction forms the source of shear-layer turbulent transition, which is similar to the flow over a smooth cylinder. In the case of $Re_{c}=10^{5}$
, the separation region breaks into several unsteady bubbles and their interaction results in strong spanwise variation and further evolution into turbulence. This strong spanwise structure provides a reference length scale for reasonably predicting flows. For the case
$Re_{c}=10^{5}$
, the separation region breaks into several unsteady bubbles and their interaction results in strong spanwise variation and further evolution into turbulence. This strong spanwise structure provides a reference length scale for reasonably predicting flows. For the case $Re_{c}=2.1\times 10^{6}$
, besides the similar turbulent transition behaviour, the turbulent separation phenomenon is similar to flat-plate turbulent separation in the sense of small-scale reversal flows, but still possesses its own character due to vortex shedding.
$Re_{c}=2.1\times 10^{6}$
, besides the similar turbulent transition behaviour, the turbulent separation phenomenon is similar to flat-plate turbulent separation in the sense of small-scale reversal flows, but still possesses its own character due to vortex shedding.
8 Conclusion
In this study, we have presented results of wall-modelled large-eddy simulations of flow past three different airfoils (NACA0012, NACA0018 and A-airfoil) at Reynolds number varying from $Re_{c}=10^{4}$
to
$Re_{c}=10^{4}$
to $2.1\times 10^{6}$
. A Dirichlet boundary condition for the tangential velocity components is derived at a virtual wall in generalized curvilinear coordinates, which is coupled with an ordinary differential equation governing the wall shear stress (which is integrated analytically in time after some simplifying assumptions are made). We employ the stretched spiral vortex model for the SGS tensor in the computational domain. The numerical methodology is based on fourth-order spatial differencing, with a multigrid Poisson solver for the pressure utilizing Gauss–Seidel line smoothers. The formulation presented in generalized curvilinear coordinates opens up the possibility of using the proposed LES methodology with the associated wall models for a complex geometry.
$2.1\times 10^{6}$
. A Dirichlet boundary condition for the tangential velocity components is derived at a virtual wall in generalized curvilinear coordinates, which is coupled with an ordinary differential equation governing the wall shear stress (which is integrated analytically in time after some simplifying assumptions are made). We employ the stretched spiral vortex model for the SGS tensor in the computational domain. The numerical methodology is based on fourth-order spatial differencing, with a multigrid Poisson solver for the pressure utilizing Gauss–Seidel line smoothers. The formulation presented in generalized curvilinear coordinates opens up the possibility of using the proposed LES methodology with the associated wall models for a complex geometry.
At relative low Reynolds number ( $Re_{c}=10^{4}$
) detailed comparisons (velocity profiles, skin friction and Reynolds stresses) between the wall-modelled LES (WMLES) and DNS show excellent agreement including the capturing of a near trailing edge separation bubble on the suction side of the NACA0012 airfoil. For the NACA0018 airfoil case at moderately higher Reynolds number (
$Re_{c}=10^{4}$
) detailed comparisons (velocity profiles, skin friction and Reynolds stresses) between the wall-modelled LES (WMLES) and DNS show excellent agreement including the capturing of a near trailing edge separation bubble on the suction side of the NACA0012 airfoil. For the NACA0018 airfoil case at moderately higher Reynolds number ( $Re_{c}=10^{5}$
), comparisons with experiments of pressure coefficient, skin friction, average and r.m.s. velocity profiles show good agreement with the largest difference noted for the streamwise fluctuating velocity close to the reattachment point. For the A-airfoil, at even higher Reynolds number (
$Re_{c}=10^{5}$
), comparisons with experiments of pressure coefficient, skin friction, average and r.m.s. velocity profiles show good agreement with the largest difference noted for the streamwise fluctuating velocity close to the reattachment point. For the A-airfoil, at even higher Reynolds number ( $Re_{c}=2.1\times 10^{6}$
), good agreement between WMLES and experiments is noted: the WMLES does not capture the tiny separation bubble near the leading edge after time and spanwise averaging although flow reversals in instantaneous velocity are noted; moreover, the WMLES Reynolds stresses show trends that are in agreement with experiments.
$Re_{c}=2.1\times 10^{6}$
), good agreement between WMLES and experiments is noted: the WMLES does not capture the tiny separation bubble near the leading edge after time and spanwise averaging although flow reversals in instantaneous velocity are noted; moreover, the WMLES Reynolds stresses show trends that are in agreement with experiments.
In the present study, we also examined the anisotropy of the flow in the context of the Lumley triangle. We note that all points lie within the triangle, as required by the realizability condition. For the low Reynolds number case, we note that in the near-wall region the turbulence approaches the two-component state progressing along the axisymmetric expansion line similar to the case of the log region in a channel flow. Within the separation zone, the behaviour is similar to that of free shear layers, as expected. The moderate Reynolds number case behaves similarly to the lower Reynolds number case, and once again several points lie on the log-law region. For the highest Reynolds number case, we see signatures of progress from 2C turbulence to log law to free shear-layer flow; although in this case the anisotropy in the free shear layer is considerably lower.
In this study, we examined the surface streamlines for three airfoils at the three different Reynolds numbers. For the low Reynolds number case, we noted that the surface streamlines remain approximately aligned with the streamwise direction over a significant portion of the airfoil surface before significant meandering in the spanwise direction is observed. As the Reynolds number is increased, the surface streamline plots show significant departures from the streamwise direction, with several secondary separation and reattachment points that are very unsteady compared with the nearly steady primary separation point. These unsteady secondary separation/reattachment bubbles were also noted in previous wall-resolved LES by Cheng et al. (Reference Cheng, Pullin, Samtaney, Zhang and Gao2017) of flow past a circular cylinder. A reasonable conclusion is that the flow separation patterns show some coherence with separation/reattachment lines aligned along the spanwise direction before eventually becoming unsteady with no directional spanwise alignment in general for all cases.
Acknowledgements
The Cray XC40 Shaheen II at KAUST was used for all simulations reported. This research was partially supported under KAUST OCRF URF/1/1394-01 and under baseline research funds of R.S.
Appendix A. Equation for
$\langle q\rangle$

From the definition of $\tilde{u} _{s}$
, (3.10) and combining (3.8a
) and (3.8b
), we can obtain the streamwise momentum equation along the wall,
$\tilde{u} _{s}$
, (3.10) and combining (3.8a
) and (3.8b
), we can obtain the streamwise momentum equation along the wall,
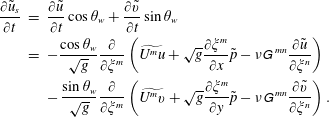 $$\begin{eqnarray}\displaystyle \frac{\unicode[STIX]{x2202}\tilde{u} _{s}}{\unicode[STIX]{x2202}t} & = & \displaystyle \frac{\unicode[STIX]{x2202}\tilde{u} }{\unicode[STIX]{x2202}t}\cos \unicode[STIX]{x1D703}_{w}+\frac{\unicode[STIX]{x2202}\tilde{v}}{\unicode[STIX]{x2202}t}\sin \unicode[STIX]{x1D703}_{w}\nonumber\\ \displaystyle & = & \displaystyle -\frac{\cos \unicode[STIX]{x1D703}_{w}}{\sqrt{g}}\frac{\unicode[STIX]{x2202}}{\unicode[STIX]{x2202}\unicode[STIX]{x1D709}^{m}}\left(\widetilde{U^{m}u}+\sqrt{g}\frac{\unicode[STIX]{x2202}\unicode[STIX]{x1D709}^{m}}{\unicode[STIX]{x2202}x}\tilde{p}-\unicode[STIX]{x1D708}\unicode[STIX]{x1D60E}^{\,mn}\frac{\unicode[STIX]{x2202}\tilde{u} }{\unicode[STIX]{x2202}\unicode[STIX]{x1D709}^{n}}\right)\nonumber\\ \displaystyle & & \displaystyle -\,\frac{\sin \unicode[STIX]{x1D703}_{w}}{\sqrt{g}}\frac{\unicode[STIX]{x2202}}{\unicode[STIX]{x2202}\unicode[STIX]{x1D709}^{m}}\left(\widetilde{U^{m}v}+\sqrt{g}\frac{\unicode[STIX]{x2202}\unicode[STIX]{x1D709}^{m}}{\unicode[STIX]{x2202}y}\tilde{p}-\unicode[STIX]{x1D708}\unicode[STIX]{x1D60E}^{\,mn}\frac{\unicode[STIX]{x2202}\tilde{v}}{\unicode[STIX]{x2202}\unicode[STIX]{x1D709}^{n}}\right).\end{eqnarray}$$
Then combining (3.8c ), (3.15) and (A 1), we can obtain
 $$\begin{eqnarray}\displaystyle \frac{\unicode[STIX]{x2202}\langle q\rangle }{\unicode[STIX]{x2202}t}=F_{\unicode[STIX]{x1D709}}+F_{\unicode[STIX]{x1D702}}+F_{\unicode[STIX]{x1D701}}, & & \displaystyle\end{eqnarray}$$
where
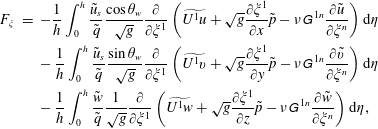 $$\begin{eqnarray}\displaystyle F_{\unicode[STIX]{x1D709}} & = & \displaystyle -\frac{1}{h}\int _{0}^{h}\frac{\tilde{u} _{s}}{\tilde{q}}\frac{\cos \unicode[STIX]{x1D703}_{w}}{\sqrt{g}}\frac{\unicode[STIX]{x2202}}{\unicode[STIX]{x2202}\unicode[STIX]{x1D709}^{1}}\left(\widetilde{U^{1}u}+\sqrt{g}\frac{\unicode[STIX]{x2202}\unicode[STIX]{x1D709}^{1}}{\unicode[STIX]{x2202}x}\tilde{p}-\unicode[STIX]{x1D708}\unicode[STIX]{x1D60E}^{\,1n}\frac{\unicode[STIX]{x2202}\tilde{u} }{\unicode[STIX]{x2202}\unicode[STIX]{x1D709}^{n}}\right)\text{d}\unicode[STIX]{x1D702}\nonumber\\ \displaystyle & & \displaystyle -\,\frac{1}{h}\int _{0}^{h}\frac{\tilde{u} _{s}}{\tilde{q}}\frac{\sin \unicode[STIX]{x1D703}_{w}}{\sqrt{g}}\frac{\unicode[STIX]{x2202}}{\unicode[STIX]{x2202}\unicode[STIX]{x1D709}^{1}}\left(\widetilde{U^{1}v}+\sqrt{g}\frac{\unicode[STIX]{x2202}\unicode[STIX]{x1D709}^{1}}{\unicode[STIX]{x2202}y}\tilde{p}-\unicode[STIX]{x1D708}\unicode[STIX]{x1D60E}^{\,1n}\frac{\unicode[STIX]{x2202}\tilde{v}}{\unicode[STIX]{x2202}\unicode[STIX]{x1D709}^{n}}\right)\text{d}\unicode[STIX]{x1D702}\nonumber\\ \displaystyle & & \displaystyle -\,\frac{1}{h}\int _{0}^{h}\frac{\tilde{w}}{\tilde{q}}\frac{1}{\sqrt{g}}\frac{\unicode[STIX]{x2202}}{\unicode[STIX]{x2202}\unicode[STIX]{x1D709}^{1}}\left(\widetilde{U^{1}w}+\sqrt{g}\frac{\unicode[STIX]{x2202}\unicode[STIX]{x1D709}^{1}}{\unicode[STIX]{x2202}z}\tilde{p}-\unicode[STIX]{x1D708}\unicode[STIX]{x1D60E}^{\,1n}\frac{\unicode[STIX]{x2202}\tilde{w}}{\unicode[STIX]{x2202}\unicode[STIX]{x1D709}^{n}}\right)\text{d}\unicode[STIX]{x1D702},\end{eqnarray}$$
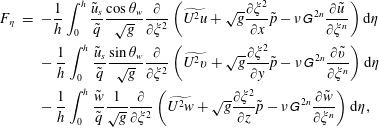 $$\begin{eqnarray}\displaystyle F_{\unicode[STIX]{x1D702}} & = & \displaystyle -\frac{1}{h}\int _{0}^{h}\frac{\tilde{u} _{s}}{\tilde{q}}\frac{\cos \unicode[STIX]{x1D703}_{w}}{\sqrt{g}}\frac{\unicode[STIX]{x2202}}{\unicode[STIX]{x2202}\unicode[STIX]{x1D709}^{2}}\left(\widetilde{U^{2}u}+\sqrt{g}\frac{\unicode[STIX]{x2202}\unicode[STIX]{x1D709}^{2}}{\unicode[STIX]{x2202}x}\tilde{p}-\unicode[STIX]{x1D708}\unicode[STIX]{x1D60E}^{\,2n}\frac{\unicode[STIX]{x2202}\tilde{u} }{\unicode[STIX]{x2202}\unicode[STIX]{x1D709}^{n}}\right)\text{d}\unicode[STIX]{x1D702}\nonumber\\ \displaystyle & & \displaystyle -\,\frac{1}{h}\int _{0}^{h}\frac{\tilde{u} _{s}}{\tilde{q}}\frac{\sin \unicode[STIX]{x1D703}_{w}}{\sqrt{g}}\frac{\unicode[STIX]{x2202}}{\unicode[STIX]{x2202}\unicode[STIX]{x1D709}^{2}}\left(\widetilde{U^{2}v}+\sqrt{g}\frac{\unicode[STIX]{x2202}\unicode[STIX]{x1D709}^{2}}{\unicode[STIX]{x2202}y}\tilde{p}-\unicode[STIX]{x1D708}\unicode[STIX]{x1D60E}^{\,2n}\frac{\unicode[STIX]{x2202}\tilde{v}}{\unicode[STIX]{x2202}\unicode[STIX]{x1D709}^{n}}\right)\text{d}\unicode[STIX]{x1D702}\nonumber\\ \displaystyle & & \displaystyle -\,\frac{1}{h}\int _{0}^{h}\frac{\tilde{w}}{\tilde{q}}\frac{1}{\sqrt{g}}\frac{\unicode[STIX]{x2202}}{\unicode[STIX]{x2202}\unicode[STIX]{x1D709}^{2}}\left(\widetilde{U^{2}w}+\sqrt{g}\frac{\unicode[STIX]{x2202}\unicode[STIX]{x1D709}^{2}}{\unicode[STIX]{x2202}z}\tilde{p}-\unicode[STIX]{x1D708}\unicode[STIX]{x1D60E}^{\,2n}\frac{\unicode[STIX]{x2202}\tilde{w}}{\unicode[STIX]{x2202}\unicode[STIX]{x1D709}^{n}}\right)\text{d}\unicode[STIX]{x1D702},\end{eqnarray}$$
 $$\begin{eqnarray}\displaystyle F_{\unicode[STIX]{x1D701}} & = & \displaystyle -\frac{1}{h}\int _{0}^{h}\frac{\tilde{u} _{s}}{\tilde{q}}\frac{\cos \unicode[STIX]{x1D703}_{w}}{\sqrt{g}}\frac{\unicode[STIX]{x2202}}{\unicode[STIX]{x2202}\unicode[STIX]{x1D709}^{3}}\left(\widetilde{U^{3}u}+\sqrt{g}\frac{\unicode[STIX]{x2202}\unicode[STIX]{x1D709}^{3}}{\unicode[STIX]{x2202}x}\tilde{p}-\unicode[STIX]{x1D708}\unicode[STIX]{x1D60E}^{\,3n}\frac{\unicode[STIX]{x2202}\tilde{u} }{\unicode[STIX]{x2202}\unicode[STIX]{x1D709}^{n}}\right)\text{d}\unicode[STIX]{x1D702}\nonumber\\ \displaystyle & & \displaystyle -\,\frac{1}{h}\int _{0}^{h}\frac{\tilde{u} _{s}}{\tilde{q}}\frac{\sin \unicode[STIX]{x1D703}_{w}}{\sqrt{g}}\frac{\unicode[STIX]{x2202}}{\unicode[STIX]{x2202}\unicode[STIX]{x1D709}^{3}}\left(\widetilde{U^{3}v}+\sqrt{g}\frac{\unicode[STIX]{x2202}\unicode[STIX]{x1D709}^{3}}{\unicode[STIX]{x2202}y}\tilde{p}-\unicode[STIX]{x1D708}\unicode[STIX]{x1D60E}^{\,3n}\frac{\unicode[STIX]{x2202}\tilde{v}}{\unicode[STIX]{x2202}\unicode[STIX]{x1D709}^{n}}\right)\text{d}\unicode[STIX]{x1D702}\nonumber\\ \displaystyle & & \displaystyle -\,\frac{1}{h}\int _{0}^{h}\frac{\tilde{w}}{\tilde{q}}\frac{1}{\sqrt{g}}\frac{\unicode[STIX]{x2202}}{\unicode[STIX]{x2202}\unicode[STIX]{x1D709}^{3}}\left(\widetilde{U^{3}w}+\sqrt{g}\frac{\unicode[STIX]{x2202}\unicode[STIX]{x1D709}^{3}}{\unicode[STIX]{x2202}z}\tilde{p}-\unicode[STIX]{x1D708}\unicode[STIX]{x1D60E}^{\,3n}\frac{\unicode[STIX]{x2202}\tilde{w}}{\unicode[STIX]{x2202}\unicode[STIX]{x1D709}^{n}}\right)\text{d}\unicode[STIX]{x1D702}.\end{eqnarray}$$
For the purpose of modelling, we make the following two approximations within the first grid cell $0\leqslant \unicode[STIX]{x1D702}\leqslant h$
:
$0\leqslant \unicode[STIX]{x1D702}\leqslant h$
:
(i) the velocity angle
$\unicode[STIX]{x1D703}$
, i.e.
$\tilde{u} _{s}/\tilde{q}$
and
$\tilde{w}/\tilde{q}$
, is constant;(ii) the Jacobian of the transformation, i.e.
$\sqrt{g}$
, is constant.


Then we can reduce $F_{\unicode[STIX]{x1D702}}$
to be
$F_{\unicode[STIX]{x1D702}}$
to be
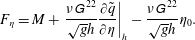 $$\begin{eqnarray}F_{\unicode[STIX]{x1D702}}=M+\left.\frac{\unicode[STIX]{x1D708}\unicode[STIX]{x1D60E}^{\,22}}{\sqrt{g}h}\frac{\unicode[STIX]{x2202}\tilde{q}}{\unicode[STIX]{x2202}\unicode[STIX]{x1D702}}\right|_{h}-\frac{\unicode[STIX]{x1D708}\unicode[STIX]{x1D60E}^{\,22}}{\sqrt{g}h}\unicode[STIX]{x1D702}_{0}.\end{eqnarray}$$
where
 $$\begin{eqnarray}\displaystyle M & = & \displaystyle -\left.\frac{1}{\sqrt{g}h}\left[\frac{\tilde{u} _{s}}{\tilde{q}}(\widetilde{U^{2}u}\cos \unicode[STIX]{x1D703}_{w}+\widetilde{U^{2}v}\sin \unicode[STIX]{x1D703}_{w})+\frac{\tilde{w}}{\tilde{q}}\widetilde{U^{2}w}\right]\right|_{h}\nonumber\\ \displaystyle & & \displaystyle +\left.\frac{\unicode[STIX]{x1D708}\unicode[STIX]{x1D60E}^{\,21}}{\sqrt{g}h}\left[\frac{\tilde{u} _{s}}{\tilde{q}}\left(\frac{\unicode[STIX]{x2202}\tilde{u} }{\unicode[STIX]{x2202}\unicode[STIX]{x1D709}^{1}}\cos \unicode[STIX]{x1D703}_{w}+\frac{\unicode[STIX]{x2202}\tilde{v}}{\unicode[STIX]{x2202}\unicode[STIX]{x1D709}^{1}}\sin \unicode[STIX]{x1D703}_{w}\right)+\frac{\tilde{w}}{\tilde{q}}\frac{\unicode[STIX]{x2202}\tilde{w}}{\unicode[STIX]{x2202}\unicode[STIX]{x1D709}^{1}}\right]\right|_{h}\nonumber\\ \displaystyle & & \displaystyle +\left.\frac{\unicode[STIX]{x1D708}\unicode[STIX]{x1D60E}^{\,23}}{\sqrt{g}h}\left[\frac{\tilde{u} _{s}}{\tilde{q}}\left(\frac{\unicode[STIX]{x2202}\tilde{u} }{\unicode[STIX]{x2202}\unicode[STIX]{x1D709}^{3}}\cos \unicode[STIX]{x1D703}_{w}+\frac{\unicode[STIX]{x2202}\tilde{v}}{\unicode[STIX]{x2202}\unicode[STIX]{x1D709}^{3}}\sin \unicode[STIX]{x1D703}_{w}\right)+\frac{\tilde{w}}{\tilde{q}}\frac{\unicode[STIX]{x2202}\tilde{w}}{\unicode[STIX]{x2202}\unicode[STIX]{x1D709}^{3}}\right]\right|_{h}\end{eqnarray}$$
If the first wall layer is forced to be orthogonal, then the terms with $\unicode[STIX]{x1D60E}^{\,ij}(i\neq j)$
can be neglected, and
$\unicode[STIX]{x1D60E}^{\,ij}(i\neq j)$
can be neglected, and $\unicode[STIX]{x1D702}$
-direction is congruent with the
$\unicode[STIX]{x1D702}$
-direction is congruent with the $y_{n}$
-direction, i.e.
$y_{n}$
-direction, i.e. $\unicode[STIX]{x2202}\tilde{q}/\unicode[STIX]{x2202}\unicode[STIX]{x1D702}|_{h}=\unicode[STIX]{x2202}\tilde{q}/\unicode[STIX]{x2202}y_{n}|_{h}$
. If the spanwise geometry is uniform, then the terms with
$\unicode[STIX]{x2202}\tilde{q}/\unicode[STIX]{x2202}\unicode[STIX]{x1D702}|_{h}=\unicode[STIX]{x2202}\tilde{q}/\unicode[STIX]{x2202}y_{n}|_{h}$
. If the spanwise geometry is uniform, then the terms with $\unicode[STIX]{x2202}\unicode[STIX]{x1D709}^{i}/\unicode[STIX]{x2202}z(i=1,2)$
can be neglected.
$\unicode[STIX]{x2202}\unicode[STIX]{x1D709}^{i}/\unicode[STIX]{x2202}z(i=1,2)$
can be neglected.
Appendix B. Analytical solution of the ODE for
$\unicode[STIX]{x1D702}_{0}$

The ODE for $\unicode[STIX]{x1D702}_{0}$
, (3.16) can be rewritten as
$\unicode[STIX]{x1D702}_{0}$
, (3.16) can be rewritten as
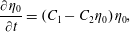 $$\begin{eqnarray}\displaystyle \frac{\unicode[STIX]{x2202}\unicode[STIX]{x1D702}_{0}}{\unicode[STIX]{x2202}t}=(C_{1}-C_{2}\unicode[STIX]{x1D702}_{0})\unicode[STIX]{x1D702}_{0}, & & \displaystyle\end{eqnarray}$$
and then
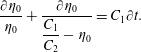 $$\begin{eqnarray}\displaystyle \frac{\unicode[STIX]{x2202}\unicode[STIX]{x1D702}_{0}}{\unicode[STIX]{x1D702}_{0}}+\frac{\unicode[STIX]{x2202}\unicode[STIX]{x1D702}_{0}}{\displaystyle \frac{C_{1}}{C_{2}}-\unicode[STIX]{x1D702}_{0}}=C_{1}\unicode[STIX]{x2202}t. & & \displaystyle\end{eqnarray}$$
If $C_{1}/C_{2}$
is weakly dependent on
$C_{1}/C_{2}$
is weakly dependent on $t$
, (B 2) can be solved analytically,
$t$
, (B 2) can be solved analytically,
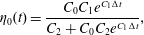 $$\begin{eqnarray}\displaystyle \unicode[STIX]{x1D702}_{0}(t)=\frac{C_{0}C_{1}e^{C_{1}\unicode[STIX]{x0394}t}}{C_{2}+C_{0}C_{2}e^{C_{1}\unicode[STIX]{x0394}t}}, & & \displaystyle\end{eqnarray}$$
where
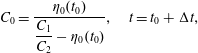 $$\begin{eqnarray}\displaystyle C_{0}=\frac{\unicode[STIX]{x1D702}_{0}(t_{0})}{\displaystyle \frac{C_{1}}{C_{2}}-\unicode[STIX]{x1D702}_{0}(t_{0})},\quad t=t_{0}+\unicode[STIX]{x0394}t, & & \displaystyle\end{eqnarray}$$
and $t_{0}$
is the current time,
$t_{0}$
is the current time, $\unicode[STIX]{x0394}t$
is the time interval in the simulations.
$\unicode[STIX]{x0394}t$
is the time interval in the simulations.
NACA0012, $Re_{c}=10^{4}$
. (a) Distribution of the pressure coefficient
$Re_{c}=10^{4}$
. (a) Distribution of the pressure coefficient $C_{p}$
around the airfoil, and (b) skin-friction coefficient
$C_{p}$
around the airfoil, and (b) skin-friction coefficient $C_{f}$
on the suction surface. ——, WMLES with fine mesh; — ⋅ —, WMLES with coarse mesh. The - - - - line
$C_{f}$
on the suction surface. ——, WMLES with fine mesh; — ⋅ —, WMLES with coarse mesh. The - - - - line $C_{f}=0$
is shown for convenience: zero crossing of this line indicates separation and reattachment.
$C_{f}=0$
is shown for convenience: zero crossing of this line indicates separation and reattachment.

Appendix C. The effects of mesh resolution on WMLES
To evaluate the effects of mesh resolution on WMLES, another WMLES with a coarser mesh $(N_{\unicode[STIX]{x1D709}}\times N_{\unicode[STIX]{x1D702}}\times N_{z}=512\times 64\times 32)$
is performed for the NACA0012 case
$(N_{\unicode[STIX]{x1D709}}\times N_{\unicode[STIX]{x1D702}}\times N_{z}=512\times 64\times 32)$
is performed for the NACA0012 case $(Re_{c}=10^{4},AoA=5^{\circ },L_{z}=0.8C)$
. The wall-normal mesh size
$(Re_{c}=10^{4},AoA=5^{\circ },L_{z}=0.8C)$
. The wall-normal mesh size $\unicode[STIX]{x0394}\unicode[STIX]{x1D702}$
is doubled, and correspondingly the height of the virtual wall is doubled since we have fixed
$\unicode[STIX]{x0394}\unicode[STIX]{x1D702}$
is doubled, and correspondingly the height of the virtual wall is doubled since we have fixed $h_{0}=0.18\unicode[STIX]{x0394}\unicode[STIX]{x1D702}$
. We note that the maximum
$h_{0}=0.18\unicode[STIX]{x0394}\unicode[STIX]{x1D702}$
. We note that the maximum $\unicode[STIX]{x0394}\unicode[STIX]{x1D702}^{+}$
still lies in the logarithmic region, but also that care must be exercised to have a decent resolution of the very thin laminar boundary layer near the leading edge for the subsequent flow development, such as separation and shear-layer transition (Park & Moin Reference Park and Moin2014). To show convergence, in figure 21 we plot both the time- and spanwise-averaged pressure and skin-friction coefficients around the NACA0012 airfoil. It is evident from the
$\unicode[STIX]{x0394}\unicode[STIX]{x1D702}^{+}$
still lies in the logarithmic region, but also that care must be exercised to have a decent resolution of the very thin laminar boundary layer near the leading edge for the subsequent flow development, such as separation and shear-layer transition (Park & Moin Reference Park and Moin2014). To show convergence, in figure 21 we plot both the time- and spanwise-averaged pressure and skin-friction coefficients around the NACA0012 airfoil. It is evident from the $C_{p}$
-plot that the peak value of WMLES with the coarse mesh is slightly larger than that with the fine mesh, as reported in § 5.1. A larger discrepancy is observed at the trailing edge, i.e. close to the reattachment point. Both these two meshes work well for the prediction of separation and subsequent reattachment, although the absolute peak value of
$C_{p}$
-plot that the peak value of WMLES with the coarse mesh is slightly larger than that with the fine mesh, as reported in § 5.1. A larger discrepancy is observed at the trailing edge, i.e. close to the reattachment point. Both these two meshes work well for the prediction of separation and subsequent reattachment, although the absolute peak value of $C_{f}$
in the separation bubble of the coarse mesh WMLES is smaller than the fine mesh. Overall, these comparisons indicate that the present wall model can capture the separation bubble well even with the coarse mesh.
$C_{f}$
in the separation bubble of the coarse mesh WMLES is smaller than the fine mesh. Overall, these comparisons indicate that the present wall model can capture the separation bubble well even with the coarse mesh.


 Open access

