


Introduction
It is often said that the general public has little interest in, or grasp of, the intricacies of economic policy. Yet since the global financial crisis erupted in 2008, a fierce public debate has centered on the effectiveness of austerity, a restrictive fiscal economic program that prescribes a reduction of government budget deficits and a stabilization of public debt. Austerity—which entails cuts in public spending, an increase in taxation, or a combination of both—has spawned debate on two different fronts: the economic merits of this approach and its political feasibility.
The dispute over the economic merits of austerity reflects a long-standing fissure among economists dating back to Keynes and Hayek regarding the correct approach to countering economic downturns and swelling budget deficits. Proponents contend that austerity, particularly the slashing of government spending, increases investors’ confidence that the deficit is under control and that the government will refrain from pushing up borrowing costs for businesses through the issuance of debt. By restoring investors’ confidence, goes the argument, austerity keeps interest rates low, encourages private investment, and thus reignites economic growth (Alesina, Favero, and Giavazzi Reference Alesina, Favero and Giavazzi2015). However, critics counter that adopting austerity during a recession is counterproductive, as it weakens aggregate demand at a time when the economy is already feeble. This deepens the recession and delays economic recovery (Krugman Reference Krugman2015; Varoufakis Reference Varoufakis2016). Instead, critics advocate the adoption of an expansionary policy, often in the form of a fiscal stimulus, whereby the government increases its short-term spending to boost aggregate demand. Only then, they contend, when the economy is on a healthier path of growth, should governments adopt spending cuts to shrink the deficit.
The second aspect of the austerity debate centers on its political feasibility. Cuts in government spending or tax hikes can inflict substantial pain on the public. Wary of an electoral backlash, politicians are presumably reluctant to pursue austerity, even if they believe it represents the right course of action. Jean-Claude Junker, the president of the European Commission, succinctly described the politicians’ dilemma with respect to austerity: “We all know what to do, we just don’t know how to get re-elected after we’ve done it.”Footnote 1
These two debates—over the economic merits of austerity and its political feasibility—have been playing out over the past decade in a range of countries. Yet notably, the approach that many have taken in response to the global financial crisis has been a pursuit of austerity policies (Ortiz et al. Reference Ortiz, Cummins, Capalod and Karunanethy2015). Why do governments adopt a policy that is not only economically contested but also perceived as politically self-defeating?
To address this question, we examine the public’s views on the merits of austerity versus fiscal stimulus in dealing with economic downturns and swelling deficits. Our conjecture is that public attitudes on governments’ responses in such circumstances should be understood and analyzed at two levels that distinguish between austerity as a general approach and austerity at the concrete level of specific policy packages. At the general level, voters may prefer one approach over the other—that is, whether the government should pursue austerity or a stimulus. At the concrete level, voters’ preferences may also be sensitive to the design of austerity policy packages in terms of the specific tax hikes and spending cuts they entail. Preferences at these two levels may be interlinked, but are not the same.
Without assuming that voters possess much knowledge on the issue, we first assess the public’s general stance on the choice between austerity or stimulus as a policy response. Examining survey data from five major countries—Italy, Spain, France, Greece, and the United Kingdom—we show that citizens prefer austerity, and do so by a wide margin. We then explore possible sources of variation in this general preference. Starting with the two “immediate suspects” when explaining economic preferences—ideology and economic interests—we examine whether views on the higher-level question of austerity versus stimulus reflects a “simple” left-right split or a socioeconomic divide. Given that austerity typically consists of sharp cuts in public spending, while a stimulus approach consists of increased government expenditures, austerity can be perceived as more in line with conservative economic orthodoxy. We find that political ideology does indeed account for some variation in preferences toward austerity—with voters on the right typically favoring austerity at higher rates—but that ideology does not play the sort of dominant and polarizing role that it does in many other policy areas. In some countries the attitudinal difference between left and right is not that large, and in the majority of cases preference for austerity exceeds 50% even among the left.
Our analysis casts stronger doubt on the importance of the second suspect—economic interests—the idea that variation in the preference for austerity reflects individuals’ likelihood of being hurt by fiscal consolidation. In fact, we find that individuals’ preference for austerity correlates only weakly with their economic characteristics. This is the case with respect to measures of material comfort, such as income, or with variables that capture dependence on government spending (e.g., being a public sector employee, unemployed, or a welfare recipient).
We then examine whether the popularity of austerity originates from its intuitive psychological appeal, as captured by the oft-used household metaphor: just as individuals going into debt need to tighten their belt by cutting spending, so should the government do with its debt (Barnes and Hicks Reference Barnes and Hicks2020; Krugman Reference Krugman2015). Moreover, austerity may be psychologically appealing because it also represents a form of a morality tale, in which austerity is perceived as the penance that fits the “sin” of overspending (Blyth Reference Blyth2013). We test this argument using a survey experiment that randomly exposed respondents to different justifications for austerity. The results suggest that the psychological appeal of austerity—while influential in some instances—is not a major factor in explaining the broad preference for austerity.
Thus far, only ideology helps explain the preference for austerity as a general approach, but as noted, even that explanation is limited given the substantial segment of people on the left also favoring fiscal consolidation. The answer to this puzzle, we contend, requires understanding the way people think about the concrete level of specific austerity policies. Since austerity can consist of policy changes in an array of domains, governments need to construct a “package” of specific spending cuts and tax hikes. In doing so, they are incentivized to design their austerity package in ways that reduce potential backlash and help establish support among key constituencies. Evaluating this possibility empirically is challenging, as it requires researchers to not only assess voters’ sensitivities to particular dimensions of austerity but also to predict how much support an austerity package as a whole would generate among specific constituencies with distinct characteristics. To this end, we devise a novel approach that allows us to estimate these quantities of interest by combining a high-dimensional conjoint experimental design with both standard estimation strategies and flexible machine-learning techniques.
The results from our conjoint experiment reveal two key findings. First, we find that the same austerity package receives substantially higher support the more the party proposing the policy is ideologically proximate to the respondent’s preferred party. This is consistent with earlier research that shows that when dealing with complex economic issues, people often obtain powerful signals about the desirability of a policy from the political parties backing it. But the analysis highlights another, perhaps more important finding: support for austerity is highly contingent on the specific design features of the package. Some of the package’s features reduce public support substantially, particularly pension cuts and increases in income taxes. In contrast, other features can be popular, including cuts in military spending or reduced expenditures on public sector jobs. When estimating the level of support for specific austerity packages, we find that the packages that countries have implemented in recent history tend to receive high rates of support, across both left and right.
This latter finding underscores the point that the policy packages that governments propose, and thus that voters likely associate with austerity, are a small and carefully chosen subset of the policy combinations that governments could potentially pursue. It is therefore misguided to infer from the high levels of support for austerity as a general approach that any given austerity package is a politically feasible option. Rather, governments’ careful design of their austerity policy, taking account of voters’ sensitivities, is a key explanation for why those packages are often able to pass without causing major public backlash. And by extension, the association of austerity with these carefully designed packages helps explain voters’ support for the general policy of austerity.
In sum, our account can be stated as follows: Governments adopt austerity because, contra to conventional wisdom, it is actually a popular response to economic crises among the voting public. It is popular partly because it fits with the worldview of many on the right, in effect securing it a high degree of baseline support. But beyond that base of support, the careful design of a specific austerity policy allows politicians to sidestep some unpopular measures and present a package that is palatable even to some of the voters who do not normally subscribe to a small government paradigm. Finally, governments also benefit from the inherent complexity of austerity, which leads voters to rely heavily on signals from their preferred politicians as to whether or not they should support the policy. By gaining backing from key political actors for the carefully crafted package, governments are able to obtain the public support they need to pursue austerity.
The debate over the use of austerity is likely to remain prominent as countries grapple with the devastating economic impact of the COVID-19 pandemic. We lay out several key explanations for public support of austerity and provide a first test of their merits using novel data. The findings contribute to research on the sources of fiscal policy preferences (Ballard-Rosa, Martin, and Scheve Reference Ballard-Rosa, Martin and Scheve2017; Bansak et al. Reference Bansak, Bechtel, Hainmueller and Margalit2020; Blinder and Holtz-Eakin Reference Blinder and Holtz-Eakin1983) and the evolving literature on the political repercussions of austerity (Arias and Stasavage Reference Arias and Stasavage2019; Talving Reference Talving2017). Specifically, our analysis offers an explanation for the empirical finding that governments opting for austerity are not more likely to be hurt electorally (Alesina, Carloni, and Lecce Reference Alesina, Carloni and Lecce2011; Passarelli and Tabellini Reference Passarelli and Tabellini2017). In contrast to prior explanations that center on political announcements (Genovese, Schneider, and Wassmann Reference Genovese, Schneider and Wassmann2016), media coverage of deficits (Barnes and Hicks Reference Barnes and Hicks2018), the timing of austerity (Hübscher and Sattler Reference Hübscher and Sattler2017), or the self-selection of governments that pursue austerity (Hübscher, Sattler, and Wagner Reference Hübscher, Sattler and Wagner2020), our study highlights ideology, partisan cues, and policy design as key reasons why austerity is not as electorally damaging as is often argued, or as one might expect.
The Political Repercussions of Austerity
The optimal policy response to economic downturns and swelling government deficits is a topic of longstanding debate (see Blyth [Reference Blyth2013] and Skidelsky and Fraccaroli [Reference Skidelsky and Fraccaroli2017] for recent summaries). Advocates of fiscal consolidation as the preferable response have often been criticized not only on the merits of the policy—that is, whether austerity is effective in countering budget deficits and the accumulation of public debt—but also on the political feasibility of this approach. Specifically, the common assumption is that voters dislike both spending cuts and tax increases. Consistent with this assumption, research documents instances where austerity caused social unrest (Ponticelli and Voth Reference Ponticelli and Voth2020) and mass protests (Genovese, Schneider, and Wassmann Reference Genovese, Schneider and Wassmann2016). By this view, politicians seeking reelection are likely to either delay or avoid pursuing such painful measures and instead opt for economic expansion (Alesina, Favero, and Giavazzi Reference Alesina, Favero and Giavazzi2018; Buchanan and Wagner Reference Buchanan and Wagner1977).
However, empirical analyses have cast doubt on this view on two fronts. First, contra to predictions, several studies find that governments do not shy away from advancing austerity packages in response to economic crises (Ponticelli and Voth Reference Ponticelli and Voth2020; Roubini and Sachs Reference Roubini and Sachs1989). Typically, these programs are comprised of a combination of tax increases and spending cuts. Moreover, the cuts are often nontrivial in magnitude and in some cases substantially reduce the debt-to-GDP ratio (Alesina, Perotti, and Tavares Reference Alesina, Perotti and Tavares1998; Arias and Stasavage Reference Arias and Stasavage2019).
Second, research indicates that pursuing austerity does not tend to trigger electoral losses. For example, Alesina, Perotti, and Tavares (Reference Alesina, Perotti and Tavares1998) examine data from 19 OECD countries between 1960–1995. They report that neither small nor large fiscal adjustments—mostly expenditure cuts—resulted in systematic drops in popularity, in loss of electoral support, or in increased risk of leadership turnover. In a similar vein, Giger (Reference Giger2010) examines the electoral response to fiscal consolidation in 20 elections in Western countries between 2001 and 2006. She also finds that voters did not systematically punish governments that pursued austerity. Talving (Reference Talving2017) examines voting intentions in surveys from 24 European countries and finds that in two of the waves (2004 and 2009) fiscal consolidation was uncorrelated with vote intentions, but in 2014 respondents reported lower levels of support for governments that implemented consolidation measures. Arias and Stasavage (Reference Arias and Stasavage2019) assess these findings by broadening the analysis to cover 32 countries in the period between 1870 and 2011, analyzing the relationship between spending cuts and leader turnover. Their results indicate that even large spending cuts do not systematically affect the rate of leadership change.
We propose two sets of explanations for governments’ regular adoption of austerity policies and the absence of an electoral backlash. These two sets pertain to the levels of policy specificity we laid out above. At the general approach level, we first explore public support for austerity over the stimulus approach and evaluate explanations centered on citizens’ ideological affinity, their economic interests, and the intuitive psychological appeal of austerity. At the concrete policy level, we evaluate the importance of attitudes toward specific austerity packages, in particular focusing on the role of policy design and party cues.
The General Level: The Preference for Austerity over Stimulus
A first explanation for variation in mass support for austerity as a general approach highlights the importance of voters’ ideological orientations. Austerity encompasses tax hikes and/or cuts in public spending. If governments focus their austerity package on the latter—as they typically do (Alesina, Favero, and Giavazzi Reference Alesina, Favero and Giavazzi2018)—such a policy is likely to garner substantial support among right-leaning voters who generally prefer a smaller government, whether because they perceive government as wasteful, incompetent, or as averting the efficient operation of the free market (Blinder and Krueger Reference Blinder and Krueger2004). Left-right ideology may also explain differences in austerity support because right-leaning voters tend to be more averse to inflation, which high government spending could presumably induce (Hibbs Reference Hibbs1977; Scheve Reference Scheve2004). If this explanation holds, we should observe political ideology to be a strong predictor, whereby support for austerity would be higher among more right-leaning voters.
A second explanation argues that the willingness to support austerity reflects its expected material impact, which may not be as detrimental to public support as one might think. For one, some measures of austerity—for example, cuts in certain government assistance programs—have highly concentrated costs, often affecting narrow segments of the electorate (Fetzer Reference Fetzer2019). In particular, austerity measures are likely to impose financial harm on members of the public who are more reliant on government spending. If public opinion is divided between those directly hurt by the government’s measures and those who are not, politicians may be able to withstand the drop in support among the former, especially if this group is limited in size or is not a key constituency of the party in power. By this explanation, we would expect a preference for austerity over fiscal stimulus to be weaker among voters who are more dependent on public spending, be it the unemployed, public sector employees, pensioners, or welfare recipients.
Austerity may also be popular due to its intuitive psychological appeal. As Krugman (Reference Krugman2015) and others have argued, this appeal stems from the seemingly intuitive parallel between public and private debt. Indeed, politicians often advance this logic in the form of a household analogy, arguing that just as reduced spending is the natural response when a household goes into debt, so should governments cut spending in the face of growing public debt. The strength of austerity may further be bolstered by the relatively nonintuitive nature of the fiscal stimulus response. Or as Chancellor Angela Merkel bluntly put it when advocating austerity against calls for fiscal expansion, “you can’t spend your way out of a debt crisis.”Footnote 2 Austerity may also be psychologically appealing because overindebtedness is often discussed in moral terms, a form of “sin” to which painful spending cuts are the inevitable penance (Blyth Reference Blyth2013). In contrast, the stimulus approach lacks such a moral component. For this explanation to hold, we would expect voters’ general level of support for fiscal contraction to be sensitive to forms of pro-austerity messaging that highlight its psychological appeal, relative to alternative arguments that emphasize its economic rationale.
The Specific Policy Level: Support for Concrete Austerity Packages
General support for austerity as a policy does not, of course, imply support for any particular austerity proposal. It is concrete austerity packages proposed and implemented by the government that voters form views about and then respond to via the electoral process. Therefore, understanding public attitudes toward austerity requires evaluating preferences not only at the general approach level but also at the concrete policy level.
Once a government decides to pursue austerity, it may increase support for its proposal via the strategic design of the policy package itself. Rather than holding clear views about austerity as an abstract economic approach, voters perhaps form their attitudes based on the specific composition of the policy package in question. Indeed, on some issues, the media highlights specific aspects that become central in the public debate. In France, for example, media coverage centered on the proposed rate of corporate taxation and the level of VAT hikes that were included in the austerity measures advanced by Prime Minister Fillon.Footnote 3 Similarly, the Spanish media coverage that accompanied the austerity program pursued by PM Rajoy also discussed the details of the package, highlighting specific clauses such as pay rate cuts in the civil service sector and the increase of specific types of taxes.Footnote 4 If voters exhibit different sensitivities to the various types and rates of spending cuts and tax increases, governments may have significant latitude in designing packages that achieve their fiscal objectives while retaining sufficient public support (Häusermann, Kurer, and Traber Reference Häusermann, Kurer and Traber2019; Hübscher, Sattler, and Wagner Reference Hübscher, Sattler and Wagner2020). Put differently, the precise structure of an austerity package—specifically, the details of the spending cuts and the types and rates of the taxes raised— should have a substantial influence on the level of public support it receives. Providing detailed information about the composition of an austerity package could also make it easier for individuals to form egoistic policy preferences (Bechtel and Liesch Reference Bechtel and Liesch2020; Curtis, Jupille, and Leblang Reference Curtis, Jupille and Leblang2014; Rho and Tomz Reference Rho and Tomz2017). This implies that measures of material self-interest should correlate more strongly with support for austerity proposals. Moreover, and as we discuss later, attitudes regarding specific austerity reforms may in turn influence how people think about the higher-level question of austerity versus stimulus.
In addition, ideology could shape support for concrete austerity packages, perhaps due to varying sensitivities to particular austerity measures across ideological lines, but also in a more indirect manner: via endorsements by parties and politicians that are ideologically proximate to or favored by voters. People are in many cases woefully uninformed about issues related to economic policy (Caplan Reference Caplan2002; Margalit and Shayo Reference Margalit and Shayo2020). Due to the complexity of the issues and the time investment required to learn the relevant details, voters often rely on “signals” from their favored politicians regarding the stance they should take on the matter (Kam Reference Kam2005; Lupia Reference Lupia1994). The considerable complexity of specific austerity packages under debate suggests that the public stance politicians take on a specific policy proposal may exert substantial influence on the views of their followers (Arias and Stasavage Reference Arias and Stasavage2019). We therefore expect to observe party cueing effects: controlling for the features of a given policy proposal, voters should be more supportive of an austerity package if it is backed by parties that are closer to them ideologically.
Data and Measurement
To explore mass attitudes toward austerity we fielded two waves of surveys. The first wave was fielded online in May 2015 to samples of the adult populations in France, Greece, Italy, Spain, and the United Kingdom (total N = 14,800). Quotas were imposed on age, gender, and education. The five countries all experienced a financial crisis, but had different degrees of exposure to it.Footnote 5 Nonetheless, at the time of our surveys, austerity was a salient issue in the public debate.Footnote 6 Of course, a set of surveys from five countries does not allow us to test the effect of country-level variables, but it does provide a valuable check against overinterpreting findings from one country as representative of a general pattern. To analyze in greater detail the role of austerity policy design, we fielded a second survey to samples of the adult populations in Italy and Spain (total N = 3,950) in January 2019, with quotas imposed on age, gender, and education. All analyses employ survey weights constructed to achieve balance with the respective national populations on gender, age, and education. However, our findings are not substantially affected by the use of weights, as they remain robust in the absence of weights and when employing alternative weights that also account for income and ideology in addition to gender, age, and education.Footnote 7
To explore support for austerity as a general approach over its alternative of fiscal stimulus, our primary outcome variable is based on the following question:
“Currently there is much discussion about the way the government should resolve the financial crisis and restore economic growth. A key question is what to do with public spending (that is, money that the government spends on things like education, social services, pensions, public sector workers, or defense).
Some argue that the government should decrease spending and reduce the debt to spur the economy. Others argue that the government should increase spending and tolerate higher debt to spur the economy. What is your view on this?”
-
• The government should decrease spending and reduce the debt to spur the economy.
-
• The government should increase spending and tolerate higher debt to spur the economy.
We then asked respondents to indicate which of these two options they prefer. To address potential sequencing effects, we randomly varied the order in which the two alternatives were presented. In the analyses that follow, our outcome variable Austerity Support is an indicator for preferring the former option.Footnote 8
In our second survey, we designed and implemented a conjoint experiment to evaluate voters’ preferences over specific austerity policy packages and the role of policy design. Details on the design and analysis of this component of our study will be presented in a later section.
Results on Support for Austerity at the General Approach Level
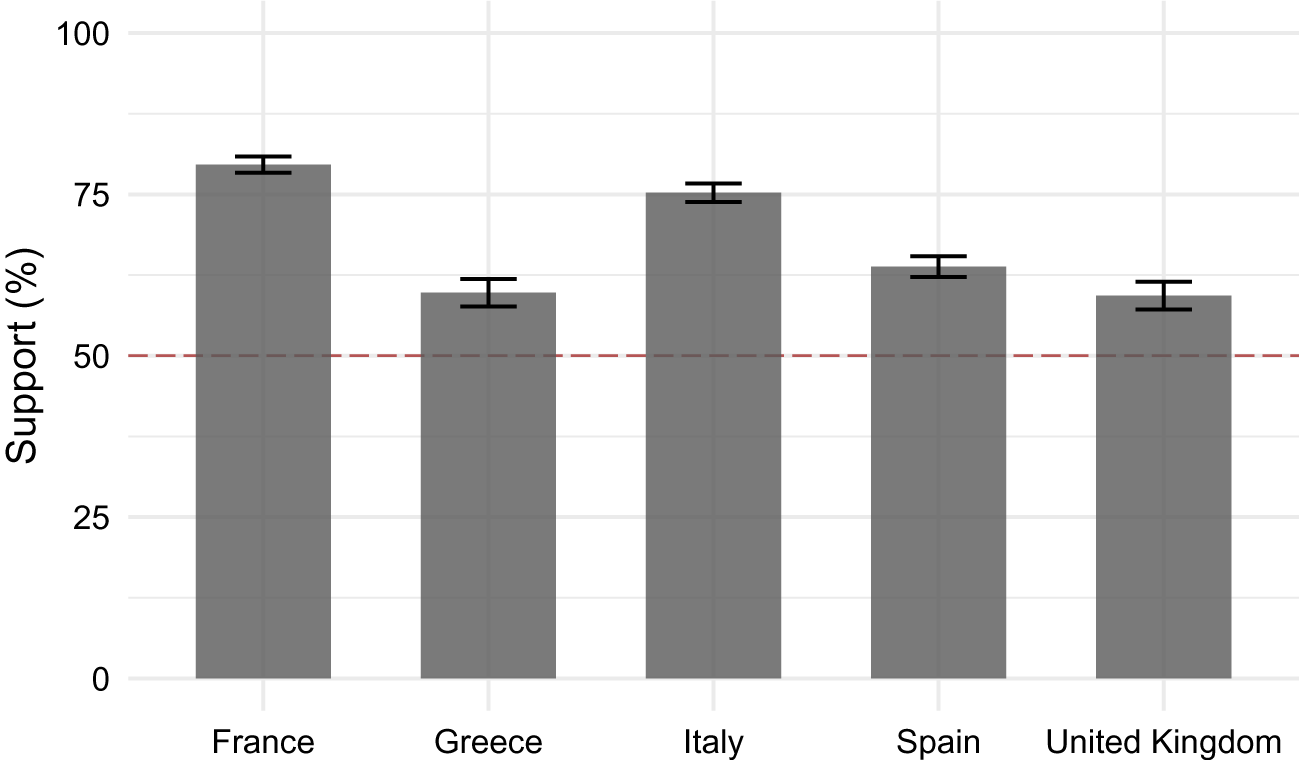
We begin by analyzing mass preferences for austerity over a stimulus approach. Figure 1 reports the share of respondents who prefer austerity. We find that in all five countries a majority—or even supermajority, in the case of France and Italy—favors austerity as a response to the financial crisis. This pattern adds to our understanding of the consistent pursuit of austerity policies across a multitude of countries (Ortiz et al. Reference Ortiz, Cummins, Capalod and Karunanethy2015). However, this aggregate preference for austerity may mask divisions along key political and socioeconomic lines. Specifically, preferences for austerity may break down along the lines of both left-right ideology and economic interests, two cleavages that can pose serious challenges to the adoption of major policies, even those that have majority support in the aggregate.
General Support for Austerity, by Country, 2015 Survey
Note: This figure shows the percentage of general support for austerity for respondents in France (N = 3,886), Greece (N = 2,013), Italy (N = 3,473), Spain (N = 3,471), and the United Kingdom (N = 2,009). Robust 95% confidence intervals are reported, and survey weights are applied.

The Role of Ideological Leanings
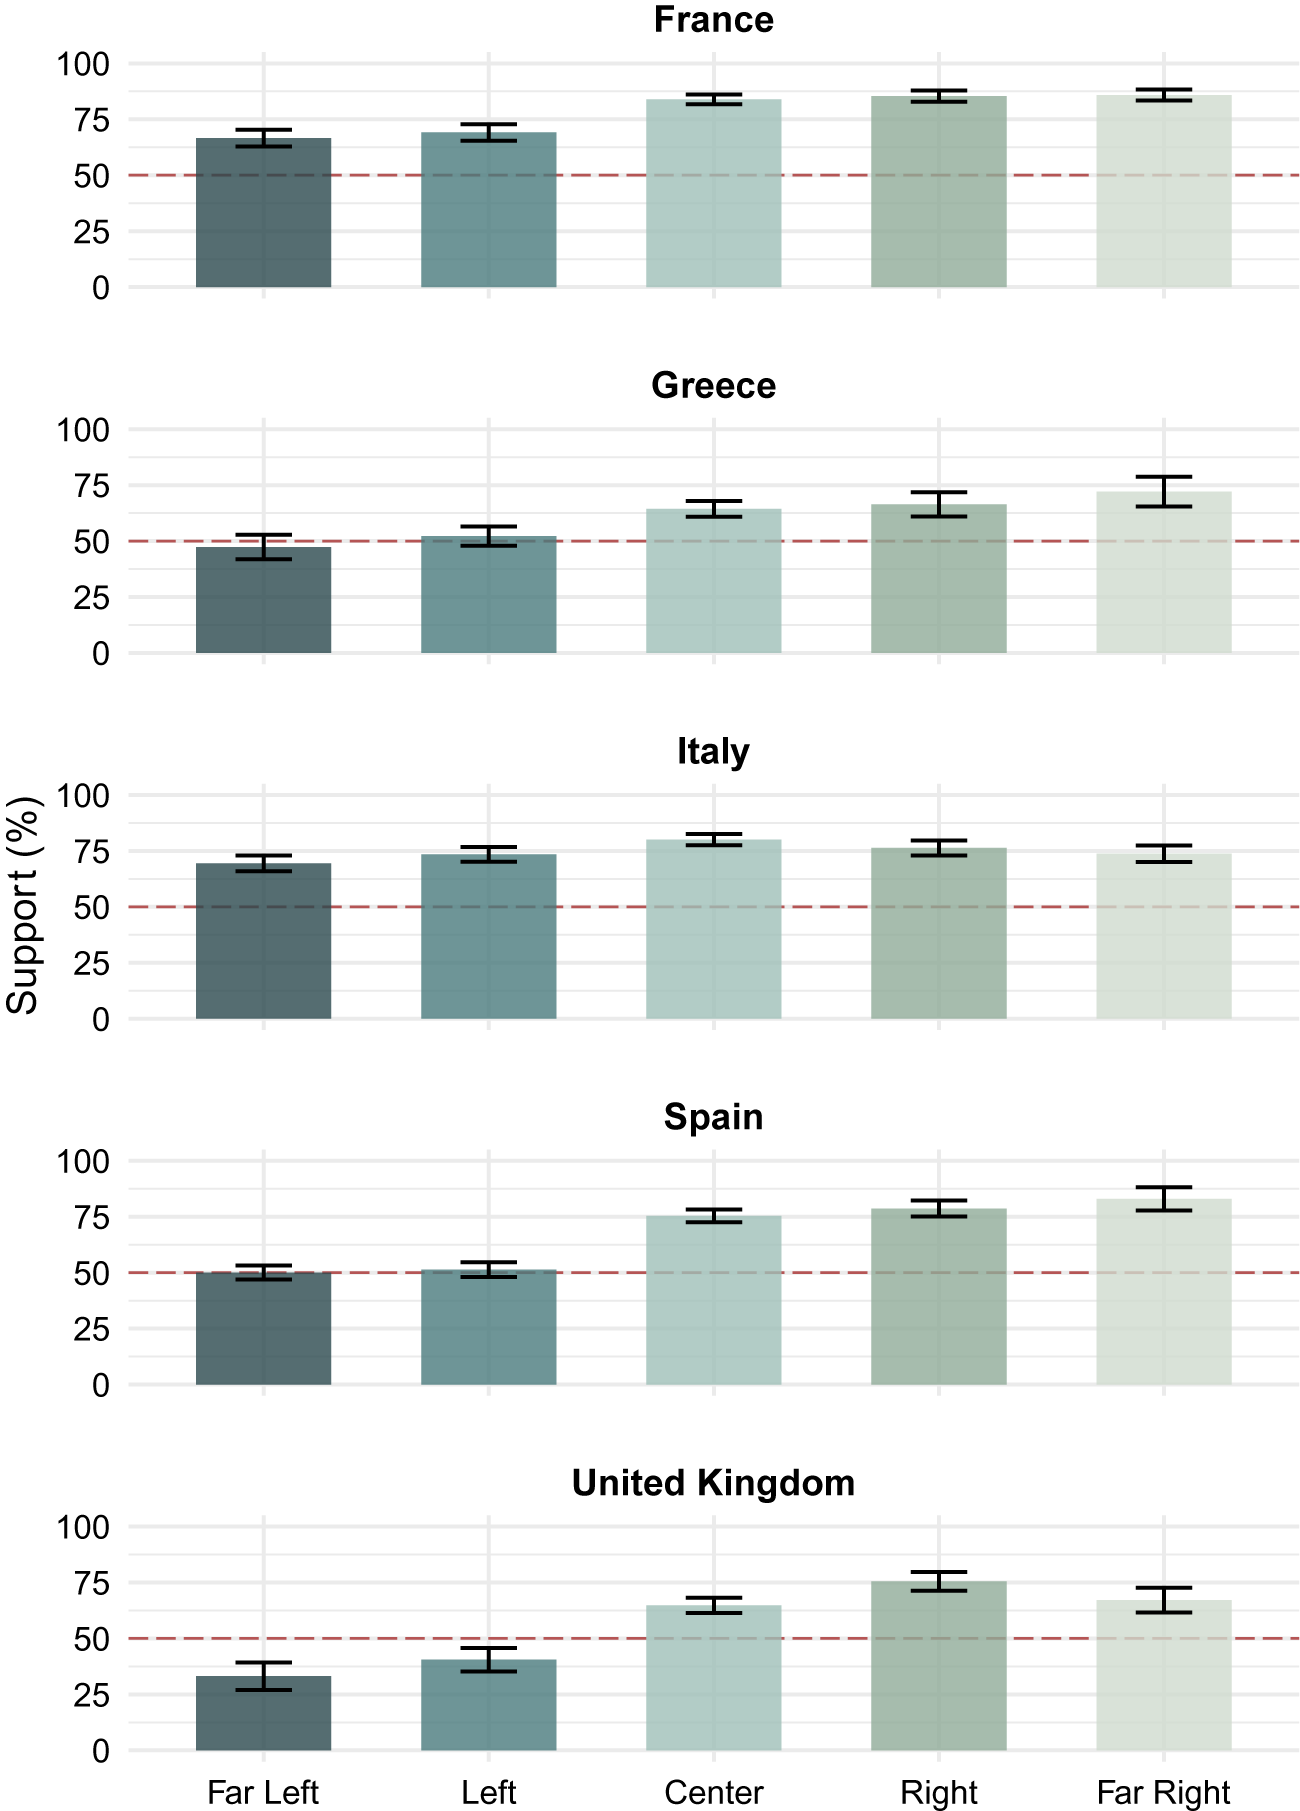
As explained earlier, voters on the ideological right are expected to be more supportive of austerity than those on the left. Consistent with this conjecture, as Figure 2 shows, when we analyze support for austerity across different ideological groupings, we find sizable differences and greater support among right-wing voters in all countries but Italy. However, even among far left voters in Greece and Spain, about half of all respondents actually prefer austerity over the fiscal stimulus alternative. Further, in all countries except the UK, a majority of left-wing voters opt for austerity as their preferred response.Footnote 9 The strength of this estimated support for austerity across ideological camps is robust to applying weights (see Figure A2) and to using an alternative set of weights that account for income and ideology in addition to gender, age, and education (see Figure A3). These quantities are based on our 2015 survey, yet a second survey that we fielded in Italy and Spain in 2019 reveals very similar patterns (see Figure A4).Footnote 10
General Support for Austerity over Stimulus across Ideological Subgroups, by Country, 2015 Survey
Note: This figure shows the percentage of general support for austerity across political ideological subgroups for respondents in France (N = 3,886), Greece (N = 2,013), Italy (N = 3,473), Spain (N = 3,471), and the United Kingdom (N = 2,009), using respondents’ self-placement on an 11-point left-right ideological scale. Robust 95% confidence intervals are reported, and survey weights are applied.

We further probe the relationship between ideological leanings and support for austerity by regressing the variable Austerity Support on indicators for the political ideological groupings along with sociodemographic and political variables. Table 1 reports the results by country. (Appendix Section II provides more information on the coding of variables). When adjusting for the various characteristics included in the regressions, we find that the left-right gradient in support for austerity as a general approach is less clear-cut than revealed in the bivariate relationships. Consistent with the bivariate patterns reported earlier, we find that in all five countries respondents on the far left are significantly more opposed to austerity in general than those in the center. However, more moderate voters on the left are not necessarily more apprehensive about austerity (in particular, see France and Spain), and the patterns among the right are more heterogeneous. For example, in Spain and the UK those on the right are less supportive of austerity, but those on the far right are more in favor of fiscal restraint than those in the center. In France and Greece, right-wing voters are less supportive of austerity than those in the center. Generally, the ideological cleavage underlying views on austerity is present but seems to be limited and complex.Footnote 11
The Correlates of General Austerity Support in France, Greece, Italy, Spain, and the UK, 2015 Survey

Note: The table reports coefficients from a linear probability model. The dependent variable is an indicator variable that takes the value one if an individual prefers spending cuts over fiscal stimulus and zero otherwise. Robust standard errors reported in parentheses. $ {}^{\ast }p<0.05 $
.
$ {}^{\ast }p<0.05 $
.
Economic Interests and General Support for Austerity
The results in Table 1 highlight the overall weak association between people’s personal economic standing and their general stance on the austerity-versus-stimulus question. Particularly notable is the lack of a systematic and robust difference in support for austerity across income groups. Controlling for other characteristics, low earners (the reference category) are as likely to prefer austerity as high-income individuals. The results are quite similar for variables that capture dependence on government spending, such as whether a respondent is a public sector employee, receives public financial assistance, or is unemployed. Other variables that may capture a specific vulnerability to inflation resulting from swelling public debt—having a mortgage or stock ownership—also do not predict austerity support. In addition, insofar as austerity includes pension cuts that most directly affect those who tend to be older, the material-interest explanation could be argued to predict an intergenerational divide where age correlates negatively with support for austerity. However, the evidence fails to support this prediction as well.
We reestimate these models using data from our 2019 survey, which we conducted in Italy and Spain (see Table A8). The estimates again indicate that variables capturing an individual’s position in the economy remain weak predictors of austerity support. Moreover, in this second survey we also examine whether beliefs about the motivations of elected officials, as well as their competence, help account for respondents’ stance on austerity. Contra to our expectations, beliefs about the intentions and competence of government officials do not appear to be predictive of general support for austerity.Footnote 12
The tendency to prefer austerity over stimulus as a function of one’s economic interests may yet depend upon the ability to understand the logic and consequences of each policy approach for dealing with a financial crisis that varies in its complexity. Especially at the general level, voters may lack information about the redistributive effects of the available policy options. This could prevent individuals from expressing egoistic preferences (Bearce and Tuxhorn Reference Bearce and Tuxhorn2015; Rho and Tomz Reference Rho and Tomz2017). One might therefore expect that the material-interest variables would provide more explanatory power for voters with higher levels of knowledge and/or education. However, when we subset our results by education and economic-political knowledge we find little evidence for this prediction.Footnote 13 The results indicate that variables meant to capture self-interest do not tend to be systematic predictors of austerity support among more educated or more knowledgeable respondents (see Tables A6, A7, A11, and A12).
However, we do find that in all countries higher education and knowledge in and of themselves are associated with a weaker preference for austerity over fiscal stimulus. While this finding may not be obvious ex ante, it could be due to the complicated, counter-cyclical nature of pursuing a fiscal stimulus, which rests on a strategy in which governments initially accept higher deficits to boost aggregate demand and reduce debt only in subsequent periods through increased tax revenues. Those with higher levels of knowledge and/or education may be more familiar with, or perhaps have a better grasp of the more complex logic underlying the fiscal stimulus approach. Our data do not allow us to test this explanation, but it seems consistent with our findings.
Taken together, these results indicate that standard accounts of economic policy preferences that emphasize political ideology and material self-interest offer limited explanatory power when trying to understand voters’ decisions about which fundamental approach to pursue when responding to a financial crisis.
The Psychological Appeal of Austerity’s Logic
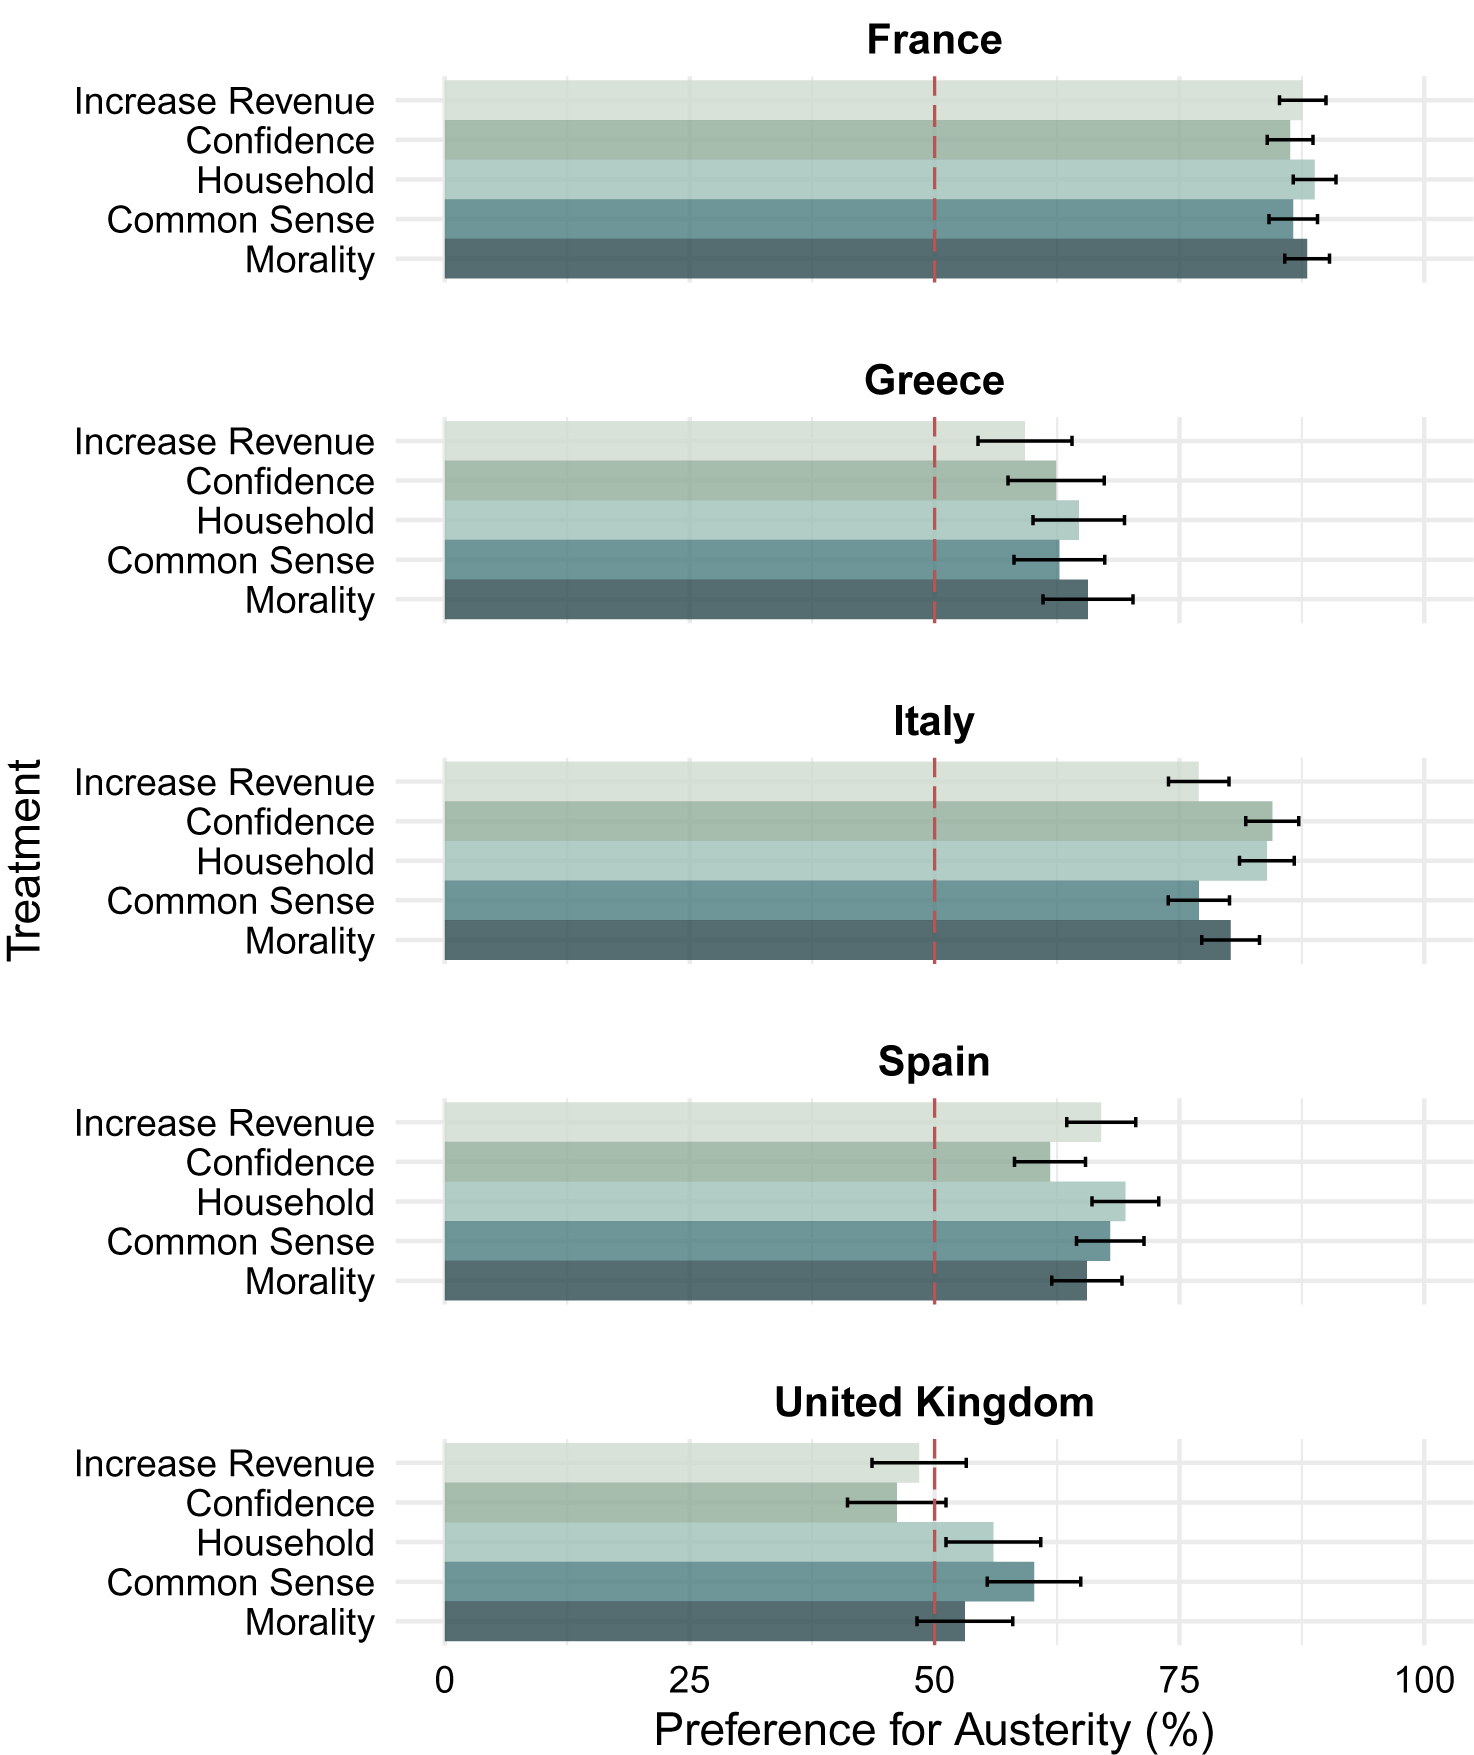
Austerity’s popularity as a general approach could be due to a messaging advantage resulting from the more intuitive psychological appeal of its logic relative to that of a fiscal stimulus approach. We explore this argument by using a survey experiment that was included in our 2015 survey. We focus on the household analogy and its converse argument that one cannot deal with debt by increased spending (i.e., a stimulus), as well as the debt-as-moral-sin argument we laid out in the theoretical discussion above. We compare the resonance of these more psychologically based arguments against two economic-centric arguments. One is the oft-heard claim that austerity is an effective strategy for dealing with a debt crisis as it helps restore investors’ confidence and consequently encourages economic activity.Footnote 14 The final version simply states that spending cuts help boost the economy and increase revenue. To be clear, the objective of this experiment is not to test whether exposing respondents to any positive statement about austerity makes people somewhat more favorable of this approach—that is more than likely—but rather to assess whether any of the psychological appeals resonates as a message in a uniquely strong fashion when compared with economic justifications. Such evidence would help us establish the role of the messaging advantage of austerity over fiscal stimulus as an explanation for its popularity.
The wording of the main question was:
Not only the public, but even experts disagree about the best way to address the financial crisis. Some say that the government should immediately decrease spending because … [one randomly chosen justification, see below]. What do you think?
We then asked respondents whether they would like the government to decrease spending by a lot/decrease spending by a little/keep spending at current level/increase spending by a little/increase spending by a lot. The experimental component varied the justification for why the government should engage in spending cuts. We distinguish between five treatment conditions.
-
1. The Increase Revenue treatment told respondents that expenditure cuts “will stimulate the economy and increase revenues.”
-
2. The Confidence condition presented individuals with the argument that if the government cuts back spending, “this will restore investors’ confidence in the economy.”
-
3. The Household Analogy condition justified austerity since “just like a household, if you overspent you need to tighten your belt.”
-
4. The Common Sense condition, representing a converse version of the household analogy, emphasized the counter-intuitive nature of the Keynesian fiscal stimulus approach to advocate for spending cuts “because you can never spend your way out of a debt problem.”
-
5. The Morality argument advocated for austerity as the appropriate response since “after living beyond our means only painful cuts can amend.”
We examine the share of respondents expressing support for decreasing spending (either by a little or by a lot) by the randomly assigned justification condition. Figure 3 reports the results for the full sample.Footnote 15 There are no systematic patterns highlighting the effectiveness of any particular messaging frame. Only in the UK do we find evidence that the psychologically based frames (Household Analogy, Common Sense, and Morality) outperform the economic frames (Increase Revenue and Confidence, see Table A13 for more formal tests). The vast majority of the comparisons between the frames across the other countries are substantively small and mostly statistically insignificant. The results are very similar when controlling for respondents’ pretreatment austerity preferences (see Table A14). We also explore whether the effect of justification conditions varies by respondents’ preexisting austerity preferences (see Table A15). While we find significant effects among anti-austerity respondents in France and Italy, most treatment effects are indistinguishable from zero.
The Effect of Justification Strategies on Support for Austerity, by Country
Note: The figure displays the percentage of respondents expressing support for decreasing spending (either by a little or by a lot) across framing treatment conditions, by country. Robust 95% confidence intervals are reported. Weights applied.

One might ask whether respondents have already been exposed to some of these frames of austerity in the past. If so, this might explain why the justification treatments do not induce large, systematic shifts in support. Yet this argument would also suggest that the treatment effects should be least pronounced in countries that experienced particularly severe deficits and debt problems—that is, places where those frames are most likely to have been used. However, the fact that the variation that we observe across treatment conditions is similar in countries such as France and Greece, which differed greatly in their exposure to the financial crisis, casts doubt on this interpretation. In sum, the experiment offers limited support for the idea that the preference for austerity reflects a messaging advantage arising from its intuitive psychological appeal.
Preferences over Specific Austerity Packages
As detailed above, we find evidence of broad support for austerity as a general policy approach, with some division in that support across the ideological divide. Furthermore, we find little role of socioeconomic cleavages or specialized messaging frames in explaining attitudes on austerity. Yet importantly, support for austerity as a general policy approach does not imply support for concrete austerity policies or packages as they are actually implemented. In other words, while our findings regarding support at the general level point toward the existence of an important set of preconditions, they are not sufficient to explain the consistent deployment of austerity policies by governments in times of crisis or the lack of an electoral backlash in response to these policies.
This section focuses on unpacking public preferences over austerity at the concrete policy level. We begin by examining the role of the design of the austerity package and assess its influence on the levels of support such proposals can obtain. We then evaluate the role of party endorsements in leading voters to embrace specific austerity packages.
Policy Design and Support for Specific Austerity Packages
The high degree of support for austerity may in part be a reflection of governments’ efforts to design their austerity policies in a way that mitigates the potential of an electoral backlash. To explore this possibility, we implemented a paired-profile conjoint experiment as part of our second survey, fielded in Italy and Spain in January 2019. Our conjoint experiment randomized the composition of austerity packages in terms of cuts in spending (on defense, education, welfare, public sector jobs, and pensions) and tax hikes (in terms of income tax, sales tax, and corporate tax).Footnote 16 The order of the spending cuts and tax hikes varied randomly between individuals, but it was kept constant within individuals to avoid confusing respondents. In order to provide flexibility in assessing support for a broad range of austerity packages, we devise an approach that treats the conjoint analysis in a more flexible and data-intensive manner than previous applications.
First, rather than limiting each attribute in the conjoint to a small number of levels, we draw the values on each of the dimensions of austerity from a quasi-continuous set of values (integers) ranging from 0 to 30.Footnote 17 This represents a departure from common conjoint experimental designs, which generally draw from a much smaller number of levels for each attribute, and allows us to collect information on a much more fine-grained space of austerity packages than would be feasible with a standard conjoint design. To achieve data coverage over as much of the space as possible, we asked each of our respondents to evaluate 10 pairs of conjoint profiles (20 packages in total),Footnote 18 thereby taking advantage of recent research showing that response quality in conjoint experiments does not deteriorate after this number of tasks (Bansak et al. Reference Bansak, Hainmueller, Hopkins and Yamamoto2018; Jenke et al. Reference Jenke, Bansak, Hainmueller and Hangartner2021). In addition, for the portion of our analyses in which we predict levels of support for specific austerity packages, we pair our high-dimensional conjoint design with an analogous flexible prediction method, described below.
To explore preferences over specific austerity policy proposals, we present respondents descriptions of two hypothetical packages and elicit their ratings of each package by asking, “If you could vote on each of these options in a referendum, how likely is it that you would vote in favor or against each of the options? Please give your answer on the following scale from vote definitely against (1) to vote definitely in favor (10). In analyzing the rating variable, we dichotomize it into an indicator of support (6–10) or not support (1–5). We are then able to use this dichotomized rating measure to estimate the proportion of the population (or subpopulation of interest) that supports specific policy packages.
As an additional measure, we also ask respondents to indicate which of the two packages in each pair they prefer (forced choice). The forced-choice response is a standard method of measuring relative preferences in conjoint designs, particularly for the estimation of the average marginal component effects (AMCEs) of each attribute (Bansak et al. Reference Bansak, Hainmueller, Hopkins, Yamamoto, Druckman and Green2021; Hainmueller, Hangartner, and Yamamoto Reference Hainmueller, Hangartner and Yamamoto2015). However, our analysis of absolute levels of support cannot be performed with the forced-choice response because the latter elicits, by design, support for exactly half of the generated profiles. Therefore, we focus on the dichotomized rating measure of support in our analyses. The Appendix reports additional results that analyze the forced choice as the dependent variable.
Evaluating Sensitivities to the Design of Specific Austerity Packages
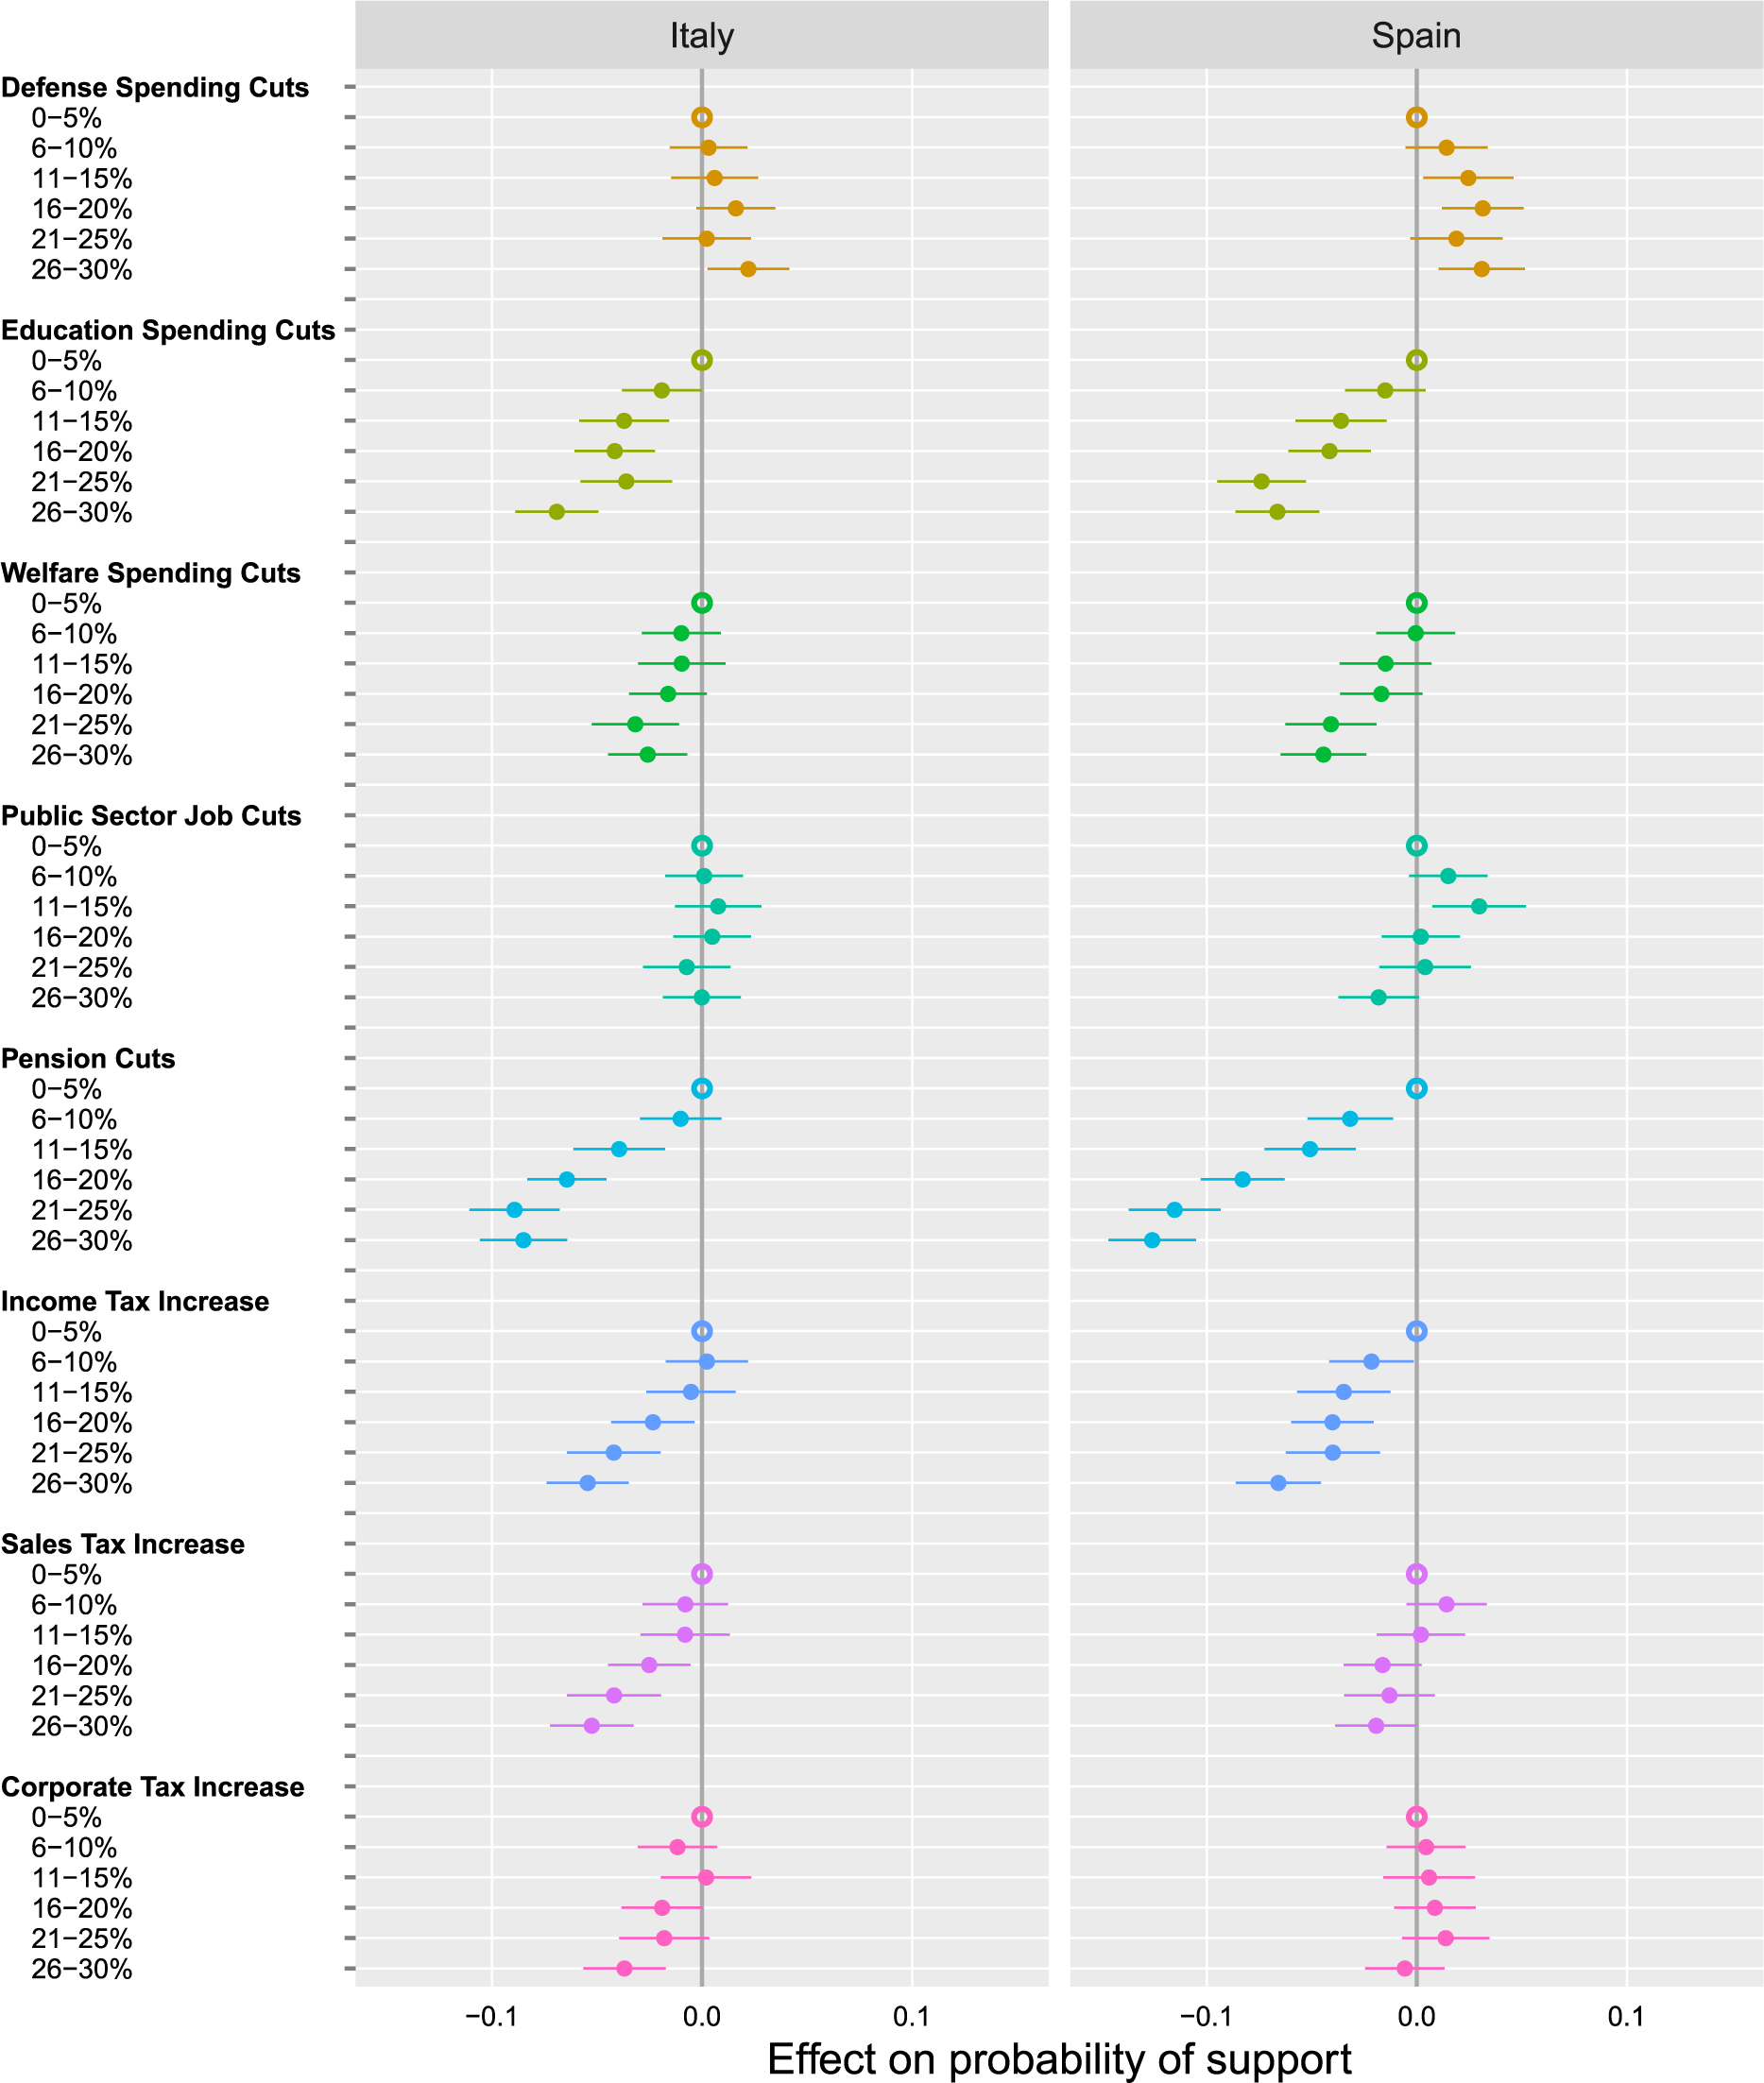
We first estimate the marginal effects of the attributes of the austerity packages on public support. To do so, we first collapse each of the conjoint attribute variables into six bins and then regress the dichotomized rating variable (capturing whether a respondent generally supported or opposed a package) on indicators for each of the attribute bins.Footnote 19 The results are reported in Figure 4, which shows the AMCEs along with cluster-robust 95% confidence intervals for each bin, using the lowest bin as the reference category for each attribute. We find that the multidimensional composition of austerity packages matters a great deal. The probability that a certain option is supported is highly sensitive to specific features of the package, with certain features playing a larger role than others. In both Italy and Spain, respondents exhibit the highest aversion to cutting pensions. Our estimates indicate that including in the package a 21% to 25% cut in pension spending reduces support for the package by about 10 percentage points relative to a 0% to 5% cut. In contrast, a similar cut to each of the other spending dimensions does not result in as pronounced a loss of support. For instance, a 21% to 25% cut in welfare expenditures lowers support by less than about 5 percentage points, and a similar cut in public sector jobs has little to no effect on support. Our results also indicate that voters are actually more supportive of austerity if it entails larger cuts in defense spending.
The Effects of Austerity Design Features on Public Support, by Country
Note: This figure displays the estimated effects of the attributes of the austerity package on respondents’ preference for the package. The dependent variable is the dichotomized rating variable, which equals one if a proposal received a score of 6 or higher on a scale from vote definitely against (1) to vote definitely in favor (10). Dots with horizontal lines indicate point estimates with cluster-robust 95% confidence intervals from a linear probability model estimated via least squares regression. The unfilled dots on the zero line denote the reference category for each binned attribute. Weights applied. The mean probability of support is 0.425 in Italy and 0.365 in Spain. Unweighted results and results using our alternative weights are reported in Figures A12 and A13, respectively.

Turning to the public’s sensitivity to tax hikes, we find that support for an austerity package drops most sharply in response to increases in income taxes, a pattern that is consistent with the findings reported in Ballard-Rosa, Martin, and Scheve (Reference Ballard-Rosa, Martin and Scheve2017). Sales tax increases have slightly smaller effects on the way the package is evaluated. Finally, the results suggest that increases in the corporate tax rate have little influence on the public’s support for the package, except for perhaps only the most dramatic increases (26% to 30%) in Italy.
Compared with their Italian counterparts, Spaniards appear slightly more supportive of defense spending cuts and are more agnostic about sales and corporate tax increases. Yet overall, we observe few notable differences in preferences regarding the composition of austerity packages across the two countries. The results are very similar when analyzing respondents’ forced choice as the dependent variable (see Figure A10).
We also explore whether the sensitivities vary by ideology and knowledge (see Figures A14 to A17). To do so, we estimate marginal means of support for the various attribute-level bins across subgroups (Leeper, Hobolt, and Tilley Reference Leeper, Hobolt and Tilley2020). As with support for general austerity, we find similar evidence that left-wing respondents and high-knowledge respondents are in general less supportive of austerity measures (compared with right-wing and low-knowledge respondents). However, putting aside these general shifts, we find few systematic differences in the sensitivities to changing the magnitudes of the austerity measures across the left-right and knowledge divides (i.e., the gradients/patterns of support as each particular measure is intensified do not vary systematically across these groups of respondents in either country). The one notable exception to this is that left-wing respondents are more supportive of an austerity package the more it entails defense spending cuts, while voters on the right are not sensitive to this feature. While this finding indicates heterogeneity in the effect of defense spending cuts across left-right ideology, it does not establish that left-right ideology is necessarily itself the cause of this moderation (Bansak Reference Bansak2021).
Overall, the analysis shows that individuals strongly condition their support for austerity policy on its precise design in terms of spending and revenue measures. However, we have yet to answer the politically important question of whether a majority of the public would actually support a given package. The answer is pertinent for understanding whether the design of austerity packages helps explain the widespread preference for austerity as the response to an economic crisis.
Predicting Levels of Support for Specific Austerity Packages
We now explore whether actual austerity packages that have been implemented would receive majority support, both among the general public and separately within each ideological camp. To identify relevant packages for respondents to evaluate, we reviewed the austerity packages implemented in Italy and Spain during the period 2009–2014. We then recorded the composition of these policy responses in terms of spending cuts and tax increases. As a theoretically useful comparison that captures one type of context conditionality related to whether austerity is externally imposed, we also recorded the composition of the austerity package that was implemented in Greece. This package was externally imposed and therefore was designed with presumably less attention to the sensitivities of voters.Footnote 20
Although existing work has predicted levels of support for policy packages using conjoint experimental data (Bechtel and Scheve Reference Bechtel and Scheve2013; Häusermann, Kurer, and Traber Reference Häusermann, Kurer and Traber2019), our research question necessitates several departures from standard approaches to the design and analysis of conjoint experiments. First and as noted above, to ensure that our data-generating process included as fine-grained a range of austerity packages as possible, we employed a quasi-continuous scale for the attributes in our conjoint design. Second, to efficiently handle the high dimensionality of the conjoint design in our analysis, we employ flexible machine-learning methods to estimate the response surface as a joint function of attributes of the austerity packages, as well as respondents’ characteristics. We preserve the quasi-continuous form of the attribute levels because we are interested in predicting the level of support that is generated by a precise austerity package (i.e., a package with a specific value, rather than bin of values, for each attribute). In addition, given our focus on this prediction objective, the marginal causal effects of the austerity design features are no longer of primary interest. This is because the level of support will depend on the relationships between the outcome and the joint distributions of all attributes, not their marginal distributions. In other words, our goal is not to estimate any individual coefficient or interaction but rather to model a response surface (or conditional response surface) as accurately as possible. For this reason, we employ stochastic gradient boosted trees, which is a highly flexible method that automatically detects and models interactions between variables and is known for its ability to achieve high levels of out-of-sample accuracy relative to competing machine-learning methods (Friedman Reference Friedman2002; Friedman, Hastie, and Tibshirani Reference Friedman, Hastie and Tibshirani2009).
In addition, we are interested in predicting support for particular austerity packages not only among the general population but also within subgroups of the population (e.g., left or right constituencies), as defined by the particular characteristics of the group members. Boosted trees allow for the flexible accommodation of covariates beyond the features of the austerity package in question, without requiring the researcher to know or specify in advance which covariates may interact with the package features (or with each other) in increasing or reducing support for a package.
We train our models using cross validation to avoid overfitting, and we verify that our models produce well-calibrated predicted probabilities (see Figure A20), a requirement for being able to accurately estimate aggregate levels of support for specific packages. Finally, we employ a weighted block bootstrap procedure to model uncertainty, an essential requirement for an informative prediction of this type. See Appendix Section III for additional details on the methods used and how alternative methods (cf. Egami and Imai Reference Egami and Imai2019; Horiuchi, Smith, and Yamamoto Reference Horiuchi, Smith and Yamamoto2018) are not as well-suited for our particular use case.
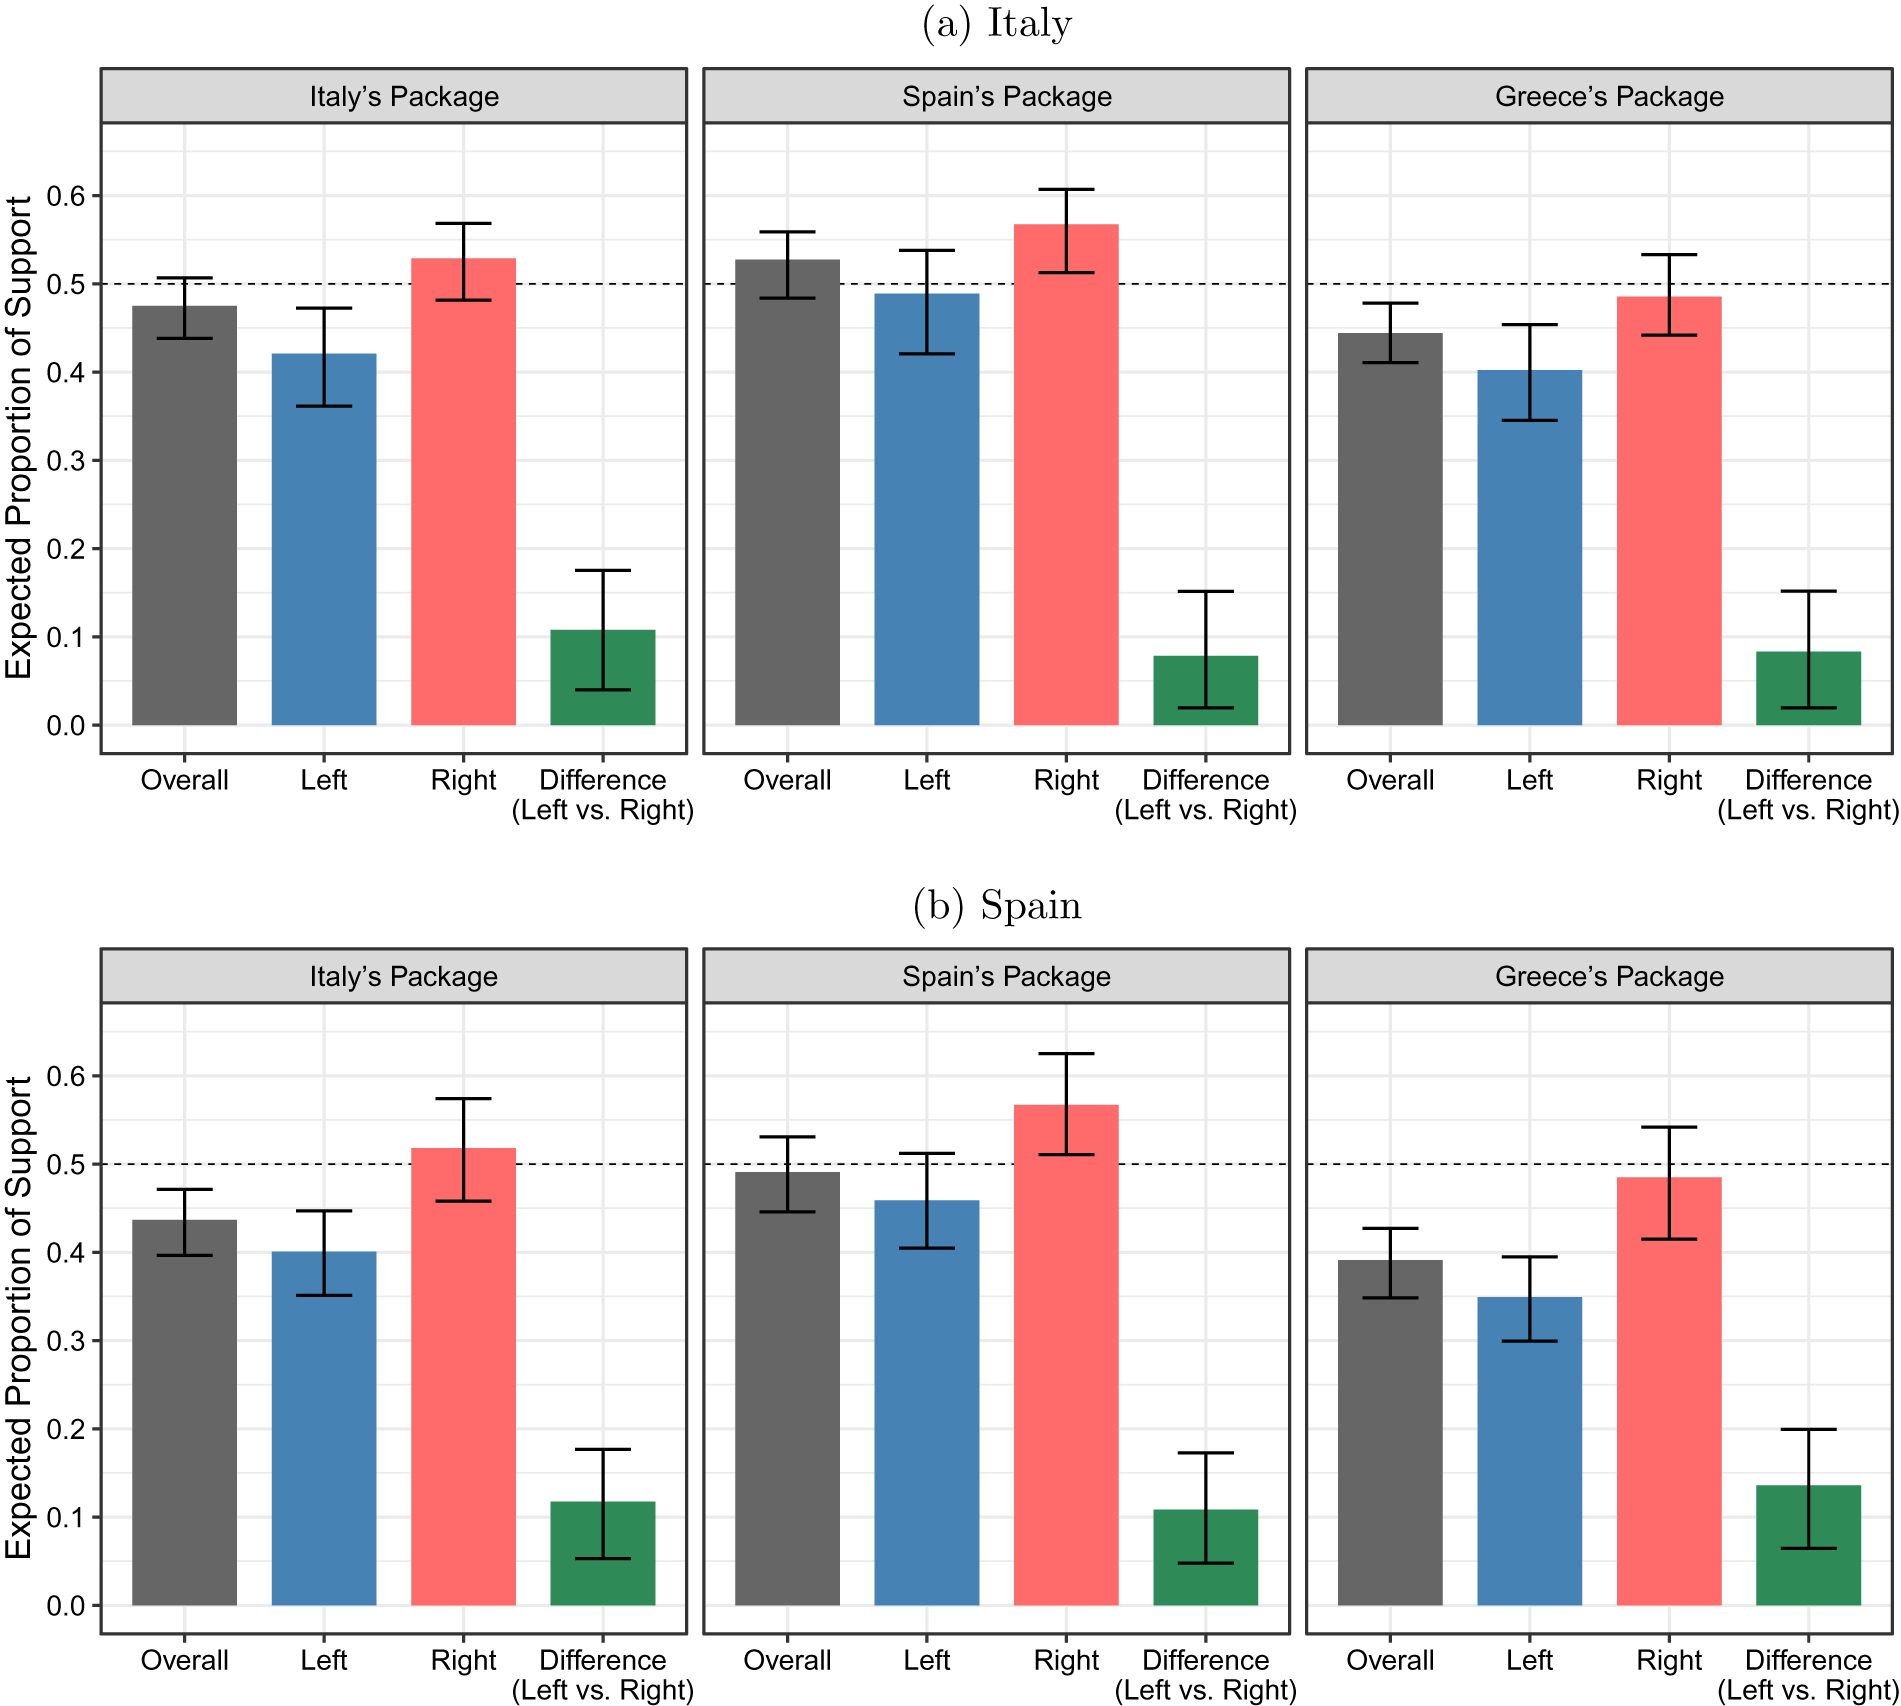
Figure 5 reports the proportion of individuals expected to support a given austerity package overall and by ideology, along with 95% confidence intervals. Looking at the results for the Italian sample, we find that the expected proportion of support for the austerity program that mimics the values of the policy that was implemented is $ 0.47 $
, though not statistically different from
$ 0.47 $
, though not statistically different from $ 0.5 $
. When breaking down support by ideology we find that 40% of left-wing respondents support the package, whereas among right-wing respondents support is about 52%. Figure 5 also reports the difference in support between left and right along with 95% confidence intervals.
$ 0.5 $
. When breaking down support by ideology we find that 40% of left-wing respondents support the package, whereas among right-wing respondents support is about 52%. Figure 5 also reports the difference in support between left and right along with 95% confidence intervals.
Predicted Proportion Supporting Real-World Austerity Packages Overall and by Left vs. Right
Note: The figures show the proportion of individuals predicted to support the austerity package (see Table A16) by country and ideology. Support—a rating of $ 6 $
or greater on the
$ 6 $
or greater on the $ 1 $
–
$ 1 $
– $ 10 $
rating scale—is predicted as a function of austerity package attributes and respondent-level covariates.
$ 10 $
rating scale—is predicted as a function of austerity package attributes and respondent-level covariates. $ N=\mathrm{1,985} $
for Italy, and
$ N=\mathrm{1,985} $
for Italy, and $ N=\mathrm{1,967} $
for Spain. 95% confidence intervals are reported.
$ N=\mathrm{1,967} $
for Spain. 95% confidence intervals are reported.

The austerity program for Spain appears slightly more likely to receive majority support in Italy, although the predicted overall proportion is again not statistically different from 0.5. Finally, the Greek austerity package—which was introduced in response to a massive financial crisis and was externally imposed to a large degree—falls significantly short of majority support, with an expected proportion of only $ 0.44 $
in support. This policy entailed exceptionally large pension cuts (about 20%), a high share of public sector layoffs, and sales tax increases. These results indicate that voters in Italy would have been likely to reject this exceptionally harsh austerity package if it were put forth as a proposal in their own country. But with respect to less severe forms of austerity, the evidence indicates that Italian voters would have potentially been amenable to backing a range of fiscal consolidation efforts. For all three packages, we find that support among right-wing voters is significantly greater than that among respondents on the left. At the same time, it is important to note that even among left-wing voters, opposition to each of the austerity packages is far from universal. Instead, a sizeable share of Italian respondents on the left are willing to accept austerity reforms.
$ 0.44 $
in support. This policy entailed exceptionally large pension cuts (about 20%), a high share of public sector layoffs, and sales tax increases. These results indicate that voters in Italy would have been likely to reject this exceptionally harsh austerity package if it were put forth as a proposal in their own country. But with respect to less severe forms of austerity, the evidence indicates that Italian voters would have potentially been amenable to backing a range of fiscal consolidation efforts. For all three packages, we find that support among right-wing voters is significantly greater than that among respondents on the left. At the same time, it is important to note that even among left-wing voters, opposition to each of the austerity packages is far from universal. Instead, a sizeable share of Italian respondents on the left are willing to accept austerity reforms.
We show the analogous results for Spain in the bottom panel in Figure 5. While the predictions reveal that the packages adopted by Italy and Greece would likely fail to garner majority support in Spain, the package that was actually implemented is backed by about 50% of voters. Again, we observe a pronounced ideological cleavage, with a clear majority for the policy among voters on the right.
We also find that, in addition to ideology, several individual-level sociodemographic characteristics such as income, age, and education are also important predictors of the respondents’ support for a given austerity package (see Figures A21 and A22). Some of these variables have been previously used to capture economic self-interest. This is notable since in our analysis of general preferences for austerity versus stimulus, individual-level variables other than ideology, such as income and employment status, were weak predictors. While general support for austerity was hardly related to individuals’ economic standing, once dealing with specific packages, respondents were perhaps better able to assess how austerity would affect them.
Partisan Endorsements and Support for Specific Austerity Packages
Finally, we explore whether the popularity of austerity originates also from voters capitalizing on party cues when forming opinions about whether or not they should support a given austerity proposal. This explanation may be particularly important because voters are often poorly informed about political matters and instead rely on easy-to-use signals from their preferred party. Historically, austerity packages have been backed by both parties on the right and, less frequently, on the left. Examples from recent years include diverse Italian parties such as the Northern League (LN), People of Freedom (PdL), and the left-leaning Democratic Party, all of which have supported austerity programs.Footnote 21 In Portugal, the 2012 austerity budget was approved by a majority that included the Christian Democrats and the left-leaning Social Democrats (PSD),Footnote 22 and in 2019 the Socialist Party (PSOE) in Spain opted to maintain the austerity policy advanced by the previous administration.Footnote 23
A party endorsement is expected to be particularly meaningful to voters who feel closer to the party’s overall policy platform, as it suggests that the policy in question is consistent with the party’s (and hence the voter’s own) position. Such party endorsements could also prove informative in the opposite direction—that is, signaling to voters with different political orientations that the policy in question is one they should oppose. To explore these possibilities, the austerity conjoint experiment provided half of the respondents in half of their paired profiles with information about which party was endorsing a specific package.Footnote 24 We evaluate whether party endorsements interact with the ideological distance between voters’ preferred parties (as measured by the party they voted for in the most recent general election) and the party endorsing the package, by coding the location of each party on the left-right ideology scale (0–10) according to the Chapel Hill Expert Survey (Polk et al. Reference Polk, Rovny, Bakker, Edwards, Hooghe, Jolly, Koedam and Zilovic2017).Footnote 25
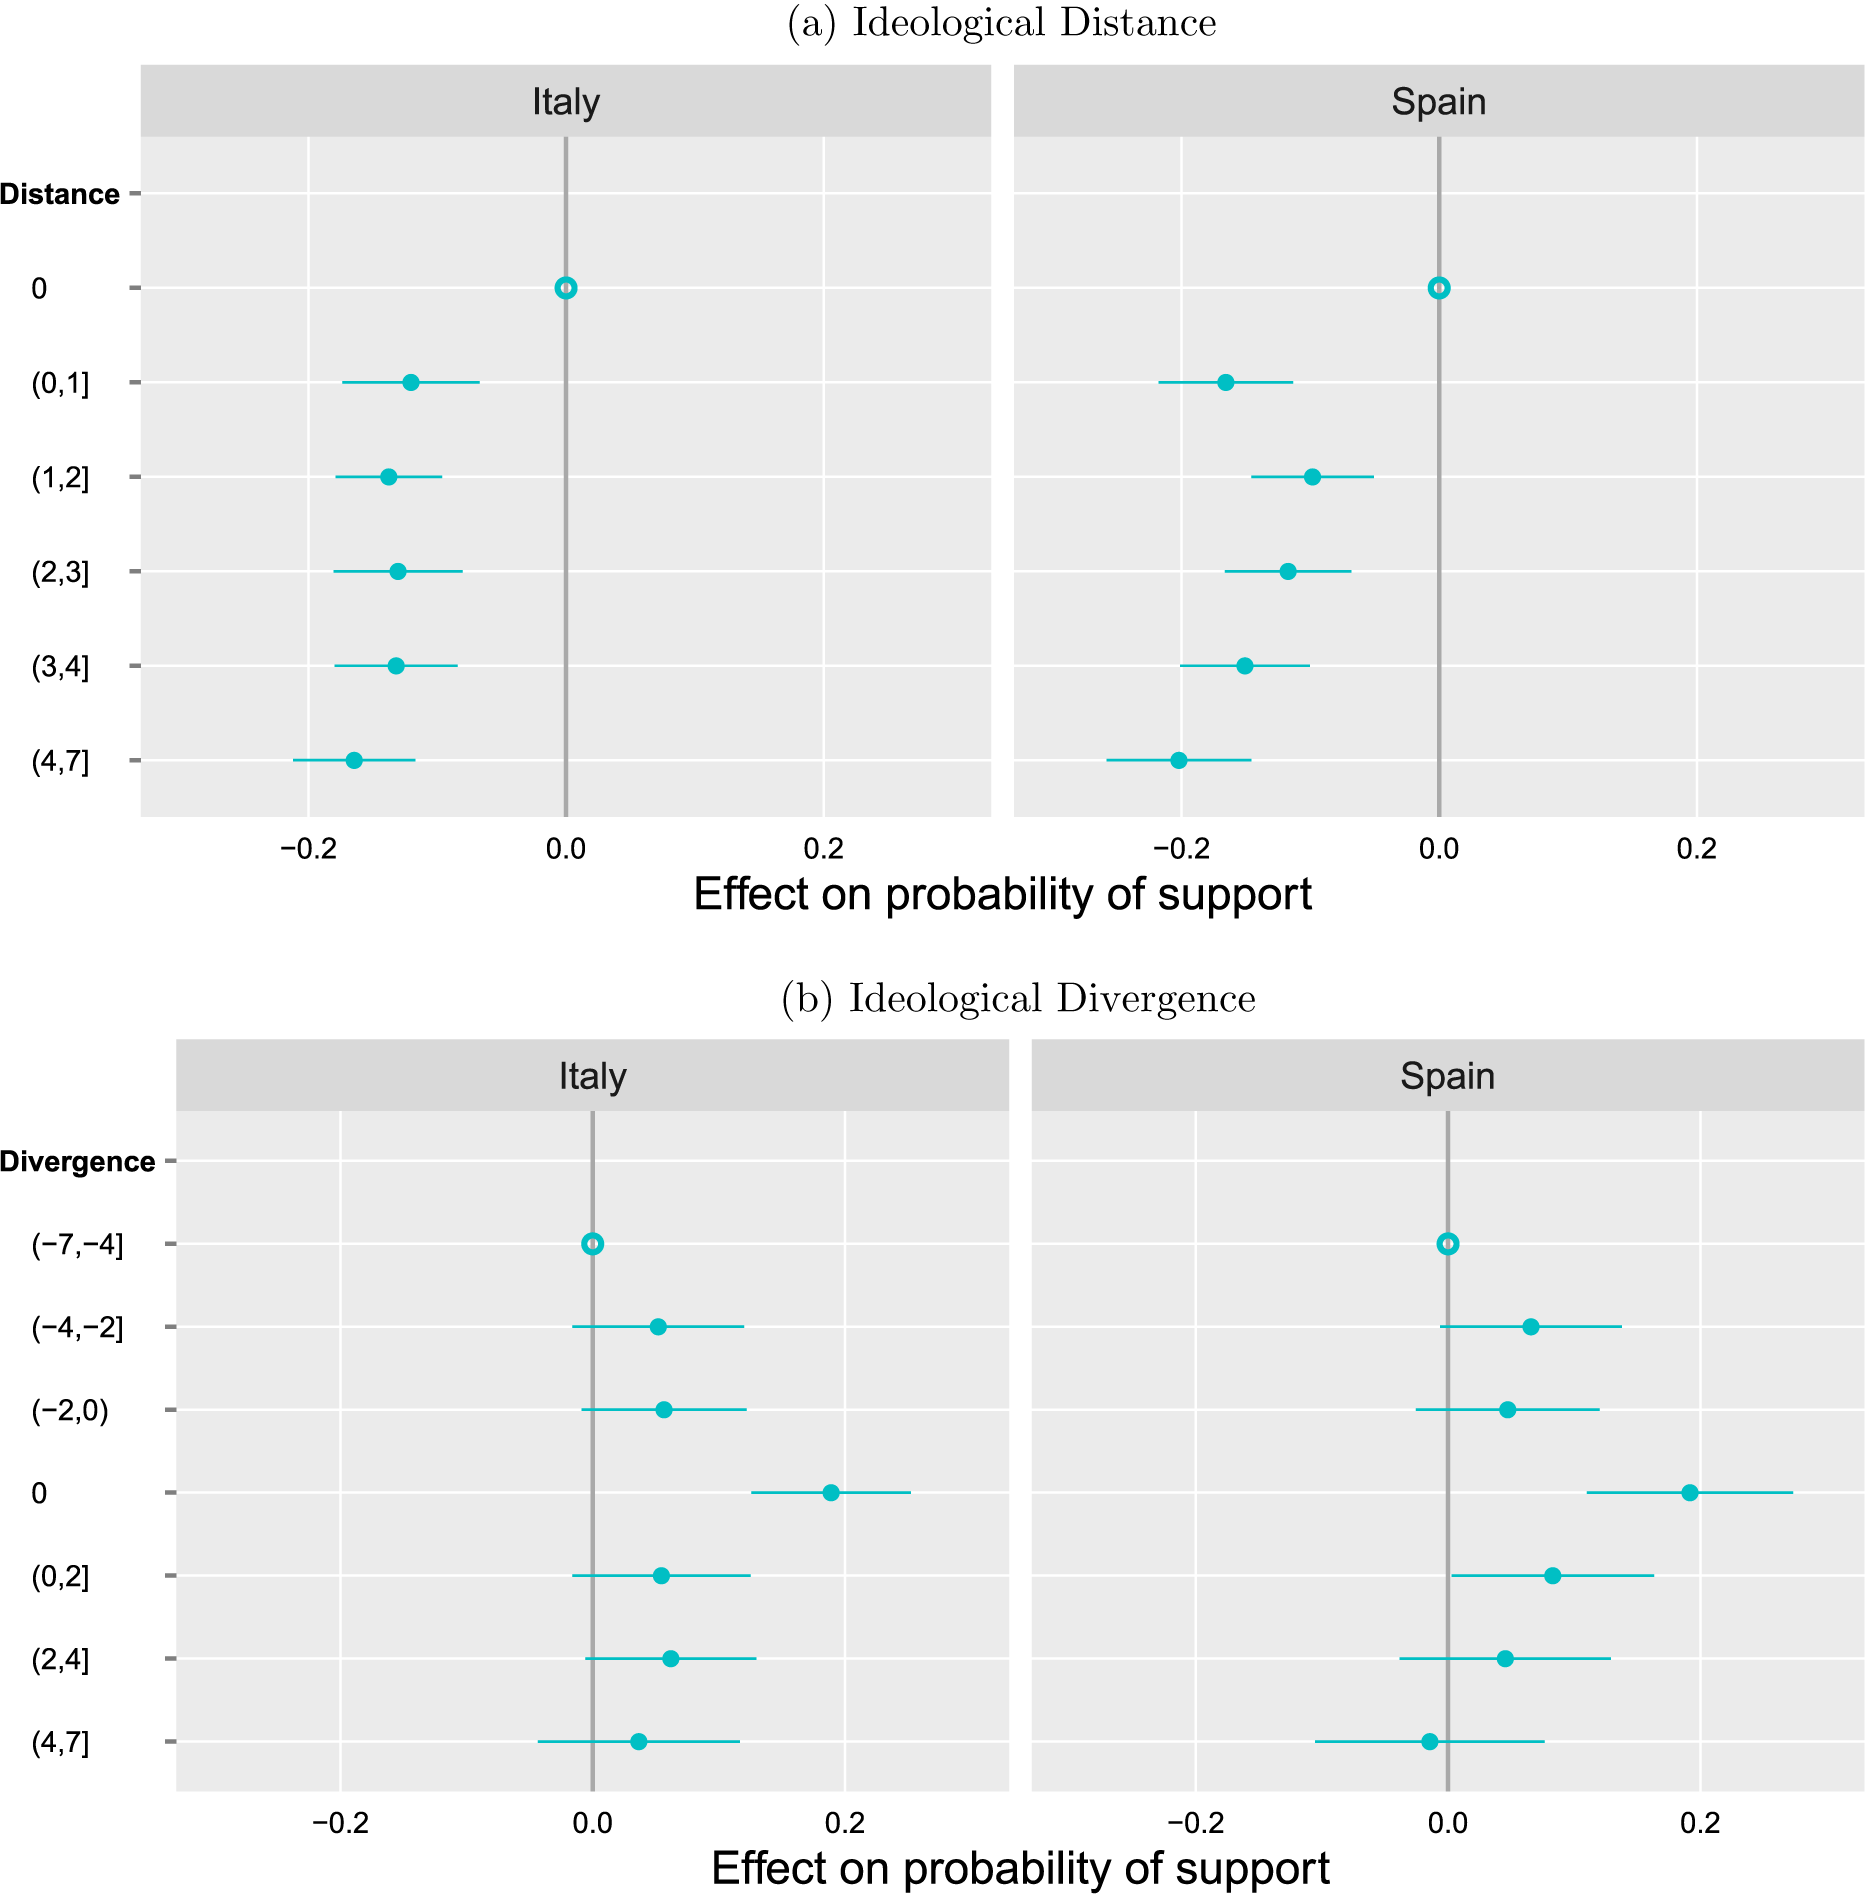
The upper panel of Figure 6 reports the effect of party cues by ideological distance between the voters’ preferred parties and the party endorsing the package. This analysis is based on the subset of conjoint data in which respondents were provided with information about the party endorsements.Footnote 26 In both Italy and Spain, we find that even a small distance between the preferred party and the endorsing party reduces the probability of supporting an austerity package by a whopping 10 to 20 percentage points. To put this effect in perspective, this change is comparable to the drop in support that we observe in response to a massive increase in pension cuts from zero to 30% (see results in Figure 4 above). We also explore whether the effect of party cues depends on whether the endorsing party is located to the right or the left of a respondent. The results, displayed in the lower panel of Figure 6, indicate that the effects are quite symmetric. We also find that the effect of party endorsements is of similar magnitude among left- and right-leaning respondents (see Table A17). Of course, given that the baseline rate of support for austerity is lower among the left, the relative influence of the endorsements on increasing support for a given package is larger among left-leaning voters. We also assess whether the presence of party cues affected the sensitivity to other austerity design features. The results in Figures A23 and A24 indicate, however, that this was not the case.
The Effects of Party Endorsements by Ideological Distance and Divergence from Endorsing Party on Austerity Package Support, by Country
Note: The figure shows the effect of the ideological distance (a) and divergence (b) between a respondent’s party and the endorsing party on the respondent’s preference for a given austerity package. Distance/divergence is measured based on the Chapel Hill Expert Survey’s general political ideology scale. The dependent variable is the dichotomized rating variable, which equals one if a proposal received a score of 6 or higher on a scale from vote definitely against (1) to vote definitely in favor (10). Dots with horizontal lines indicate point estimates with cluster-robust 95% confidence intervals from a linear probability model estimated via least squares regression. The unfilled dot on the zero line denotes the reference category (a distance of zero). Weights applied. The mean probability of support is 0.428 in Italy and 0.355 in Spain.

Overall, the results from this analysis indicate that the high levels of support for austerity reflect two important factors. First, voters are highly sensitive to the composition of austerity packages. Thus, even if the public seems to prefer austerity over fiscal stimulus as a general approach, this does not imply that they would back any austerity package. Instead, some spending cuts and tax hikes are tolerable, and if distributed in a careful manner they can generate majority support. Second, voters’ approval of austerity strongly depends on the identity of the party endorsing the policy. These endorsement effects are large in magnitude, so depending on which parties endorse a package, the effects may be strong enough to outweigh the loss of support caused by the inclusion of certain painful policies. In the concluding section we assess the implications of these findings with respect to the political feasibility of austerity.
Discussion
To probe into the puzzle of why austerity is the preferred response to economic crises, we explore the mass politics of austerity by distinguishing two types of preferences: favoring austerity over stimulus as a general approach and the structure of preferences over specific policy packages. To begin, we find a surprisingly high degree of support for austerity as the preferred policy approach across several countries.
Our investigation highlights the importance of a number of key factors: political ideology, policy design, and party cueing. At the general level, we find that while ideological inclinations account for some of the variation in voters’ attitudes—with right-leaning voters generally being more amenable to austerity—even those on the left exhibit considerable support for austerity. Thus, the austerity-versus-stimulus debate is not exclusively a left-right issue. We also find that the broad preference for austerity has little to do with socioeconomic cleavages and is unlikely to be explained by a messaging advantage that originates from a presumably more intuitive, psychological appeal.
Ideology also plays an indirect role, insofar as it informs partisan attachments. We find that individuals strongly rely on partisan signals to infer whether they should support a given austerity package. The result implies that identical austerity programs will trigger different responses as a function of which parties are backing them. This is important given that austerity has historically been endorsed not only by parties on the right but also, at times, by parties on the left. This type of partisan encouragement may at times prove to be a critical component for securing majority support.
Finally, we find that the specific features of the package itself matter a great deal. Voters may dislike and oppose many austerity packages that include certain spending cuts or tax hikes, but they are willing to support other programs that focus on different policy domains or that vary in the size and depth of the policy shifts they entail. Put differently, by crafting austerity in ways that take into account the sensitivities of voters, politicians can substantially decrease the hostility that austerity generates. These results help address the long-standing puzzle that fiscal consolidation rarely provokes electoral backlash (Alesina, Carloni, and Lecce Reference Alesina, Carloni and Lecce2011; Passarelli and Tabellini Reference Passarelli and Tabellini2017).
Of course, politicians face at times domestic and international constraints that limit their ability to craft austerity in ways that minimize public disapproval. This may be because powerful creditors (e.g., EU lenders in the case of Greece) require the indebted recipient country to pursue certain austerity policies in exchange for a financial bailout or because of the need to appease a domestic coalition partner or key electoral constituencies (Rickard and Caraway Reference Rickard and Caraway2014). Such contextual constraints notwithstanding, our findings suggest that at least in terms of public opinion, governments can advance significant austerity packages without necessarily incurring voters’ wrath.
Our study has focused on documenting and explaining the policy responses that the public prefers after the experience of a debt crisis and a major economic downturn. While we believe that our main theoretical claims and empirical results should apply more generally, we hope future work will examine the extent to which that is the case. The countries we focused on, particularly Spain and Italy, were characterized by a sequence of fragile governments and a longstanding accumulation of debt, even during years of relative prosperity (Conde-Ruiz and Marín Reference Conde-Ruiz and Marín2013; Goretti and Landi Reference Goretti and Landi2013). For citizens in such countries, the introduction of austerity may seem to be a necessary shift, and as such they may perceive it as an appropriate response in hard economic times. One may wonder whether citizens in countries that are traditionally more fiscally prudent would exhibit a similar attitude in the face of crisis. Our results from the UK and France, two countries that entered the financial crisis with lower levels of debt and stronger economies, suggest that the main findings we report may be relevant also for countries with higher levels of economic and political stability. Yet one must of course be careful not to overinterpret these findings because our research design is limited by what is ultimately a small number of country-level data points. The question of how local conditions affect public sentiment toward austerity thus remains pertinent and worthy of further research.
Finally, our study offers a methodological novelty that can extend beyond the investigation of austerity politics. Combining a quasi-continuous conjoint design with a machine-learning approach, the techniques we employed make headway over earlier approaches by being able to integrate information about the causal effects of policy design features, individual-level predictors of support for the policy, and the interactions between the two. This approach allows researchers to generate better predictions regarding the popularity of different policy packages across different groups in the electorate, taking account of the unique characteristics of the groups’ members. We believe that future research can adopt this method to study support for an array of policies and voter preferences for parties and candidates.
The COVID-19 pandemic has caused unprecedented damage to economies worldwide. The debates that revolved around the preferred path to recovery in the aftermath of the global financial crisis are almost certain to resume in full force. In particular, governments will have to grapple with weakened demand and feeble growth, on one hand, and budget shortfalls and swelling national debts on the other. As this study suggests, not only for economic but also for political reasons, austerity is likely to be a central component in the policies that governments will choose to pursue in the years ahead.
Supplementary Materials
To view supplementary material for this article, please visit http://dx.doi.org/10.1017/S0003055420001136.
Replication materials can be found on Dataverse at: https://doi.org/10.7910/DVN/JH5UU8.


 Open access
Comments
No Comments have been published for this article.