


INTRODUCTION
Wildfires are prevalent across much of the world; however, fire records are primarily limited to regions with abundant aquatic archives (e.g., Power et al., Reference Power, Marlon, Ortiz, Bartlein, Harrison, Mayle and Ballouche2008; Harrison et al., Reference Harrison, Villegas-Diaz, Cruz-Silva, Gallagher, Kesner, Lincoln and Shen2022). As a result, identifying a potential sediment deposit commonly found within these areas, such as drylands, would provide a valuable target for paleoclimate studies and a means to evenly distribute fire records globally. The goal of this study is to assess the utility of dune footslope deposits to reconstruct fire histories. As a case study, we focus on stabilized Holocene dunes at the Cooloola Sand Mass (CSM) within the southeast (SE) Queensland dune fields (Fig. 1). The dunes are well dated (Walker et al., Reference Walker, Lees, Olley and Thompson2018; Ellerton et al., Reference Ellerton, Rittenour, Shulmeister, Gontz, Welsh and Patton2020; Patton et al., Reference Patton, Shulmeister, Rittenour, Almond, Ellerton and Santini2022b), their evolution is well understood (Levin, Reference Levin2011; Patton et al., Reference Patton, Shulmeister, Ellerton and Seropian2022a), and there are several aquatic records that can be used for comparison and validation (Donders et al., Reference Donders, Wagner and Visscher2006; Mariani et al., Reference Mariani, Tibby, Barr, Moss, Marshall and McGregor2019; Hanson et al., Reference Hanson, Welsh, Moss and Gadd2023). Specifically, the main objectives were to (1) assess whether sites contain stratigraphically intact units with preserved depositional charcoal for developing a fire record; (2) evaluate the sensitivity of the records to charcoal size classes; (3) place the spatially aggregated charcoal records into the context of other records found in the SE Queensland dune fields; and (4) consider improvements to the data gathering and/or interpretation techniques. The outcomes will aid in the development of charcoal records from areas where fire is a rare event (wetlands/lakes) into regions where fire may be the dominant geomorphic and ecological process.
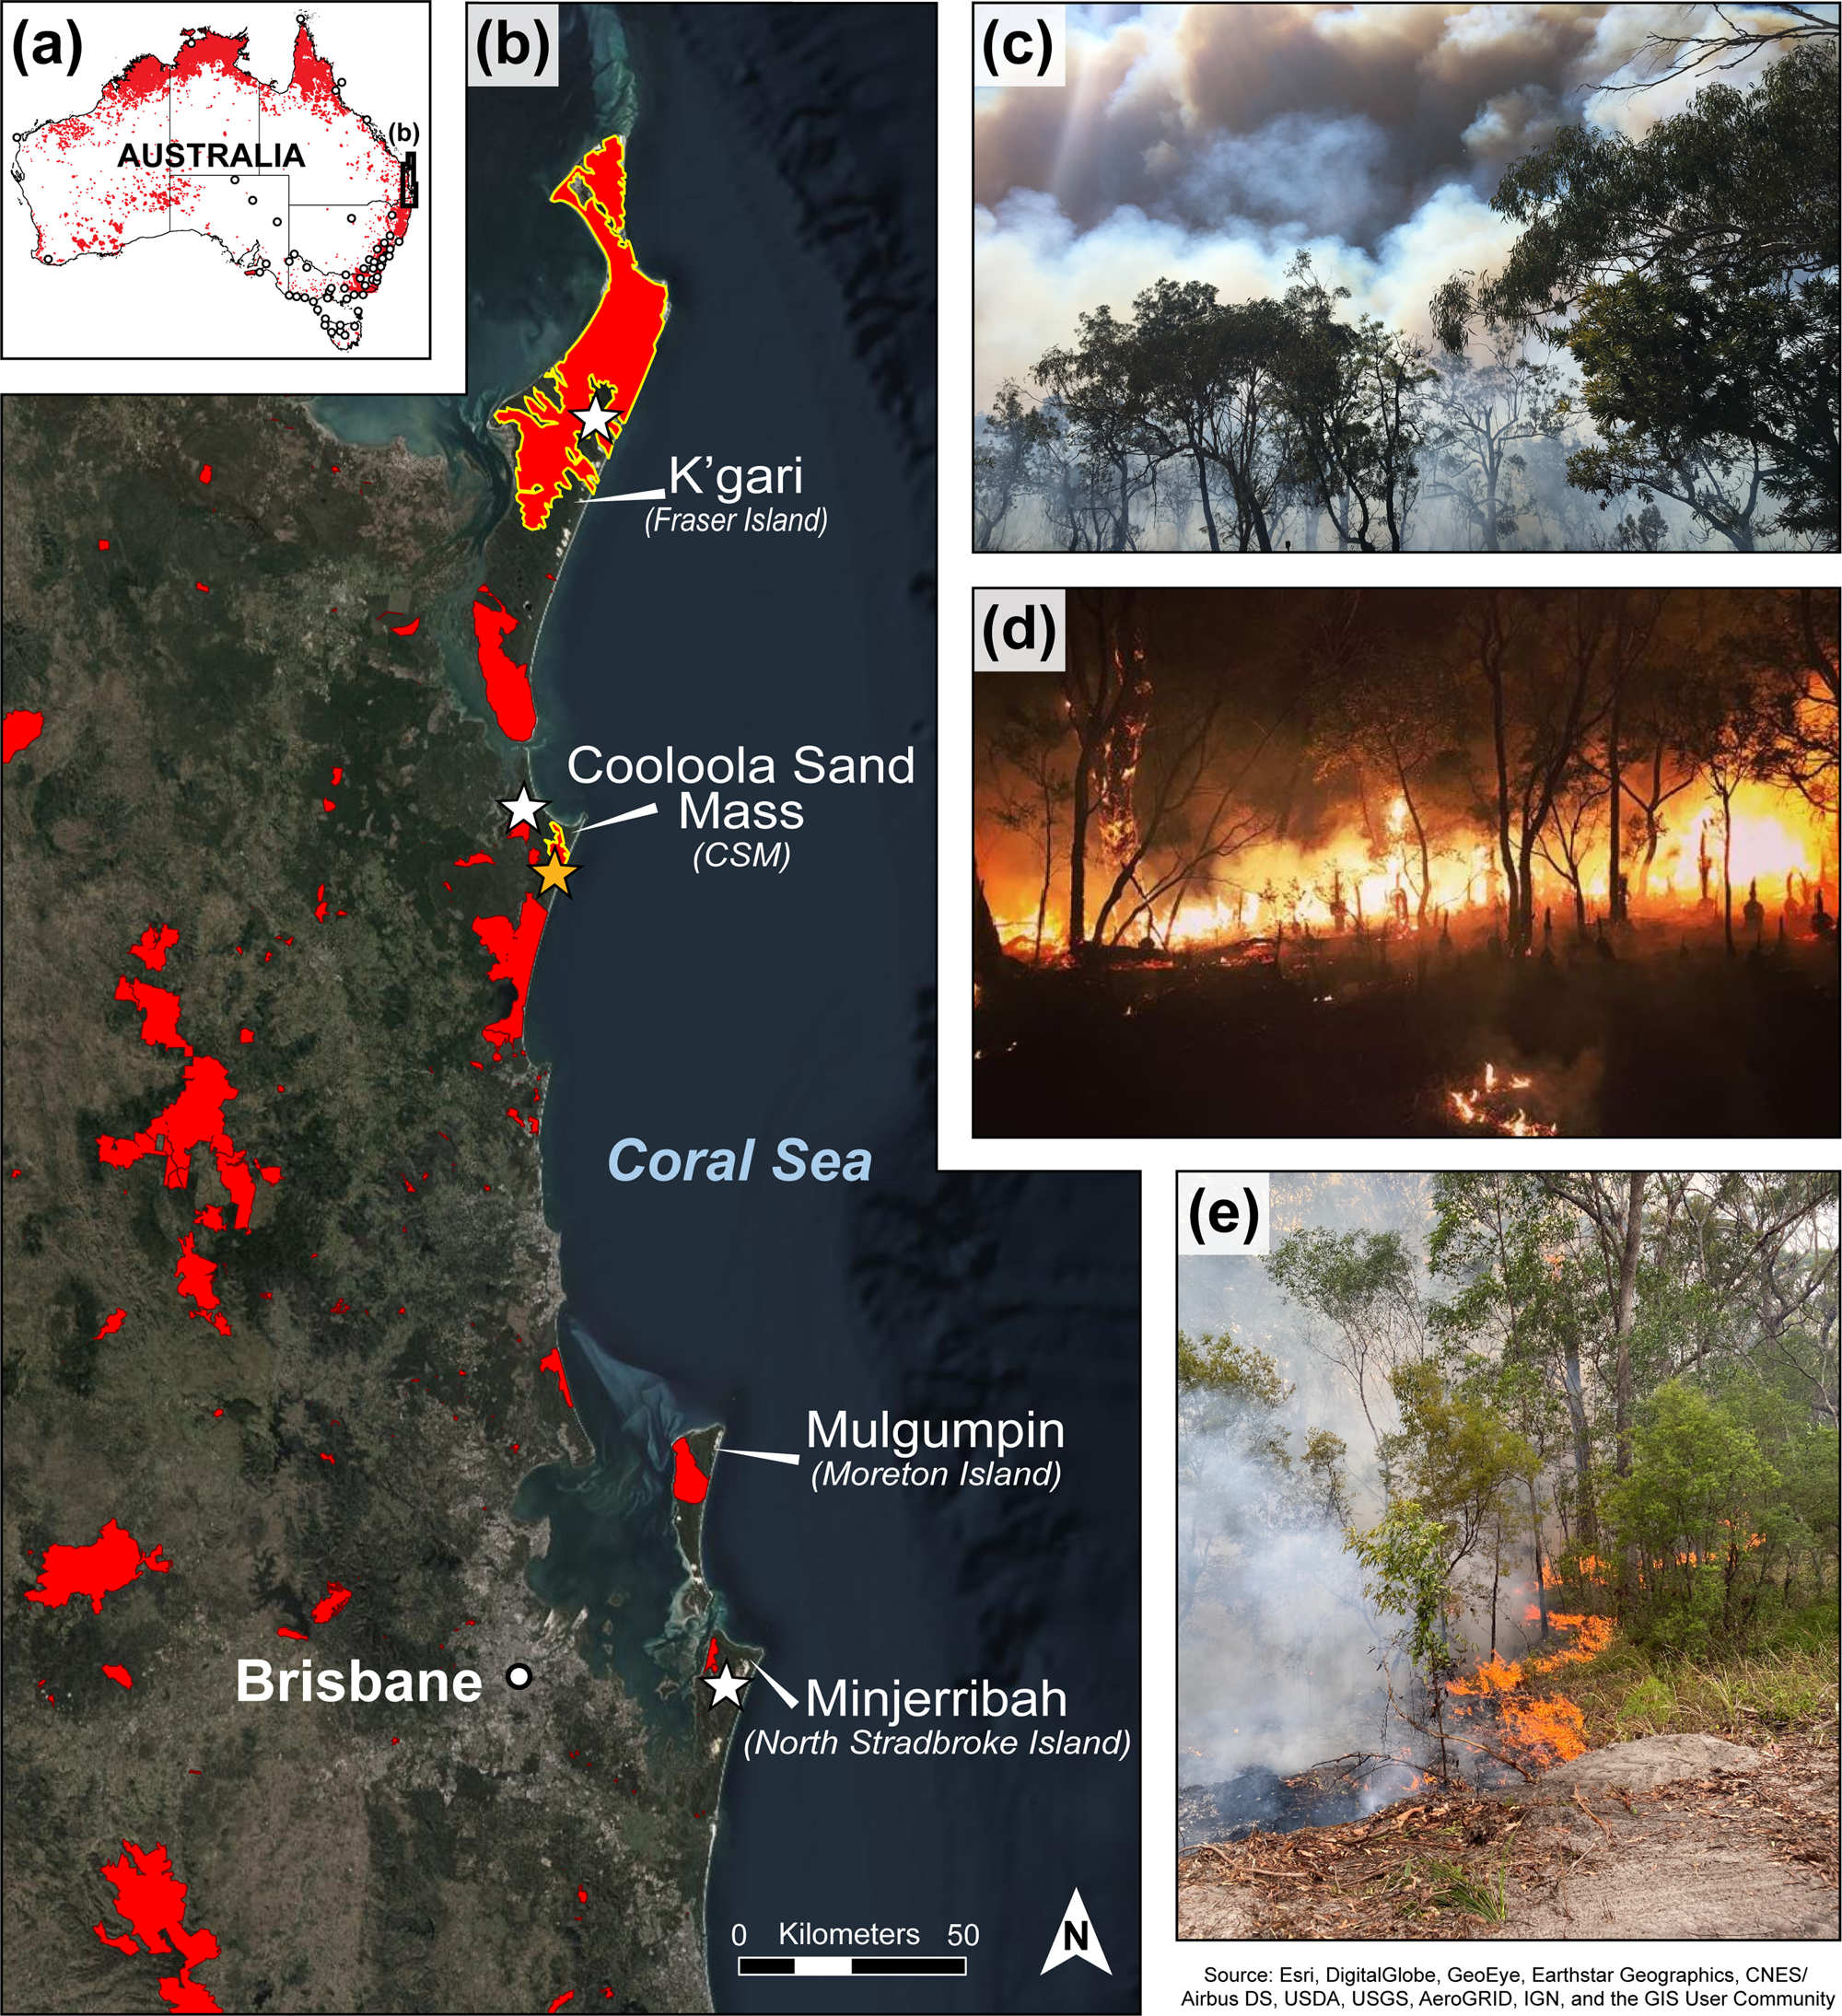
(a) Total area burned in Australia during the 2019–2020 Black Summers bushfires (red area) (DAWE, 2020) and the locations of sediment cores (white dots) used to generate Late Quaternary fire records in Mooney et al. (Reference Mooney, Harrison, Bartlein, Daniau, Stevenson, Brownlie and Buckman2011). (b) Satellite imagery of the SE Queensland dune fields and location of fires during the 2019–2020 fire season with the yellow outlines representing the Fraser Fire and Freshwater Road Fire on K'gari and the Cooloola Sand Mass (CSM), respectively. The orange star marks the field site for this study, whereas the white stars indicate the locations of fire records used for comparative purposes in this research. Images of (c) the Kings Bore Wildfire, (d) the Thannae Fire, and (e) the Freshwater Road Fire are provided as examples of wildfires that occurred within the SE Queensland dune fields during the Black Summers. Photo credits: (c) Michael Ford; (d and e) Erin Atkinson.
Fire in the Australian landscape
Fire is one of the most dominant landscape disturbances on Earth (Hennessy et al., Reference Hennessy, Lucas, Nicholls, Bathols, Suppiah and Ricketts2005; Bowman et al., Reference Bowman, Balch, Artaxo, Bond, Carlson, Cochrane and D'Antonio2009; McLauchlan et al., Reference McLauchlan, Higuera, Miesel, Rogers, Schweitzer, Shuman and Tepley2020). This was clearly demonstrated in the 2019–2020 Black Summers bushfires in Australia, which burned ~240,000 km2, destroyed more than 3000 houses, killed an estimated 1 billion animals, and displaced thousands of people (DAWE, 2020; Filkov et al., Reference Filkov, Ngo, Matthews, Telfer and Penman2020; Richards et al., Reference Richards, Brew and Smith2020; Canadell et al., Reference Canadell, Meyer, Cook, Dowdy, Briggs, Knauer, Pepler and Haverd2021; Gallagher et al., Reference Gallagher, Allen, Mackenzie, Yates, Gosper, Keith and Merow2021; Fig. 1). Fire activity (both frequency and severity) has been projected to increase due to changes in land use and climate (McKenzie et al., Reference McKenzie, Gedalof, Peterson and Mote2004; IPCC, 2021). It is therefore imperative to understand the role, frequency, and intensity of fire in Australia, as it is one of the world's most fire-prone landscapes (Bradstock et al., Reference Bradstock, Williams and Gill2002; Russell-Smith et al., Reference Russell-Smith, Yates, Whitehead, Smith, Craig, Allan and Thackway2007; Bradstock, Reference Bradstock2010; van der Werf et al., Reference van der Werf, Randerson, Giglio, van Leeuwen, Chen, Rogers and Mu2017) and one that has a long legacy of both natural and anthropogenic fire occurrence.
Before the arrival of humans ca. 70–65 ka, evidence of fire in sedimentological records is intermittent and sparse and is presumed to be of minor importance in Australia (Singh et al., Reference Singh, Kershaw, Clark, Gill, Groves and Noble1981; Moss and Kershaw, Reference Moss and Kershaw2000; Clarkson et al., Reference Clarkson, Jacobs, Marwick, Fullagar, Wallis, Smith and Roberts2017). After this period, the subsequent substantial increase in fire activity is commonly ascribed to Indigenous arrival (Kershaw, Reference Kershaw1986; Turney et al., Reference Turney, Kershaw, Moss, Bird, Fifield and Cresswell2001) due to their frequent use of small, low-intensity fire across the landscape, aka “fire-stick farming” (Russell-Smith et al., Reference Russell-Smith, Lucas, Gapindi, Gunbunuka, Kapirigi, Namingum, Lucas, Giuliani and Chaloupka1997; Bowman, Reference Bowman1998). However, more recent studies have suggested little evidence of variations in fire regimes after human arrival, instead ascribing increased fire activity to changes in climate (e.g., Mooney et al., Reference Mooney, Harrison, Bartlein, Daniau, Stevenson, Brownlie and Buckman2011).
The relationship between humans and fire is difficult to address in sedimentological records, because the timing of initial human arrival is not precisely known and there are autocorrelations between climate, vegetation, and fire (Bowman, Reference Bowman1998; Archibald et al., Reference Archibald, Lehmann, Gómez-Dans and Bradstock2013). Not until European arrival and a shift to fire suppression and cessation in the last 200 yr, do we see a clear anthropogenic signal (Moss et al., Reference Moss, Petherick and Neil2011, Reference Moss, Mackenzie, Ulm, Sloss, Rosendahl, Petherick, Steinberger, Wallis, Heijnis, Petchey and Jacobsen2015; Hanson et al., Reference Hanson, VanderGragt, Welsh and Moss2022). Indeed, the transition from traditional fire management to fire suppression is inferred to be responsible for not only increased fire severity, but also a shift in vegetation structure, boundaries, and community composition (Thompson and Moore, Reference Thompson and Moore1984; Pyne, Reference Pyne1998; Fletcher et al., Reference Fletcher, Hall and Alexandra2021; Mariani et al., Reference Mariani, Connor, Theuerkauf, Herbert, Kuneš, Bowman and Fletcher2022; Stone et al., Reference Stone, Maron and Tasker2022).
Regardless of its origin, the role of fire in controlling Australian ecosystems and landscapes is widely accepted as significant (Bowman, Reference Bowman1998). There are large and growing paleofire data sets (e.g., Marlon et al., Reference Marlon, Kelly, Daniau, Vannière, Power, Bartlein and Higuera2015; Gross et al., Reference Gross, Morrill and Wahl2018; Hawthorne et al., Reference Hawthorne, Mustaphi, Aleman, Blarquez, Colombaroli, Daniau and Marlon2018; Harrison et al., Reference Harrison, Villegas-Diaz, Cruz-Silva, Gallagher, Kesner, Lincoln and Shen2022), but the records in these databases are strongly biased toward wetland areas, and consequently, for Australia, there is a strong emphasis on the SE region (Fig. 1a). To broaden the coverage of fire histories, there is a need to extend records beyond peat bogs, swamps, and lakes; however, much of the Australian landscape is not suitable to sustaining long-term organic records (Bridgman and Timms, Reference Bridgman, Timms, Bengtsson, Herschy and Fairbridge2012; Chang et al., Reference Chang, Woodward and Shulmeister2014, Reference Chang, Woodward and Shulmeister2017), and finding suitable sites for the preservation of sedimentary charcoal is therefore challenging (e.g., Leys et al., Reference Leys, Marlon, Umbanhowar and Vannière2018). As a result, there are spatial discrepancies in data coverage across the continent, particularly in the interior and in the tropics and subtropics. A means to extend fire histories to the continental interior, where fires may be the dominant ecological process, is needed. In this study, we examine dune deposits as potential archives of fire history within the SE Queensland dune fields, because these landforms are abundant within the interior and along the coastlines of Australia (Lees, Reference Lees2006; Hesse, Reference Hesse2016) and many parts of the world (Lancaster et al., Reference Lancaster, Wolfe, Thomas, Bristow, Bubenzer, Burrough and Duller2016).
SE Queensland dune field vegetation
The SE Queensland dune fields (aka the Great Sandy Coast) in Australia (24.4°S–27.5°S) include the three largest sand islands in the world—K'gari (Fraser Island), Minjerribah (North Stradbroke Island), and Mulgumpin (Moreton Island)—and the CSM on the mainland (Fig. 1b). These dune fields have existed since ca. 800 ka (Ellerton et al., Reference Ellerton, Rittenour, Shulmeister, Gontz, Welsh and Patton2020, Reference Ellerton, Rittenour, Shulmeister, Roberts, Miot da Silva, Gontz and Hesp2023). They are composed of large parabolic dunes that contain the world's largest rainforest and unconfined aquifer on a sand island and are home to rare flora and fauna (UNESCO, 2021). Their vegetation structure follows a climax succession moving inland from the coast (Walker et al., Reference Walker, Thompson, Fergus, Tunstall, West, Shugart and Botkin1981, Reference Walker, Wardle, Bardgett and Clarkson2010). Biozones change from coastal pioneer communities, through dry sclerophyll forest (e.g., Eucalyptus, Casuarina, and Banksia), to wet sclerophyll forest (e.g., satinay [Syncarpia hillii], Araucaria, and ferns), and rainforest landward, with heathlands and coastal wetlands on the western (inland) side of the dune sequences (Queensland Herbarium, 2021).
While this shift in vegetation structure and composition is inferred to be reliant on nutrient and water availability (Walker et al., Reference Walker, Thompson, Fergus, Tunstall, West, Shugart and Botkin1981, Reference Walker, Thompson and Lacey1987; Thompson, Reference Thompson1992; Thomas, Reference Thomas2003), fire plays an important role in shaping this landscape (Thompson and Moore, Reference Thompson and Moore1984; Walker et al., Reference Walker, Thompson and Lacey1987; Spencer and Baxter, Reference Spencer and Baxter2006). For example, heathlands and dry sclerophyll forest often require frequent, low-intensity fires at a minimum spacing of 8 yr to reduce ground cover and canopy shading and incorporate nutrients into the soils (Keeley, Reference Keeley, Arroyo, Zedler and Fox1995; Bowman et al., Reference Bowman, Murphy, Neyland, Williamson and Prior2014; Queensland Herbarium, 2021).
Wet sclerophyll forest (composed of tall sclerophyll trees with relatively dense understory vegetation such as ferns) is characterized by less frequent fires occurring in SE Queensland at a minimum of 20 yr intervals (Queensland Herbarium, 2021). In these areas, fires are generally suppressed by the forest moisture content. Even wetter are the rainforests, or more accurately, notophyllous vine thickets, that typically avoid burning in all but the driest and most extreme conditions. Local patches of rainforest within the dune fields are associated with the low-lying dune swales that are perennially wet, and when fires penetrate, they are usually low intensity; however, these systems are extremely sensitive to fire (Collins, Reference Collins2019; Queensland Herbarium, 2021).
SE Queensland dune field fire history and geomorphic response
The oldest fire record from the dune island of Minjerribah, ca. 160 km south of the CSM, has preserved fire activity for at least the last ca. 210 ka. There are documented Indigenous traditions of frequent, low-intensity burning on these dune fields (Fensham, Reference Fensham1997; Mulholland, Reference Mulholland2021). The oldest archaeological site on Minjerribah is at Wallen Wallen Creek and is dated to 21 ka (Neal and Stock, Reference Neal and Stock1986). Dated archaeological sites on K'gari and the CSM are much younger, with the oldest published age at ca. 5.5 ka (McNiven, Reference McNiven1991), but it is likely that these areas have been inhabited at least as long as Minjerribah.
More recently, Indigenous land management has been absent from the dune fields and replaced by a fire-suppression regime that dates to the expansion of the timber industry ca. AD 1870 (Hawkins, Reference Hawkins, Kikkawa and Nix1975; Spencer and Baxter, Reference Spencer and Baxter2006). The consequent shift to less frequent fires is easily identified in paleoecological studies (e.g., Moss et al., Reference Moss, Mackenzie, Ulm, Sloss, Rosendahl, Petherick, Steinberger, Wallis, Heijnis, Petchey and Jacobsen2015) and has led to the transition of wet sclerophyll forests to rainforest through local fire exclusion (Krishnan et al., Reference Krishnan, Robinson, Firn, Applegate, Herbohn and Schmidt2018). It is also linked to rare, higher-intensity fire events. For example, in late AD 2020, the Fraser Island Fire burned over 50% (~870 km2) of K'gari (Fig. 1b) and is believed to have had a devastating effect on the biota of the dune fields and may be responsible for an acceleration of dune migration (Mulholland, Reference Mulholland2021).
Indeed, fire plays a critical role in transforming the landscape (Fig. 1c–e). It is well documented that fire may lead to the formation, acceleration, and/or erosion of dunes (Levin et al., Reference Levin, Levental and Morag2012; Shumack and Hesse, Reference Shumack and Hesse2018; Ellerton et al., Reference Ellerton, Rittenour, Miot da Silva, Gontz, Shulmeister, Hesp, Santini and Welsh2018; Patton et al., Reference Patton, Shulmeister, Ellerton and Seropian2022a). Ellerton et al. (Reference Ellerton, Rittenour, Miot da Silva, Gontz, Shulmeister, Hesp, Santini and Welsh2018) discovered that the most recent activation of the Carlo Blowout in the CSM was initiated by fire and posited that this was unlikely to be a onetime occurrence. As was discussed in Patton et al. (Reference Patton, Shulmeister, Ellerton and Seropian2022a), fire is one of the primary factors creating the necessary conditions to destabilize steep dune hillslopes. We found that the burned sections of the 2019 Freshwater Road Fire (Fig. 1e) induced dry-ravel and sheetwash (similar to sand avalanching), but these processes were limited to the youngest dunes (Fig. 1b, Supplementary Fig. 1). We hypothesized that this was due to changes in sediment transport styles associated with hillslope gradients after fire. This study aims to help elucidate the effects of fire on dune erosional and depositional processes over multimillennial periods, and how these changes may influence our interpretations of charcoal records.
Landscapes such as the SE Queensland dune fields, with high fuel loads and proximity to consistent winds, are prone to wildfires (Filion, Reference Filion1984; Thompson and Moore, Reference Thompson and Moore1984; Srivastava et al., Reference Srivastava, King, Mitchell, Wiegand, Carter, Shapcott and Russell-Smith2012; Shumack et al., Reference Shumack, Hesse and Turner2017; Ellerton et al., Reference Ellerton, Rittenour, Miot da Silva, Gontz, Shulmeister, Hesp, Santini and Welsh2018); however, dune environments are rarely targeted for paleofire reconstruction. This is most likely because they are regarded as too ephemeral or present difficulties for extracting reliable multimillennial environmental records. There are few bogs in the CSM, so there are no fire records documented within the immediate dunes, despite the inferred importance of fire in maintaining the local environment. This is in contrast to the other SE Queensland dune fields (i.e., K'gari and Minjerribah), which have multiple charcoal records (e.g., Donders et al., Reference Donders, Wagner and Visscher2006; Barr et al., Reference Barr, Tibby, Marshall, McGregor, Moss, Halverson and Fluin2013, Reference Barr, Tibby, Moss, Halverson, Marshall, McGregor and Stirling2017; Moss et al., Reference Moss, Tibby, Petherick, McGowan and Barr2013; Atahan et al., Reference Atahan, Heijnis, Dodson, Grice, Le Métayer, Taffs, Hembrow, Woltering and Zawadzki2015; Mariani et al., Reference Mariani, Tibby, Barr, Moss, Marshall and McGregor2019; Schreuder et al., Reference Schreuder, Donders, Mets, Hopmans, Damsté and Schouten2019; Kemp et al., Reference Kemp, Tibby, Barr and Arnold2021; Maxson et al., Reference Maxson, Tibby, Marshall, Kent, Tyler, Barr, McGregor, Cadd, Schulz and Lomax2021) from bog, lake, and fen settings. The closest records from the CSM dune field are from the Rainbow Beach patterned fen complexes approximately 10 km northwest of the dune field (Moss, Reference Moss2014; Hanson et al., Reference Hanson, Welsh, Moss and Gadd2023; Fig. 2), which provide local records to compare with records from the CSM.
Site location. (a) Satellite imagery of the Cooloola Sand Mass (CSM) with areas of interest, and the Rainbow Beach patterned fen complex (white star). (b) Closeup of the four dunes used in this study (dashed lines) and locations of the depositional footslope sites (stars) found on each dune's north-facing slipface. The dunes selected in the research represent each of the four major Holocene dune activation/stabilization phases (Patton et al., Reference Patton, Ellerton and Shulmeister2019, Reference Patton, Shulmeister, Rittenour, Almond, Ellerton and Santini2022b; Ellerton et al., Reference Ellerton, Rittenour, Shulmeister, Gontz, Welsh and Patton2020; see Supplementary Fig. 2). (c) Conceptual diagram of sediment transport and deposition on a dune's slipface. Charcoal particles are produced on the dune's surface during fires (small black dots), transported down gradient, and deposited in the footslope as disseminated charcoal or charcoal layers. We hypothesize that charcoal analyzed in this study remains in stratigraphic order and is produced locally, because sediment is retained within the CSM's dune basins (Patton et al., Reference Patton, Shulmeister, Ellerton and Seropian2022a) and charcoal particles are large (between 180 μm and 2 mm). The orange box indicates the location where soil pits were excavated to obtain a fire record for this study. A sand auger was used at the base of each pit to determine the depth of the underlying dune surface (i.e., deposit thickness). This surface is inferred to represent when sediment deposition initiated and reflects the emplacement (stabilization) ages collected from optically stimulated luminescence (OSL) samples on the dune crest (white dot). (d) Soil profile looking up to the crest on the 10 ka dune.

METHODS
Site selection and sampling design
The CSM in SE Queensland, Australia, is positioned approximately 150 km north of Brisbane and immediately south of the sand island K'gari. The dune field has an area of 240 km2 and is composed of large parabolic dunes with crests up to 240 m above sea level. They are composed of >98% well-sorted siliceous sands (180–250 μm) (Thompson, Reference Thompson1983, Reference Thompson1992; Tejan-Kella et al., Reference Tejan-Kella, Chittleborough, Fitzpatrick, Thompson, Prescott and Hutton1990). The freely drained soils and the humid subtropical climate with its warm, wet summers and mild, dry winters (mean annual precipitation = 1500 mm) (Peel et al., Reference Peel, Finlayson and McMahon2007; BOM, 2019) promote podzolization. Sediments are retained within interdune and footslope positions due to the lack of fluvial and eolian erosion following stabilization by vegetation (Patton et al., Reference Patton, Shulmeister, Ellerton and Seropian2022a). The land-surface stability coupled with high porosity and permeability lead to the unabated development of giant podzols (Thompson, Reference Thompson1981). Changes in dune-form age correspond with systematic changes in soil and vegetation development. The dune field has been extensively dated (Tejan-Kella et al., Reference Tejan-Kella, Chittleborough, Fitzpatrick, Thompson, Prescott and Hutton1990; Walker et al., Reference Walker, Lees, Olley and Thompson2018; Ellerton, et al., Reference Ellerton, Rittenour, Shulmeister, Gontz, Welsh and Patton2020, Reference Ellerton, Rittenour, Shulmeister, Roberts, Miot da Silva, Gontz and Hesp2023; Patton et al., Reference Patton, Shulmeister, Rittenour, Almond, Ellerton and Santini2022b) and mapped (Ward, Reference Ward2006; Patton et al., Reference Patton, Ellerton and Shulmeister2019).
Most dunes initiate near the coastline from disturbances such as sea-level rise, storms, and/or fires (Levin, Reference Levin2011; Patton et al., Reference Patton, Shulmeister, Rittenour, Almond, Ellerton and Santini2022b). Their path inland is maintained by the nearly limitless sediment supply from the longshore-drift system (Boyd et al., Reference Boyd, Ruming, Goodwin, Sandstrom and Schröder-Adams2008) and consistent SE winds (Coaldrake, Reference Coaldrake1962) until they are ultimately stabilized by vegetation (Levin, Reference Levin2011). The timing of dune stabilization is penecontemporaneous with the initiation of dune sediment erosion and deposition (i.e., the transition from eolian to colluvial processes) (Patton et al., Reference Patton, Shulmeister, Rittenour, Almond, Ellerton and Santini2022b). These processes have been occurring for at least 800 ka, resulting in one of the oldest and most complex coastal dune sequences in the world (Ellerton et al., Reference Ellerton, Rittenour, Shulmeister, Gontz, Welsh and Patton2020, Reference Ellerton, Rittenour, Shulmeister, Roberts, Miot da Silva, Gontz and Hesp2023).
In this study, we sampled depositional wedges at the base of four closely adjacent Holocene parabolic dunes with emplacement (stabilization) ages of 0.44 ± 0.10 ka, 2.14 ± 0.27 ka, 4.89 ± 0.45 ka, and 9.82 ± 0.98 ka, hereafter referred to as the 0.5 ka, 2 ka, 5 ka, and 10 ka dunes, respectively (Fig. 2b). The age of each dune was determined by optically stimulated luminescence (OSL) dating from dune crest positions, representing each of the four major Holocene dune activation/stabilization phases (Patton et al., Reference Patton, Ellerton and Shulmeister2019, Reference Patton, Shulmeister, Rittenour, Almond, Ellerton and Santini2022b; Ellerton et al., Reference Ellerton, Rittenour, Shulmeister, Gontz, Welsh and Patton2020; Supplementary Fig. 2). Sample sites were chosen from depositional settings at the base of the lee-side slipface of each dune (Fig. 2b). All sampled soil pits have a similar upslope source area (a planar hillslope length of <70 m to the dune crest) on a north-facing dune slipface (Fig. 2c and d) and are located in “dry” sclerophyll forest with similar vegetation types and canopy cover. The dominant taxa include pink bloodwood (Corymbia intermedia), scribbly gum (Eucalyptus signata), forest-oak (Casuarina torulosa), black she-oak (Casuarina littoralis), banksia (Banksia serrata), and blackbutt (Eucalyptus pilularis) with a canopy cover between ~60% and 80%.
Each site was hand excavated to a minimum depth of 1.75 m (Fig. 2d). Additionally, we augered at the base of each pit to determine the depth of the underlying dune surface (i.e., deposit thickness), which was identified by the presence of buried horizons (Fig. 2c). This depth is inferred to represent the initiation of sediment deposition and the timing of dune stabilization (i.e., the transition from eolian to colluvial sediment transport); therefore, we utilized the OSL ages collected from dune crest to reflect the maximum basal age of dune footslope deposits (white dot in Fig. 2c). The profile face was cleaned and described using standard soil description protocols (i.e., Schoenberger et al., Reference Schoenberger, Wysocki, Benham and Broderson2002). Descriptions included characterizing soil horizons, grain size, boundaries of horizons, rooting depths, and soil structure. All charcoal layers and bioturbation features (e.g., ant burrows, nest construction, root growth and decay, and/or evidence of tree throws) were recorded. Charcoal fragments visible on the exposure face were sampled, labeled, and saved for radiocarbon (14C) analysis.
For each soil profile, sediment samples and bulk density cores were extracted (~2000 cm3 and ~260 cm3, respectively) at predetermined depths, with the highest sampling density near the surface. Samples were extracted contiguously across the profile face at 0.05 m intervals from 0 to 0.1 m and then at 0.1 m intervals to 1.5 m, after which intervals of 0.25 m were used. In this study, we assign the midpoint for each sample depth interval when placing them in the context of depth and time (e.g., a depth range of 0.1–0.2 m would be reported as being at 0.15 m). Bulk density was measured using the short core extraction method (Blake and Hartge, Reference Blake, Hartge and Klute1986), which involves driving a core into the pit face and carefully removing it with a flat-edged soil knife. All samples were collected from the bottom of the profile upward to avoid contamination. The sampling was not initially designed with a fire record in mind, and limitations created by the sampling design are discussed later.
Sediment sample preparation
All samples were dried for 48 h at 50°C. Dried samples were passed through a 2 mm stainless steel sieve to remove the coarse fraction (CF). Very little CF was present (average 0.34 ± 0.73% by mass) and only consisted of root and charcoal fragments. This is not surprising in an eolian sand deposit. Coarse charcoal particles in the CF were handpicked and saved for radiocarbon dating. The remaining fine fraction (FF) (<2 mm) soil samples were saved and labeled to be subsampled later for charcoal counting.
Bulk density
Bulk density cores retrieved from the field were oven dried for 48 h at 105°C to remove all moisture and then weighed. A 2 mm sieve was used to partition soils into CF and FF, and each fraction was weighed (m CF and m FF, respectively). The volume of the CF (V CF) was determined for each core by dividing the m CF by the density of the CF, which is assigned a constant 0.5 g/cm3 (Eq. 1a). This density value was selected because charcoal and fine roots range between 0.4 g/cm3 and 0.6 g/cm3 as determined through water displacement. The V CF was subtracted from the bulk density core volume (V T), ~260 cm3, to obtain the FF volume (V FF) (Eq. 1b). Finally, FF bulk density (BDFF) was calculated by dividing the mass by the volume (Eq. 1c) of the FF.


Charcoal counting
Charcoal retained in sedimentological records has been used as a proxy for fire activity and regimes (e.g., Whitlock and Larsen, Reference Whitlock, Larsen, Smol, Birks, Last, Bradley and Alverson2001; Marlon et al., 2016; Hennebelle et al., Reference Hennebelle, Aleman, Ali, Bergeron, Carcaillet, Grondin, Landry and Blarquez2020). Most traditional aquatic archives, such as lakes and bogs, utilize microcharcoal particles (e.g., <125 μm) that are associated with distal sources through either airborne fallout (generally ca. 1–2 km) and/or by inlet streams from the surrounding catchment area (Whitlock and Millspaugh, Reference Whitlock and Millspaugh1996; Whitlock and Larsen, Reference Whitlock, Larsen, Smol, Birks, Last, Bradley and Alverson2001; Higuera et al. Reference Higuera, Peters, Brubaker and Gavin2007). As a result, these records typically represent broad, regional fire signals that may include an amalgamation of vegetation types and biozones (Marlon et al., Reference Marlon, Bartlein and Whitlock2006; Vachula et al., Reference Vachula, Russell, Huang and Richter2018). In this study, we focus our analyses on larger macrocharcoal, which represents local (in situ) fire production originating within ca. 100 m of the dune soil profiles (e.g., Clark et al., Reference Clark, Lynch, Stocks and Goldammer1998; Gavin et al., Reference Gavin, Brubaker and Lertzman2003; Higuera et al., Reference Higuera, Sprugel and Brubaker2005; Sanborn et al., Reference Sanborn, Geertsema, Jull and Hawkes2006; Iglesias et al., Reference Iglesias, Yospin and Whitlock2015; Itter, et al., Reference Itter, Finley, Hooten, Higuera, Marlon, Kelly and McLachlan2017; Leys et al., Reference Leys, Commerford and McLauchlan2017; Morris et al., Reference Morris, Higuera, Haberle and Whitlock2017). We analyzed charcoal >180 μm, because smaller fragments are more susceptible to eluviation processes (the vertical transport of particles through the soil profile), due to the homogenous (180–250 μm) and well-drained (600 mm/h) dune sands (Reeve et al., Reference Reeve, Fergus and Thompson1985).
FF soil samples for all depth intervals were homogenized, subsampled using a riffle splitter (~5 g), and if necessary, treated with 15 mL of 10% HCl for 24 h to remove any sesquioxide coatings on sand grains (i.e., samples collected from well-developed B horizons). Each sample was sequentially wet sieved at 355 μm, 250 μm, and 180 μm. Care was taken to not damage the charcoal fragments. Under a dissecting microscope (2×–20× magnification) all charcoal was counted (no.) in the following size classes (180–250 μm, 250–355 μm, and 355 μm–2 mm). Charcoal counts are converted to charcoal concentration by dividing the charcoal count by the subsample volume (V). The volume is calculated by using the initial subsample mass (m i) divided by the BDFF from the appropriate depth interval (see Eq. 2). This was completed for all samples for each profile, and results are plotted against depth. Additionally, we compare charcoal concentrations between each size class.

Charcoal selection and preparation for radiocarbon (14C) dating
Even in regions with homogenous geomorphology and ecology, it is necessary to acquire a large number of dates to adequately resolve fire history. To build a chronological framework for each depositional profile, we selected charcoal samples to be radiocarbon (14C) dated by accelerator mass spectrometry (AMS). Our primary targets were >2-mm-diameter charcoal fragments picked directly from the profile face of known absolute depths (n = 24). We supplemented these samples with charcoal within the CF (n = 22), and although these charcoal samples have inherently higher uncertainty with regard to depth (i.e., they come from intervals of 0.05 m to 0.25 m), they provide a means to evenly distribute radiocarbon dating across all profiles.
Radiocarbon samples were dated at two laboratories, with 46 samples dated in total. Twelve samples were dated at the Waikato Radiocarbon Dating Laboratory in 2019 and 2021. A further 34 samples were dated at the Australian Nuclear Science and Technology Organisation (ANSTO) radiocarbon laboratory in 2021 and 2022 (Fink et al., Reference Fink, Hotchkis, Hua, Jacobsen, Smith, Zoppi and Child2004). At both laboratories, the charcoal samples were pretreated using the standard acid–base–acid (ABA) protocol before being combusted and graphitized (Hua et al., Reference Hua, Jacobsen, Zoppi, Lawson, Williams, Smith and McGann2001). Sample graphite was then loaded into aluminum cathodes and measurements were determined by AMS. The results were reported in conventional radiocarbon age or percent modern carbon (pMC) (see Table 1).
All ages used to produce age–depth models in this study are from woody macrocharcoal (14C) and primary dune sands (optically stimulated luminescence [OSL]) are reported in years relative to 1950 (Fig. 4).a

a Age calibration was performed using the Southern Hemisphere calibration curve (SHCal20; Hogg et al., Reference Hogg, Heaton, Hua, Palmer, Turney, Southon and Bayliss2020) extended to recent time using the post-bomb atmospheric calibration curve for Southern Hemisphere zone 1–2 (Bomb22SH1-2; Hua et al., Reference Hua, Turnbull, Santos, Rakowski, Ancapichún, De Pol-Holz and Hammer2022), and modeled ages were produced using rbacon (Blaauw and Christen, Reference Blaauw and Christen2011) in R (R Core Team, 2020).
b Lab numbers beginning with Wk, OZ, and USU were analyzed at the Waikato Radiocarbon Dating Laboratory, Australian Nuclear Science and Technology Organisation (ANSTO), and Utah State University Luminescence Laboratory, respectively.
c Surface date in cal yr BP.
d A modern sample, whose measured 14C content was reported in percent modern carbon (pMC) instead of conventional 14C age.
e Originally published in Ellerton et al. (Reference Ellerton, Rittenour, Shulmeister, Gontz, Welsh and Patton2020) in years relative to AD 2018.
f Depth indicates the maximum depth of each footslope deposit (depositional wedge). These depths are assigned a basal age that represents timing of dune stabilization and are obtained from OSL ages collected from dune crests.
g Originally published in Patton et al. (Reference Patton, Shulmeister, Ellerton and Seropian2022a) in years relative to AD 1950.
h Originally published in Patton et al. (Reference Patton, Shulmeister, Rittenour, Almond, Ellerton and Santini2022b) in years relative to AD 2020.
Age–depth model and combining charcoal records
For all profiles, age–depth models were created using the rbacon package (Blaauw and Christen, Reference Blaauw and Christen2011) in R (R Core Team, 2020), with the calibration data being the Southern Hemisphere calibration curve (SHCal20; Hogg et al., Reference Hogg, Heaton, Hua, Palmer, Turney, Southon and Bayliss2020) extended to recent time using the post-bomb atmospheric calibration curve for Southern Hemisphere zone 1–2 (Bomb22SH1-2; Hua et al., Reference Hua, Turnbull, Santos, Rakowski, Ancapichún, De Pol-Holz and Hammer2022). All the modeled ages were reported in calibrated years before 1950 (cal yr BP) at 95% confidence interval. Additionally, we set the surface age to 2019 (i.e., −69 cal yr BP; date of sample collection) and the basal ages to the OSL-dated dune ages collected from dune crest (Fig. 2c). We attributed the age for each sample to the midpoint of each sample depth range. Charcoal records were evaluated by plotting sample depth to charcoal concentration (particles/cm3). We normalize for changes in sedimentation rates within and between sites by calculating charcoal accumulation rates (CHAR) expressed in units of particles/cm2/yr (Long et al., Reference Long, Whitlock, Bartlein and Millspaugh1998). Charcoal production can vary among sites due to local conditions (i.e., moisture content, fire intensity, and biomass); therefore, we rescaled each record to range from 0 to 1 by dividing by the maximum CHAR value (Power et al., Reference Power, Marlon, Ortiz, Bartlein, Harrison, Mayle and Ballouche2008). Once normalized, records were combined and plotted against time to establish a composite master charcoal record for the Holocene dune field. For all charcoal records, CHAR peaks were identified visually.
Our results were compared with published charcoal records from a nearby patterned fen complex (Hanson et al., Reference Hanson, Welsh, Moss and Gadd2023) and two lake records with similar forest types and, presumably, similar fire histories (Donders et al., Reference Donders, Wagner and Visscher2006; Mariani et al., Reference Mariani, Tibby, Barr, Moss, Marshall and McGregor2019) (white stars in Fig. 1b, Supplementary Fig. 3). Additionally, we compared the results with Mooney et al.'s (Reference Mooney, Harrison, Bartlein, Daniau, Stevenson, Brownlie and Buckman2011) and Williams et al.'s (Reference Williams, Mooney, Sisson and Marlon2015) subtropical high-pressure belt (25°S–45°S) record of biomass burning. The purpose of this cross-site comparison was to assess whether our master charcoal record depicted reasonable local trends and/or evidence of broad regional fire-regime changes as compared with those derived from more traditional (aquatic) archives.
RESULTS
Field observations and soil characterization
Soil profiles were excavated to a maximum depth of 2.75 m and were classified from youngest to oldest as an inceptisol, rudimentary podzol, podzol, and podzol (Fig. 3). As expected, all soils have uniform grain-size distributions concentrated between 180 μm and 250 μm. The younger profiles from the 0.5 ka and 2 ka dunes have minimal pedogenic development, and charcoal is dispersed throughout the profile; however, distinct charcoal layers (CL) are observed. The 0.5 ka profile had one layer (CL1: 0.2–0.3 m), and no charcoal was observed >1.5 m. All sediment below 1.6 m was classified as primary dune sediment due to its lack of soil development and absence of organic material. The 2 ka profile had four charcoal layers near the base (CL2: 1.20–1.30 m; CL3: 1.70–1.80 m; CL4: 1.90–2.10 m; and CL5: 2.20–2.40 m). In contrast, the oldest profiles from the 5 ka and 10 ka dunes have distinct transitions between the pedogenic horizons, with the exception of the boundary between the A and E horizons, which is diffuse. Charcoal was disseminated throughout the profile, with elevated concentrations at the base and near the surface. Additionally, several months after pit excavations the Freshwater Road Fire (Fig. 1b and e) burned all site locations. The fire removed vegetation and deposited charcoal at the surface, but only induced a ~0.1 m sand ravel deposit on the 0.5 ka dune footslope (Fig. 3a, Supplementary Fig. 1). This deposit was not included in our charcoal analyses and is only utilized as a point of discussion.
Charcoal concentrations for the (a) 0.5 ka, (b) 2 ka, (c) 5 ka, and (d) 10 ka dune depositional sites. For each depth interval (width of bar) charcoal was counted for size classes 180–250 μm (dark gray), 250–355 μm (gray), and 355 μm–2 mm (light gray). Charcoal layers identified in the profile face are indicated by a band of black dots and labeled (CL1–CL5). Samples collected for radiocarbon analysis are indicated with an orange star or an orange circle depending on whether they were collected at a discrete depth or from a sample depth interval, respectively. Charcoal layers only occur on the two youngest dunes and were incorporated in multiple sample intervals due to predetermined sampled depths. Note, the Freshwater Road Fire severely burned and deposited fresh charcoal at the surface of all sites (dashed lines labeled “Freshwater Road Fire”) after pit excavation and sample collection, but only produced a 0.1 m charcoal-rich dry-ravel deposit at the 0.5 ka site. As a result, no charcoal concentrations were recorded for this interval. For more information on each soil profile see Supplementary Figs. 4–8.

For all sites, root growth and decay are the most prevalent forms of postdepositional mixing. This activity is greatest at the surface and rapidly decreases with depth, such that most roots are confined within the A horizon (<0.5 m depth). Unexpectedly, we observed little evidence of other common forms of bioturbation (i.e., ant mounds, rodent burrows, tree throws, and/or nest construction). This is in stark contrast to the upslope, eroding positions at the CSM, where all these processes are commonly observed and where we visually estimated up to 3 ant colonies/m2 along the hillslope surface.
Charcoal concentrations
Charcoal at all sites was well preserved (black, angular, and opaque). Concentrations were consistent across all the sites, and all size classes depicted similar trends with depth (Fig. 3, Supplementary Fig. 4). The 180–250 μm size class contributes approximately half of the cumulative charcoal concentrations for each depth interval, whereas the larger size classes (250–355 μm and 355 μm–2 mm) each contributed about a quarter of the cumulative charcoal concentrations. For this reason, we simplify our results by only reporting aggregate charcoal concentrations hereafter. Combined charcoal concentrations from all size classes (i.e., combined charcoal counts from 180 μm to 2 mm) are measured from 0 to 49.4 particles/cm3, with the highest values found near the surface. Out of the 78 sampled depth intervals, only three samples lacked charcoal (not including samples at depths >160 cm from the 0.5 ka dune, which constitutes the original dune deposit). The average charcoal concentrations for each profile generally increased with dune age from 3.9 ± 5.7, through 5.8 ± 2.8, and 14.5 ± 16.6, to 13.9 ± 11.6 particles/cm3.
Radiocarbon (14C) analysis and age–depth modeling
Radiocarbon results from 46 charcoal particles produced ages ranging from 0.01 to 7.125 cal ka BP (Table 1). We analyzed 12, 14, and 17 radiocarbon samples from the 2 ka, 5 ka, and 10 ka dunes, respectively. The 0.5 ka dune had few radiocarbon targets and only yielded three ages. Due to our sampling strategy, 52% of the total dates are younger than 2 cal ka BP. We observe consistent trends with depth, with only four age reversals (> ±2σ) (Fig. 4). The ages of the sampled intervals represent a range of ages owing to the contiguous sampling design (see Supplementary Table 1); however, we find samples from the same depth interval within sites yield similar ages (e.g., samples 33 and 34; samples 44 and 45 in the 10 ka dune). Sedimentation rates are the highest where charcoal layers are present (i.e., the entire 0.5 ka dune and below 1.20 m on the 2 ka dune). In general, rates decrease moving up the excavated profiles toward the surface.
Bayesian age–depth models generated for the (a) 0.5 ka, (b) 2 ka, (c) 5 ka, and (d) 10 ka dune depositional sites. For each site, we set the age of the surface (0 m) to the date of pit excavation (vertical orange marker), and the basal age to the optically stimulated luminescence (OSL)-dated dune age collected from dune crest. All cal. ages are obtained through radiocarbon (14C) dating of charcoal fragments using the Southern Hemisphere calibration curve (SHCal20; Hogg et al., Reference Hogg, Heaton, Hua, Palmer, Turney, Southon and Bayliss2020) extended to the recent time using the Post-bomb Atmospheric calibration curve for Southern Hemisphere zone 1-2 (Bomb22SH1-2; Hua et al., Reference Hua, Turnbull, Santos, Rakowski, Ancapichún, De Pol-Holz and Hammer2022). Graphs were produced using ‘rbacon’ (Blaauw and Christen, Reference Blaauw and Christen2011) in R (R Core Team 2020). The calibrated year probability distributions estimates are shown as blue and aqua markers for 14C and OSL ages, respectively. The red dashed line bounded by the gray dotted lines represents the age–depth model best fit and the 95% confidence intervals, respectively. Note, the y-axis only extends to 2.75 m, which covers all sample intervals, and does not include the complete age–depth model that extends to the base of each deposit (original dune deposits or onlapped topography). Additionally, samples collected from discrete depths are labeled with an orange star.

CHAR records
Charcoal concentrations are converted into CHAR using accumulation rates derived from the age–depth models. We find that all CHAR values ranged from 0 to 11.6 particles/cm2/yr, and each record shows distinct peaks in CHAR that are detected among sites and size classes (Fig. 5, Supplementary Fig. 4). The 0.5 ka dune has one peak at the surface, whereas the 2 ka dune has a peak between ca. 1.1 and 0.4 cal ka BP. The 5 ka dune record has two peaks. The most recent occurred within the last 0.3 ka and the earlier peak at ca. 3.4–2.6 cal ka BP. The 10 ka dune has four peaks at ca. 6.7–5.3 cal ka BP, peaks between ca. 3.0–2.6 and 2.2–1.6 cal ka BP, and the most recent started ca. 0.5 cal ka BP. When the individual records are combined into a composite master record, we observe five peaks occurring between ca. <0.3, 1.1–0.4, 2.2–1.6, 3.4–2.6, and 6.7–5.3 cal ka BP (vertical orange bars in Fig. 5e) regardless of inclusion or exclusion of CHAR values associated with episodic sediment transport (white line or black area in Fig. 5e, respectively). In general, CHAR peaks increase in frequency after ca. 3.4 cal ka BP, with the highest values in the last century.
Charcoal accumulation rates (CHAR) and the inferred timing of increased fire activity (peaks are vertical orange areas) for the (a) 0.5 ka, (b) 2 ka, (c) 5 ka, and (d) 10 ka dune depositional sites. Locations for all samples are marked with dots, such that white dots indicate episodic sediment transport (sheetwash or dry-ravel) associated with the first 1.5 ka of sediment deposition, while black dots indicate slow and continuous sediment transport (soil creep). Charcoal layers (CL) found in profile faces (Fig. 3) are indicated by a band of black dots and labeled (CL1–CL5). For more information on CHAR for each size class and the locations for all charcoal layers, see Supplementary Fig. 4. (e) A composite master charcoal record was derived from all four sites by dividing each record by its maximum CHAR value and then plotting the normalized CHAR with time. The white line represents a record composed of all CHAR values (n = 77), whereas the black area represents samples that only experienced continuous sediment transport (n = 48).

Not all CHAR peaks register as visible charcoal layers in the soil profiles. Charcoal layers (CL1–CL5) are only observed within the two youngest sites (Fig. 3a and b). These differences are due to the relatively coarse and contiguous sampling intervals and not all charcoal used for radiocarbon dating being from discrete depths. This caused charcoal layers to be incorporated in multiple samples (Fig. 3), including those with low charcoal concentrations, resulting in a smoothed CHAR record.
DISCUSSION
Charcoal preservation within dune footslope deposits
Previous studies have successfully used charcoal records from paleosols in blowouts, deflation basins, and swales to understand dune activity with respect to changes in climate and fire regimes (e.g., Filion, Reference Filion1984; Seppälä, Reference Seppälä1995; Käyhkö et al., Reference Käyhkö, Worsley, Pye and Clarke1999; Mann et al., Reference Mann, Heiser and Finney2002; Arbogast and Packman, Reference Arbogast and Packman2004; Carcaillet et al., Reference Carcaillet, Richard, Asnong, Capece and Bergeron2006; Matthews and Seppälä, Reference Matthews and Seppälä2014). This study represents the first attempt to systematically target dune footslopes (depositional wedges in front of dune slipfaces) to reconstruct a fire record. We propose that dune footslopes are appropriate targets for paleofire reconstruction. Footslopes at the CSM are depositional systems that produce sequences of locally derived sediments. Most or all inorganic sediments produced on the adjacent hillslope (dune front avalanche face) are inferred to be deposited and preserved with little disruption or mixing. Short-term hiatuses are likely present, but field observations demonstrate only minor physical postdepositional mixing of particles >180 μm. These are limited to the near surface through root growth and decay. The lack of physical mixing is supported by intact and distinct soil horizons, consistent charcoal concentrations among size classes, and consistent increases in age with depth. Only four age reversals are observed in our records, and they likely record minor reworking in upbuilding soil A horizons (Almond and Tonkin, Reference Almond and Tonkin1999; Fig. 4).
Fires are common in the dune field (e.g., Mulholland, Reference Mulholland2021), and charcoal is present throughout the profile of the colluvial footslope deposits. As the sites are located within a ca. 2 km radius from each other, the similarity of the records is expected, and indeed necessary, if these types of sites are to be used to produce reliable fire histories. As depicted in the 0.5 ka dune (Fig. 3a), there is no evidence of macrocharcoal (>180 μm) found within the original dune deposit (>1.6 m depth), which suggests charcoal in these depositional profiles must be incorporated after dune emplacement (stabilization). In fact, our previous studies indicated no evidence of charcoal in the primary eolian deposits from our sampled Holocene dunes (Ellerton et al., Reference Ellerton, Rittenour, Shulmeister, Gontz, Welsh and Patton2020; Köhler et al., Reference Köhler, Shulmeister, Patton, Rittenour, McSweeney, Ellerton and Hüneke2021; Patton et al., Reference Patton, Shulmeister, Rittenour, Almond, Ellerton and Santini2022b). The absence of charcoal from primary dune sands within the CSM likely reflects the limited area for fire to initiate in the upwind direction (i.e., the Coral Sea) and the challenge for fire to penetrate into active dunes due to their limited woody fuel loads (Fig. 2b).
Our local records indicate wildfires that occurred within the CSM's dry sclerophyll forest impacted most dune slopes. Perhaps the best evidence for the preservation of paleofire records is that CHAR peaks are traceable between the different profiles (Fig. 5), and the trends are consistent regardless of charcoal size classes (Supplementary Fig. 4). For instance, the 0.5 ka, 5 ka, and 10 ka deposits identified the same ca. <0.3 ka CHAR peak, the 5 ka and 10 ka footslope share the CHAR peak at ca. 3 cal ka BP, and all sites had fresh charcoal deposited on their surfaces from the Freshwater Road Fire (Fig. 3).
An important observation is that we observe minor variability between our records. Fires can be extremely localized and confined to specific sections of the dune field due to the direction of fire propagation or naturally occurring firebreaks (i.e., low-lying swales with high humidity and/or barren sand patches). Indeed, this may explain the differences between our depositional records, especially when episodic sediment transport dominates (within the first ca. 1.5 ka of sediment deposition). However, it could be the result of our sampling design, which lacks the necessary resolution to capture all changes in charcoal production and/or events (Fig. 5). For instance, the 2 ka dune depicts one CHAR peak that incorporates four charcoal layers (CL2–CL5) from ca. 1.1 to 0.4 cal ka BP but did not register at the older sites despite being positioned windward of those sites. This is inferred to be the result of the coarse sample size, which incorporated both periods of low and high biomass burning within the same sample, thereby obscuring potential CHAR peaks (see sample locations: dots in Fig. 5c and d).
Alternatively, the discrepancies could reflect variations in charcoal production or preservation between sites. Cohen-Ofri et al. (Reference Cohen-Ofri, Weiner, Boaretto, Mintz and Weiner2006) demonstrated that oxidizing conditions like those found within the CSM (<5 pH) may degrade charcoal structure, thereby lowering charcoal preservation potential. The charcoal found within our depositional footslopes are large, woody, and structurally strong (slightly hard to hard consistency). Moreover, we find that average charcoal concentrations between the oldest and youngest sites are nearly four times greater despite having been exposed to acidic conditions longer. Although our coarse sampling design prohibited us from addressing this concern, we believe that chemical degradation of charcoal into fragments smaller than our analyses (180 μm–2 mm) is minor and thus does not affect our interpretations. Nevertheless, future studies should consider the preservation potential of charcoal in acidic soil conditions when constructing a fire history.
Sedimentation inferences from the age–depth models
In our previous work, we characterized the first phase of dune hillslope development as occurring through episodic sediment transport (dry-ravel and sheetwash) induced by disturbances such as fire on the steep initial dune gradients (Patton et al., Reference Patton, Shulmeister, Ellerton and Seropian2022a). These perturbations resulted in rapid topographic adjustments (increased footslope sedimentation rates). We discovered that once dune gradients are lowered below their angle of repose (0.65 m/m or 33°), which occurs ca. 1 ka after dune stabilization, a second phase of gradual hillslope evolution with steady and continuous sediment transport (soil creep processes) begins. Indeed, the geochronological and sedimentological data in this study support these assertions.
The age–depth models from the four deposits yield similar trends of increasing age with depth (Fig. 4) and indicate no substantial break in sedimentation or evidence of erosion (truncated horizons), supporting the idea that these dune positions are consistently depositional (Patton et al., Reference Patton, Shulmeister, Ellerton and Seropian2022a). Additionally, we find that sedimentation rates decrease with dune age, which is to be expected due to the “Sadler effect” (Sadler, Reference Sadler1981), which may lead to biases in sedimentological records if not accounted for (Vachula et al., Reference Vachula, Sheppard and Cheung2022). We attempt to account for this effect by averaging the median sediment rate in 100 yr intervals for each footslope deposit and find that sedimentation rates decrease with age from 0.34 ± 0.17, through 0.16 ± 0.13 and 0.05 ± 0.05, to 0.03 ± 0.02 cm/yr.
When plotting our sedimentation rates for each sample interval as a function of time since dune stabilization, we find a distinct transition at ca. 1.5 ka (Fig. 6a). Interestingly, the abrupt shift in sedimentation rates coincides with the presence or absence of charcoal layers found within the excavated sections of the footslope deposits. For example, the ca. 1.5 ka transition occurs at 0.35 m depth on the 2 ka dune, which is above the boundary between charcoal preserved in distinct layers and charcoal dispersed throughout (Fig. 3b).
(a) A log-log plot of the median sedimentation rate for all sampled intervals (dots) from each footslope deposit as a function of time since dune stabilization. Sedimentation rates are initially high (dashed line) then abruptly decrease after ca. 1.5 ka (solid line). (b) Box and whisker plots for sedimentation rates before and after this transition. Boxes are the interquartile range, with the whiskers representing maximum and minimum values. The black dot is the mean, and the horizonal black line represents the median. We hypothesize that the shift in sedimentation rates reflects the transition from episodic (dry-ravel and sheetwash) to continuous sediment transport styles (soil creep) and is associated with the presence or absence of charcoal in layers, respectively. Note that the separation between these two sedimentation rates occurs ca. 1.5 ka after dune emplacement, which is comparable to the findings in Patton et al. (Reference Patton, Shulmeister, Ellerton and Seropian2022a), where we estimated ca. 1 ka for this transition to occur.

We find a substantial difference in the average sedimentation rate between sampled intervals before and after the 1.5 ka transition (i.e., sections associated with either charcoal layers or disseminated charcoal) with mean values of 0.57 ± 0.13 and 0.10 ± 0.07 cm/yr, respectively (Fig. 6b). Our results support that differences in sedimentation rates are associated with the transition from the dominance of episodic to continuous sediment transport on the dune hillslopes (Patton et al., Reference Patton, Shulmeister, Ellerton and Seropian2022a; Fig. 6). Moreover, these findings highlight the idea that the change from presence to absence of charcoal layers reflects a geomorphic process (the transition from dominance of episodic to continuous sediment transport).
In fact, the observed 0.1 m deposit during the Freshwater Road Fire of 2019 (Fig. 3a, Supplementary Fig. 1) onto the footslope of the 0.5 ka dune is consistent with the sedimentation rates during the first phase of sedimentation when charcoal layers are present. For sclerophyll forests, such as those found on the CSM, fires are estimated to occur at ca. 20 yr intervals (Keith, Reference Keith2004). Assuming the Freshwater Road Fire is representative of past fires and that the multimillennial fire frequency–magnitude relationship is appropriate, we would expect a fire to deposit ~10 cm of sediment on average within each 20 yr interval (equivalent to a fire-induced sedimentation rate of 0.5 cm/yr). This estimate is consistent with the sedimentation rates observed in the 0.5 ka and 2 ka deposits, and reflects the contribution associated with episodic sediment transport. Sediment will also actively move downslope even without the perturbation of fire through continuous soil transport processes (e.g., granular relaxation, rain splash, and biogenic soil creep), which we estimated to be an order of magnitude lower (Patton et al., Reference Patton, Shulmeister, Ellerton and Seropian2022a).
Implications of charcoal layers in dune deposits
Rates of sedimentation and the presence or absence of charcoal layers (CL) are intimately coupled with geomorphic and ecological processes and must be considered when generating fire records. In the section, we discuss whether CHAR peaks and/or charcoal layers in pit faces represent fire-based events (Figs. 5 and 3, respectively) and provide plausible mechanisms for their presence within our dune deposits.
It is not straightforward to determine whether CHAR peaks or charcoal layers represent individual wildfires. For CHAR peaks, sampling intervals could span more than one fire event, and even where sampling intervals are narrow, these intervals may reflect several centuries of accumulation. This is particularly true for fire records that lack a strong chronological framework (limited age constraints) and/or have charcoal samples with large inbuilt ages, both of which can make interpretations difficult. Although we are confident in our age–depth modeling due to our large quantity of radiocarbon and OSL dates (n = 50) and small inbuilt ages (ca. 10 yr; sample 2 in Table 1), there are always uncertainties in these analyses (e.g., Whitlock and Larsen, Reference Whitlock, Larsen, Smol, Birks, Last, Bradley and Alverson2001). Therefore, it is inappropriate to claim elevated CHAR values represent single fire events, such as those found in sections where sedimentation rates are low (e.g., peak at ca. 2.2–1.6 cal ka BP in Fig. 5d). We propose that individual fire events cannot be identified from CHAR peaks alone, but rather should be used to indicate phases of increased biomass burning (Long et al., Reference Long, Whitlock, Bartlein and Millspaugh1998; Remy et al., Reference Remy, Fouquemberg, Asselin, Andrieux, Magnan, Brossier and Grondin2018).
Charcoal layers, however, are likely an event-based deposit (Mathews and Seppälä, Reference Matthews and Seppälä2014) (i.e., CL1–CL5 in Fig. 5a and b and Supplementary Figs. 5 and 6). As discussed earlier, layers are only formed before ca. 1.5 ka after dune stabilization, when dune hillslope gradients are above their angle of repose and perturbations such as fires can induce episodic sediment transport near the dune crest. The short (<70 m) and steep (0.65 m/m or 33°) hillslopes promote the rapid delivery of sediments to their subjacent footslopes (e.g., as we observed following the Freshwater Road Fire; Supplementary Fig. 1). These observations indicate that long-term storage of charcoal on hillslopes during this phase is unlikely; therefore, we propose that charcoal layers in pit faces are associated with individual fire events.
An important caveat is that not all fires on oversteepened slopes induce episodic sediment transport, and those that do, do not induce sediment transport evenly across the landscape. To initiate dry-ravel and sheetwash (similar to a sand avalanche), soil cohesion needs to be decreased (Reid and Dunne, Reference Reid and Dunne1996; Roering and Gerber, Reference Roering and Gerber2005). This can occur through the removal of organic matter, reduction of water content and roots, or production of hydrophobic surface soils (Bridge and Ross, Reference Bridge and Ross1983; Doerr et al., Reference Doerr, Shakesby and Walsh2000; Shakesby and Doerr, Reference Shakesby and Doerr2006). These disturbances to the hillslope are dependent on the severity of the fire and are unlikely to be consistent between events (DeBano, Reference DeBano1981). This was demonstrated during the Freshwater Road Fire, where episodic sediment transport styles were not observed evenly across all slipfaces near or at the angle of repose. It is reasonable to assume that only the largest and hottest fires are likely to be represented as woody charcoal layers across multiple sampling locations, whereas layers that occur at only one sample site are likely to reflect local fire conditions.
From our dune footslope sites, we find that there is a clear geomorphic and ecological record preserved within the stratigraphy. We observe three stratigraphic deposits within our sites: (1) sand lacking charcoal; (2) sand with charcoal in layers; and (3) sand with dispersed charcoal. We hypothesize that these records directly relate to the vegetation structure and composition and the dominant active sediment transport style (Fig. 7). While dunes are active or stabilizing, woody charcoal–producing fire is rare. In this phase, sand is exposed with only minor patches of vegetation that are composed of grasses and small shrubs (Levin, Reference Levin2011). The ability of fire to spread is limited, and the lack of woody biomass hinders the production of charcoal, specifically in the larger size classes utilized in this study. Consequently, the sediment delivered from the dune crest to the footslopes through slipface avalanching and granular flows is barren of macrocharcoal (Fig. 7a).
Conceptual diagram of progressive vegetation succession, fire activity, charcoal production, and stratigraphic deposit for an (a) active dune with steep gradients, (b) recently emplaced (stabilized) dune with steep gradients, and (c) emplaced dune with shallow gradients. When dunes are active, vegetation is sparse and fires are assumed to be infrequent and unproductive (a). As woody vegetation such as Eucalyptus spp. or Corymbia spp. becomes established, charcoal production increases (black dots). Charcoal can either be deposited in the footslope positions as layers (black lines in b) or disseminated throughout the profile (gray areas in b and c). The presence or absence of charcoal layers is the result of episodic sediment transport processes (e.g., dry-ravel and sheetwash) and elevated charcoal production on dune gradients that are above the sand's angle of repose (b). The absence of layers but the presence of disseminated charcoal implies slow and continuous sediment transport (i.e., granular relaxation and biogenic soil creep) (c).
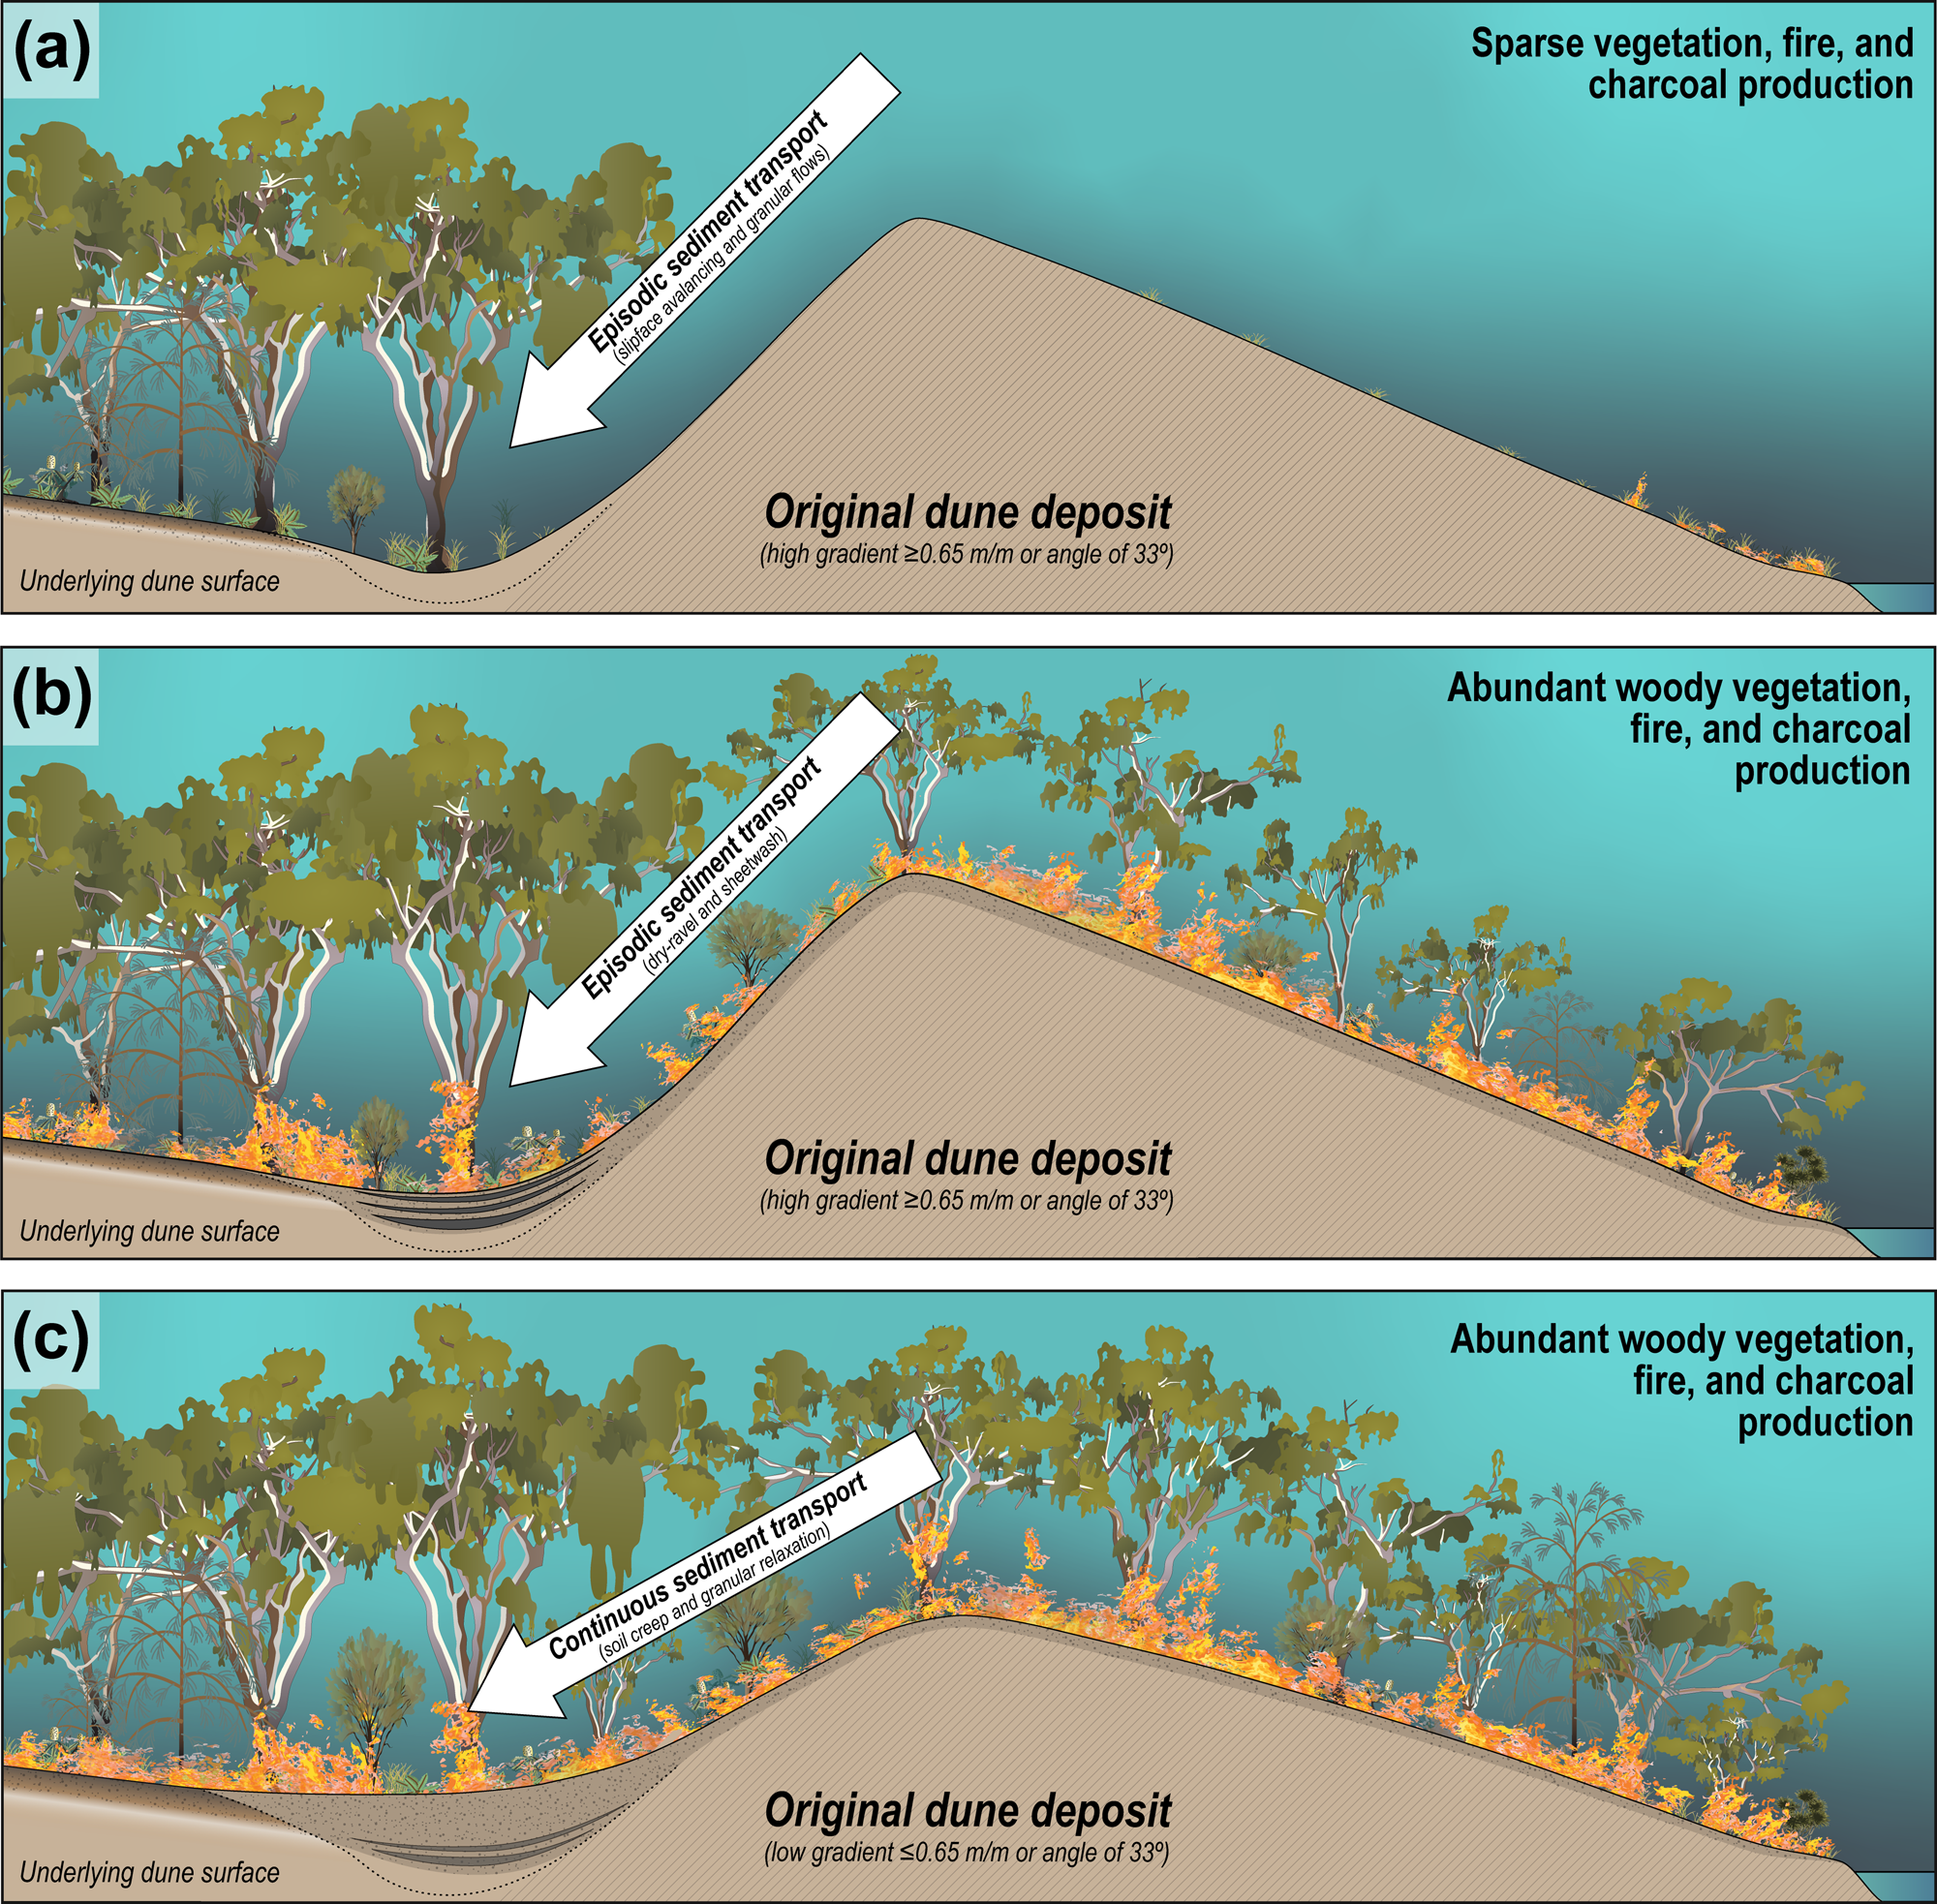
Once the dunes are stabilized, dry sclerophyll forest begins to develop through vegetation succession (Walker et al., Reference Walker, Thompson, Fergus, Tunstall, West, Shugart and Botkin1981); hence fire becomes more prevalent and woody charcoal production increases. We estimate this succession in the CSM to occur ca. 0.3 ka after dune stabilization due to the presence of ~1-m-diameter Corymbia intermedia found on the 0.5 ka dune upslope positions that are estimated to be ca. 175–350 yr old (Ngugi et al., Reference Ngugi, Knight, Hua, Dowling, Kington and Burns2020; Supplementary Fig. 1a). Charcoal produced on the slopes is rapidly transported down gradient through dry-ravel and sheetwash, forming charcoal layers (Fig. 7b). However, episodic sediment transport only occurs while the gradients are above the angle of repose of the dry unconsolidated dune sands. Once gradients are lowered below this threshold, only continuous sediment processes such as granular relaxation or soil creep prevail (Roering et al., Reference Roering, Kirchner and Dietrich1999; BenDror and Goren, Reference BenDror and Goren2018; Patton et al., Reference Patton, Shulmeister, Ellerton and Seropian2022a). This transition is estimated to occur ca. 1.5 ka after dune stabilization, as indicated by the significant decrease in the sedimentation rates beginning at 0.35 m in the 2 ka dune (Figs. 4b and 6). Despite the potential for fire and charcoal production to remain high during this phase, the absence of episodic sediment transport results in only the preservation of disseminated charcoal, with higher and lower CHAR rates representing increasing or decreasing biomass burning, respectively (Fig. 7c).
Comparison of CSM's dune paleofire records with records from the wider region
CHAR values from charcoal layers provide useful insights on sediment transport styles and local fire events; however, these layers should be used cautiously when developing fire records due to their spatial variability within a small area. Therefore, to compare our findings with other local and regional records, we utilize the composite master charcoal record from CHAR values linked to consistent sedimentation styles and rates (disseminated charcoal) (black area in Figs. 5e and 8a), as these deposits should reflect general trends of biomass burning without conflating geomorphic and ecological processes.
(a) Master charcoal record derived from only slow and continuous sediment transport for all sites in this study with increases in biomass burning (vertical orange bars) over three proposed periods of fire activity (black and white bar). Our data are compared with other (b) local (Hanson et al., Reference Hanson, Welsh, Moss and Gadd2023) and (c and d) regional sites (Donders et al., Reference Donders, Wagner and Visscher2006; Mariani et al., Reference Mariani, Tibby, Barr, Moss, Marshall and McGregor2019), as well as (e) a compilation of records from the subtropical high-pressure belt in eastern Australia (125 sites) (Mooney et al., Reference Mooney, Harrison, Bartlein, Daniau, Stevenson, Brownlie and Buckman2011). Locations of local and regional records are indicated in Fig. 1 as white stars. The fire records from the Cooloola Sand Mass (CSM) sites are compatible with those from traditional fire records within SE Queensland (i.e., peats, bogs, and lakes). An asterisk (*) indicates the lack of data.

Our composite master charcoal record indicates three major periods of fire activity in the past ca. 7 cal ka BP that reflect those records derived from lake and swamp deposits in the SE Queensland dune fields and in the wider subtropical high-pressure belt of eastern Australia (24°S–45°S) (Fig. 8). We observe that the earliest peak at ca. 6.7–5.3 cal ka BP corresponds with charcoal records from Minjerribah (Fig. 8d) and a compilation of sites across the nontropical east coast of Australia (Fig. 8e). The Lake Allom record on K'gari (Fig. 8c) registers elevated CHAR values at ca. 7 cal ka BP before a hiatus from ca. 6.5 to 5.4 cal ka BP (Donders et al., Reference Donders, Wagner and Visscher2006). In the wider region, a downward trend in CHAR is observed during this period (Mooney et al., Reference Mooney, Harrison, Bartlein, Daniau, Stevenson, Brownlie and Buckman2011). The only exception is the ca. 4.5 ka charcoal event at the Rainbow Beach patterned fen complex (Moss, Reference Moss2014; Hanson et al., Reference Hanson, Welsh, Moss and Gadd2023), where a local fire close to the patterned fen is the likely source of the elevated CHAR (Fig. 8b). This period of reduced burning was followed by an upswing in fire activity with a large CHAR peak from ca. 3.4 to 2.6 cal ka BP, with a smaller peak in CHAR at ca. 2.2–1.6 cal ka BP that is observed in all local and regional records. These late Holocene events are only observed in SE Queensland. At ca. 1.1–0.4 cal ka BP, there is a gradual increase in burning and CHAR peaks at the CSM, at the Rainbow Beach patterned fen complex, and Lake Allom. Although this peak is absent from the macrocharcoal record from Swallow Lagoon on Minjerribah (Fig. 8b), it is present within its microcharcoal record (Mariani et al., Reference Mariani, Tibby, Barr, Moss, Marshall and McGregor2019). All records show a marked increase in CHAR over the last few centuries between ca. 5 and 0.2 cal ka BP. In summary, the CSM's dune footslope fire records are compatible with those from traditional fire records found within SE Queensland.
Causes of the high CHAR periods
As noted in Figure 8, the charcoal records in the SE Queensland dune fields can be divided into three major periods. Period 1, before ca. 5.3 cal ka BP, shows elevated charcoal indicating increased local burning, while Period 2 has little evidence of fires between ca. 5.3 and 3.4 cal ka BP. This matches records obtained from K'gari and Minjerribah (Donders et al., Reference Donders, Wagner and Visscher2006; Atahan et al., Reference Atahan, Heijnis, Dodson, Grice, Le Métayer, Taffs, Hembrow, Woltering and Zawadzki2015; Schreuder et al., Reference Schreuder, Donders, Mets, Hopmans, Damsté and Schouten2019; Mariani et al., Reference Mariani, Tibby, Barr, Moss, Marshall and McGregor2019) and across the subtropical high-pressure belt (Mooney et al., Reference Mooney, Harrison, Bartlein, Daniau, Stevenson, Brownlie and Buckman2011; Williams et al., Reference Williams, Mooney, Sisson and Marlon2015). The disruption in biomass burning coincides with increases in total rainfall with lower relative variability associated with less frequent El Niño events during period 2 (Barr et al., Reference Barr, Tibby, Leng, Tyler, Henderson, Overpeck and Simpson2019; Fig. 9b–d). An alternative explanation for the transition may be the result of the termination of the postglacial transgression (Lewis et al., Reference Lewis, Wüst, Webster and Shields2008). Before ca. 5.5 cal ka BP, the coastline would have extended significantly seaward from its modern position, which would result in more dune field (land) being seaward of all footslope deposits and increasing the likelihood of fire reaching the sample sites. These hypotheses are not mutually exclusive and indeed likely are the result of both scenarios.
(a) Master charcoal record derived from only slow and continuous sediment transport for all sites in this study (black area). We compare our results with (b) the Swallow Lagoon precipitation record (Barr et al., Reference Barr, Tibby, Leng, Tyler, Henderson, Overpeck and Simpson2019) and (c) the El Junco Lake in the Galápagos Islands and (d) the Lake Laguna Pallcacocha in southern Ecuador records of past El Niño event frequency (Moy et al., Reference Moy, Seltzer, Rodbell and Anderson2002; Conroy et al., Reference Conroy, Overpeck, Cole, Shanahan and Steinitz-Kannan2008). Finally, we compare the (e) probability density function for the timing of dune emplacement at the Cooloola Sand Mass (CSM) (Patton et al., Reference Patton, Shulmeister, Rittenour, Almond, Ellerton and Santini2022b).

Period 3 shows that fire frequency has gradually increased over the last ca. 3.4 cal ka BP (Fig. 8). This increase in CHAR is observed within many SE Queensland records. K'gari records indicate that after ca. 4 cal ka BP, fire activity progressively increased (e.g., Donders et al., Reference Donders, Wagner and Visscher2006; Atahan et al., Reference Atahan, Heijnis, Dodson, Grice, Le Métayer, Taffs, Hembrow, Woltering and Zawadzki2015; Schreuder et al., Reference Schreuder, Donders, Mets, Hopmans, Damsté and Schouten2019). The elevated fire activity was ascribed to increased occupation and amplified Indigenous burning practices (Schreuder et al., Reference Schreuder, Donders, Mets, Hopmans, Damsté and Schouten2019); however, this is difficult to evaluate due to the limited archaeological data available. Alternatively, the increased fire activity is hypothesized to relate to changes in the hydrological cycle primarily through the intensification of the El Niño–Southern Oscillation (ENSO) (Shulmeister and Lees, Reference Shulmeister and Lees1995; Moy et al., Reference Moy, Seltzer, Rodbell and Anderson2002; Donders et al., Reference Donders, Wagner and Visscher2006; Conroy et al., Reference Conroy, Overpeck, Cole, Shanahan and Steinitz-Kannan2008; Barr et al., Reference Barr, Tibby, Leng, Tyler, Henderson, Overpeck and Simpson2019) with minor shifts in vegetation type (Donders et al., Reference Donders, Haberle, Hope, Wagner and Visscher2007; Mariani et al., Reference Mariani, Tibby, Barr, Moss, Marshall and McGregor2019). Again, it is likely that both intensification of human usage and ENSO affected the fire records but may also reflect an artifact of increased sampling frequency in these sediment sections.
At the end of period 3, there is an increase in biomass burning that is widely observed in records across Australia and the world (e.g., Kershaw et al., Reference Kershaw, Clark, Gill, D'Costa, Bradstock, Williams and Gill2002; Power et al., Reference Power, Marlon, Ortiz, Bartlein, Harrison, Mayle and Ballouche2008; Mooney et al., Reference Mooney, Harrison, Bartlein, Daniau, Stevenson, Brownlie and Buckman2011; Williams et al., Reference Williams, Mooney, Sisson and Marlon2015). This elevated biomass burning in Australia is inferred to be a direct result of climate change (Power et al., Reference Power, Marlon, Ortiz, Bartlein, Harrison, Mayle and Ballouche2008; Mooney et al., Reference Mooney, Harrison, Bartlein, Daniau, Stevenson, Brownlie and Buckman2011) exacerbated by European fire suppression (Hanson et al., Reference Hanson, VanderGragt, Welsh and Moss2022; Mariani et al., Reference Mariani, Connor, Theuerkauf, Herbert, Kuneš, Bowman and Fletcher2022).
Climate variability drives vegetation communities and thereby available fuel load and fire frequency in the dry sclerophyll forest of subtropical Australia (Mariani et al., Reference Mariani, Tibby, Barr, Moss, Marshall and McGregor2019). In years with higher water availability, fuel loads increase but fires are suppressed by the moisture content. Dry years enable fires to occur, but the reduced fuel loads make them less intense and frequent. In both scenarios, stable wet or dry climates result in relatively reduced fire risk. In contrast, when interannual climate varies strongly, a condition the SE Queensland dune fields have experienced in the Late Holocene (Barr et al., Reference Barr, Tibby, Leng, Tyler, Henderson, Overpeck and Simpson2019), fuel loads are able to build up in wet years and cure in the subsequent dry ones, resulting in increased fire activity and intensity (Bradstock, Reference Bradstock2010).
Geomorphic and ecological controls on dune paleofire records
Biomass burning can be primarily ascribed to climate-mediated vegetation changes; however, it is important to consider how geomorphic processes may influence vegetation, fire activity, and charcoal deposition (Fig. 7). Across the SE Queensland dune field, CHAR records closely reflect progressive vegetation succession associated with phases of dune activation and emplacement (stabilization) (Fig. 9, Supplementary Fig. 9). We observe that CHAR peaks are inversely related to the timing of major phases of dune emplacement and likely reflect the inability of fire to penetrate through active dune fields. The presence of charcoal in the dune footslope deposits is partially controlled by the local composition of vegetation in the windward direction (SE) on the dune hillslopes (Fig. 7). The first evidence of charcoal occurs directly after the first phases of dune activation at 8.5 ± 1.0 ka during the postglacial transgression (Ellerton et al, Reference Ellerton, Rittenour, Shulmeister, Gontz, Welsh and Patton2020; Patton et al., Reference Patton, Shulmeister, Rittenour, Almond, Ellerton and Santini2022b) (Fig. 9, Supplementary Fig. 9). As sea level rose, dunes were active off the coast and migrated inland (vegetation-free landscape) for years to centuries before stabilizing (e.g., Levin, Reference Levin2011; Houser et al., Reference Houser, Wernette, Rentschlar, Jones, Hammond and Trimble2015; Levin et al., Reference Levin, Jablon, Phinn and Collins2017). While the dunes are active, they act as a natural fire break that hinders the encroachment of fire spreading from the windward direction (Fig. 7a). Not until the emergence of woody vegetation such as Eucalyptus spp. or Corymbia spp. do woody charcoal–bearing fires occur (Fig. 7b and c). These findings matched those found in the Nebraska Sand Hills in the United States, where fire frequency and pollen abundance were inversely related to eolian activity (Schmieder et al., Reference Schmieder, Fritz, Grimm, Jacobs, Brown, Swinehart and Porter2013).
An important caution is that dune activation does not influence fire records equally. Although, dune activation will result in some form of disruption to the vegetation, only the largest dunes will significantly impact the charcoal records. For example, only large active dunes that extend several kilometers inland would pose a substantial barrier for fires. Once vegetated with grasses and shrubs, these dunes become highly flammable ignition sources. These same processes will occur on small dunes but to a lesser extent and under localized conditions.
Recommendations and future applications
Wildfires are prevalent across the world, but fire histories are limited to where wetland sediment records are relatively abundant (Fig. 10). Our study identifies dune footslope deposits as a previously unrecognized record that can help explain past fire regimes and/or provide evidence for how ecosystems, such as those found in Australia, are adapted or not adapted to fire (Fig. 10). Although, this study is based on large, coastal dunes in SE Queensland, we believe these outcomes are not unique to this area. Other similar high-quality records should be present in smaller and older dunes across the world, and we encourage further exploration and methodological development in these archives. A clear path of future research would be to target underrepresented regions such as drylands, where fire records are sparse. We highlight Mediterranean regions, California, and the southwestern United States, northern and southern Africa, and central China as likely high-value targets for this work (Fig. 10a). We provide suggestions on selecting sites and sampling strategies in future studies.
(a) World dryland distribution (orange areas) (Sorensen, Reference Sorensen2007) and published paleofire records (white dots) from the Global Paleofire Database (Harrison et al., Reference Harrison, Villegas-Diaz, Cruz-Silva, Gallagher, Kesner, Lincoln and Shen2022). (b) Closeup view of Australia and the general locations of coastal (yellow) and continental (orange) dunes (Lees, Reference Lees2006; Hesse, Reference Hesse2016). Note the abundant land area in Australia and the world that is both covered in drylands and lacking fire histories. Dune depositional deposits present an opportunity to expand fire records from wetland areas into dryland regions, which to this point have been underrepresented in paleofire studies.

As developed in this study, a network of depositional sites to construct a fire record is encouraged but not necessary. A singular site of significant antiquity coupled with a higher-resolution sampling design can provide useful and continuous local fire records. However, we suggest targeting multiple older, Pleistocene-aged dunes that cover similar time periods. This will increase record length, improve comparison between sites, and reduce biases created by oversampling younger depth intervals. Moreover, it is critical to avoid dunes that have experienced recent reactivations, as their footslopes are prone to hiatuses and large shifts in sediment rates. These data sets are necessary if we are attempting to understand broadscale shifts in fire regimes over glacial–interglacial cycles.
The largest improvement to this study is to undertake a higher-resolution, consistent sampling regime, like those used on lake sediment cores (e.g., 1 cm samples collected every 2 or 5 cm). This would ensure that CHAR peaks are not obscured, 14C dates are collected at discrete depths, and age–depth models are representative of each site. Furthermore, it is important to select samples for fire reconstruction from intervals with consistent sedimentation rates and styles to decrease the risk of conflating geomorphic and ecological processes. As our work highlights, the first ca. 1.5 ka of sediment deposition is dynamic, and fire records may reflect extremely localized and stochastic signals (i.e., CL2–CL5 in Fig. 5b). After this point, sedimentation rates are reduced, and the dominant signal is inferred to represent more regional trends in biomass burning. Determining the timing of this transition is critical, as this shift from episodic to continuous sediment transport is unique to each site and relates to the physical properties of the dune sands (Patton et al., Reference Patton, Shulmeister, Rittenour, Almond, Ellerton and Santini2022b). However, the transition can be easily recognized from the changeover from charcoal layers to dispersed charcoal. While charcoal layers (CL) do not record regional trends in fire activity, they should not be discounted or ignored. Their presence in deposits elucidates processes and relative rates and indicates local fire events. Moreover, this simple identification of charcoal layers in deposits can rapidly aid in site selection, without the immediate need for 14C dating and age–depth modeling.
CONCLUSIONS
The largest spatial gaps in fire records come from semiarid and arid regions, which lack the aquatic records favorable for preserving charcoal (Leys et al., Reference Leys, Marlon, Umbanhowar and Vannière2018; Harrison et al., Reference Harrison, Villegas-Diaz, Cruz-Silva, Gallagher, Kesner, Lincoln and Shen2022). However, dunes are abundant in these regions (Thomas and Wiggs, Reference Thomas and Wiggs2008) and may provide a useful target for paleofire reconstruction. In this study, we demonstrate the potential of dune footslope deposits as an archive of multimillennial fire records. We establish that the sclerophyll forest on the stabilized dunes in the CSM in Australia have burned repeatedly and produced abundant charcoal over a ca. 7 ka period.
The large charcoal size classes (180–250 μm, 250–355 μm, and 355 μm–2 mm) selected to represent the presence of local fires show consistent concentrations and accumulation rates (CHAR) with depth from all our sites. These findings support the hypothesis that footslope deposits have experienced limited postdepositional mixing and that sites contain intact and reliable stratigraphic records of fire activity. We find that the dune depositional stratigraphy reflects one of three distinct phases with respect to charcoal production and preservation:
1. Absent to sparse charcoal: As dunes are active or becoming stabilized, there is insufficient vegetation to allow fires to fully develop and penetrate.
2. Charcoal layers: Once the dunes are stabilized by the colonization of vegetation, charcoal production increases and episodic sediment transport dominates. This results in the creation of charcoal layers associated with individual major fire events.
3. Dispersed charcoal: After dune slopes drop below their angle of repose and transition to slow and continuous sediment transport (at ca. 1.5 ka), charcoal continues to be deposited but is dispersed throughout the profile. During these times, individual fires cannot be identified but relative biomass burning can be inferred.
We observe five CHAR peaks found within the three major periods that are traceable between dune footslope records. In general, fire becomes more abundant after ca. 3.4 cal ka BP, which is seen in other records from lakes and swamps in the SE Queensland dune fields (i.e., K'gari's Lake Allom, CSM's patterned fen complex, and Minjerribah's Swallow Lagoon). Our findings correlate with earlier inferences that the shift in fire activity is partially due to changes in the hydrological cycle through the ENSO intensification and its impact on fuel loads. This increase may also reflect intensification of fire usage by the Indigenous people. However, we also propose an alternative hypothesis: the mechanism causing fire variability is through vegetation changes in the dune field driven by dune activity itself.
The consistent trends of increasing age with depth and relatively minor uncertainty make these depositional footslope positions ideal targets for paleofire reconstruction. We propose that other dune deposits will yield comparable findings and that these records can expand fire histories from areas where fire is a rare event (wetlands/lakes) into the parts of the landscape where fire may be an important or the dominant ecological process. Furthermore, this method opens many new regions for paleofire studies and can give new insights on fire frequency and intensity in regions globally (Fig. 10).
Acknowledgments
The fieldwork and sample collection were undertaken using permit WITK15791415. Funding for this study was provided by the Australian Research Council (ARC) grant no. DP150101513, ANSTO Portal Grants (AP12211, AP12614, and AP12591), and the Mason Trust Fund. We thank the helpful comments from Nicholas Lancaster and Kevin Norton and the assistance by the National Parks and Wildlife Service. We would also like to thank Yuzhu Zhang, Dongliang Ning, and Patrick Adams for their assistance in the field. The authors acknowledge the traditional owners of the Cooloola Sand Mass, the Kabi’ Kabi’ people.
Data availability statement
All data necessary to generate results for this study are available in the article and Supplementary Information. The Black Summers fire extent (DAWE, 2020), world dryland distribution information (Sorensen, Reference Sorensen2007), and the global paleofire data (Harrison et al., Reference Harrison, Villegas-Diaz, Cruz-Silva, Gallagher, Kesner, Lincoln and Shen2022) used in this study were downloaded from www.environment.gov.au/fed/catalog/search/resource/details.page?uuid=%7B9ACDCB09-0364-4FE8-9459-2A56C792C743%7D%20, and http://datadownload.unep-wcmc.org/datasets, and www.paleofire.org/index.php, respectively.
Supplementary material
The supplementary material for this article can be found at https://doi.org/10.1017/qua.2023.14


 Open access