


Extensive research has examined the degree to which individuals in the USA have access to healthy food, which influences food purchasing and intake behaviour(Reference Harris, Piters and McMullin1–Reference Yang, Wang and Qiu3). Most research has focused on increasing access to healthy foods (e.g. fruits and vegetables), to improve the diets of the US population(Reference Harris, Piters and McMullin1,Reference Turner, Green and Alae-Carew2) . However, increasing access alone may be insufficient when certain foods can more strongly influence our food seeking and purchasing behaviour than others(Reference Handbury, Rahkovsky and Schnell4,Reference Price and Riis5) . Hyper-palatable foods (HPF) contain combinations of nutrients (fat, sugar, sodium (Na) and carbohydrates) at thresholds not found in nature and are defined with standardised quantitative criteria for nutrient pairs and thresholds (see methods for criteria)(Reference Fazzino, Rohde and Sullivan6). HPF are hypothesised to yield acute rewarding effects during intake and to slow engagement of or responsivity to physiological satiety signals, leading to excess intake within eating occasions(Reference Fazzino, Rohde and Sullivan6). When consumed repeatedly over time, HPF may elicit strong motivational drive (wanting) to seek out and consume HPF(Reference Fazzino, Rohde and Sullivan6,Reference Fazzino7) , consistent with the incentive sensitisation theory of motivation(Reference Berridge8,Reference Berridge9) . Importantly, the nutrient pairs in HPF are hypothesised to drive motivational salience (wanting), which is different from the subjective construct of palatability (liking) assessed in sensory science(Reference Bellisle10). Evidence supports the premise that due their strong reinforcing properties(Reference Small and DiFeliceantonio11,Reference Berridge and Robinson12) , individuals may become highly sensitive to HPF cues in the environment(Reference Temple and Epstein13,Reference Temple14) and may seek out and consume HPF at the expense of healthier foods(Reference Bellitti, Rohde and Fazzino15,Reference Vervoort, Clauwaert and Vandeweghe16) . In retail settings, HPF may be particularly difficult to resist, a problem that has been observed in interventions designed to expand healthy food access in retail settings(Reference Handbury, Rahkovsky and Schnell4,Reference Escaron17) .
Regular purchase and intake of HPF may present acute risks to energy balance and long-term risks for obesity and chronic diseases. Regarding risk to energy balance, research has found that HPF may yield greater within-meal energy intake relative to energy needs, as has been observed in laboratory(Reference Fazzino, Courville and Guo18,Reference Fazzino, Dorling and Apolzan19) and free-living conditions(Reference Jun, Girard and Martin20), even when accounting for known metabolic and food-level characteristics (e.g. energy density) implicated in energy intake. Furthermore, evidence in free-living conditions has suggested that within-meal HPF intake was associated with greater endorsement of eating despite feeling physically full, suggesting healthy adults continued eating despite conscious awareness of physiological satiety signals(Reference Jun, Girard and Martin20). Over time, energy surpluses incurred from HPF may increase weight gain and obesity risk, which has also been observed among healthy young adults(Reference Fazzino, Dorling and Apolzan19).
Hyper-palatability represents a unique risk to energy balance and is conceptually and definitionally distinct from other characteristics such as ultra-processed foods (UPF) and energy density. Regarding HPF conceptually, the nutrient pairs at key thresholds are the hypothesised mechanism in HPF that yields highly rewarding eating experiences and excess intake. Accordingly, this premise is operationalised in the quantitative HPF criteria(Reference Fazzino, Rohde and Sullivan6). The HPF definition is different from that of UPF, which are identified by the extent of their processing and presence of industrialised ingredients(Reference Monteiro, Levy and Claro21,Reference Monteiro, Cannon and Moubarac22) . UPF are defined using descriptive criteria that require review of food ingredient lists(Reference Monteiro, Levy and Claro21,Reference Monteiro, Cannon and Moubarac22) . While UPF have been discussed as containing sugar, fat and Na, the UPF definition does not require the presence of specific nutrients to characterise a food as UPF. Thus, UPF and HPF are conceptually and by definition distinct. However, it is the case that foods may meet criteria as both UPF and HPF, and the percentage of foods that are both UPF and HPF varies considerably by country(Reference Jun, Knowles and Fazzino23). In the US food system, there is substantial overlap between foods that are both UPF and HPF (78 %)(Reference Sutton, Stratton and L’Insalata24). However, hyper-palatability can occur in any foods/dishes, including those bought and prepared at home, which is important to consider(Reference Fazzino, Rohde and Sullivan6). Given that hyper-palatability often occurs within UPF, hyper-palatability has been identified as a key potential mechanism contributing to excess intake of UPF(Reference Juul, Martinez-Steele and Parekh25). Therefore, focusing on HPF, which have a key identified mechanism that may drive excess intake and negative health consequences, is particularly important when considering risks to public health.
HPF are also unique from foods with high energy density (> 2·0 kcal/g)(Reference Rolls26) and foods with high saturated fat, sugar, Na and/or energy (HFSS)(Reference Corvalán, Reyes and Garmendia27). Foods with high energy density and HFSS items may contribute to excess energy intake through elevated energy content or nutrient density(Reference Rolls26). Notably, this mechanism is different from the hypothesised mechanism through which HPF yield excess energy intake (nutrient pairs(Reference Fazzino, Rohde and Sullivan6)). In further support of their distinction, only ∼50 % of HPF have high energy density(Reference Fazzino, Rohde and Sullivan6), and foods with only one characteristic (high in one nutrient or energy) can be categorised as HFSS, whereas the HPF definition requires specified nutrient pairs. Thus, hyper-palatability is a unique attribute of foods that may risk energy balance and health and is important to characterise in the context of the food environment and public health.
Food environments may be particularly detrimental to public health when HPF are both widely available and easily accessible. The US population faces this environment daily; HPF comprise ∼69 % of foods in the US food supply(Reference Sutton, Stratton and L’Insalata24) and are typically cheaper than fruits and vegetables(Reference Gupta, Hawk and Aggarwal28). HPF are most commonly foods with elevated fat and Na (e.g. meat-based dishes), foods with high fat and sugar (e.g. cookies) and foods with carbohydrates and Na (e.g. crackers)(Reference Fazzino, Rohde and Sullivan6). HPF comprise meals and snacks consumed in the USA, indicating their ubiquity in the food system(Reference Fazzino, Rohde and Sullivan6).
Despite HPF saturation in the broader food supply, it is unknown whether US food retail stores primarily stock and sell HPF and whether HPF purchasing parallels their availability. The study aims were to (1) quantify the availability of HPF in US food stores; (2) quantify the percent of HPF purchased by US households per shopping occasion and (3) examine if household demographics (e.g. size, income, race and ethnicity) and health risk characteristics (e.g. fast-food intake and self-reported diagnosis of type 2 diabetes, obesity, high blood pressure or heart disease) may be associated with HPF purchasing, to understand whom may tend to purchase more HPF.
Methods
Data sources
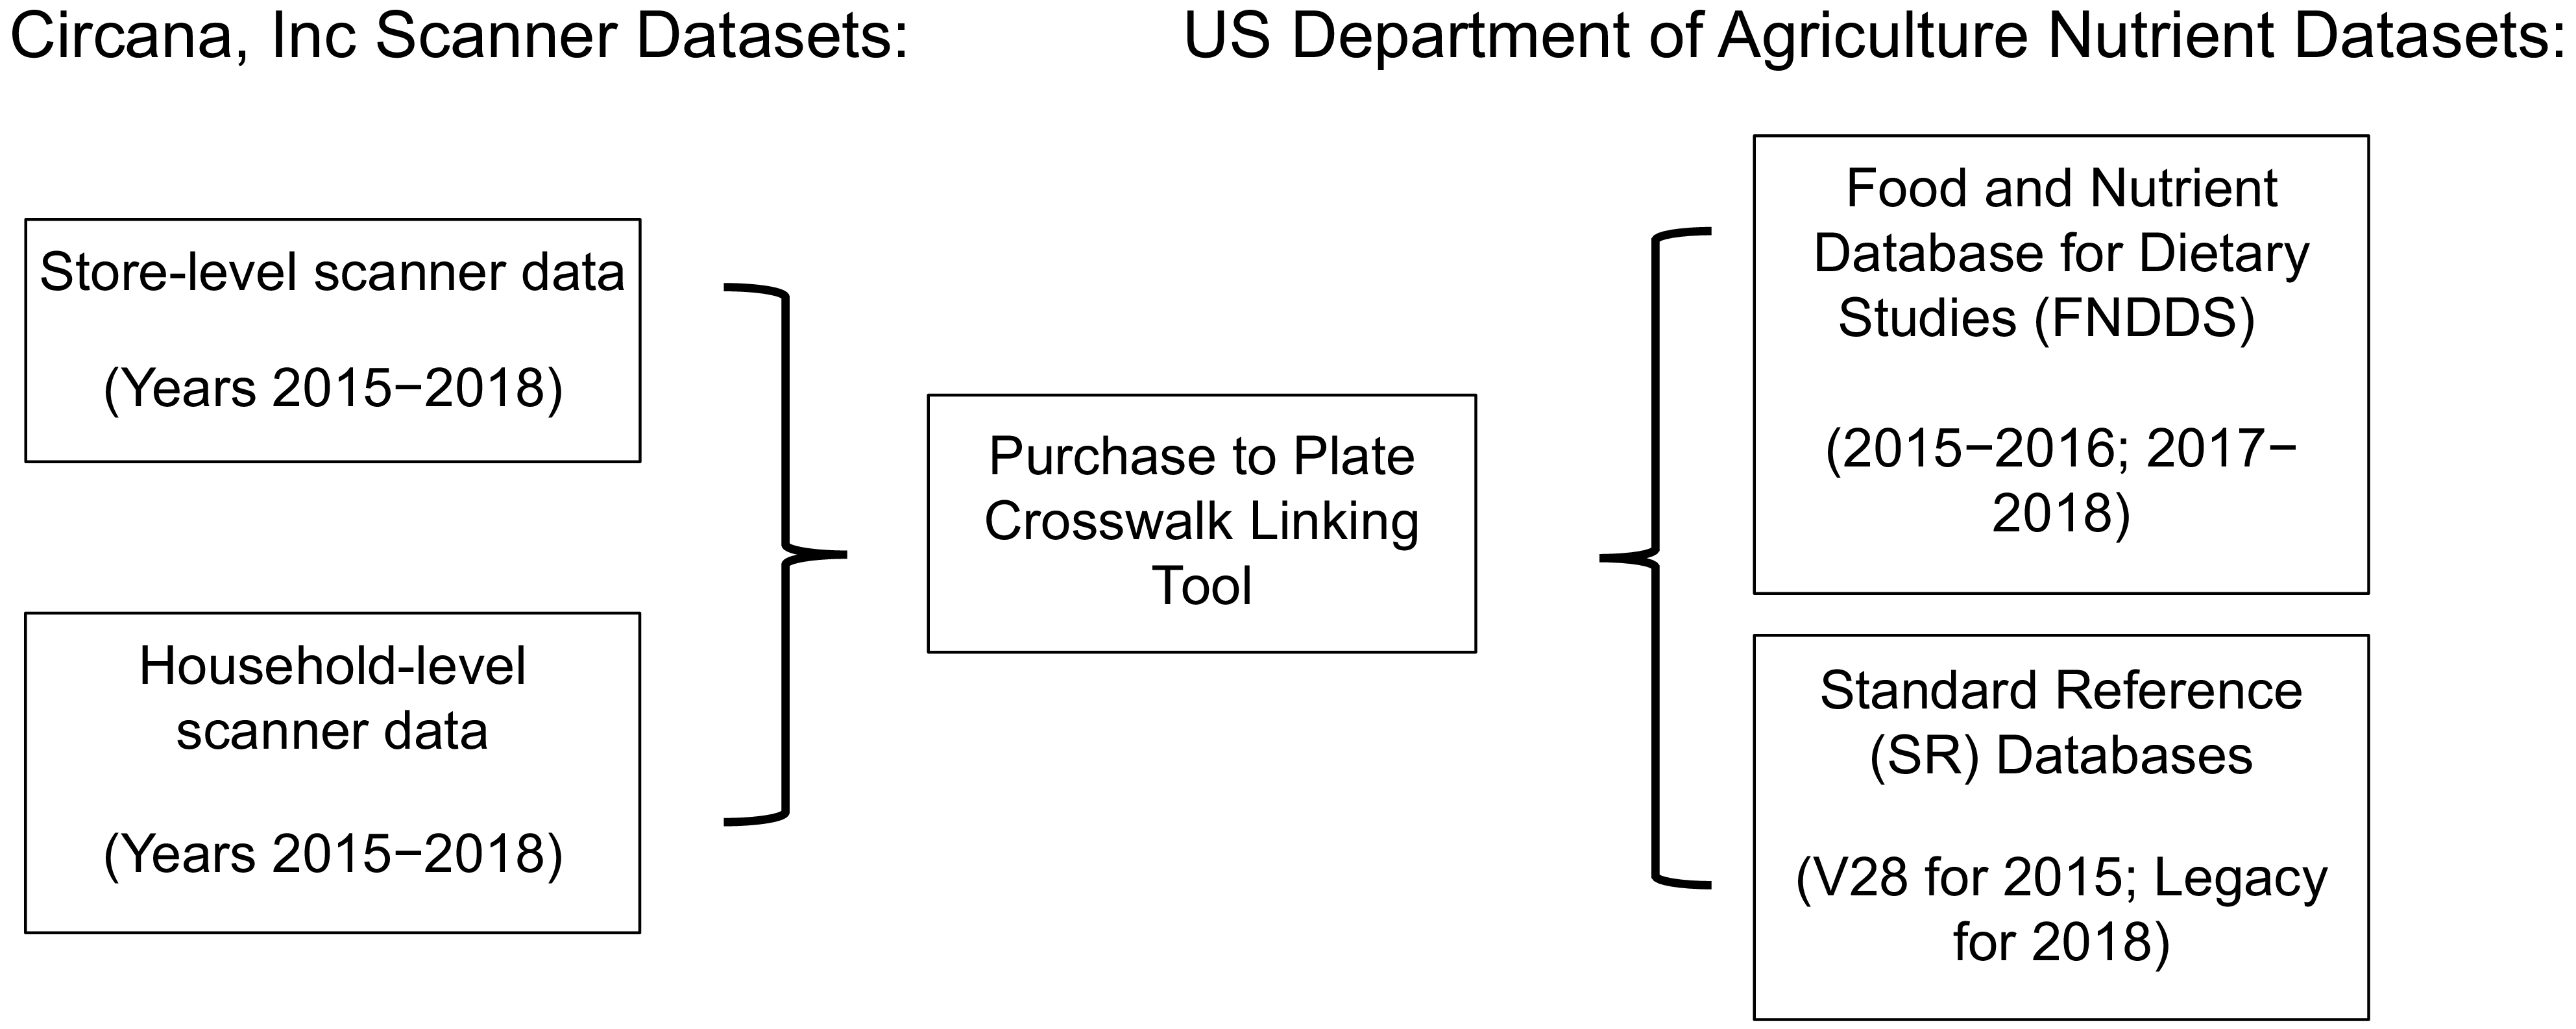
The study was an analysis of de-identified data and was approved by the University Institution Review Board (protocol #00149177). All data covered 4 years: 2015–2018. Figure 1 depicts the data sources and uses in the study, which are detailed below.
Study data sources.

Store-level data used in the study were from Circana, Inc (formerly Information Resources, Inc), a US-based market research company. Circana, Inc contracts with food retailers nationally to collect information about food/beverage products sold in various store outlets for a given period (e.g. week). Data Circana, Inc collects from retailors consist of food/beverage items scanned for sales, unit sales and sales dates(Reference Muth, Sweitzer and Brown29). Stores that share sales data with Circana, Inc are compensated. Circana, Inc sets requirements for grocery stores sampled to make > $2 million in annual sales(Reference Muth, Sweitzer and Brown29); thus grocery stores in the sample represent larger grocery stores and chains. Circana, Inc did not set requirements for the other store types to be included in their sample.
Regarding representativeness of the Circana, Inc store data, the USDA previously examined national food sales estimates relative to the Circana store and sales data and found that Circana sales data reflected approximately 50 % of retail food sales in the USA(Reference Carlson, Tornow and Page30). The stores represented in the data accounted for approximately 20 % of US food stores and were primarily chain retailers(Reference Levin, Noriega and Dicken31,Reference Carlson, Page and Zimmerman32) . For the current study, data from > 34900 stores were available per year for analysis (2015: n 45346 stores; 2016: n 44099 stores; 2017: n 37995 stores and 2018: n 34972 stores).
Store-level data were aggregated to reflect all branded, private label, perishable/fresh items (e.g. fresh vegetables and raw meats) and beverage items sold per week and the number of units sold per product per week(Reference Muth, Sweitzer and Brown29). For each given year (2015–2018), store-level data were used to derive a list of (1) all unique food items sold by store and (2) weekly sales of each food item in dollars. The aggregated list of all unique foods sold by store was considered to reflect available food items in a store for a given year. This approach was consistent with other studies in the literature that used unit sales data to characterise availability of food products in retail settings(Reference de Araújo, de Moraes and Magalhães33–Reference De Vogli, Kouvonen and Gimeno36). This premise was also directly supported by the store data; the frequencies of weekly food unit sales ranged from 0 to 1244196 units, suggesting the store data were representative of all items available in stores, including items with zero success in sales. In further support of this premise, sales of five or fewer food item units represented 8·3–9·2 % of the sales data per year, suggesting that items with minimal sales success were included in the data.
Data on food store outlets were available for the following types of outlets: grocery stores, mass merchandising stores, drug/pharmacy stores, convenience stores, club stores and dollar stores (see online supplementary material, Supplemental Information for store definitions). Per year, grocery, convenience and drug/pharmacy stores were the most well represented in the data (∼20–35 % per store type), followed by dollar stores, which had varied representation across years (∼20 % in 2015–2016; 1·5 % in 2017–2018), mass merchandising stores (∼7 % per year) and club stores, which were minimally represented (see online supplementary material, Supplemental Table S1). In considering US national food sales for the period of interest, most food sales were from grocery stores; however market shares from food sales have increased substantially in recent decades for mass merchandising, convenience and club stores, particularly in rural areas, necessitating their representation in the store-level data(Reference Stevens, Cho and Çakır37,Reference Zeballos38) .
Household-level data used in the study were also from Circana, Inc, which recruited a representative sample of US households each year to use handheld scanners to report all food and beverages purchased per shopping occasion during a measurement period(Reference Muth, Sweitzer and Brown29). Household recruitment procedures are summarised here and detailed in the online supplementary material, Supplemental Information. Households were recruited through the National Consumer Panel household pool(Reference Muth, Sweitzer and Brown29). Circana, Inc randomly selected households based on key demographic characteristics each year, to be reflective of US households nationally(Reference Muth, Sweitzer and Brown29). Following recruitment to the panel, the households were provided scanning equipment and/or access to the mobile app and trained on how to scan and report purchases during shopping occasions. Any member of the household could provide shopping data. Household demographic information is reported in online supplementary material, Supplemental Table S2. In a comparison with US census data for the period of interest(39), the 2015–2018 household panels were considered to overall be reasonably representative of US households regarding many characteristics, although the percent of married households were slightly higher in the panel sample, and representation of Black, Asian and Hispanic individuals was slightly lower than census data. Furthermore, other racial and ethnic groups such as Native Americans/Indigenous peoples were not characterised in the data. The participants were reasonably well distributed across regions of the US (Northwest, South, Central/Midwest and West) (see online supplementary material, Supplemental Table S2).
Per year, > 45000 households provided scanner data from shopping occasions (2015: n 46818; 2016: n 51257; 2017: n 55571; 2018: n 55868). For shopping occasions, households reported fresh/raw products (e.g. fresh fruits and vegetables; dairy and raw meats) in addition to packaged and prepared/pre-prepared items, and any other food items purchased. Shopping occasion data included all items purchased, unit cost, amount purchased and the trip number. Data from N 16785351 shopping occasions across years (approximately 4000000 per year) were available for analysis. The food items from shopping occasions were matched with nutrient data for analysis (detailed below). Per year, the vast majority of participants from the sample (95·6–99·9 %) had shopping occasion data that matched with nutrient data and were included in the analyses (2015: n 44780; 2016: n 49163; 2017: n 55561; 2018: n 55857).
Many in the main household panel sample also participated in the medical profiler sample, in which participants provided data on health behaviours and medical conditions (2015: n 25854 households; 2016: n 27695; 2017: n 30784; 2018: n 29035). Per year, most participants from the medical profiler sample (98·6–98·7 %) had shopping occasion data that matched with nutrient data and were included in the analyses (2015: n 25494; 2016: n 27328; 2017: n 30390; 2018: n 28643).
Data linkage
The Purchase to Plate Crosswalk(Reference Carlson, Tornow and Page30) tool provided by the USDA was used to link scanner food items with detailed nutrient data by year (see Figure 1). Two nutrient datasets, the Food and Nutrient Database for Dietary Studies(40) and the USDA’s Standard Reference data(41) reported nutrient data on unique food items, which were matched with food items for stores and household shopping occasions. The nutrient databases had complete data for the nutrients of interest in our study. However, some food items could not be matched to the nutrient data and were removed before analyses. Despite this, the majority of food items from stores (85 %) were matched with nutrient database items and included in analyses. Final datasets with food items, HPF sales and corresponding nutrient data were organised separately per year; thus each year of store-level data contained unique food items for that year (some that were likely the same as other years, and other items that were distinct). The store food files were not linked across years, as this was not required to address our study aims.
Measures
Hyper-palatable food definition
The study used the standardised definition of HPF(Reference Fazzino, Rohde and Sullivan6). The HPF definition was developed using a data-driven approach in which descriptive definitions of HPF in the literature were systematically collected and entered into nutrition software to quantify their nutrient contents(Reference Fazzino, Rohde and Sullivan6). Visual graphing procedures were used to identify foods with common nutrient combinations that were elevated (see Fazzino et al. (Reference Fazzino, Rohde and Sullivan6) for details). As a result of this process, HPF were defined as the following: fat and Na HPF (FSOD; > 25 % kcal fat and ≥ 0·30 % Na per gram), fat and sugar HPF (FS; > 20 % kcal fat and > 20 % kcal sugar) and carbohydrate and Na HPF (CSOD; > 40 % kcal carbohydrates and ≥ 0·20 % Na)(Reference Fazzino, Rohde and Sullivan6). The HPF group criteria are not mutually exclusive; however, a minority of foods typically meet criteria for more than one group(Reference Fazzino, Rohde and Sullivan6). Findings have indicated that the HPF definition has strong convergent validity in identifying items descriptively defined as hyper-palatable (e.g. fast-foods and sweets) and has excellent discriminant validity in discerning foods that are hypothesised to not be hyper-palatable (e.g. fresh/raw fruits)(Reference Fazzino, Rohde and Sullivan6).
Demographics
The household respondent completed a demographic information survey, which consisted of the following: household income, household size, race of the household survey respondent (options of White, Black/African American, Asian/Asian American and Other) and ethnicity of the household survey respondent (Hispanic/Latino culture or origin yes/no). There was no missing demographic data for the participants in the panel sample.
Health risk characteristics
Circana, Inc conducted a survey of medical conditions and health-related behaviours for the medical profile panel, which was comprised of a subset of the full sample (detailed above). The survey was completed by the household respondent. Survey items asked if the responding household member had been diagnosed by a medical professional with the following health conditions: type 2 diabetes, high blood pressure, heart disease and obesity. Thus, health survey items addressed the health risk characteristics of the participating household member (and not the whole household). There was no missing health risk data for the participants in the medical profile sample.
Evidence supports the premise that individuals can reliably report whether or not they have been diagnosed with various medical conditions, including type 2 diabetes(Reference Schneider, Pankow and Heiss42,Reference Jackson, DeFor and Crain43) , high blood pressure(Reference Bonnesen and Schmidt44,Reference Oksanen, Kivimäki and Pentti45) and heart disease(Reference Bonnesen and Schmidt44,Reference Oksanen, Kivimäki and Pentti45) , although some underestimation of incident cases is likely. Furthermore, while underreporting of obesity is common(Reference Hattori and Sturm46), we reasoned that individuals who endorsed being diagnosed with obesity by a medical provider were likely to have accurately reported their weight classification. Therefore, we used self-reported diagnosis of obesity as a variable in analyses. In addition to the medical items, a self-report item regarding the frequency of weekly fast-food consumption was included as a behavioural variable that may be associated with HPF purchasing.
Data preparation and analysis
Following data linkage, the hyper-palatability of each food item was determined by applying the HPF definition (specified in the measures section above) to all food items using the following nutrient variables: total kcal, serving size (grams), fat, sugars, carbohydrates, Na, and fibre. Percent kcal from fat, sugar and carbohydrates was calculated per procedures in Fazzino et al. (Reference Fazzino, Rohde and Sullivan6) Sugar and fibre were removed before calculating % kcal from carbohydrates(Reference Fazzino, Rohde and Sullivan6). Percent Na was calculated as Na in grams/food weight in grams per serving(Reference Fazzino, Rohde and Sullivan6). In addition, item descriptions and beverage codes were used to identify and remove beverages, as the HPF definition does not apply to liquids(Reference Fazzino, Rohde and Sullivan6). Foods that met criteria for at least one of the HPF groups were categorised as HPF.
Data analysis was conducted with SAS Version 9.4(47). To address Aim 1, HPF in stores was characterised as (1) a proportion of unique HPF items available per store (HPF items available/total food items available) per year and (2) as a proportion of total weekly sales (sales in $ from HPF/total food sales in $) per year. In addition to yearly availability, the overall HPF prevalence in stores was averaged across the 4 years to obtain a total mean prevalence across years. The same was conducted for HPF sales across the 4 years. The prevalence of by HPF group (fat and Na HPF, fat and sugar HPF and carbohydrate and Na HPF) was also characterised to identify the most common HPF groups available and sold in stores. We also examined which types of foods contributed the most to HPF availability in stores, using standardised food categories from the USDA(Reference Bowman, Clemens and Friday48).
To address Aim 2, HPF purchased by households during shopping occasions were characterised as (1) a proportion of total food items purchased (n HPF units/total N food units purchased) per shopping occasion and (2) as a percentage of total dollars spent on food ($ spent on HPF/total $ spent on food) per shopping occasion. Food items were considered in units as they were purchased (e.g. box of crackers). Although counting food items as units purchased may be less sensitive to item size, quantifying purchasing in this manner facilitated a direct comparison between the household items purchased and store-level food item availability (which was also characterised in units). Additionally, for household HPF expenditures, proportionate HPF expenditures per shopping occasion were calculated to contextualise HPF expenditures within the overall shopping budget per trip. Shopping occasions were organised within households and by year. Purchasing of HPF was examined overall and by HPF groups.
To examine household-level characteristics associated with HPF purchasing (Aim 3), we used a linear multilevel modelling approach to account for repeated measures (shopping occasions) within households. An autoregressive 1 (AR1) correlation structure was determined to be the best fit to the data based on review of Akaike’s information criterion (AIC), corrected Akaike’s information criterion (AICC), and Bayesian information criterion (BIC) fit indices and was used in the models.
In the first model, household demographic characteristics (household size, household income, race, and ethnicity) were included as independent variables and specified as fixed effects. Proportionate expenditures on HPF during shopping occasions was the outcome. A random intercept was specified for household. A second model was constructed with the same demographic characteristics as independent variables, and with proportion of HPF items purchased per shopping occasion as the dependent variable. We considered ordered beta regression for the percentage outcome variables; however, we were limited in computing power from the combination of the large volume of data and the requirement to analyse these data in a secure USDA data enclave, which had pre-specified user resources. The HPF purchase model had some heteroskedasticity in the residuals, and therefore, robust standard errors were specified.
For Aim 3, we also examined the associations between health risk characteristics (frequency of weekly fast-food consumption, self-reported type 2 diabetes diagnosis, obesity diagnosis, high blood pressure diagnosis and heart disease diagnosis) and proportionate HPF expenditures during shopping occasions. However, because obesity diagnosis and frequency of fast-food consumption were highly correlated, we conducted separate regression models to avoid potential issues related to multicollinearity. Therefore, we ran two models, all of which contained the aforementioned health risk variables, plus either frequency of fast-food consumption or obesity diagnosis as the independent variables, and proportionate HPF expenditures as the dependent variable. We also used the same set of models with proportion of HPF items purchased as the outcome.
Following an examination of model assumptions, it was determined that the proportionate HPF models met all assumptions (detailed in the online supplementary material, Supplemental Information section). There was some heteroskedasticity in the residuals of the HPF expenditure models, and therefore, robust standard errors were specified.
Results
Hyper-palatable foods availability and sales in food stores
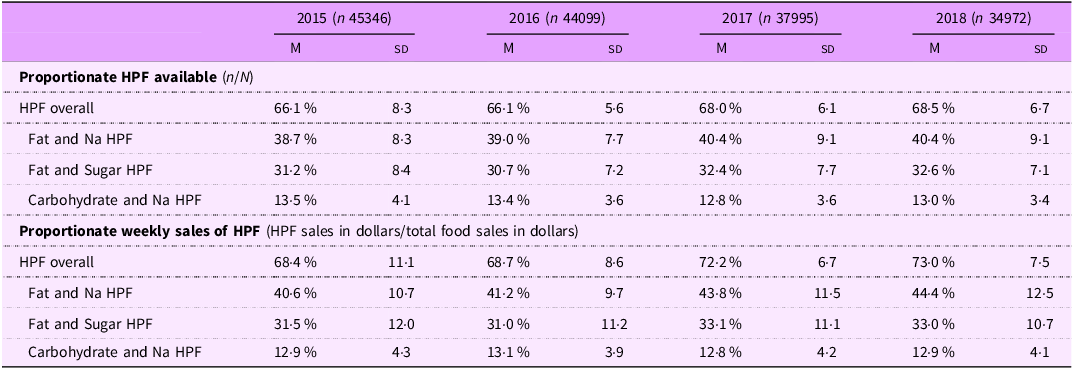
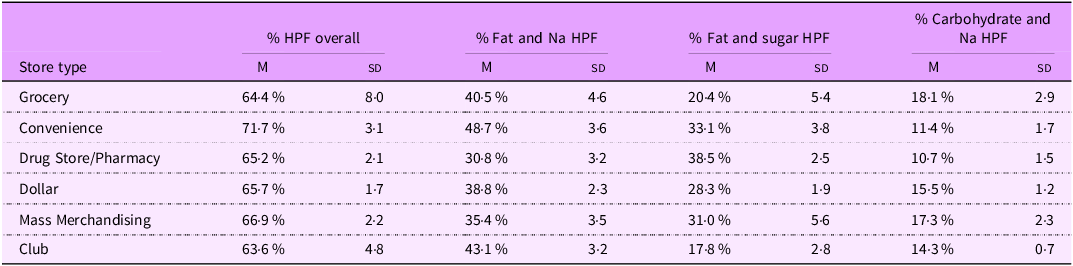
Table 1 presents HPF availability and sales in stores per year and for HPF groups. The mean HPF availability across stores and years was 67·1 % (sd = 6·9). Across years, fat and Na HPF comprised the highest percentage of available HPF (M = 39·6 %; sd = 8·6) per store, followed by fat and sugar HPF (M = 31·7 %; sd = 7·7) and carbohydrate and Na HPF (M = 13·2 %; sd = 3·7). The average proportionate HPF sales per week per store was 70·4 % (sd = 9·0) across years (see Table 1 for estimates per year). HPF availability across store outlets was nominally highest among convenience stores and lowest among grocery and club stores (Table 2). Regarding the types of foods that contributed to HPF availability in stores, dairy, grain products, mixed dishes (typically containing fat/protein and carbohydrates) and sweets were identified as high contributors to HPF availability (11·7–32·5 % per category) in stores, whereas fruits and vegetables were low contributors to HPF availability in stores (0·002 % to 1·9 %) (see online supplementary material, Supplemental Table S3).
Store-level availability and weekly sales of hyper-palatable food per year

HPF, hyper-palatable food; M, mean.
Proportionate hyper-palatable food products available by store type across years (N 54 083 stores)

HPF, hyper-palatable food; mean, mean across stores and years.
Hyper-palatable foods purchases during household shopping occasions
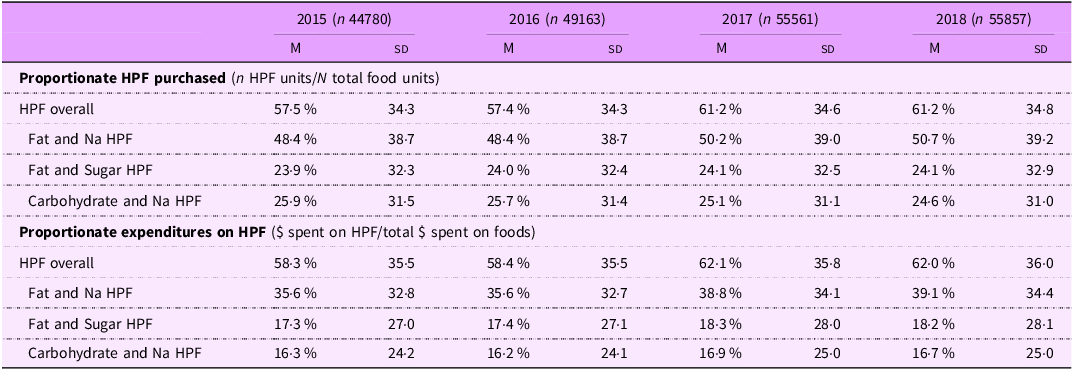
Table 3 presents HPF purchased during shopping occasions per year and for HPF groups. The mean proportion of HPF purchased per shopping occasion was 59·4 % (sd = 34·6) across years, with the largest percentage of HPF purchased being fat and Na HPF (M = 49·5 %; sd = 38·9). The mean proportionate expenditures on HPF per shopping occasion was 60·3 % (sd = 35·7) across years.
Household purchases of hyper-palatable foods per shopping occasion by year

HPF, hyper-palatable food; M, mean. Variation represents between-subjects differences in HPF purchasing between households in the sample.
At most types of food stores, households purchased ∼55–60 % proportionate HPF items per shopping occasion (see online supplementary material, Supplemental Table S4). Nominally the highest proportion of HPF was purchased at supercenters (comparable to mass merchandisers in the store-level analyses) and dollar stores (> 61·0 % HPF) and the lowest at convenience stores (M = 45·6; sd = 47·3). However, for convenience stores, the mean proportion HPF purchased was exceeded by the sd, suggesting high variability in purchasing of HPF at convenience stores between households.
Household demographics and health risk characteristics associated with hyper-palatable foods purchasing
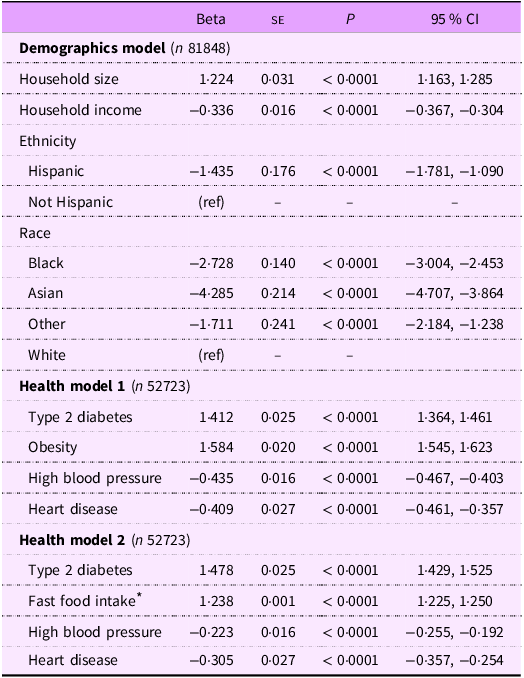
Results indicated that household size was positively associated with proportionate expenditures on HPF during shopping occasions, with households spending 1·22 % more on HPF with each additional household member (P < 0·0001; Table 4). Household income was negatively associated with proportionate expenditures on HPF (Table 4). Individuals who identified as Black, Asian and Hispanic had significantly lower proportionate expenditures on HPF per shopping occasion relative to White, non-Hispanic individuals (Table 4), with beta estimates ranging from –1·71 % to –4·28 %. Findings and effect size estimates were similar when proportionate HPF items purchased was the outcome (see online supplementary material, Supplemental Table S5).
Demographic and health characteristics associated with proportionate hyper-palatable food expenditures years 2015–2018

* Frequency of fast-food intake was included in a separate model (Health model 2) from obesity (Health Model 1) to avoid potential issues with multicollinearity, as the variables were highly correlated.
Results from the first health risk characteristics model indicated that individuals who reported being diagnosed with type 2 diabetes or obesity had significantly higher proportionate expenditures on HPF per shopping occasion (b values = 1·412–1·584; P values < 0·0001; Table 4), whereas individuals who reported being diagnosed with high blood pressure and heart disease had significantly lower proportionate expenditures on HPF (b = −0·409 to −0·435; P values < 0·0001; Table 4). A similar pattern was observed when frequency of fast-food consumption was included in the model instead of self-reported obesity diagnosis (Table 4, Health Model 2). Findings and effect size estimates were similar when proportionate HPF items purchased was the outcome (see online supplementary material, Supplemental Table S5).
Discussion
The study examined the availability of HPF in US food stores and corresponding household HPF purchasing behaviour using national data from a market research company. Findings revealed that across years, HPF comprised over two-thirds of foods available and sold in food stores and comprised ∼60 % of household food expenditures per shopping occasion. Fewer household financial resources and larger household size were associated with greater HPF expenditures per shopping occasion. Endorsement of some health risk factors (frequent fast-food consumption, self-reported diagnoses of type 2 diabetes and self-reported diagnosis of obesity) was associated with greater HPF expenditures per shopping occasion. Overall, the findings indicate that Americans navigate food stores saturated by HPF, which is reflected in household purchasing of HPF.
Our robust analysis of US food stores revealed the extensive degree to which HPF are available (≥ 66 %) and sold (≥ 68 %) in US food outlets and the striking consistency of HPF availability across most types of food outlets. Even among grocery stores, which have been considered in the literature to offer healthier food options(Reference Ver Ploeg, Dutko and Breneman49), our findings indicated that grocery stores had primarily HPF available for purchase. Also of note, dollar stores, which have received interest and scrutiny in their entrance to the US food market(Reference Feng, Page and Cash50), had a similar prevalence of HPF relative to grocery stores, suggesting individuals may encounter similar proportions of HPF when shopping in grocery and dollar stores. Finally, convenience stores sold ∼5 % more HPF relative to the other types of stores, which may support the premise in the literature that convenience stores may not facilitate healthy food purchasing(Reference Caspi, Lenk and Pelletier51). However, given that the prevalence was only modestly higher than grocery stores (71·7 % v. 66·4 %), the picture overall indicates that HPF saturate US food stores, and the differences across food store types are relatively small. Relatedly, the variation in HPF availability in stores was relatively consistent across years and varied only by ∼2 % between 2015 and 2018, suggesting the prevalence estimates were high and reasonably stable across the years. HPF availability may have further increased since 2018 (although a US national estimate of HPF availability beyond 2018 is not available); however, our overall pattern of findings provides strong evidence that US food stores may be saturated with HPF.
Household purchasing of HPF was largely in line with HPF availability in stores; approximately 60 % of foods and expenditures per shopping occasion were on HPF. These findings are overall consistent with results from a recent analysis of yearly UPF purchases among US households, which reported that almost half (48 %) of packaged foods purchased in US grocery stores in 2020 were UPF(Reference Dunford, Miles and Popkin52) and that 65 % of purchases by annual sales volume were HFSS(Reference Popkin, Miles and Taillie53). Taken together, it appears US households regularly purchase foods that are HPF, UPF and/or HFSS. However, a strength of our study was that we examined all food purchases, which included fresh/raw produce items, which were important to consider when examining food purchasing at the shopping occasion level. Regarding types of HPF purchased, households on average purchased the highest percentage of HPF with elevated fat and Na (39·6 %) per shopping occasion, followed by similar percentages of fat and sugar HPF and carbohydrate and Na HPF. This pattern parallels the study findings from the store-level analyses, in which fat and Na HPF were proportionally the most common HPF available and sold. Prior studies of HPF among countries in North America and Europe have also reported findings that are consistent with the current study; fat and Na HPF represented the most prevalent type of HPF across countries, including the US(Reference Fazzino, Rohde and Sullivan6,Reference Jun, Knowles and Fazzino23,Reference Fazzino, Summo and Pasqualone54) . Overall in the USA, fat and Na HPF are typically meal-based items (e.g. pizza and meat-based dishes) and likely reflect the availability and purchases of main entrée and related items consumed during meals, including meals at home(Reference Fazzino, Rohde and Sullivan6). Carbohydrate and Na HPF are typically snack items (e.g. crackers), and fat and sugar items are desserts or breakfast items (e.g. cake and cookies)(Reference Fazzino, Rohde and Sullivan6) and therefore may be bought and consumed in lower quantities. Overall, the findings indicate that on average, HPF comprised the majority of household food expenditures per shopping occasion, particularly purchases of fat and Na HPF.
The study also examined demographic and health risk characteristics that may be associated with HPF purchasing behaviour, to understand who may purchase more HPF for their households. Findings overall suggested that greater household size and lower household income were associated with greater HPF purchasing behaviour. Given that HPF are often calorically dense and less expensive than non-HPF such as fruits and vegetables(Reference Gupta, Hawk and Aggarwal28), it may be that households may purchase HPF as a way to stretch dollars and calories to the whole household. This premise is consistent with the literature on UPF, which has also reported that more UPF products are typically purchased among households with lower socioeconomic resources, including those experiencing food insecurity, likely due to their low cost(Reference Leung, Fulay and Parnarouskis55). Although we did not examine household composition in the current study, future work should seek to examine whether households that are larger in size due to the presence of children, combined with lower income, may purchase more HPF as a way to stretch dollars and calories.
Regarding health risk characteristics, more frequent fast-food consumption, self-reported type 2 diabetes diagnosis and self-reported obesity diagnosis were positively associated with proportionate expenditures on HPF. Thus, individuals who self-reported a diagnosis of type 2 diabetes or obesity purchased significantly more HPF per shopping occasion. Similar associations have been observed between UPF availability and purchasing with population obesity rates(Reference de Araújo, de Moraes and Magalhães33). In contrast, individuals who self-reported a diagnosis of high blood pressure or heart disease had significantly lower proportionate expenditures on HPF relative to individuals without these diagnoses. Patients with high blood pressure and heart disease are often advised to modify their dietary intake and to avoid consumption of excess fat and sugar and to consume foods rich in fibre(Reference Diab, Dastmalchi and Gulati56), which may be reflected in the observed lower HPF expenditures. However, the same is typically true for individuals diagnosed with obesity and type 2 diabetes, although the direction of effects was the opposite of the effect for those diagnosed with heart disease and high blood pressure.
The study had several limitations. First, the Circana, Inc store data represented a small proportion of total food stores in the USA; thus, while our analyses had high resolution to detect outcomes of interest, the percentage of total US food stores analysed was relatively smaller. Also, most stores in the sample were chain stores, which have sales formats that standardise food item offerings across locations, with limited variability(Reference Fox, Sethuraman, Krafft and Mantrala57,Reference Guptill and Wilkins58) . While the data are likely generalisable to other chain stores in the USA, which comprise the majority of US food outlets(Reference Stevens, Cho and Çakır37), the findings may not generalise to smaller, independent grocery stores. Also, while most store types were reasonably well represented in the data, club stores had minimal representation in the data. As such, findings regarding club stores should be interpreted with caution. Additionally, the data analysed in the study were from 2015 to 2018 and may not fully reflect the current US food environment. The current prevalence of HPF in US food stores may be higher; however, the picture overall indicates the extensive degree to which the US food environment is saturated with HPF. Regarding households, the household panel data lacked resolution to characterise HPF purchasing among some key racial minoritised groups, such as Native American/Indigenous peoples. Furthermore, representation across Black, Asian and Hispanic individuals was lower than US census, and estimates in the models may be less robust. However, our findings overall align with those from other studies that used different market scanner data sources that also found lower proportionate UPF expenditures among these groups relative to White households, lending some further confidence to the findings(Reference Dunford, Miles and Popkin52). Also, the household shopping data represented food purchasing for an entire household and should not be considered to reflect food consumption behaviour. We interpreted our findings accordingly. Additionally, our analyses examined associations between household characteristics (demographic and health risk characteristics) and HPF purchasing behaviour; however, we could not establish temporal order from the data. Finally, the health risk characteristics were self-reported and may be prone to biases in recall and reporting. To address this limitation, we used survey items that had a higher likelihood of being accurately reported and that had evidence from the literature supporting their reliability and validity.
Conclusions and policy implications
Findings revealed that the US population faces HPF-saturated food stores, and that household HPF purchasing is closely aligned with HPF availability in food outlets nationally. Policy regulation of HPF products may be needed to address HPF in the US food supply, which has been prominent and growing since the 1980s(Reference Sutton, Stratton and L’Insalata24). A pattern across our results and those in the literature is that HPF with high Na (combined with either fat or starchy carbohydrates) comprise the majority of HPF available and purchased in the USA(Reference Sutton, Stratton and L’Insalata24,Reference Demeke, Rohde and Chollet-Hinton59) . Thus addressing HPF with high Na through policy or regulatory action may be a useful way to decrease harms associated with HPF. Policy approaches may seek to target Na directly in HPF and/or by implementing other existing approaches such as HFSS and general Na reduction policies, which may also have utility in reducing HPF availability. For example, regulatory or policy action could directly require that food companies selling HPF to reduce Na levels below HPF threshold criteria (e.g. requiring that Na for carbohydrate and Na HPF products, such as crackers, be reduced below the ≥ 0·20 % Na threshold), thereby shifting Na-heavy HPF products to be non-HPF. Another approach to target HPF could be through HFSS policy. For example, the HFSS policy in Chile identifies HFSS foods as having Na > 400 mg (or 0·40 % Na in g)(Reference Corvalán, Reyes and Garmendia27), which is slightly higher than the HPF criteria threshold for Na(Reference Fazzino, Rohde and Sullivan6). However, on average, HPF in the US greatly exceed HPF criteria thresholds(Reference Jun, Knowles and Fazzino23), and therefore, HFSS criteria could address an important proportion of HPF with high Na in the US food supply. Finally, some countries have focused specifically on regulating the Na contents of packaged products, requiring Na reductions by ∼25 %(Reference Santos, Tekle and Rosewarne60). Such an approach could potentially serve to reduce the prevalence of HPF. Future research is needed to fully examine the degree to which various policy approaches would be most efficient in identifying and addressing HPF in the US food supply.
Supplementary material
For supplementary material accompanying this paper visit https://doi.org/10.1017/S1368980026102614
Authorship
CRediT statement: T.L.F. conceptualisation, data curation, formal analysis, funding acquisition, methodology, supervision, writing – original draft. P.D.B. visualisation, investigation, formal analysis, writing – review & editing. L.C-H. conceptualisation, methodology, supervision, writing – review & editing. C.S. investigation, validation, visualisation, formal analysis, writing – review & editing.
Financial support
Funding from the US Department of Agriculture Economic Research Service through the Purchase to Plate Crosswalk Pilot Award program supported the study (PI: Fazzino). The funder had no role in the study purpose, conduct, design and interpretation of the findings.
Competing interests
There are no conflicts of interest.
Ethics of human subject participation
The study was a secondary analysis of de-identified data and was approved by the University Institution Review Board.


 Open access