

Recently, the WHO( 1 , 2 ) published new guidelines for recommended intake levels of Na and K in adults and children. However, most people consume more Na and less K than these recommended values worldwide( 3 – Reference Zhou, Stamler and Dennis 5 ). Excess Na intake leads to hypertension that is associated with severe adverse health outcomes such as CHD and stroke, and the beneficial effect of salt reduction on these diseases has been confirmed( Reference Aburto, Ziolkovska and Hooper 6 , Reference He, Li and Macgregor 7 ). Salt reduction is also a cost-effective means of reducing the risk of CVD( Reference Murray, Lauer and Hutubessy 8 , Reference Barton, Andronis and Briggs 9 ). Excess Na intake and insufficient K intake independently lead to hypertension and other CVD( Reference Aburto, Hanson and Gutierrez 10 , Reference Whelton, He and Cutler 11 ), and higher K intake reduces blood pressure in individuals with hypertension( Reference Aburto, Hanson and Gutierrez 10 , Reference Whelton, He and Cutler 11 ).
The INTERSALT( 3 ) and INTERMAP studies( Reference Zhou, Stamler and Dennis 5 ) have reported that Na intake is higher in the East Asian countries of China, the Republic of Korea, and Japan than in other countries. Substantial differences in intake have also been reported between northern and southern China and within Japan( 3 , Reference Zhou, Stamler and Dennis 5 ). Moreover, K intake has been reported to be lower in these East Asian countries than elsewhere( 3 , Reference Zhou, Stamler and Dennis 5 ). Nevertheless, the National Health and Nutrition Survey in Japan reported that Na intake is being continuously decreasing( 12 ). The reason for this trend is attributed to the Westernisation of the Japanese diet and change in food preservation method, i.e. the change from preservation with salt to the use of home refrigerators. Average Na and K intakes in the 2011 survey were 4287 mg/d (186·4 mmol/d) and 2269 mg/d (58·0 mmol/d) in men, and 3698 mg/d (160·8 mmol/d) and 2120 mg/d (54·2 mmol/d) in women, respectively( 12 ). However, these nutrient intake data were based on household-based diet records, and the estimated intake for individual family members was obtained as a certain (unvalidated) proportion of the total family intake, e.g. 35 % intake for father, 25 % intake for mother and 40 % intake for two children. These proportions were estimated by the participant member of the family for each individual dish consumed. In addition to this methodological issue, under-reporting of intake in diet records cannot be ignored( Reference Livingstone, Prentice and Strain 13 – Reference Khaw, Bingham and Welch 15 ). These issues hinder the comparison between the values of the National Health and Nutrition Survey and those of other international studies. Conversely, precise intakes of Na and K were better assessed by 24 h urine collection, which is considered the ‘gold standard’ for estimating the intake of these nutrients( Reference Willett 16 ). The values of Na and K excretion assessed by the 24 h urine collection method in the INTERMAP study, conducted from 1996 to 1999 in four selected areas, were found to be 211 and 49·2 mmol/d in Japanese men, and 186 and 48·5 mmol/d in Japanese women( Reference Zhou, Stamler and Dennis 5 ). Despite the continuing high prevalence of hypertension and mortality due to CVD in Japan( 12 , 17 ), no further population-based evaluation of Na and K intakes using the 24 h urine collection method has been made. In addition, at least two urine collections are required to take within-individual variation in dietary intakes into account and estimate the usual (habitual) Na and K intake. Because the recommendations are established for usual (habitual) intake, a single urine collection is not enough to estimate the proportion of individuals whose Na and K intakes met the recommended values.
In the present study, we conducted a precise evaluation of Na and K intakes in Japanese adults using two 24 h urine collections in twenty-three out of forty-seven prefectures in Japan. The goal of the present study was to clarify the weak point of the so-called healthy Japanese diet( Reference Ikeda, Saito and Kondo 18 ), and provide essential information to public health professionals, policy makers and clinicians in Japan and other countries.
Methods
Study participants
The study targeted apparently healthy men and women aged 20 to 69 years living throughout Japan. Initially, twenty study areas were selected based on geographical location in the Japanese Archipelago and on the feasibility of the survey, particularly the possibility of collaborator (research dietitian) recruitment in that area; of these study areas, seventeen were individual prefectures, while three consisted of two adjacent prefectures (Aomori and Iwate, Niigata and Toyama, and Fukuoka and Saga). In each study area, ten dietitians who worked in ten different welfare facilities were recruited and agreed to participate in the study as research dietitians. In addition, one lead dietitian was selected in each study area. Of the 200 dietitians recruited initially, one subsequently declined participation following an accident, leaving a total of 199 dietitians in 199 different welfare facilities to support the study. These dietitians then invited their co-workers to participate in the study as subjects. The target number of study subjects required to allow statistical assessment of the effect of sex, age, BMI and physical activity on Na and K intakes was determined to be 800. Accordingly, we attempted to include forty subjects from each of the twenty study areas, and each dietitian was asked to recruit four participants on average for the study. Recruitment was managed in such a way that each study area included eight subjects (four men and four women) from each of five 10-year age groups (20–29, 30–39, 40–49, 50–59 and 60–69 years), with adjustment of age and sex being made by the lead dietitian in each study area to ensure the uniformity of sex and age distribution of participants between the study areas. Inclusion criteria were as follows: (1) aged 20 to 69 years; and (2) working in the same welfare facility as the research dietitian, except for those aged over 60 years, who could be chosen from neighbours or acquaintances of the research dietitians due to the small number of workers aged over 60 years in the welfare facilities. Exclusion criteria were as follows: (1) licensed dietary or medical provider (e.g. dietitian, nurse or medical doctor); (2) residence in the prefecture or adjacent prefecture in which the facility was located (work place at the time of the study, i.e. commencing after 1 August 2012); (3) under diet therapy prescribed by a doctor or dietitian at the time of the study or within 1 year before the study; (4) pregnant or lactating women; (5) history of educational admission for diabetes mellitus. Where possible, the research dietitians were also requested to restrict recruitment to those clerical staff who did not participate in night-shift work.
In total, 791 subjects (395 men and 396 women) participated in the study. The research dietitians explained the aims and procedure of the study to all participants individually. The present study was conducted according to the guidelines laid down in the Declaration of Helsinki, and all procedures involving human subjects were approved by the Ethics Committee of the University of Tokyo, Faculty of Medicine (approval no. 10 005, 7 January 2013). Written informed consent was obtained from all subjects.
Measurement schedule
All measurements were made in February or March 2013. To standardise the measurement procedures, each research dietitian was provided with a detailed manual before the commencement of the study that described how each measurement procedure should be conducted. A central office was established to direct the study, and to answer the questions raised by the dietitians. The measurement methods used were 24 h urine collection (two non-consecutive days), semi-weighed diet records (four non-consecutive days; obtained from about half of the subjects), three questionnaires (two types of questionnaires about diet history and one questionnaire about lifestyle), anthropometric measurements (body height and weight), blood pressure measurement, and examination of threshold salt level at which the participant described foods as having a salty taste. The measurement schedule aimed to complete all measurements within 10 to 14 d and was arranged by the research dietitians and participants themselves in accordance with the participants' work and private schedules.
24 h urine collection
24 h urine collection was performed on two non-consecutive days during the study period to ensure the acquisition of appropriate data from more subjects. It was also expected that two urine collections would increase the reliability of information about the distribution of habitual Na/K intake. This estimated distribution of habitual intake allowed us to calculate the proportion of individuals whose Na/K intake met the recommendation values with greater accuracy.
The starting time of collection was set to suit each participant's schedule. Participants were asked to discard the first urine after the starting time and then to collect all specimens thereafter. The last specimen was collected the next day at the same time that the first specimen had been discarded the previous day. The participants recorded the start and finish times, as well as the estimated volume of any urine they forgot or failed to collect. This estimated volume was added to the actual volume of urine collected. Total volume of urine collection was then calculated after adjusting for collection time based on the collection record. This adjustment method was validated using the para-aminobenzoic acid check method( Reference Murakami, Sasaki and Takahashi 19 ). Samples of collected urine were transferred to LSI Medience Corporation and analysed for urinary Na and K concentrations using the electrode method. Creatinine concentration was analysed by the enzyme test. A JCA-BM6050 clinical chemistry analyser (JEOL Limited) was used to determine the concentrations of Na, K and creatinine. An IatroQ CRE(A) II chemical reagent kit (LSI Medience Corporation) was also used to determine the concentration of creatinine. Excretion of Na and K was calculated as:
 $$\begin{eqnarray} Total\,24\hairsp h\,excretion\,(mmol/d) = \,adjusted\,volume\,of\,24\hairsp h\,urine\,(ml/d)\times concentration\,(mmol/ml), \end{eqnarray}$$
where 1 mmol of Na is equal to approximately 58·5 mg of salt (NaCl), and 1 mmol of K is equal to approximately 39·1 mg of K.
Other measurements
Body height and weight were measured to the nearest 0·1 cm and 0·1 kg, respectively, by the research dietitians or medical staff (mainly nurses) in the welfare facilities, with subjects wearing light clothing and no shoes. BMI was calculated as body weight (kg) divided by the square of body height (m2). Blood pressure was measured by the research dietitians, nurses or participants themselves using sphygmomanometers in the welfare facilities. The participants were asked to rest for 3 min while seated in a room set at a comfortable temperature. Blood pressure was then measured twice at an interval of 1 min, and the average of the two measurements was used as the participant's representative blood pressure value( Reference McAlister and Straus 20 ). Information on the background and lifestyle of the participant was collected by a questionnaire, which included twenty-one questions about the participant's occupation, family structure, education, smoking habit, medical history, current medication use, physical activity level (estimated by summing the product of the time spent on each of a range of activities with various exercise intensities and the metabolic equivalent value for each activity( Reference Ainsworth, Haskell and Herrmann 21 )), behaviour and knowledge relating to salt intake.
Data analysis
In the present study, two types of analysis were performed. First, Na and K excretion was described by sex, study area (approximately equivalent to the prefecture) and age category using the data from as many participants as possible. Second, distribution of habitual Na and K excretion was simulated using the data from participants with two successful 24 h urine collections, and the proportion of participants whose Na and K intakes met the recommended values was then calculated.
The simple description of Na and K excretion was implemented as follows. To confirm the completeness of 24 h urine collection, we calculated the ratio of observed to expected creatinine excretion according to the equations of Joossens et al. ( Reference Murakami, Sasaki and Takahashi 19 , Reference Knuiman, Hautvast and van der Heyden 22 ). If the ratio calculated for a collection was < 60 or >140 % of that expected, the collection was excluded from analysis. According to these criteria, the number of subjects excluded was thirty-one (both collections < 60 %, twenty-five subjects; both collections >140 %, three subjects; one collection < 60 % and one collection >140 %, three subjects), leaving a population of 760 subjects (384 men and 376 women). When both collections were considered successful, the average of the two excretion values was used as the representative value. When only one collection was considered successful, its values were used as the representative ones. Excretion of Na and K was first described by sex and study area. In addition, the ratio of excreted Na (mg/d) to K (mg/d) was calculated. The effects of age, BMI and physical activity level were then analysed using a multivariable linear regression model. We used raw excretion data as a dependent variable in the model because the model already included BMI as a covariate, and adjustment by creatinine excretion to take body size into account was redundant. Standardised partial regression coefficients were used to compare the relative impact of each of the covariates quantitatively.
The distribution of Na and K excretion was analysed after excluding the subjects with only one successful urine collection (n 97) and those having urine collections with an insufficient measurement interval ( < 3 d)( Reference Narins 23 ) (n 6), leading to a total of 657 subjects with two successful urine collections. First, histograms were produced to show the distribution of raw data from each measurement for Na and K excretion and the average values of each of the two measurements. Then, the distribution of usual (habitual) excretion of Na and K in the analysed population was simulated using PC Software for Intake Distribution Estimation (PC-SIDE, version 1.0, 2003, available from the Department of Statistics, Iowa State University, Ames, IA, USA, http://www.side.stat.iastate.edu/)( Reference Dodd 24 , Reference Dodd 25 ). The method for estimating the usual nutrient intake is known as the Iowa State University (ISU) method, which has been described elsewhere( Reference Nusser, Carriquiry and Dodd 26 – Reference Carriquiry 28 ). PC-SIDE estimates the usual intake percentiles for the analysed population to take within-individual variation of dietary intake into account, and then simulates the representative distribution of usual (habitual) intake for a population of an arbitrary number of individuals. Using this function, we prepared a histogram to show the simulated distribution of usual Na and K excretion in the population of 657 individuals, and calculated the proportion of subjects with adequate Na and K intakes (below the recommendation for Na intake and above the recommendation for K intake). Since Na and K excretion is less than the actual intake, we adjusted the intake recommendations to fit the excretion data by multiplying by 0·86 for Na and 0·77 for K( Reference Willett 16 , Reference Holbrook, Patterson and Bodner 29 ).
All analyses, except for the simulation of usual intake, were performed with Statistical Analysis System software (version 9.3; SAS Institute). Statistical tests were two-sided, and P< 0·05 was considered statistically significant.
Results
The characteristics of the study participants are summarised in Table 1. Each study area included about forty participants, with a similar number of individuals of each sex and in each age category due to adjustment for age and sex at recruitment.
Characteristics of the study subjects (Number of subjects and percentages; mean values and standard deviations, n 760)

SBP, systolic blood pressure; DBP, diastolic blood pressure; PAL, physical activity level; MET, metabolic equivalents.
* Average of two measurements.
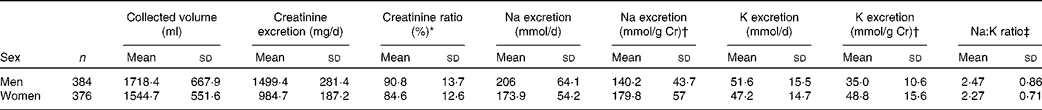
Na and K excretion by sex is summarised in Table 2 . The mean Na and K excretion values over 24 h were 206·0 and 51·6 mmol in men, and 173·9 and 47·2 mmol in women, respectively. The mean Na and K excretion by study area is summarised in the online supplementary table. Their values were in the range of 174·0–249·6 and 45·7–58·4 mmol/d in men and 141·5–201·0 and 41·5–53·9 mmol/d in women, respectively.
Results of 24 h urine collection by sex (Mean values and standard deviations, n 760)
* The ratio of observed to expected creatinine excretion calculated using the equations of Joossens et al. ( Reference Willett 16 , Reference Knuiman, Hautvast and van der Heyden 22 ). If the ratio was ≥ 60 and ≤ 140 %, the collection was considered successful. When both collections were considered successful, the average of the two excretion values was used as the representative value. When only one collection was considered successful, its values were used as the representative ones.
† The unit ‘mmol/g Cr’ indicates the excretion of the electrolyte (mmol) per 1 g excretion of creatinine.
‡ Ratio of Na (mg/d):K (mg/d).
Na and K excretion by age, BMI and physical activity level is summarised in Table 3. The mean Na and K excretion was higher in older subjects, in those with a higher BMI, and in female subjects with a higher physical activity level. The Na:K ratio was higher in younger subjects and in those with a higher BMI. Assessment of the associations between the excretion of Na and K and age, BMI and physical activity level using a multivariate linear regression model that included these three factors as simultaneous covariates showed that only a higher BMI was significantly associated with higher Na excretion in both men and women (Table 4). For both sexes, BMI and age were significantly associated with K excretion. Only younger age was significantly associated with a higher Na:K ratio.
Results of 24 h urine collection by sex and other factors (age, BMI and physical activity level (PAL)) (Mean values and standard deviations, n 760)

MET, metabolic equivalents; Q, quartiles.
* The ratio of observed to expected creatinine excretion calculated using the equations of Joossens et al. ( Reference Willett 16 , Reference Knuiman, Hautvast and van der Heyden 22 ).
† Ratio of Na (mg/d):K (mg/d).
‡ PAL data were not available for two female subjects. The other subjects were categorised into quartiles, and mean PAL for each category is shown in parentheses.
Associations between age, BMI, physical activity level (PAL) and excretion of sodium and potassium by sex

MET, metabolic equivalents.
* Ratio of Na (mg/d):K (mg/d).
† The effect of age, BMI and PAL on Na and K excretion was analysed by a multivariable linear regression model. The dependent variable was Na or K excretion, and independent variables were age, BMI and PAL, which were continuous variables and were included in the model simultaneously. Standardised partial regression coefficients were also shown to compare the relative impact of each of the covariates quantitatively. These coefficients show how much the dependent variable would typically change given a one standard deviation change in each independent variable.
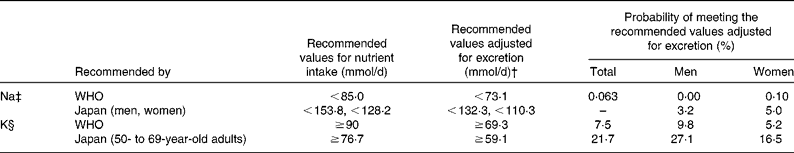
The distribution of Na and K excretion in subjects with two successful urine collections (n 657) is shown in Fig. 1. Fig. 1(a), (b), (e) and (f) shows a broad distribution for the raw data of excretion. Fig. 1(c) and (g) shows the distribution of average excretion using two measurements, while Fig. 1(d) and (h) shows the distribution of ‘usual (habitual) Na and K excretion’ simulated by PC-SIDE. In addition, we used these simulated distributions to estimate the proportion of subjects whose Na and K intakes met the recommendation values (Table 5). For Na intake, none of the male subjects met the recommendation of the WHO, and only 3·2 % met the higher recommendation of the Japanese government. Similarly, only 0·1 % of the female subjects met the recommended Na intake values of the WHO, and 5·0 % met those of the Japanese government. With regard to K intake, 7·5 % of the subjects met the recommended values of the WHO and 21·7 % met those of the Japanese government.
Distribution of sodium and potassium excretion in Japanese adults. Sodium excretion: (a) first examination, (b) second examination, (c) average of two examinations and (d) estimated habitual excretion (simulated using PC Software for Intake Distribution Estimation (PC-SIDE)). Potassium excretion: (e) first examination, (f) second examination, (g) average of two examinations and (h) estimated habitual excretion (simulated using PC-SIDE).

Estimated proportion of subjects whose sodium and potassium intakes met the recommended values of the WHO and the Japanese government in the population analysed* (n 657)
* Only subjects with two successful urine collections were included in the analyses.
† These values were divided by 0·86 for Na and 0·77 for K( Reference Nusser, Carriquiry and Dodd 26 ) to apply the recommendations for dietary intake to the excretion data.
‡ 1 mmol Na = 23·0 mg Na = 58·5 mg NaCl.
§ 1 mmol K = 39·1 mg K.
Discussion
The present study was the first to comprehensively evaluate Na and K excretion in Japanese adults living throughout Japan using 24 h urine collection, which is considered the ‘gold standard’( Reference Willett 16 ). Holbrook et al. ( Reference Holbrook, Patterson and Bodner 29 ) reported that 86 % of Na taken orally was excreted into the urine, indicating that average Na intake in the present study population was 239·5 mmol/d (14·0 g NaCl) in men and 202·2 mmol/d (11·8 g NaCl) in women. In the questionnaire used for the present study, 97·1 % of the subjects (738 of 760 subjects) answered that they knew that excess Na intake causes hypertension (data not shown). However, our findings show that Na intake in Japanese adults is still substantially higher than the levels recommended by the WHO and Japanese government. Also, as was observed in the National Health and Nutrition Survey in Japan( 12 ), Na excretion appeared to be higher in the northeast area of Japan, whereas K excretion appeared to be higher in the middle area in the present study. Although the study areas were not compared statistically due to the small number of subjects in each area, the regional difference in Na/K intake was rather large. Thus, not only nationwide but also regional strategies should be considered in Japan. The areas where Na intake is high and/or K intake is low might require a detailed assessment of dietary intake to determine what kind of foods or dietary habits is related to an unfavourable intake.
After adjustment for within-individual variation in Na excretion, the estimated proportion of the Japanese population whose Na intake met the recommended values of the WHO was 6·3 in 10 000 individuals (0·063 %). In contrast, with regard to K, excretion was lower than the recommendations. According to the report of Holbrook et al. ( Reference Holbrook, Patterson and Bodner 29 ) that 77 % of K taken orally was excreted into the urine, the mean estimated K intake in the present study population was 67·0 mmol/d (2619·7 mg) in men and 61·3 mmol/d (2396·8 mg) in women. The proportion of individuals who consumed more K than the minimum recommended value of the WHO was 7·5 %. The recommended values of the Japanese government for both Na intake ( < 9·0 g/d ( < 3543 mg/d) for men and < 7·5 g/d (2953 mg/d) for women) and K intake (e.g. >3000 mg/d for 50–69-year-old individuals, different by age) are not strict compared with those of the WHO. Since Na intake in the Japanese population is much higher than the WHO recommendation and K intake is much lower, the recommended values of the Japanese government had to be determined taking feasibility into account to prevent any deterioration in the quality of life or the intake of other nutrients. However, the proportion of subjects who consumed an acceptable amount of Na and K estimated using the Japanese recommendation was still considerably low.
Allowing for the descriptive nature of the present results the value of this study is emphasised by the rarity of nationwide studies using 24 h urine collection to measure Na and K excretion. Na and K intakes were considerably different among the prefectures. The analysis of the diet survey data that were based on dietary records collected from almost half of the subjects would clarify the source of these nutrient intakes by prefecture, providing valuable information for both policy makers and clinicians.
The present analysis of Na and K intakes in both men and women aged 20 to 69 years allowed us to identify the differences in Na and K excretion by age and sex. Furthermore, we also analysed the effect of BMI and physical activity level on Na and K excretion. As summarised in Table 3, both older age and higher BMI were probably related to higher Na and K excretion, although a multivariate linear regression model that included age, BMI and physical activity level as simultaneous covariates showed that only BMI was significantly associated with Na excretion. Most Japanese public health professionals and clinicians believe that intake of Na in the Japanese population is decreasing, as revealed by the results of the National Health and Nutrition Survey( 12 ). This indicates that Na intake is decreasing with time (from 14·0 g/d in 1975 to 10·2 g/d in 2010) due to the Westernisation of the Japanese diet, and younger individuals consume less salt (i.e. more Westernised diet) than older people( 12 ). For example, in men, the mean salt intake in 2010 was 10·7 g/d in 20- to 29-year-olds, 11·2 g/d in 30- to 39-year-olds, 11·1 g/d in 40- to 49-year-olds, 11·9 g/d in 50- to 59-year-olds and 12·0 g/d in 60- to 69-year-olds. The mean intake of Na in women was 8·9 g/d in 20- to 29-year-olds, 9·3 g/d in 30- to 39-year-olds, 9·0 g/d in 40- to 49-year-olds, 10·3 g/d in 50- to 59-year-olds and 10·6 g/d in 60- to 69-year-olds( 12 ). However, we interpret the present results to mean that this tendency is not likely to continue, given that younger individuals appeared to consume almost the same amount of Na as older people, and cannot be expected to voluntarily reduce Na intake without encouragement. Rather, since the Na:K ratio was significantly higher in younger subjects, they could be relatively susceptible to the adverse effects of high Na intake( Reference Dyer, Elliott and Shipley 30 ). The present study was conducted using a cross-sectional design, avoiding any direct mention of secular trends in Na and K intakes within individuals. Nevertheless, our speculation for the steady state of Na intake in the Japanese population is supported by comparison of our results with those for the same population in the INTERSALT( 3 ) (Na, 187 mmol/d and K, 46 mmol/d) and INTERMAP( Reference Zhou, Stamler and Dennis 5 ) studies (Na, 211 mmol/d and K, 49·2 mmol/d in men; Na, 186 mmol/d and K, 48·5 mmol/d in women). From these results, we presume that Na and K excretion have hardly changed over the last 30 years, although Na excretion might have decreased slightly in women. In contrast, the National Health and Nutrition Survey in Japan indicated that the mean total energy intake in Japanese adults had decreased during the same period (from 8736·2 kJ/d (2088 kcal/d) in 1985 to 7698·6 kJ/d (1840 kcal/d) in 2011)( 12 ), suggesting that the salt concentration in daily foods and the preference of Japanese individuals for a salty taste have not changed at all. In Western countries, increasing intake of processed foods is considered a major cause of high salt intake, and efforts to reduce their Na content are being made( Reference Webster, Dunford and Neal 31 ). In Japan, it is speculated that Westernisation of the Japanese diet, namely the decreasing trend( 32 ) of traditional salt-preserved foods and/or seasonings such as miso consumption and increasing trend of other modern processed food consumption, is balanced in these decades, which might have caused the stable status of salt intake.
Regarding K, intake was higher in older participants and those with a higher BMI. This result implies that no future apparent increase in K intake can be expected without effort. The broad dietary availability of K from a range of foods such as vegetables, potatoes, pulses, fruits and seaweeds complicates efforts to increase its intake. A higher intake of K has been associated with a higher intake of nuts, potatoes, soyabeans, fruits, vegetables, seaweeds, milk and dairy foods, eggs, and fish and shellfish in the Japanese population( Reference Turin, Okuda and Miura 33 , Reference Ozawa, Ninomiya and Ohara 34 ). The contribution of each food to K intake can be precisely clarified by analysing the diet survey data that were based on dietary records collected from the present study population, which would allow the planning of effective intervention measures to increase the intake of K.
A significant association between BMI and Na and K excretion has been reported previously( Reference Ortega, Lopez-Sobaler and Ballesteros 35 , Reference Donfrancesco, Ippolito and Lo Noce 36 ). Although a higher BMI suggests a higher energy intake and, accordingly, a higher Na and K intake, the possibility that individuals with a higher BMI tend to have an unhealthy lifestyle compared with those with a lower BMI, such as a preference for salty foods and aversion to foods with high K content, should be examined. Indeed, in the present study, the relative increment of mean K intake in individuals with a higher BMI was smaller than that of mean Na intake.
Compared with the population of other countries, Na intake in the Japanese population continues to be high and K intake to be low as reported previously. Indeed, neither intake in this population has yet met the recommended values. Several recent studies have described Na and K excretion using 24 h urine collection( Reference Ortega, Lopez-Sobaler and Ballesteros 35 – Reference Polonia, Maldonado and Ramos 43 ), of which four (from Spain, Italy, Turkey and Slovenia) were nationwide studies( Reference Ortega, Lopez-Sobaler and Ballesteros 35 , Reference Donfrancesco, Ippolito and Lo Noce 36 , Reference Erdem, Arici and Altun 41 , Reference Ribic, Zakotnik and Vertnik 42 ). All studies except those from Turkey( Reference Erdem, Arici and Altun 41 ) and Slovenia( Reference Ribic, Zakotnik and Vertnik 42 ) (for men) reported lower mean Na excretion than that reported in the present study, but all reported higher mean K excretion. A study from Finland showed that Na excretion has apparently decreased over the last 20 years, and the authors have assumed that the key to this reduction was a comprehensive CVD prevention programme established in the early 1970s( Reference Laatikainen, Pietinen and Valsta 39 ). This programme included community-based collaboration with the food industry, aimed at developing reduced-salt food products and raising general awareness of the association of salt and health. The success of this programme might provide hints to Japanese efforts to establish a public health programme to reduce Na intake.
There are several limitations in the present study that should be noted. First, the participants were not randomly sampled from the general Japanese population, but were volunteers and possibly health-conscious. The response rate for the invitation to participate was considerably high (86·7 %: 791 participated/912 invited). However, this rate should be interpreted with caution, because the research dietitians recruited co-workers who were considered to be co-operative with them, and thus selection was not random. In addition, as all participants, except those aged 60 years and above, were recruited from welfare facilities, or, in other words, worked at a single type of workplace, the generalisability of our findings cannot be assured. Considering the burden of multiple 24 h urine collection, random sampling of subjects was not feasible. Nevertheless, participants varied by occupation (e.g. clerical worker, careworker or medical assistant), suggesting that the population had various workloads and physical activities. Furthermore, the mean height and weight of the participants were compatible with those of the general Japanese population (170·3 cm, 67·3 kg in men and 157·2 cm, 52·2 kg in women aged between 20 and 69 years)( 44 ), and the proportion of smokers was the same as reported in the National Health and Nutrition Survey in Japan (32·4 % in men and 9·7 % in women in 2011)( 12 ), suggesting that the study participants had similar characteristics to those of the general Japanese population. Second, standardisation of 24 h urine collection was difficult, because the study areas were located all over Japan. To minimise the error, a detailed manual was distributed to all research dietitians, and the participants used a recording sheet that included a step-by-step instruction on how to collect the urine and entry columns that could be filled in while reading the instructions. Furthermore, the collected urine was analysed at a single laboratory of the same clinical testing company. As a result, 96·1 % of the participants collected their urine successfully at least once, and 83·1 % succeed twice. In spite of this good success rate, we found that the collected urine volume was much lower in younger subjects than in older subjects. This difference might be explained by two reasons: (1) younger subjects tended to fail to collect the urine and (2) urine volume of younger subjects tended to be lower for physiological reasons. The missed urine volume estimated by the subjects was actually higher in younger subjects (e.g. 58·7 ml/subject in men aged 20–29 years and 19·4 ml/subject in those aged 60–69 years), and the proportion of subjects who reported missing the urine collection was higher in younger subjects (e.g. 17·3 % in men aged 20–29 years and 9·2 % in those aged 60–69 years). Also, it is well known that glomerular filtration rate, urine-concentrating ability, and the diluting ability of kidneys decline with ageing( Reference Bolignano, Mattace-Raso and Sijbrands 45 ). The higher urine-concentrating ability in young subjects might have caused a lower intake of beverages and lower collected urine volume. Nocturia could have been another reason. Its prevalence (two or more voids per night) is 5 to 15 % in individuals aged between 20 and 39 years, but 20 to 60 % in those aged between 60 and 79 years( Reference Bosch and Weiss 46 ). It has also been reported that individuals with nocturnal polyuria tended to produce slightly higher volumes of urine during the day( Reference Robertson and Norgaard 47 ). Even if the missed urine volume was substantially higher in younger subjects, their true Na excretion should be larger than the estimated excretion, as reported in Table 3, and the argument that younger Japanese individuals consume almost the same amount of Na as older people should be strengthened. Regarding K, the difference in excretion between the younger and older subjects might decrease, which may suggest that the consumption of K-rich foods such as fruits or vegetables by younger subjects was not particularly low compared with that in older subjects. However, we should consider the fact that K intake estimated in the present study was much lower than the recommended values.
Third, some participants took medications that could have affected the excretion of Na and K. We did not collect information about the dose and type of drugs; however, given that almost all participants were workers, we assume that they were sufficiently healthy to work. This also implied that their medication might not have been intensive. To verify these assumptions, Na and K excretion was recalculated after excluding the subjects with hypertension, renal dysfunction, and prescription of diuretics and/or antihypertensive drugs (n 652; 315 men and 337 women, data not shown). The mean Na and K excretion values over 24 h were 206·9 and 51·7 mmol in men, and 172·7 and 47·2 mmol in women. As these values were almost the same as those in the present population analysed, we can assure that the generalisability of the results was not compromised by the inclusion of these subjects in the analysis.
In conclusion, we estimated Na and K intakes in Japanese adults, and found that Na intake was still much higher than the recommended values of the WHO and the Japanese government, and higher than that reported in most other developed countries. Furthermore, K intake was lower than the recommended values. Therefore, there is an urgent need for the development of an efficient intervention programme to reduce Na intake and promote K intake in the Japanese population. To do so, further study is required to clarify the source of Na and K intakes.
Supplementary material
To view supplementary material for this article, please visit http://dx.doi.org/10.1017/S0007114514001779
Acknowledgements
The authors and their colleagues thank the dietitians in each welfare facility for their valuable contribution to the survey.
The present study was financially supported by Health and Labour Sciences Research Grant (no. H23-Jyunkankitou(seishuu)-ippan-001) from the Ministry of Health, Labour and Welfare, Japan. The Ministry of Health, Labour and Welfare had no role in the design and analysis of the study or in the writing of this article.
The authors' contributions are as follows: S. S. designed and conducted the present study; S. M. was involved in the establishment of the study area and the recruitment of the subjects; K. A., K. U. and Y. S. collected and arranged the data; K. A. performed the statistical analyses and drafted the paper. All authors contributed to the development of the manuscript.
The authors declare that there is no conflict of interest.


