

The metabolic syndrome (MetSyn) is a clustering of metabolic traits including abdominal obesity, glucose intolerance, hypertension and dyslipidaemia( Reference Reisin and Alpert 1 ). MetSyn is associated with an increased risk for several diseases including CVD, certain cancers and type 2 diabetes mellitus( Reference Ford 2 ). The overall prevalence of the MetSyn, as measured using data from the National Health and Nutrition Examination Study (NHANES), has increased from 23·7 % in 1988–1994 to 34·2 % in 1999–2006 for adults aged 20 years and above( Reference Ford, Giles and Dietz 3 , Reference Mozumdar and Liguori 4 ). In men, MetSyn increased from 24·8 to 34·9 %, and in women MetSyn increased from 23·4 to 33·3 %( Reference Ford, Giles and Dietz 3 , Reference Mozumdar and Liguori 4 ).
Epidemiological studies have shown that higher dietary intakes of Mg may be potentially protective against MetSyn( Reference Ford, Li and McGuire 5 – Reference McKeown, Jacques and Zhang 7 ). Results from the NHANES (1988–1994) found a significant inverse association between the highest quintile of dietary Mg intake and MetSyn( Reference Ford, Li and McGuire 5 ). In another study, which used NHANES (1999–2004), a 100 mg/d increase in Mg was associated with a reduced risk of MetSyn( Reference Beydoun, Gary and Caballero 8 ). Randomised controlled trials (RCT) have shown that oral Mg supplementation of 250 and 365 mg/d for 3 and 6 months, respectively, reduced insulin resistance( Reference Guerrero-Romero, Tamez-Perez and Gonzalez-Gonzalez 9 , Reference Mooren, Kruger and Volker 10 ), and Mg supplementation of 382 mg/d for 4 months improved blood pressure (BP), fasting plasma glucose and TAG( Reference Rodriguez-Moran and Guerrero-Romero 11 ).
Although the underlying mechanisms are not fully understood, experimental studies have shown that Mg can directly and indirectly affect individual components of MetSyn, including hypertension, insulin resistance and dyslipidaemia( Reference Resnick 12 – Reference Resnick, Gupta and Bhargava 14 ). Mg is known to directly regulate cellular glucose metabolism by affecting the rate-limiting enzymes of glycolysis( Reference Musso 15 ) and phosphate transfer-associated enzymes, which are typically decreased in individuals with hypertension( Reference Barbagallo, Dominguez and Galioto 16 , Reference Laughlin and Thompson 17 ). In skeletal muscle and fat tissue, low Mg levels have been observed to decrease glucose utilisation, resulting in insulin resistance( Reference Barbagallo, Dominguez and Galioto 16 ). Mg is also involved in enzymatic reactions that remove TAG from the blood and increase the production of HDL( Reference Laughlin and Thompson 17 , Reference Rosanoff and Seelig 18 ).
Few epidemiological studies have reported an association between Ca and MetSyn. In a study using NHANES data from 1999 to 2004, a 100 mg/d increase in Ca was not statistically significantly associated with MetSyn( Reference Beydoun, Gary and Caballero 8 ). However, a large cross-sectional study involving 10 066 adult women found an inverse association between the highest quintile (>1004 mg/d) and the lowest quintile (<562 mg/d) of dietary intake of Ca and MetSyn( Reference Liu, Song and Ford 19 ). In the Epidemiological Study on the Insulin Resistance Syndrome (DESIR), they reported an inverse association between the highest quintile and the lowest quintile of Ca intake and systolic and diastolic BP (SBP and DBP) as well as a positive association with HDL in women( Reference Drouillet, Balkau and Charles 20 ). They also found that, in men, the highest quintile compared with the lowest quintile of Ca intake was inversely associated with DBP( Reference Drouillet, Balkau and Charles 20 ). Several meta-analyses of RCT have shown that Ca supplementation, in doses ranging from 500 to 2000 mg/d, decreases SBP and DBP( Reference Allender, Cutler and Follmann 21 – Reference van Mierlo, Arends and Streppel 24 ).
In vitro studies have shown that elevated cytosolic free Ca in skeletal muscles and fat tissue can induce cellular insulin resistance( Reference Resnick, Gupta and Bhargava 14 ). A randomised case cross-over trial showed that diets high in Ca (2200 mg/d) decreased the TAG:HDL ratio and increased the HDL-cholesterol:LDL-cholesterol ratio compared with low-Ca diets (700 mg/d)( Reference Lorenzen and Astrup 25 ).
The potential relationship between the dietary intake of Mg and Ca, in combination, and the risk of MetSyn has not been well studied, although these micronutrients are intimately related to each other and collectively influence several metabolic functions – for example, low levels of Mg can increase intra-cellular Ca through the N-methyl-d-aspartate receptor( Reference Rayssiguier, Libako and Nowacki 26 , Reference Nielsen 27 ) by lowering the threshold levels of excitatory amino acids (e.g. glutamate) needed to activate this receptor. Activation of this receptor allows the influx of Ca into the cell, thus increasing the intra-cellular Ca:Mg ratio, which may lead to hypertension and insulin resistance( Reference Resnick 12 – Reference Resnick, Gupta and Bhargava 14 ). Rosanoff et al.( Reference Rosanoff, Weaver and Rude 28 ) hypothesised that cellular Ca activation from low Mg levels may be exacerbated by a diet high in Ca and low in Mg, and that future studies should examine the potential effects of Ca:Mg ratio( Reference Nielsen 27 , Reference Rosanoff, Weaver and Rude 28 ). Beydoun et al. ( Reference Beydoun, Gary and Caballero 8 ) used structural equation modelling to examine the co-presence of a one (standardised) unit change in Mg and Ca intake on individual metabolic variables; however, the combined effects of these nutrients using clinically interpretable cut-off points and definitions of MetSyn have yet to be evaluated.
To our knowledge, no other previous epidemiological studies have directly examined the effect of the Ca:Mg ratio on the risk for MetSyn. Therefore, the purpose of this study was to examine the potential association between the dietary intake of Mg and Ca – individually and in combination using their ratio (Ca:Mg) as well as relevant cut-off points (RDA levels, quartiles) – and MetSyn using 10 years of NHANES data (2001–2010). We hypothesised that higher intakes of Mg and Ca – individually and in combination – would decrease the risk of MetSyn.
Methods
Study subjects
We merged together the NHANES 2001–2002 (n 11 094), 2003–2004 (n 10 224), 2005–2006 (n 10 351), 2007–2008 (n 10 151) and 2009–2010 (n 10 540) cross-sectional study data sets. A total of 26 680 adults (men and non-pregnant and non-lactating women) ≥20 years of age participated in the mobile examination centre (MEC) exam for NHANES from 2001 to 2010. Individuals who did not fast for ≥8 h or were missing more than one MetSyn component were excluded (n 15 360). As poor kidney function and dialysis can affect Mg concentrations after absorption( Reference Mahan 29 ), individuals with kidney disease or who were on dialysis were excluded (n 755). Furthermore, individuals who did not have a valid 24-h recall (n 1082), had daily energy intakes <2092 J (<500 kcal) (n 46) or >18 828 J (>4500 kcal) (n 120), had incomplete BP readings (n 7) or had TAG levels >2000 mg/dl (>22.6 mmol/l) (n 6) were excluded. Thus, our final complete data set comprised 9148 adults, 4549 men and 4599 women (2001–2002: n 1948; 2003–2004: n 1579; 2005–2006: n 1568; 2007–2008: n 1940; 2009–2010: n 2113).
Definition of the metabolic syndrome
The MetSyn was defined according to the NCEP/ATP III revised diagnostic criteria proposed by AHA/NHLBI( Reference Grundy, Cleeman and Daniels 30 ). Specifically, individuals with three or more of the following five criteria were defined as having MetSyn: (1) abdominal obesity (waist circumference >102 cm for men and >88 cm for women); (2) serum TAG levels ≥150 mg/dl (≥1.7 mmol/l) or treatment for elevated TAG; (3) HDL concentration <40 mg/dl (<1.04 mmol/l) for men and<50 mg/dl (<1.3 mmol/l) for women or treatment for elevated HDL; (4) SBP ≥130 mmHg or DBP ≥85 mmHg or treatment with hypertensive medications; and (5) fasting glucose ≥100 mg/dl (≥5.5 mmol/l) or treatment with glucose-lowering medications.
Anthropometric measurements
Waist circumference was measured during a health examination in the MEC and was measured at the highest point of the iliac crest at minimal respiration to the nearest 0·1 cm( 31 ).
Biomarker measurements
All the biochemical assays were carried out during a health examination in the MEC( 32 ). Serum TAG concentrations were measured enzymatically after hydrolysation to glycerol (Hitachi)( 33 ). HDL levels from 2001 to 2002 were measured using two methods – heparin manganese precipitation and a direct HDL immunoassay (Roche Diagnostics)( 34 ). After 2002, all HDL samples were measured using the direct HDL immunoassay method( 34 ). A quality control analysis carried out by the NHANES laboratory showed a difference in average HDL-cholesterol levels across age, sex and race/ethnicity groups( 34 ); therefore, samples from 2001 to 2008 NHANES data sets used the corrected HDL values as outlined in the NHANES documentation( 34 ). Fasting glucose levels were analysed using a hexokinase assay (Roche Diagnostics)( 35 ). Please see the aforementioned corresponding original references for inter-assay coefficients and other details of the experiments.
Blood pressure measurements
SBP and DBP were measured during the MEC after participants rested for 5 min quietly in a sitting position and after determining maximum inflation level( 36 ). Due to the differences in the number of BP measurements taken between the survey years, the average of the last two measurements was used for participants who had three or four measurements taken (n 6205; 67·8 %), the average of two measurements for participants with only two measurements taken (n 2396; 26·2 %) and the only measurement for participants who had one measurement taken (n 547; 6 %). Hypertension was defined using a definition described in the ‘Definition of metabolic syndrome’ section.
Dietary and supplemental calcium and magnesium intake measures
The dietary intake of Ca and Mg was assessed during an in-person 24-h dietary recall using the multi-pass approach( Reference Moshfegh, Rhodes and Baer 37 ). This approach is a respondent-driven method of collecting an accurate and detailed list of all foods and beverages consumed by an individual during a 24-h period (midnight to midnight). In 2002, a second 24-h recall was collected via telephone approximately 3–10 d after the MEC examination( 38 ). The NHANES dietary data includes a total Mg and total Ca variable for the 24-h dietary recall and a total Mg and total Ca variable for the second 24-h recall. Therefore, if an individual completed both 24-h recalls, we used the average total Mg and Ca nutrient intakes from the two 24-h recalls. Among all, 93 % of individuals completed both the 24-h recalls.
We also assessed the intake of Ca and Mg supplementation. Before 2007, nutrient intakes from supplements were collected using the Dietary Supplement Questionnaire( 38 ). In 2007, an additional 24-h dietary supplement and antacid recall was added to the 24-h dietary recall interview as part of the MEC exam, including detailed information about type, consumptions, frequency, duration and amount taken for each reported dietary supplement. We included the use of antacids in the measure of daily supplemental intake of Ca and Mg. All the participants were asked how often sources of Mg and Ca were consumed in the last 30 d. The daily contribution of Ca and Mg from supplements and antacids was calculated by multiplying the elemental amount of Ca or Mg from each source by the frequency consumed (during the last 30-d period) and then dividing it by 30.
Total Ca (mg/d) and Mg (mg/d) intake variables were calculated by summing the total daily intake from dietary, supplemental and antacid sources. All the values shown are for total daily Ca intake or total daily Mg intake.
Other dietary and demographic covariates
Data regarding age, sex, ethnicity, annual household income, education and smoking status were taken from the NHANES in-person household interviews( Reference Zipf and Porter 39 ) and included as potential confounders in the statistical models. In addition, we adjusted for the following nutrient data obtained from the 24-h recalls: (1) total fibre (g/d) and (2) total energy (kJ/d (kcal/d)).
Statistical analysis
Data from the NHANES 2001–2002, 2003–2004, 2005–2006, 2007–2008 and 2009–2010 household interviews as well as laboratory, anthropometric and dietary data for each participant were merged together using a unique participant identifier. Each NHANES cycle uses a complex, four-stage probability sampling design to select potential participants( 40 ); therefore, all the analyses were cross-sectional and took into account the complex sampling design.
In preliminary bivariate analyses, the association between MetSyn and each potential risk factor was assessed using χ 2 tests for categorical variables and the Student’s t test for continuous variables. Total Mg and total Ca were initially examined as continuous variables. We examined potential non-linear relationships using quadratic variable forms. However, due to possible undetected non-linearity and advantages in clinical interpretability, we also used quartiles for Ca and Mg in order to evaluate their potential associations with MetSyn. In addition, we evaluated the Pearson’s correlation and potential multiplicative interaction between Ca and Mg (using the continuous variables). Tests for linear trends were measured across Mg and Ca quartiles. Logistic regression models were used to examine the association between Mg and Ca intake, separately, with each nutrient categorised into quartiles with the lowest quartile as the referent category, and MetSyn. The final multivariable models were adjusted for age, sex, ethnicity, income, educational attainment, smoking status, daily fibre intake (g/d) and total daily energy intake (kJ/d (kcal/d)) (Model 1), and was additionally adjusted for total Mg (for the model including Ca quartiles) or total Ca (for the model including Mg quartile) (Model 2). SAS version 9.2 (SAS Institute Inc.) was used to carry out all the statistical analyses. All P values are from two-sided tests (α=0·05).
As previous studies evaluating the dietary intake of Ca and Mg on MetSyn( Reference Ford, Li and McGuire 5 , Reference Liu, Song and Ford 19 , Reference Drouillet, Balkau and Charles 20 ) observed differences among males and females, we stratified our models by sex. In addition, we evaluated potential multiplicative interactions between sex and Ca and Mg intake. We evaluated combinations of dietary Ca and Mg intake by dichotomising values into high and low intakes based on the highest (fourth) quartile and lower three quartiles, respectively, for each nutrient. For example, in the total study population, Mg intake was dichotomised into high (≥355 mg/d) and low (<355 mg/d) groups, and Ca intake was dichotomised into high (≥1172 mg/d) and low (<1172 mg/d) groups. We also examined Ca and Mg intake based on the RDA for individual nutrients (below RDA or meeting the RDA based on age- and sex-specific recommendations)( 41 , 42 ) and explored combinations of Ca and Mg groups meeting or being below the RDA. The Ca:Mg ratio was also evaluated by dividing total Ca intake by total Mg intake as a continuous variable and using the ratio cut-off point suggested by Rosanoff( Reference Rosanoff 43 ). In addition, we examined the potential association between Ca and Mg and each of the five individual criteria of MetSyn (i.e. abdominal obesity, high TAG, low HDL, hypertension and dysregulated glucose levels)( Reference Grundy, Cleeman and Daniels 30 ).
Results
The study population consisted of 9148 adults with an average age of approximately 50 years (Table 1). Approximately half (50·3 %) of the study population was female. Almost two-thirds of the adults were non-Hispanic white (73·5 %), 20·1 % were non-Hispanic black and 6·3 % were of other ethnic origins. The overall prevalence of MetSyn was 39·1 %, with 40·1 % of the females and 37·9 % of the males having MetSyn. The mean total daily intake of Mg was 282·7 and 309·4 mg/d for individuals with and without MetSyn, respectively. The mean total dietary intake of Ca was 882·4 and 961·2 mg/d for individuals with and without MetSyn, respectively (Table 1). The percentage of men and women who met the RDA for Mg was 18·8 and 24·8 %, respectively, and the percentage of men and women who met the RDA for Ca was 36·9 and 26·2 %, respectively. Only 34·4 % of men and 20·4 % of women with MetSyn met the RDA for Ca, and only 16·9 % of men and 19·8 % of women with MetSyn met the RDA for Mg.
Characteristics of the 2001–2010 National Health and Nutrition Examination Study adults with and without the metabolic syndrome (Mean values with their standard errors; number of subjects and percentages)

GED, General Educational Development; BP, blood pressure.
* Totally, 466 missing.
† Ten answered as refused/do not know.
‡ RDA for Ca is 1000 mg/d for males aged 20–70 years and 1200 mg/d for males >70 years of age; RDA for Ca 1000 mg/d for females aged 20–50 years and 1200 mg/d for females >50 years of age.
§ RDA for Mg is 400 mg/d for males aged 20–30 years and 420 mg/d for males >30 years of age; RDA for Mg is 310 mg/d for females aged 20–30 years and 320 mg/d for females >50 years of age.
|| To convert glucose in mg/dl to mmol/l, multiply by 0·0555. To convert HDL-cholesterol and LDL-cholesterol in mg/dl to mmol/l, multiply by 0·0259. To convert TAG in mg/dl to mmol/l, multiply by 0·0113.
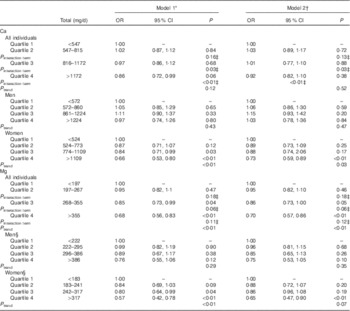
We found a significant inverse association between the highest (≥355 mg/d) v. the lowest quartile (<197 mg/d) of Mg intake and MetSyn after adjusting for age, sex, ethnicity, household income, education, smoking status, total energy intake and total fibre intake (Model 1: OR 0·70; 95 % CI 0·57, 0·86; P<0·01), which remained statistically significant after further adjustment for total Ca intake (Model 2: OR 0·68; 95 % CI 0·56, 0·83; P<0·01) (Table 2). We also examined Ca and Mg as continuous variables, and in models adjusted for age, sex, ethnicity, household income, education, smoking status, total energy intake and total fibre intake (Model 1) we found that for a 100 mg/d unit change both Ca (β=−0·0181, se of β=0·0054; OR 0·98; 95 % CI 0·97, 0·99; P<0·001) and Mg (β=−0·1034, se of β=0·0219; OR 0·90; 95 % CI 0·86, 0·94; P<0·001) were inversely associated with MetSyn. Quadratic forms of Ca (P=0·44) and Mg (P=0·50) were not statistically significantly associated with MetSyn.
OR for quartiles of calcium and magnesium and metabolic syndrome for all individuals and stratified by sex (Odds ratios and 95 % confidence intervals)
* Model 1 was adjusted for sex, age, ethnicity, education, household income, total energy intake and fibre intake.
† Model 2 was additionally adjusted for total Ca (for the model including Mg quartiles) or total Mg (for the model including Ca quartiles).
‡ P value for the multiplicative interaction term (sex×quartile).
§ Model was adjusted for age, ethnicity, education, household income, total energy intake and fibre intake.
We also examined the potential correlation and multiplicative interaction between Ca and Mg. We found that Ca and Mg were highly correlated (ρ=0·58; P<0·001). In a fully adjusted interaction model (Model 2), we found that Ca remained statistically significant (β=−0·001, se of β=0·0002; P<0·001), but neither Mg (β=−0·0001, se of β=0·0001; P=0·17) nor the multiplicative interaction term between Ca and Mg (P=0·64) was statistically significant.
Stratification by sex revealed that the association between the highest compared with the lowest quartile of Mg and MetSyn only remained statistically significant in females (OR 0·65; 95 % CI 0·47, 0·90) (Table 2). When we stratified by sex, we observed that women in the highest (≥1172 mg/d) v. the lowest (<547 mg/d) quartile of Ca also had a decreased odds of MetSyn in fully adjusted models (Model 2: OR 0·73; 95 % CI 0·59, 0·89). These differences by sex were further supported by a model evaluating the multiplicative interaction between sex and Ca quartiles, which found a significant interaction between sex and the highest Ca quartile (P interaction term<0·01) (Table 2).
Women who met the RDA for Mg (310–320 mg/d, depending on age) had a lower odds of MetSyn (OR 0·59; 95 % CI 0·45, 0·76), but in men the association was not statistically significant (Table 3). Women who met the RDA for Ca (1000–1200 mg/d, depending on age) had a reduced odds of MetSyn (OR 0·82; 95 % CI 0·70, 0·97), but in men the association was not statistically significant (Table 3). These differences by sex were further supported by a model evaluating the multiplicative interaction between sex and meeting the RDA for Ca, which found a significant interaction between sex and meeting the RDA for Ca (P interaction term<0·01) (Table 3).
OR for being below the RDA or meeting or being above the RDA for calcium and magnesium combinations for all individuals and stratified by sex (Odds ratios and 95 % confidence intervals)

Ref., referent values.
* Model was adjusted for sex, age, ethnicity, education, household income, total energy intake and fibre intake.
† Model was adjusted for age, ethnicity, education, household income, total energy intake and fibre intake.
‡ RDA for Mg is 400 mg/d for males aged 20–30 years and 420 mg/d for males >30 years of age; RDA for Mg is 310 mg/d for females aged 20–30 years and 320 mg/d for females >50 years of age.
§ P value for the multiplicative interaction term.
|| RDA for Ca is 1000 mg/d for males aged 20–70 years and 1200 mg/d for males >70 years of age; RDA for Ca is 1000 mg/d for females aged 20–50 years and 1200 mg/d for females >50 years of age.
When we stratified by Mg supplement use, we found that supplement use did not substantially alter the results, as increasing the intake of Mg was significantly associated with lower odds of MetSyn in Mg supplement users (P trend=0·02) and non-supplement users (P trend=0·02) (Fig. 1). The results for individuals who did (P trend=0·37) and did not (P trend=0·98) use Ca supplements were not statistically significant (Fig. 2).
Adjusted OR for associations between magnesium and metabolic syndrome among the total population (a), magnesium supplement users (b) and non-(magnesium) supplement users (c). Triangles denote adjusted odds ratios and lines denote 95 % confidence intervals. P values for tests of trend (a) for ‘all individuals’: P<0·01; (b) ‘supplement users’: P=0·02; and (c) ‘non-supplement users’: P=0·02. All models were adjusted for calcium, sex, age, ethnicity, education, household income, total energy intake and fibre intake.

Adjusted OR for associations between calcium and the metabolic syndrome among the total population (a), calcium supplement users (b) and non-(calcium) supplement users (c). Triangles denote adjusted odds ratios and lines denote 95 % confidence intervals. P values for tests of trend (a) for ‘all individuals’: P<0·52; (b) ‘supplement users’: P=0·37; and (c) ‘non-supplement users’: P=0·98. All models were adjusted for magnesium, sex, age, ethnicity, education, household income, total energy intake and fibre intake.

We also explored various combinations of intake for Mg and Ca using RDA (Table 3) and quartile (Table 4) cut-off points. Women who met the RDA for both Mg and Ca, compared with women who did not meet the RDA for either nutrient, had a significantly reduced risk for MetSyn (OR 0·59; 95 % CI 0·45, 0·76) (Table 3). In men, meeting the RDA for Mg (RDA: 400–420 mg/d, depending on age) and Ca (RDA: 1000–1200 mg/d, depending on age) was not statistically significantly associated with MetSyn (Table 3). These differences by sex were further supported by a model evaluating the multiplicative interactions between sex and meeting the RDA for Ca and Mg, which found a significant interaction between sex and meeting the RDA for Ca and Mg (P interaction term<0·01). Men who had a Mg intake ≥386 mg/d and a Ca intake ≥1172 mg/d, compared with those who had a Mg intake of <386 mg/d and a Ca intake of <1172 mg/d, had a lower odds of MetSyn (OR 0·74; 95 % CI 0·59, 0·93) (Table 4). Women with a high intake of Mg≥317 mg/d and Ca≥1109 mg/d also had a lower odds of MetSyn (OR 0·60; 95 % CI 0·46, 0·78; P<0·01).
OR for high and low combinations of calcium and magnesium and metabolic syndrome for all individuals and stratified by sex (Odds ratios and 95 % confidence intervals)

Ref., referent values.
* Model was adjusted for sex, age, ethnicity, education, household income, total energy intake and fibre intake.
† Model was adjusted for age, ethnicity, education, household income, total energy intake and fibre intake.
‡ P value for the multiplicative interaction term (sex×Ca_Hi_Mg_Hi). The P value of the multiplicative interaction terms for ‘sex×Ca_Hi_Mg_Lo’ (P=0·39) and ‘sex×Ca_Hi_Mg_Lo’ (P=0·25) are not shown.
The association between Ca:Mg ratio as a continuous variable and MetSyn was not statistically significant among all individuals (OR 1·02; 95 % CI 0·96, 1·07) or among men (OR 1·04; 95 % CI 0·98, 1·10) or women (OR 0·98; 95 % CI 0·95, 1·02), separately. When we applied cut-off points for the Ca:Mg ratio, suggested by Rosanoff( Reference Rosanoff 43 ) (3·24 for men, 3·08 for women), we did not observe a statistically significant association in the total population (OR 1·03; 95 % CI 0·93, 1·14) or among men (OR 0·95; 95 % CI 0·82, 1·10) and women (OR 1·10; 95 % CI 0·96, 1·26), separately.
We evaluated the potential association between Ca quartiles and Mg quartiles and the individual components of MetSyn to help lend insights into the underlying features and potential mechanisms that may be driving the associations we observed with MetSyn. The most revealing statistically significant associations were observed between higher intakes of Ca and hypertension (second v. first: OR 0·82; 95 % CI 0·71, 0·95; P<0·01; third v. first: OR 0·74; 95 % CI 0·63, 0·86; P<0·01; fourth v. first: OR 0·72; 95 % CI 0·60, 0·86; P<0·01) (Table 5) and higher intakes of Mg and low HDL (second v. first: OR 0·82; 95 % CI 0·71, 0·95; P<0·01; third v. first: OR 0·82; 95 % CI 0·66, 0·97; P=0·02; fourth v. first: OR 0·63; 95 % CI 0·50, 0·79; P<0·01). These results were stronger and more statistically significant in women compared with men (Table 5).
OR for calcium and magnesium intake and individual components of the metabolic syndrome stratified by sex (Odds ratios and 95 % confidence intervals)

* Model was adjusted for sex, age, ethnicity, education, household income, total energy intake and fibre intake and Ca or Mg.
† Model was adjusted for age, ethnicity, education, household income, total energy intake and fibre intake and Ca or Mg.
‡ See the ‘Methods’ section for definitions of abdominal obesity, high TAG, low HDL, hypertension and hyperglycaemia.
§ See Table 2 for quartile values.
Discussion
To our knowledge, this is the first study to evaluate combinations of dietary intake of Ca and Mg on MetSyn using 10 years of NHANES data (2001–2010). We found that women who met the RDA for Mg (310–320 mg/d, depending on age) and Ca (1000–1200 mg/d, depending on age), individually and in combination, had a lower odds of MetSyn, and those women who met the RDA for both Mg and Ca had the greatest reduced odds at 41 %. In men, meeting the RDA for Mg (400–420 mg/d, depending on age) and Ca (1000–1200 mg/d, depending on age), individually or in combination, was not statistically significantly associated with MetSyn; however, men with a Mg intake ≥386 mg/d and a Ca intake ≥1224 mg/d had a statistically significant lower odds of MetSyn, suggesting that Ca intake exceeding the RDA with Mg intake at the RDA may be required to potentially protect men from developing MetSyn. These differences observed when stratifying by sex were further supported by statistically significant multiplicative interactions between sex and Ca measures.
Our total Mg intake results are generally consistent with previous epidemiological studies. For example, in the third NHANES (1988–1994), which is a cross-sectional study, an inverse association between the fourth quintile (377–465 mg/d men, 264–366 mg/d women) (OR 0·62; 95 % CI 0·40, 0·98) and fifth quintile (≥466 mg/d men, ≥337 mg/d women) (OR 0·56; 95 % CI 0·34, 0·92) of Mg intake compared with the lowest quintile (≤221 mg/d men, ≤164 mg/d women) of Mg intake and MetSyn was observed (P trend=0·029)( Reference Ford, Li and McGuire 5 ). In women, we found statistically significant associations with the highest quartile of intake (>317 mg/d) and at or above the RDA (310–320 mg/d, depending on age). In men, however, we did not find a significant association using RDA in recent NHANES (2001–2010) data, whereas a previous study using earlier NHANES data (1988–1994) found a significant inverse association for the fifth quintile (≥466 mg/d) in men (OR 0·50; 95 % CI 0·25, 0·99; P trend=0·03)( Reference Ford, Li and McGuire 5 ). In another study that used 1999–2004 NHANES data, Beydoun et al. ( Reference Beydoun, Gary and Caballero 8 ) found that a 100 mg/d increase in Mg was inversely associated with MetSyn (OR 0·80; 95 % CI 0·76, 0·85); however, they did not report results stratified by sex and did not estimate Mg intake from all dietary and supplemental sources. In a cross-sectional analysis of data from the Women’s Health Study, women in the third (median intake 325 mg/d), fourth (median intake 359 mg/d) and fifth (median intake 423 mg/d) quintiles of Mg intake were significantly associated with a decreased risk of MetSyn (P trend<0·01)( Reference Song, Ridker and Manson 6 ). Taken together, it appears that the inverse association between Mg intake at or above the RDA level and MetSyn is consistent among women.
Although there are several clinical trials showing that higher Ca intake reduces BP( Reference Bucher, Cook and Guyatt 23 , Reference McCarron and Reusser 44 ), there is limited epidemiological evidence supporting associations between higher dietary Ca intake and MetSyn. In a study using the 1999–2004 NHANES data, a 100 mg/d increase in Ca from dairy foods was not significantly associated with MetSyn( Reference Beydoun, Gary and Caballero 8 ). The DESIR cohort study, which followed-up French individuals for 9 years( Reference Drouillet, Balkau and Charles 20 ), found a significant inverse association between increasing quartiles of Ca intake and decreasing BP (SBP and DBP) in women. However, in men, higher intakes of Ca by quartiles was only significantly associated with lower levels of DBP. In the Women’s Health Study, increasing quintiles of total Ca intake compared with the lowest quintile were associated with decreased risk of MetSyn (P trend<0·01)( Reference Liu, Song and Ford 19 ). Our results for women were significant at a Ca intake of >1109 mg/d, which is similar to the results found in the Women’s Health Study for the fifth quartile (median intake 1168 mg/d).
The relationship between combinations of differing intake levels of Mg and Ca has not been well studied. In our study, we found a statistically significant potentially protective effect with high Ca and high Mg intake and MetSyn, which is consistent with our study’s independent effects of Ca and Mg. In particular, women who met the RDA for Mg (310–320 mg/d, depending on age) and Ca (1000–1200 mg/d, depending on age) had a 41 % reduced risk of MetSyn. In men, meeting the RDA for Mg (400–420 mg/d, depending on age) and Ca (1000–1200 mg/d, depending on age), individually or in combination, was not associated with MetSyn; however, men with a Mg intake ≥386 mg/d (fourth quartile) and a Ca intake ≥1224 mg/d (fourth quartile) had a decreased risk of MetSyn, suggesting Ca intake exceeding the RDA in combination with Mg intake at the RDA level may be required to reduce the risk of MetSyn in men.
The lower odds we observed between higher levels of Mg intake and MetSyn and higher levels of Mg and low HDL may be explained, at least in part, by the role of Mg in removing TAG from the blood and in increasing the production of HDL( Reference Laughlin and Thompson 17 , Reference Rosanoff and Seelig 18 ). The inverse association we observed between higher levels of Ca and MetSyn and higher levels of Ca and hypertension may be explained, at least in part, by the role of Ca in lowering SBP and DBP( Reference Allender, Cutler and Follmann 21 – Reference van Mierlo, Arends and Streppel 24 ) and possibly through an indirect route of decreasing dyslipidaemia via lowering the TAG:HDL ratio( Reference Lorenzen and Astrup 25 ). However, the underlying mechanisms driving the differences we and others( Reference Liu, Song and Ford 19 , Reference Drouillet, Balkau and Charles 20 ) have observed by sex are not well understood and warrant additional mechanistic studies.
Previous reports estimating the usual nutrient intake for food and water consumption (but excluding intakes from dietary supplements and medications) compared with dietary reference intakes (DRI) using NHANES 2001–2002 and 2005–2006 data found that only about half of US males aged 19–50 years and only about one-quarter of males aged 51–70 years had Ca intakes above the adequate intake (AI) for Ca at 1000 and 1200 mg/d, respectively( 45 – Reference Bailey, Dodd and Goldman 48 ). In addition, only about one-third of US females aged 19–50 years and <10 % of females aged 51–70 years had Ca intakes above the AI for Ca at 1000 and 1200 mg/d, respectively. However, we note that AI values for Ca were replaced for these life-stage groups in the 2011 revision of the DRI with estimated average requirements (EAR), which is the intake that meets the needs of 50 % of the individuals in a group. Thus, the EAR for Ca is currently 800 mg/d for males aged 19–50 years, males aged 51–70 years and females aged 19–50 years; and for females aged 51–70 years the EAR for Ca is 1000 mg/d. Furthermore, previous reports estimated that 50 % or more US males and females aged 19–30 years and 31–70 years were below the EAR for Mg at 330 and 350 mg/d, respectively, for males in these age groups, and at 255 and 265 mg/d, respectively, for females in these age groups( 45 , Reference Bailey, Dodd and Goldman 48 ). We note that these values are also the current EAR values for Mg in the 2011 revision. In light of our findings that, in females, Ca intakes of 1000 mg/d (for 19–50 year olds) and 1200 mg/d (for 51–70 and >70 year olds) and, in men, Ca intakes at or exceeding 1224 mg/d and Mg intakes at or exceeding 386 mg/d were observed to significantly decrease the odds of MetSyn, we believe that enhancing public awareness of meeting the recommended guidelines for Ca and Mg in otherwise ‘healthy’ populations, particularly younger females (19–50 years old) and males (19–70 years old), may help lower their odds of the MetSyn.
A strength of our study is the use of a large, nationally represented sample of adults in the USA. To our knowledge, this is the first study to evaluate the combined effects of Mg and Ca using the last 10 years of NHANES data. A major limitation of our study is the cross-sectional nature of the data, which does not allow for establishment of a temporal association and inference of causality. In addition, dietary data were collected through a 24-h recall, which has been shown to have bias in estimating energy intake in men (reduction of 1175·7 kJ (281 kcal)) and in women (a reduction of 1276 kJ (365 kcal)) participating in NHANES studies( Reference Archer, Hand and Blair 49 ). Moreover, we were unable to determine the contribution of Ca and Mg intake from drinking water sources, which could be an important source of Ca and Mg depending on the level of water hardness. Owing to inconsistencies in how physical activity was measured across the NHANES cycles, we were not able to adjust for physical activity in our analyses. In addition, there was a small percentage (6 %) of individuals whose hypertension assessment was determined from a single BP measurement and a small percentage (7 %) of individuals who had only one (v. two) 24-h dietary recalls, which could potentially bias the results. Furthermore, due to the exploratory nature of this study, we did not correct for multiple testing.
In summary, our results suggest that women meeting the RDA for both Mg and Ca have lower odds for MetSyn, and men may require Ca intakes higher than the current RDA with Mg intakes at the RDA to be potentially protected against MetSyn. However, additional prospective studies are needed to validate these findings.
Acknowledgements
None.
This work was supported, in part, by the National Institutes of Health (NIH) (N. L. N. K07129162). NIH had no role in the design, analysis or writing of this article.
L. M.-S., M. E. S., J. S., J. M. A. and N. L. N. all contributed to the design and conduct of the research; L. M.-S. and J. M. A. analysed the data; and L. M.-S. and N. L. N. wrote the initial drafts of the paper and had responsibility for the final content. All the authors read and approved the final manuscript.
The authors have no conflicts of interest to declare.


