


The micronutrient Zn is an essential trace element that is required for physical growth, development and immune defence( Reference Sharma, Patni and Shankhdhar 1 ). A lack of Zn can lead to growth and developmental retardation, an impairment of the immune system together with decreased resistance to infections and therefore can cause diverse diseases in humans and animals( 2 ). Several disorders related to Zn deficiency such as diarrhoea have been shown to be recovered and prevented by Zn supplementation as adjunct therapy( Reference Penny 3 ). Different studies demonstrate that Zn deficiency impairs the formation and activity of inflammatory cytokines and therefore has an influence on the development and regulation of immune cells( Reference Kim and Ahn 4 , Reference Solomons 5 ). A deficit of Zn can thus alter the immune response, resulting in an ineffective control of pathogens( Reference Prasad 6 ).
However, further investigations are needed to fully understand the precise effects of Zn on the immune system. In particular, the pig, which is known to have a digestive physiology similar to humans as it is an omnivore and the organ size is comparable to humans, could be used as a translational model( Reference Kim, Ahn and Woo 7 , Reference Meurens, Summerfield and Nauwynck 8 ).
In pig husbandry, Zn is known to induce several positive effects on the gastrointestinal microbiota when fed at a high dietary level (2000–3000 parts per million (ppm)), including enhanced growth of the pigs, and shows improved resistance against post-weaning diarrhoea( Reference Molist, Hermes and de Segura 9 – Reference Shen, Chen and Wang 12 ).
Despite its positive effects, there are also negative aspects of Zn that need to be considered. Several lines of evidence suggest that long-term uptake of high dosage of Zn can lead to negative effects on the immune system. Previous studies using an infection model with Salmonella typhimurium revealed that long-term application of zinc oxide over a period of 6 weeks led to decreased number of T-cell populations within the mesenteric lymph nodes (MLN) of the pigs( Reference Janczyk, Kreuzer and Assmus 13 ). Within the same experimental setup, we observed increased expression of suppressor of cytokine signalling (SOCS) SOCS2, SOCS4 and SOCS7 in MLN of piglets, which suggested that such treatments may impair the immune response( Reference Schulte, Brockmann and Kreuzer-Redmer 14 ). These results are consistent with previous findings that permanently high uptake of Zn can result in an impairment of lymphocyte proliferation( Reference Chandra 15 ). Moreover, there is some evidence for elevated levels of liver enzymes associated with liver damage in pigs( Reference Han, Hwan Hwang and Thacker 16 ) supplemented with high level of Zn, and co-accumulation of Cu and Zn was found in the kidney of piglets fed very high concentrations of zinc oxide for 4 weeks( Reference Zetzsche, Schunter and Zentek 17 ). It was shown that the CD8+ γδ T-cell fraction of intra-epithelial lymphocytes showed reduced abundance after 4 weeks of feeding a high Zn diet compared with the control diet( Reference Liu, Pieper and Tedin 18 ). However, a more detailed analysis of the immune-regulating genes providing insight into beneficial and impairing mechanisms of the T-cell immune response within the gut-associated lymphatic tissues (GALT) after feeding high Zn dosages is still missing.
Our aims are to investigate (1) whether Zn transporters are expressed on immune cells; (2) whether the adaptive immune cells of the GALT respond to, and are affected by, feeding of Zn in a dosage-dependent manner and (3) how GALT is influenced by the exposure duration to different dosages of Zn.
Therefore, we examined the relative counts of T-cells and the relative expressions of Zn transporters and immune-relevant genes in GALT of seventy-two weaned piglets fed different levels of Zn at 1, 2 or 4 weeks. We aimed to use a low Zn concentration (LZn) of 50 mg Zn/kg feed, which should mimic a suboptimal Zn status for the piglets, a medium Zn concentration (MZn) of 150 mg Zn/kg feed and a very high Zn concentration (HZn) of 2500 mg Zn/kg feed. Feed with HZn of 2250–3000 mg Zn/kg is commonly used as medical intervention to treat post-weaning diarrhoea( Reference Schulte, Brockmann and Kreuzer-Redmer 14 , Reference Karweina, Kreuzer-Redmer and Müller 19 – Reference Chai, Zakrzewski and Gunzel 21 ). The MZn group was our control group, as the European Commission has restricted dietary supplementation of Zn to a maximum of 150 ppm for piglets. Therefore, 150 ppm is the commonly used dosage in feed in Europe. In addition, we used the LZn group to reflect the effects of short-term subclinical Zn deficiency( Reference Brugger and Windisch 22 ) as a counterpart to the HZn group.
Methods
Animals, housing and diets
A total of seventy-two purebred Landrace piglets were weaned at 26 (sd 1) d of age with a mean body weight (BW) of 7·2 (sd 1·2) kg and randomly allocated into three dietary treatment groups balancing for sex, litter and BW. BW and lymphoid tissue sizes can be found in online Supplementary Table S1; pairwise t tests were performed between the three feeding groups to detect difference in relative lymphoid tissue size between the groups (no significant differences were detected; online Supplementary Table S1 – sheet 4). Animals were housed in pens (n 2 per pen) with straw bedding and ad libitum access to feed and water. Each dietary group (n 24 per feeding group) was fed a common basal maize–wheat–barley–soyabean diet with different Zn levels (online Supplementary Table S2)( Reference Martin, Pieper and Schunter 23 ). The dietary Zn levels were confirmed by analysis using atomic absorption spectrometry in an AAS vario 6 spectrometer (Analytik Jena). We aimed to have 50, 150 or 2500 mg Zn in 1 kg of feed; the actual measured values for the feedings groups were 57 (LZn), 164 (MZn) or 2425 (HZn) mg Zn/kg. The Zn source was analytical-grade zinc oxide (Sigma Adrich). No antibiotics were administered before and during the experiment. All animal experiments were performed at the Institute of Animal Nutrition, Freie Universität, Berlin, Germany, in accordance with the German Animal Protection Law and approved by the local responsible authorities (LaGeSo Reg. No. 0347/09). The in vivo procedures were consistent and in compliance with the Animal Research: Reporting of In Vivo Experiments (ARRIVE) Guidelines for Reporting Animal Research.
Sampling of gut-associated lymphatic tissue and immune cells
In all, eight piglets per group and time point were euthanised at the following time points: 32 (sd 1), 39 (sd 1) and 53 (sd 1) d of age. The piglets were sedated with 20 mg/kg BW of ketamine hydrochloride (Ursotamin®; Serumwerk Bernburg AG) and 2 mg/kg BW of azaperone (Stresnil®; Jansen-Cilag), and cord blood was taken before euthanasia with intra-cardial injection of 10 mg/kg BW of tetracaine hydrochloride, mebezonium iodide and embutramide (T61®; Intervet). During necropsy, jejunal and ileocaecal mesenteric lymph nodes (JELN and ILLN, respectively) and Peyer’s patches from the jejunum and the ileum (JEPP and ILPP, respectively), as well as the ileal papilla (PAPIL), were obtained and either frozen in liquid N2 within 3 min after death of the animal or collected in 15-ml Falcon tubes filled with 5 ml of PBS containing 0·2 % bovine serum albumin. Lymphocytes were isolated using a 70-µm Cell Strainer (Becton Dickinson GmbH) as described before( Reference Kreuzer, Janczyk and Assmus 24 ) and purified by centrifugation in a Ficoll gradient.
Zinc concentration in mesenteric lymph nodes
MLN were freeze-dried before hydrolysis in hydrochloric acid and subsequently analysed by atomic absorption spectrometry in an AAS vario 6 spectrometer. An external standard (PerkinElmer Pure XVI, #N9300281; PerkinElmer) was used for calibration. The accuracy was checked by a certified reference Zn solution (Titrisol, #9953; Merck).
Cell culture of isolated leucocytes from mesenteric lymph nodes
As direct effects of Zn on the immune cells are difficult to study in vivo, owing to many environmental influencers of immune status, we opted for a cell culture approach using primary isolated immune cells. We believe that this approach should lead to reduced complexity of the studied system compared with in vivo experiments. However, the use of primary isolated immune cells should give results reflecting the interplay of different immune cells more accurately compared with using single-origin cell lines. Cells were isolated from one healthy control piglet; 1×10⁶ cells/well were cultured in a ninety-six-well plate using Roswell Park Memorial Institute (RPMI) media enriched with 10 % fetal calf serum, 200 mm l-glutamine and Antibiotic–Antimycotic (Thermo Fisher Scientific). The aim of the in vitro experiments was to mimic the same concentrations of Zn in cell culture as they occur in vivo. The analyses of Zn concentrations in MLN revealed on average 13 mg Zn/kg. If one accounts for the molarity of Zn, this calculates 0·2 mm Zn/litre in the cell medium to reflect the in vivo measured concentration. However, this is not the concentration in the cell. In pre-experiments, we tested Zn concentrations from 10 µm to 2 mm from different organic and inorganic Zn sources in porcine and murine splenocytes and lymphocytes from MLN. Although ZnSO4 and zinc oxide were toxic to the primary cultured cells in the used concentrations of 100 or 200 µm Zn2+, the cells survived for 5 d when the medium was supplemented with 200 µm zinc gluconate or zinc acetate per litre. For our experiments, we chose to add zinc acetate and we calculated the Zn2+ amount to be 10, 100 or 200 µm Zn2+ per well to reflect low and high levels of Zn for the primary cultured leucocytes.
Flow cytometry
Flow cytometry (FCM) was performed with the purified lymphocytes from the intestinal tissues and blood. Combinations of surface antigens were used to detect the following cell types – T-helper cells: CD4+ (Clone 74-12-4; Southern Biotech), CD25+/– (Clone K231.3B2; Biozol) and CD8α –/dim (Clone 76-2-11; Southern Biotech); regulatory T-cells: CD4+, CD25high; and cytotoxic T-cells: CD8β + (Clone: PG164A; VMRD) and CD4–. For forty randomly chosen samples, we performed an additional intra-nuclear staining of forkhead box P3 (FOXP3) (Clone FJK-16s; eBioscience) to assess the regulatory T-cell phenotype as well. In these samples, the relative cell counts of CD4+CD25high and CD4+FOXP3+ were the same. For each reaction, 1×10⁶ cells were stained as described elsewhere( Reference Kreuzer, Machnowska and Assmus 25 ). Per sample, 50 000 lymphocytes, which were negative for propidium iodide staining (0·5 µg/ml), were assessed by FCM using a BD FACSCalibur™ flow cytometer (Becton Dickinson).
Gene expression in tissue and isolated lymphocytes
Tissue samples were homogenised by the FastPrep-24 Instrument (MP Biomedicals), and RNA was isolated using the NucleoSpin® RNA II Kit of Macherey-Nagel according to the manufacturer’s instructions. The integrity of total RNA was measured by the Agilent 2100 Bioanalyzer (Agilent Technologies). RNA samples with an RNA integrity number (RIN) value higher than 7·5 were taken for quantification. The quantity was assessed by a NanoDrop spectrophotometer (PEQLAB Biotechnologie GmbH). In all, 1 µg of total RNA was reverse-transcribed into complementary DNA (cDNA) using AffinityScript quantitative PCR (qPCR) cDNA Synthesis Kit (Agilent) with oligo(dT) primers. Expression of 60S ribosomal protein L19 (RPL19) and TATA box-binding protein (TBP) did not vary owing to the Zn treatment of the piglets within the used tissues and cells and were therefore used as stable reference genes for normalisation of expression data for every sample on each plate. The primers and their source are described in online Supplementary Table S3. Primers for T-box 21 (TBET), FOXP3, GATA binding protein 3 (GATA3), interferon γ (IFNγ), IL12 and protein kinase C theta (PKCtheta) as well as the solute carrier family 39 member 4 (SLC39A4; ZIP4) transcripts were designed with exon-boundaries overlapping, based on published sequences of the pig (Ensembl, Genome assembly: Sscrofa10.2) using the online primer design tool Primer3 (http://frodo.wi.mit.edu). Expression of the Zn transporter genes ZnT1, ZnT2 and ZnT5 (solute carrier family 30; SLC30) was determined for the principal isoform. The Zn transporter gene ZIP4 was examined for different protein-coding transcripts. The long transcripts ZIP4-201 and ZIP4-001 contain all twelve exons of the ZIP4 gene; however, ZIP4-001 has a shortened exon 1 with a back-shifted transcription start site. The real-time qPCR (RT-qPCR) reaction was carried in a total volume of 10 µl containing 6 µmol forward primer, 6 µmol reverse primer, 10 ng of cDNA and 5 µl of SYBR Select Master Mix (Applied Biosystems). The amplification protocol included a 10-min denaturation step at 95°C, followed by forty cycles consisting of 30 s at 95°C, 20 s at 60°C and 40 s at 72°C. The quantification of the transcript amounts was performed with a ViiA™ 7 Real-time PCR System (Applied Biosystems) or for the cell culture experiments with a Thermal Cycler (Bio-Rad). Afterwards, a melting curve analysis was performed in every reaction well to check for specificity of primers. All primer sets were initially validated for single amplicon generation, and standard curves were tested before analysis. Only primer pairs with efficiency rates between 90 and 110 % were considered for gene expression analyses. Melting curves and PCR efficiency were used as standard quality criteria for each RT-qPCR run. Relative transcript amounts were calculated using the relative quantification method (ΔΔCt)( Reference Livak and Schmittgen 26 ). To calculate the ΔCt, the mean threshold cycle (Ct) values of the two endogenous control genes RPL19 and TBP were subtracted from the Ct of the target gene. To compare the relative expression among the different tissues and diets, the mean of the ΔCt values of animals belonging to the MZn group (our control group) from the Peyer’s patch were taken as the external calibrator to calculate the ΔΔCt. Results are presented as relative expression=2–ΔΔCt. Results shown for GALT represent the condensed analyses as means from separately analysed relative expressions from JELN and ILLN and JEPP and ILPP, as well as the PAPIL.
RNA sequencing
To get a deeper insight into the mechanism accounting for the effects of high dietary Zn, we performed a deep sequencing approach for mRNA of MLN from 32-d-old piglets after feeding MZn or HZn in the feed for 1 week. Sequencing of individually barcoded samples was carried out for two male and one female piglet for MZn and HZn.
Read alignment
Paired-end sequencing reads were obtained using an Illumina instrument and were trimmed using trimmomatic 0·32 using the TruSeq3-PE-2.fa adapter library from Illumina. After trimming alignment was done by tophat2 using the Sscrofa10.2 genome (Ensembl) and the Sscrofa10.2 transcriptome (Ensembl), we did not allow for multi-mapped reads (prefilter-multihits) and allowed for two mismatches, 13-bp alignment gaps and a maximum insertion and deletion size of 20 bp when aligning sequences to the reference genome/transcriptome. After alignment reads were sorted using samtools (version 1.3.1-45) and optical duplicate were marked using picard tools (version 1.99), the resulting bamfiles were indexed using samtools, after which base recalibration around known SNP was performed using GATK (3.2-2) according to GATK best practices.
Gene expressions from RNA-sequencing
After alignment of reads, read-level reads per kilobase million (RPKM) gene expressions were performed using the following procedure: using the GenomicFeatures R package, we made a transcript database (exons by gene) from the Sus_scrofa.Sscrofa10.2.84.short.gtf file obtained from Ensembl. Read overlap between the genes and bamfiles was performed using the summarizeOverlaps function from the GenomeAlignments R package in union mode, ignoring strand orientation but allowing for fragments within a feature to be counted. Raw read counts were extracted and quantile normalised and transformed into RPKM values. These data were then log2-transformed to follow a normal distribution followed by differential expression analysis using standard two-sided t tests. Genes were annotated using biomaRt, using the sscrofa_gene_ensembl database (online Supplementary Table S4).
Gene set enrichment analysis
We used the FGSEA package in R to perform gene set enrichment analysis (GSEA) on our differentially expressed genes. Therefore, we converted the Ensembl gene identifiers of our data into Entrez identifiers using the biomaRt R package. When a gene had no corresponding Entrez identifier in the biomaRt conversion, we used the Entrez identifier associated with the human orthologue for the corresponding gene. After converting identifiers, we then used the reactomePathways function provided by the FGSEA package to map pathways annotations to our Entrez identifiers. Settings used in the fgsea analysis function were 10 000 000 permutations; minimum size of the gene set to test was 80; and the maximum size of the gene set to test was 500. These parameters were chosen as we only want to look for over-representation in larger pathways as our sample size is low, and we expect a lot of false positives when performing GSEA using small pathways. Finally, we extracted over-represented pathways and plotted the figure using the topPathways function.
Statistical analyses
Statistical analyses of data
FCM raw data were analysed using FlowJo version 7.9 and further processed using R version 3.2.3. Plots were generated using the R package ggplot2. Zn group pairs (LZn against MZn and HZn against MZn) were tested using pairwise Mann–Whitney U tests. Multiple testing correction was not applied because of the small sample sizes. Relative gene expressions were calculated and analysed with Microsoft Excel 2010. Results were considered significant when P≤0·05. The effect of Zn concentrations was tested using ANOVA (Table 1); as no significant differences were detected, a post hoc test was not performed.
Influence of dietary zinc concentrations low zinc concentration (LZn), medium zinc concentration (MZn) and high zinc concentration (HZn) on the relative expression of the zinc transporter transcripts in Peyer’s patches and lymph nodes of the jejunal small intestine of piglets after 2 weeks of feeding* (Mean values and standard deviations)
ZIP4, solute carrier family 39 member 4 (SLC39A4); ZnT, solute carrier family 30 (SLC30).
* LZn (low dietary Zn)=57 mg Zn/kg feed; MZn (medium dietary Zn)=164 mg Zn/kg feed; HZn (high dietary Zn)=2425 mg Zn/kg feed. All expression values of the transcripts are relative to the mean of the ΔC t values of the MZn group from the Peyer’s patch.
Statistical power estimation
Estimation of differences in relative cell count, as well as in relative expression of genes, using a statistical power of 80 % is performed using pairwise Whitney U tests for the LZn and HZn dosage groups against the control MZn group. The minimally detectable effect size required was set to 1 unit of difference in relative expression level or relative cell count, leading to an estimated eight samples required per group. When three time points were considered (1, 2 and 4 weeks), we estimated in total to detect significant effects with seventy-two pigs.
For RNA sequencing analysis, six animals were used (three HZn v. three MZn), and this was done owing to monetary limitations, as we do not expect to reach a power of 80 % at a significance level of 0·05 for testing differentially expressed genes directly from these data. Therefore, we used the data from RNA sequencing to perform GSEA. GSEA can be used to pick up general tendencies in the expression data and point to affected gene sets/pathways that are effected by Zn concentration (HZn v. MZn). Unfortunately, it is not possible to estimate the power obtained by GSEA; however, we control results at a false discovery rate of 5 %.
Results
Expression of zinc transporters and zinc concentration in gut-associated lymphatic tissue
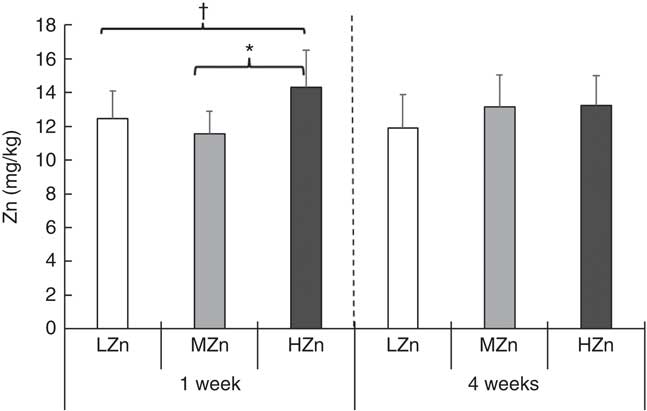
The expression of Zn transporters is a prerequisite for the proper uptake of Zn ions by immune cells and immune system-associated cells. We explored the repertoire of Zn transporters of GALT of piglets fed LZn, MZn and HZn diets for 1 and 2 weeks (Table 1). The expression of the long ZIP4 transcripts ZIP4-201 and ZIP4-001 and the Zn transporters ZnT1, ZnT2 and ZnT5 was measured in the MLN and Peyer’s patches. The data provide evidence that ZIP4, ZnT1, ZnT2 and ZnT5 are expressed not only in the epithelium but also in the MLN and Peyer’s patches of the jejunum (Table 1). However, there was no significant expression difference in these lymphoid tissues among the feeding groups for any examined Zn transporter gene, although we found a slight increase in Zn (14·31 mg/kg) in the HZn group compared with MZn (11·55 mg/kg; P<0·05) and LZn (12·45 mg/kg; P<0·1) groups in MLN after 1 week of feeding the Zn diets (Fig. 1). After 4 weeks of feeding, there was no difference in the Zn concentration for the feeding groups.
Trace element concentration (mg/kg DM) in mesenteric lymph nodes after 1 and 4 weeks of feeding a low zinc concentration of 57 mg zinc/kg feed (LZn (![]() ), 57 parts per million (ppm)), a medium zinc concentration of 164 mg zinc/kg feed (MZn (
), 57 parts per million (ppm)), a medium zinc concentration of 164 mg zinc/kg feed (MZn (![]() ), 164 ppm) or a high zinc concentration of 2425 mg zinc/kg feed (HZn (
), 164 ppm) or a high zinc concentration of 2425 mg zinc/kg feed (HZn (![]() ), 2425 ppm) to weaning piglets. Differences were tested using a pairwise Mann–Whitney U test: * 0·01<P<0·05, † 0·05<P<0·1.
), 2425 ppm) to weaning piglets. Differences were tested using a pairwise Mann–Whitney U test: * 0·01<P<0·05, † 0·05<P<0·1.
Short-term effects of zinc on T-cells
After 1 week of feeding a HZn diet, piglets had a higher relative cell count of CD4+ and CD8α dim T-cells than piglets fed a diet with a LZn (P<0·05) or MZn (P<0·01; Fig. 2(a)), suggesting that Zn feeding led to more activated status of T-helper cells. To be able to examine a direct effect of Zn ions on immune cells, we performed in vitro assays with primary isolated immune cells. In these in vitro assays, using isolated lymphocytes of MLN from a healthy donor pig, which was treated with different Zn concentrations (0, 10, 100 and 200 µm Zn2+), we detected a tendency in the same direction, namely an elevated level of activated T-helper cells (CD4+ and CD8α dim) after 3 d of culture in the HZn groups treated with 100 and 200 µm Zn2+ (Fig. 2(b)).
(a) Cell counts relative to the living lymphocyte population of CD4+CD8dim T-helper cells of piglets fed low (57 mg zinc/kg; LZn (![]() )), medium (164 mg zinc/kg; MZn (
)), medium (164 mg zinc/kg; MZn (![]() )) or high (2425 mg zinc/kg; HZn (
)) or high (2425 mg zinc/kg; HZn (![]() )) dosages, supplemented as zinc oxide for 1, 2 or 4 weeks. (b) Cell counts relative to the living lymphocyte population of CD4+ and CD4+CD8dim T-helper cells of lymphocytes isolated from porcine mesenteric lymph nodes treated with 10, 100 or 200 µm Zn2+/well as zinc acetate for 3 d in vitro. (c) Relative mRNA expression of the master transcription factor for T-helper 1 cells T-box 21 (TBET) and the proinflammatory cytokine interferon γ (IFNγ) in gut-associated lymphatic tissues (GALT) and ileocecal mesenteric lymph node (ILLN) of piglets fed zinc dosages as described in (a) for 1, 2 or 4 weeks. (d) Relative mRNA expression of the master transcription factors TBET, forkhead box P3 (FOXP3) and GATA binding protein 3 (GATA3), as well as the cytokine IFNγ of lymphocytes isolated from porcine mesenteric lymph nodes (MLN) treated with 10, 100, or 200 µm Zn2+/well as zinc acetate for 3 d in vitro. Differences were tested using a pairwise Mann–Whitney U test: * 0·01<P<0·05, ** 0·001<P<0·01.
)) dosages, supplemented as zinc oxide for 1, 2 or 4 weeks. (b) Cell counts relative to the living lymphocyte population of CD4+ and CD4+CD8dim T-helper cells of lymphocytes isolated from porcine mesenteric lymph nodes treated with 10, 100 or 200 µm Zn2+/well as zinc acetate for 3 d in vitro. (c) Relative mRNA expression of the master transcription factor for T-helper 1 cells T-box 21 (TBET) and the proinflammatory cytokine interferon γ (IFNγ) in gut-associated lymphatic tissues (GALT) and ileocecal mesenteric lymph node (ILLN) of piglets fed zinc dosages as described in (a) for 1, 2 or 4 weeks. (d) Relative mRNA expression of the master transcription factors TBET, forkhead box P3 (FOXP3) and GATA binding protein 3 (GATA3), as well as the cytokine IFNγ of lymphocytes isolated from porcine mesenteric lymph nodes (MLN) treated with 10, 100, or 200 µm Zn2+/well as zinc acetate for 3 d in vitro. Differences were tested using a pairwise Mann–Whitney U test: * 0·01<P<0·05, ** 0·001<P<0·01. ![]() , Control;
, Control; ![]() , 10 µm Zn2+;
, 10 µm Zn2+; ![]() , 100 µm Zn2+;
, 100 µm Zn2+; ![]() , 200 µm Zn2+. JELN, jejunal mesenteric lymph node; PE, phycoerythrin; FITC, fluorescein isothiocyanate.
, 200 µm Zn2+. JELN, jejunal mesenteric lymph node; PE, phycoerythrin; FITC, fluorescein isothiocyanate.
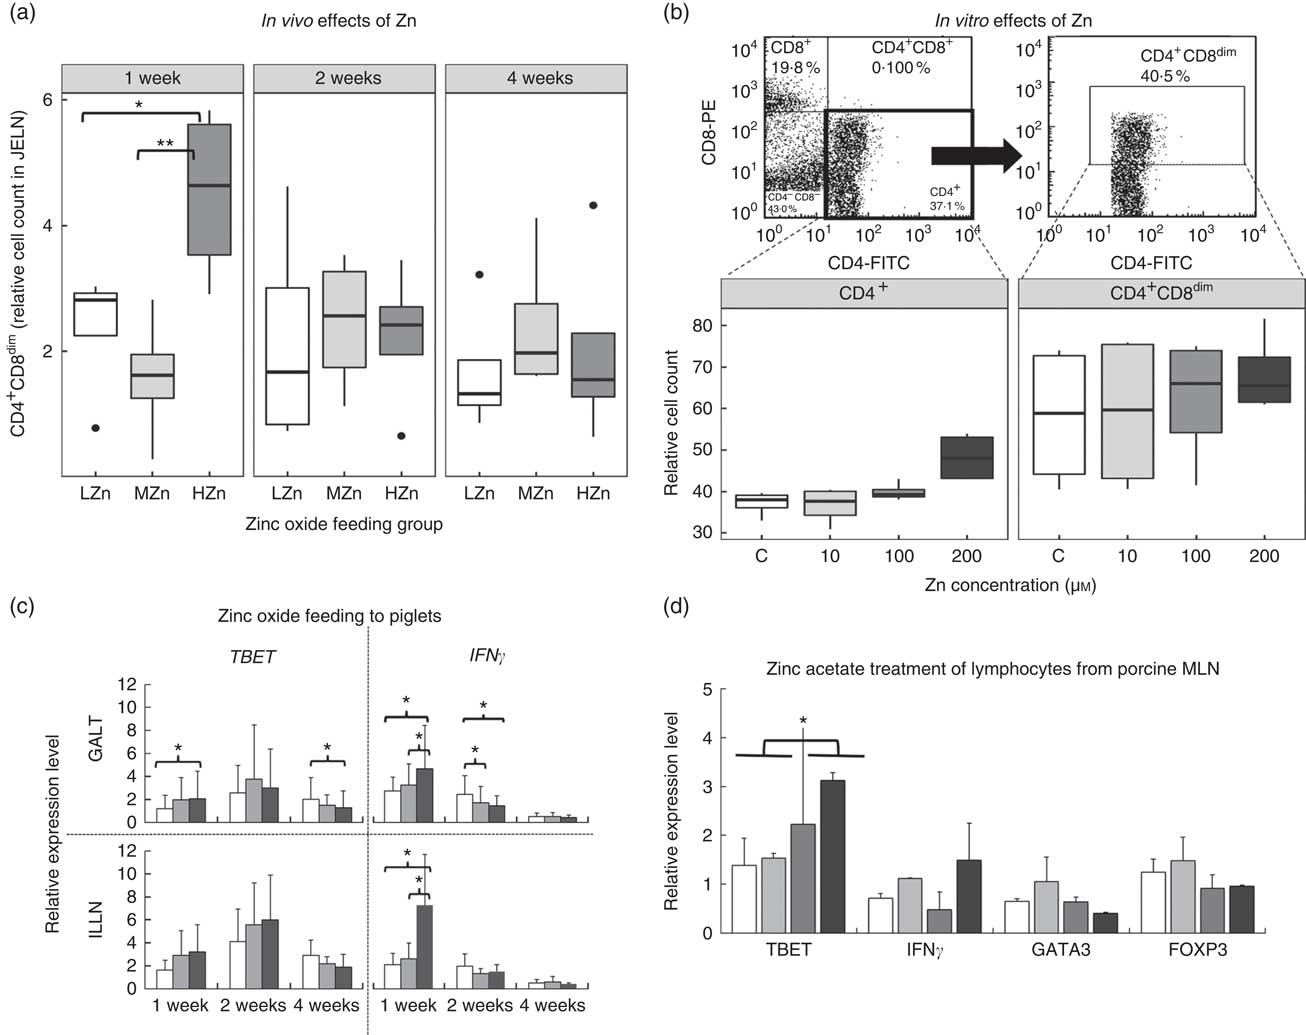
We next ascertained potential mechanisms responsible for the Zn-associated increase in the level of activated T-helper cells at the transcript level using qPCR of relevant mediators. After 1 week of feeding the different Zn diets, the T-helper cell 1-associated cytokine IFNγ was up-regulated at the transcript level in the HZn group when compared with the MZn (P<0·05) and LZn (P<0·05) groups within the GALT (Fig. 2(c)). Consistently with higher IFNγ transcript amounts, also higher mRNA levels of TBET, the master transcription factor of T-helper 1 cells, were observed in the HZn group compared with the LZn group (Fig. 2(c)) within the GALT (P<0·05). The higher transcript amount of IFNγ was specifically seen within the ILLN (Fig. 2(c)). In addition, we determined expression levels of the T-helper cell-associated genes TBET, GATA3 and FOXP3 of lymphocytes from the cell culture-based experiment. After 3 d of treatment with 0, 10, 100 or 200 µm Zn2+, we observed increased expression of TBET in lymphocytes treated with 100 and 200 µm Zn2+ when compared with the untreated controls and the low-dose Zn treatment group of 10 µm Zn2+ (Fig. 2(d)) (P<0·05). Hence, we could confirm the in vivo results in vitro. Within the cell culture-based experiment, we found a tendency of lower transcript amounts of FOXP3 in the 100 and 200 µm Zn2+ treatment groups compared with the control and the LZn treatment group of 10 µm Zn2+ (Fig. 2(d)). GATA3 and FOXP3 showed no difference in expression after short-term feeding of zinc oxide (data not shown). In addition, we set up an in vitro experiment performed in a different laboratory using a different Zn source, zinc gluconate, to validate the found Zn effects on TBET within MLN. We also detected a higher expression of TBET 100 and 200 µm Zn2+ treatment groups compared with the control and the LZn treatment group of 10 µm Zn2+ (online Supplementary Fig. S1). Furthermore, we checked the response of lymphocytes derived from blood within the in vitro assay using zinc gluconate. We could not detect a difference in TBET expression for lymphocytes from blood. In a next step, we were interested in the expression of important T-regulating genes and choose IL12 and PKCtheta. Remarkably, PKCtheta was highly up-regulated with Zn treatment in MLN-derived cells, whereas the up-regulation in blood-derived immune cells was moderate. IL12 showed an increase of expression in lymphocytes derived from MLN and from blood in the HZn treatment groups.
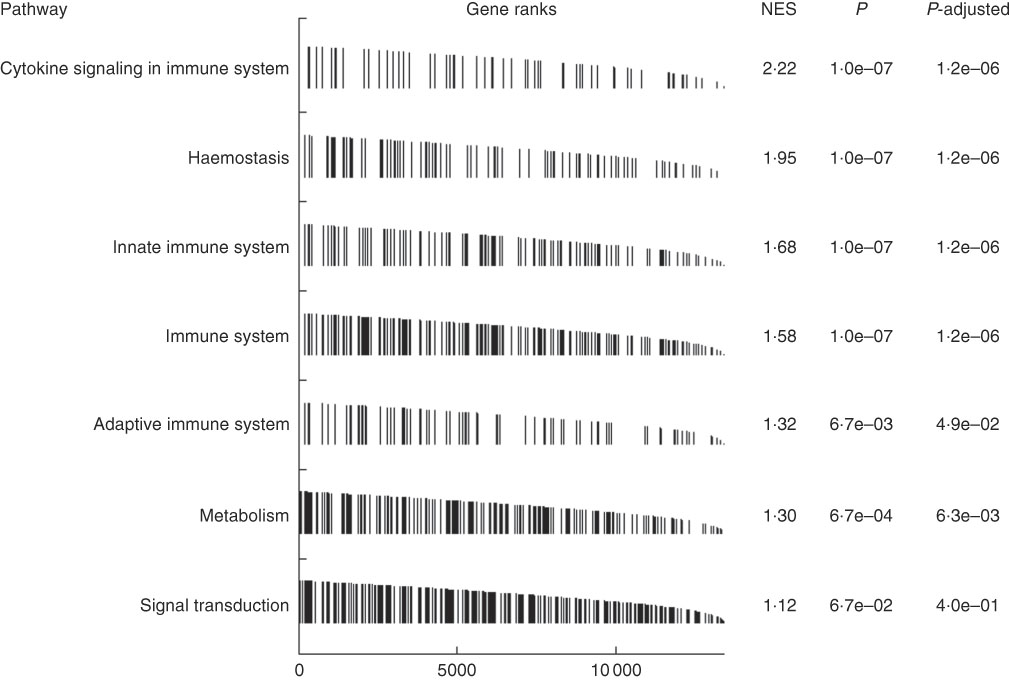
To better understand the mechanism, accounting for the short-term effects of high dietary Zn, we performed RNA sequencing of MLN from 32-d-old piglets after feeding MZn (MZn= three individual piglets) and HZn concentration (HZn=three individual piglets) in the feed for 1 week. To get a picture of contributing pathways, we performed GSEA on our differentially expressed genes. GSEA revealed highest enrichment for genes associated with cytokine signalling in the immune system (normalised enrichment score=2·22) (Fig. 3). In addition, GSEA identified a high over-representation of pathways involved in innate and adaptive immune response, within our differentially expressed genes, showing a massive activation of immune response in the HZn group compared with the MZn group after 1 week of feeding the zinc oxide diets.
Gene set enrichment analysis on differentially expressed genes within ileocecal mesenteric lymph node tissue between the feeding groups medium zinc concentration (164 mg zinc/kg feed) and high zinc concentration (2425 mg zinc/kg feed) after 1 week of feeding ranked to the normalised enrichment score (NES) from high to low.
Mid- and long-term effects of feeding zinc oxide
After 2 weeks of feeding the different Zn diets, the HZn group had higher transcript amounts of FOXP3, the master transcription factor of regulatory T-cells( Reference Fontenot, Gavin and Rudensky 27 ), in the HZn group compared with the MZn (P<0·01) and LZn (P<0·05) groups within the GALT (Fig. 4(a)). In particular, we observed a higher expression of FOXP3 in JELN (P<0·05) and JEPP (P<0·05), as well as in ILLN (P<0·05), in the HZn feeding group when compared to the LZn and MZn groups after 2 weeks of feeding the Zn diets (Fig. 4(b)).
(a and b) Relative mRNA expression of forkhead box P3 (FOXP3) in gut-associated lymphatic tissue (GALT) and in jejunal and ileocecal mesenteric lymph nodes (JELN and ILLN, respectively), Peyer’s patches from the jejunum and the ileum (JEPP and ILPP, respectively) and ileal papilla (PAPIL) analysed separately. (c) Exemplary original flow plot showing used gates to analyse cell populations. Plots are done using FlowJo version 7.9. displaying CD8-phycoerythrin (PE) against CD4-fluorescein isothiocyanate (FITC) staining and CD25-allophycocyanin (APC) against CD4-FITC. (d) Cell counts, relative to the living lymphocyte population of CD4+CD25high regulatory T-helper cells shown for the same tissues as in (b). Differences were tested using a pairwise Mann–Whitney U test: * 0·01<P<0·05, ** 0·001<P<0·01, † 0·05<P<0·1. ![]() , Low zinc concentration (57 parts per million (ppm));
, Low zinc concentration (57 parts per million (ppm)); ![]() , medium zinc concentration (164 ppm) and
, medium zinc concentration (164 ppm) and ![]() , high zinc concentration (2425 ppm).
, high zinc concentration (2425 ppm).
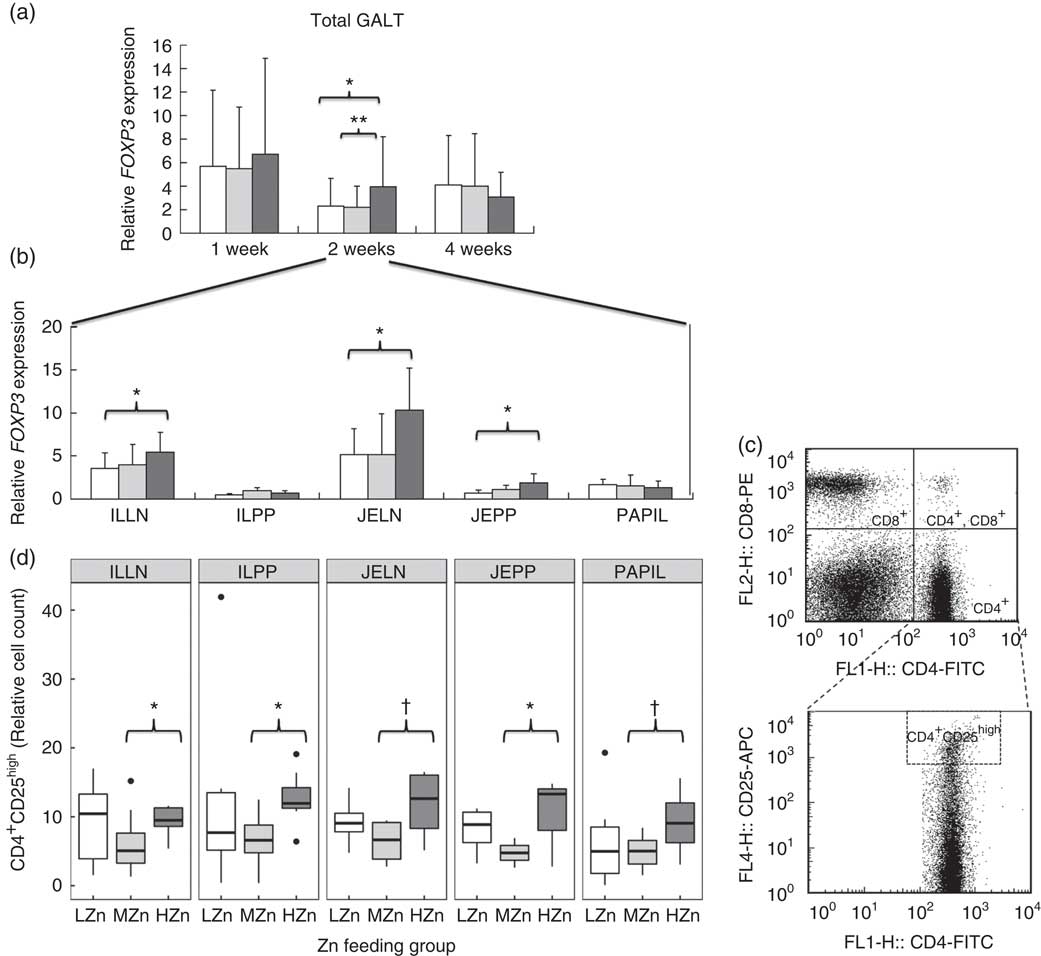
We confirmed increased frequencies of CD4+CD25high regulatory T-cells among ILLN and JEPP and ILPP, respectively, in the HZn group compared with the MZn group (P<0·05) by phenotypic analysis of immune cells using FCM (Fig. 4(c) and (d)). Moreover, JELN and PAPIL showed comparable tendencies in the same direction, which is a higher relative cell count of CD4+CD25high regulatory T-cells in the HZn group when compared with the MZn Zn feeding group (P<0·1).
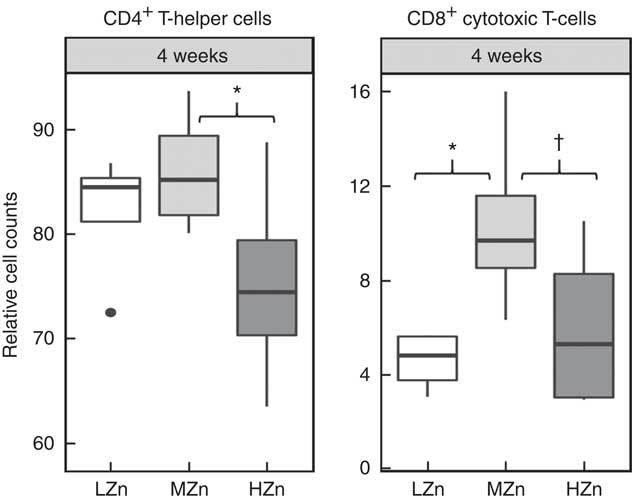
After long-term feeding of 4 weeks of the zinc oxide diets, we observed lower relative cell counts of CD4+ T-helper cells in the HZn group when compared with the MZn group for jejunal lymph nodes (P<0·05) (Fig. 5). We additionally found a tendency for a lower relative cell count of CD8+ cytotoxic T-cells in the HZn group compared with the MZn group (P<0·1) after 4 weeks of feeding the Zn diets. The LZn group showed a reduction in relative cell counts of CD8+ cytotoxic T-cells (P<0·05) compared with our control group fed a MZn diet (Fig. 5). The same tendencies could be seen in ileal lymph nodes (data not shown). In addition, we detected a lower relative transcript amount of TBET within GALT (Fig. 2(c)).
Cell counts relative to the living lymphocyte population of CD4+ T-helper cells and CD8b+ cytotoxic T-cells of jejunal mesenteric lymph nodes from piglets fed low zinc (57 mg zinc/kg) in diet (LZn), 164 mg zinc/kg (MZn) or 2425 mg zinc/kg (HZn) as zinc oxide for 4 weeks. Differences were tested using a pairwise Mann–Whitney U test: * 0·01<P<0·05, † 0·05<P<0·1.
Discussion
Our result shows that immune cells derived from MLN and Peyer’s patches showed expression of ZIP4, ZnT1, ZnT2 and ZnT5 in all feeding regimens. To our knowledge, there is currently no information available that shows expression of Zn transporters in porcine immune cells. There is vast literature available linking Zn with immune function, as shown in the review paper by Wessels et al. ( Reference Wessels, Maywald and Rink 28 ). Our hypothesis was that Zn transporters on the surface of immune cells respond to differences in Zn concentration. To validate this hypothesis, mRNA expression levels of the most common porcine Zn transporters (ZIP4, ZnT1, ZnT2 and ZnT5) were analysed. These genes were selected on the basis of previous research( Reference Jayaraman and Jayaraman 29 , Reference Martin, Lodemann and Bondzio 30 ), which showed differential expression of these transporters in epithelial cells and pancreatic cancer cells. However, in our current study, no differential expression of the selected Zn transporters was detected (Table 1).
As expected, a significantly higher Zn concentration was detected in MLN of the HZn feeding group compared with the MZn group after 1 week (P<0·05) of feeding. After 4 weeks, no difference in Zn concentration was observed (Fig. 1). Zn concentrations in MLN were surprisingly low compared with other tissues (jejunum, liver and pancreas)( Reference Zetzsche, Schunter and Zentek 17 ). The low total Zn concentration in MLN, as well as the marginal changes in this concentration after feeding high levels of zinc oxide, indicates that MLN tightly control intra-cellular Zn levels. However, as no differential expression of Zn transporters was detected, the mode of regulation remains elusive.
Investigation of time-dependent, Zn-associated effects on adaptive immune cells upon HZn feeding showed that short-term feeding (1 week) led to significantly higher numbers of activated T-helper cells (CD4+ and CD8α dim) (P<0·01). Molecular analysis revealed higher transcript amounts of IFNγ and TBET in the HZn group compared with the LZn group (P<0·05). TBET is the master transcription factor of T-helper 1 cells, whereas IFNγ is considered the main inducer of T-helper 1 cells( Reference Oestreich and Weinmann 31 ). Our work provides support for the hypothesis that the differentiation of naive T-helper cells towards T-helper 1 cells might be short-term inducible by high levels of dietary Zn. In addition, a tendency was detected showing a higher relative cell count of cytotoxic T-cells within the HZn group compared with the MZn group after 1 week (P<0·1, data not shown).
GSEA on differentially expressed genes between MZn and HZn groups showed an over-representation of genes belonging to the pathway ‘cytokine signalling in immune system’. This points towards an activation of the immune system after a 1-week feeding of zinc oxide.
To investigate this effect further, in vitro experiments can be used as a model to investigate direct effects of Zn on the immune cells. These in vitro experiments in which porcine MLN were treated with zinc acetate (Fig. 2), as well as zinc gluconate (online Supplementary Fig. S1), replicated the in vivo results: a tendency towards higher relative cell counts of activated T-helper cells and a higher transcript level of TBET. As we used zinc acetate, as well as zinc gluconate, within the in vitro assays and zinc oxide in the feeding experiment, this effect is very likely related to the Zn ion itself and not due to the specific oxide. Similar findings were reported by Barnett et al. ( Reference Barnett, Dao and Hamer 32 ) who showed that an increase in serum Zn concentrations was associated with an increase in the number of T-cells in elderly people supplemented with 30 mg Zn/d in the form of zinc gluconate.
After 2 weeks of feeding HZn diets, there seem to be a switch of the immune response from an immune activation towards suppression. Higher relative cell counts of immune-suppressive CD4+CD25high regulatory T-helper cells were detected in all five analysed GALT. This was accompanied with higher transcript amounts of the FOXP3 gene, the master transcription factor of regulatory T-helper cells in the HZn-group compared to the MZn-group. Regulatory T-helper cells have a suppressive function on the inflammatory immune response( Reference Miyao, Floess and Setoguchi 33 ) and are reported to be capable of suppressing proliferation and differentiation of effector T-cells( Reference Letourneau, Krieg and Pantaleo 34 ). As suggested by Pandiyan et al. ( Reference Pandiyan, Zheng and Ishihara 35 ), this could be owing to induced Bcl-2-like protein 11-mediated apoptosis of activated effector CD4+ T-cells through the uptake of IL-2. In line with previous result, our results showed a reduction in the relative CD4+ T-cell count and also a tendency towards reduced relative cell counts of cytotoxic T-cells after 4 weeks in the HZn group compared with the MZn group. This is probably owing to the higher levels of regulatory T-helper cells detected after 2 weeks of feeding an HZn diet.
Zn taken orally is considered to be relatively nontoxic. However, toxicity symptoms have been known to occur with high levels of Zn intake in humans( Reference Fosmire 36 ) (approximately 100–300 mg Zn/d) when Zn is taken for longer periods of time (>10 months)( Reference Murphy 37 ). Long-term Zn toxicity is often accompanied by a severe Cu deficiency (hypocupraemia); after cessation of the use of Zn supplements, the Cu levels often normalise( Reference Prasad, Brewer and Schoomaker 38 ). It is believed that the excess of Zn blocks the intestinal uptake of Cu, leading to hypocupraemia, until the excess of Zn is eliminated from the system. High levels of Zn intake (300 mg Zn/d) in humans for longer periods of time (6 weeks) have also shown to depress indices of immune function in healthy adults compared with baseline levels before supplementation( Reference Chandra 15 ). However, this effect was not seen in an elderly population exposed to lower levels of supplementation (100 mg Zn/d)( Reference Bogden, Oleske and Lavenhar 39 ).
In a previous study with a similar experimental setup, we observed after 6 weeks feeding of HZn levels (2500 mg Zn/kg as zinc oxide) a decreased relative cell count of CD2+T and natural killer cells, CD8ahigh cytotoxic T-cells and CD4+ T-helper cells in MLN comparable to the situation in the LZn feeding group( Reference Janczyk, Kreuzer and Assmus 13 ). This indicates a T-cell suppressive effect for both Zn deficiency and Zn excess. Interestingly, weight gain in the HZn group was only observed during the first week, but the weight gain was lower by the third week of the experiment compared with optimal- and low-level Zn diets( Reference Martin, Pieper and Schunter 23 ), suggesting an optimal feeding time of 2 weeks when feeding high levels of zinc oxide.
In summary, our research suggests that short-term feeding (1–2 weeks) of high levels of Zn at the critical time point of weaning has an immune-activating effect on the adaptive T-cell response and could provide an alternative to reduce the incidence of post-weaning diarrhoea in pig husbandry. However, our findings indicate that long-term feeding (2–4 weeks) of high levels of Zn seems to have an immune-suppressive effect in post-weaned piglets and as such could potentially negate the benefits of Zn supplements in post-weaned piglets.
Acknowledgements
The study was funded by the German Research Foundation (Deutsche Forschungsgemeinschaft, DFG) within the Collaborative Research Group (SFB, Sonderforschungsbereich) 852/1 ‘Nutrition and intestinal microbiota – host interactions in the pig’. The authors are solely responsible for the data and do not represent any opinion of neither the DFG nor other public or commercial entity.
S. K.-R., J. N. S. and D. K. performed the experiments; D. A., P. K. and S. K.-R. analysed the data; R. P., F. M. and V. G. contributed reagents/materials/analysis tools; J. Z. and G. A. B. conceived and designed the experiments and S. K.-R. and D. A. wrote the paper.
The authors declare no conflict of interest. The founding sponsors had no role in the design of the study; in the collection, analyses or interpretation of data; in the writing of the manuscript; and in the decision to publish the results.
Supplementary material
For supplementary material/s referred to in this article, please visit https://doi.org/10.1017/S0007114518002908


