


Introduction
Many of the most significant policy problems facing legislators today require costly interventions that only pay dividends far into the future (Jacobs, Reference Jacobs2016). However, recent research demonstrates that the public prefers policies that are expected to benefit society soon (Christensen & Rapeli, Reference Christensen and Rapeli2021; Jacobs & Matthews, Reference Jacobs and Matthews2012; Sparkman et al., Reference Sparkman, Lee and Macdonald2021). This sociotropic temporal discounting of policy outcomes may have important political consequences. Those more accepting of delayed gratification are more likely to participate in elections (Schafer, Reference Schafer2021) and protests (Wang, Reference Wang2019). Politicians prioritise short-term considerations if they believe citizens want them to (Sheffer et al., Reference Sheffer, Loewen and Lucas2023). And when voters do not prospectively reward investment in disaster preparedness, politicians under-invest, worsening the impact of future disasters (Healy & Malhotra, Reference Healy and Malhotra2009). It is, therefore, important to understand the structure and limits of temporal policy discounting.
In this research note, I assess the hypothesis that the finite length of the human lifespan structures temporal policy discounting: that people prefer policies whose societal benefits materialise in the near future because these are more likely to fall within their own lifetime. In a pre-registered conjoint analysis with age-group blocking in the United Kingdom (N = 2405), I find little support for this explanation. Instead, across and beyond the lifespan, the sooner a policy pays off, the better – but people care more about the scale of these societal benefits, whenever they occur.
Hypotheses
Recent research has established that, when making hypothetical sociotropic policy assessments, people prefer policy measures whose societal benefits are expected to materialise soon. Sparkman et al. (Reference Sparkman, Lee and Macdonald2021) find that policy payoff delays have a roughly linear, negative effect on Japanese citizens’ policy preferences, at least up to a span of 50 years. Similarly, Jacobs and Matthews (Reference Jacobs and Matthews2012) find that a reform expected to take effect in the next 5 years is significantly preferable to one expected to take effect in 40 years. Christensen and Rapeli (Reference Christensen and Rapeli2021) find that a policy expected to pay off within the next 0–2 years is significantly preferred over one expected to pay off in the next 20–30 years.
I hypothesise that there is a principled structure to such temporal policy discounting: people may prefer sooner policy payoffs because they are more likely to benefit society within their own lifetimes. There are theoretical and empirical reasons to consider this possibility.
First, the reason temporal discounting is a problem is that it promotes intergenerational inequity: future generations suffer the consequences of past generations’ (in)action (Markowitz & Shariff, Reference Markowitz and Shariff2012; Wade-Benzoni et al., Reference Wade‐Benzoni, Hernandez, Medvec and Messick2008). If an explanation for intergenerational inequity is to be found in public policy preferences, then the simplest such explanation would be that those policy preferences are themselves intergenerationally structured. Although members of a given citizen's generation will outlive that citizen, the lifespan represents a reasonable cut-off after which they no longer consider people to be part of their own generation, producing a preference for policies whose benefits materialise within their lifetime. Indeed, people feel little psychological connection to an imagined future self living beyond their life expectancy (Tausen et al., Reference Tausen, Csordas and Macrae2020). On this argument, it would be natural for an individual's policy preferences to shift discontinuously when those policies are expected to pay off after the end of that individual's life, as they no longer identify with the generation that benefits.
Second, strong evidence shows that older people are less supportive of pro-climate policy – the paradigmatic case of an intertemporal policy trade-off (Andor et al., Reference Andor, Schmidt and Sommer2018). A simple explanation for this finding is, as Jacobs and Matthews (Reference Jacobs and Matthews2012, p. 921) put it, that older individuals can expect a ‘shorter and lower-quality stream of future potential utility’ and should ‘have a stronger preference for the quicker delivery of benefits’. Yet, then, it is not age per se that reduces support for intertemporal policy trade-offs. Rather, what matters is whether people live to see the benefits of those trade-offs.
I propose a weak and a strong version of this idea. The weaker version (H1a) is simply that, all things considered, people prefer a policy that pays off within their lifetime. This much is an implication of the findings from existing work: people prefer policies that pay off sooner rather than later, and the period after the end of their life is later than the period before. The stronger version of this claim (H1b) requires that they especially respond to whether a policy pays off within their lifespan. H1b operationalises this as a discontinuous shift in preferences around the end of the lifespan. That is, policy preferences should be relatively strongly affected by whether the payoff of that policy is within, rather than beyond the lifespan, and relatively weakly affected by whether the payoff occurs sooner rather than later within or beyond the lifespan. In this case, people would prefer sooner payoffs over later ones because those later payoffs increasingly fall after the end of their lifespan. Figure 1 visualises these two hypotheses.
Visualisation of hypotheses. H1a: people prefer policies that pay off at some T1 – a date expected to fall within their lifetime – over policies that pay off at some T2 – a date expected to fall after the end of their lifetime. Hypothesis captured by β1. H1b: people's preference for policies that pay off at some T1 over those that pay off at some T2 is larger than their preference for policies that pay off at some T2 over policies that pay off at some T3 – a date expected to fall far beyond the end of their lifetime. Hypothesis captured by difference between β1 and β2.
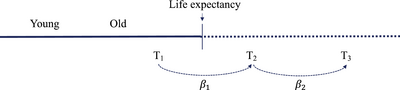
H1a: People prefer policies that will pay off within their own lifetime over those that will pay off after the end of their lives.
H1b: The decrease in people's preferences for a policy when it will pay off after the end of their lives, as opposed to within their lifetime, is larger than for any other delay in payoff date.Footnote 1
In past research, this possibility has been relegated to a version of the association mentioned above between age and temporal discounting. In experimental research on temporal discounting, scholars have found that age does not moderate the experimental effect of policy payoff delays on preferences (Christensen & Rapeli, Reference Christensen and Rapeli2021; Jacobs & Matthews, Reference Jacobs and Matthews2012). Age also has little association with non-political temporal discounting (Löckenhoff & Samanez-Larkin, Reference Löckenhoff and Samanez‐Larkin2020; Seaman et al., Reference Seaman, Abiodun, Fenn, Samanez‐Larkin and Mata2022). However, these results do not rule out the possibility that people especially prefer policies that pay off within their own lifetimes – a preference young and old people alike might hold. Instead, these approaches essentially confound any effect of the lifespan with the effect of aging. To assess my hypotheses directly, it is necessary to observe both younger and older people making trade-offs between policies that pay off before and after the end of their lives.
Certain types of individuals may also be more prone to this kind of lifespan-structured policy discounting. For example, temporal policy discounting is essentially a matter of ‘impartial beneficence’ – ‘concern for the well-being of everyone, whether near or far’ (Kahane et al., Reference Kahane, Everett, Earp, Caviola, Faber, Crockett and Savulescu2018). This utilitarian principle should incline people to see the scale of policy benefits as overwhelmingly more important than when they occur. They should disregard whether societal benefits are felt by temporally or spatially proximate people, in favour of a long-term ‘greater good’ (Kahane et al., Reference Kahane, Everett, Earp, Caviola, Faber, Crockett and Savulescu2018).
H2a: The policy preferences of those who more strongly endorse impartial beneficence vary less by whether a policy pays off before or after the end of their life, compared to those who do not endorse impartial beneficence.Footnote 2
Individuals also differ in their general propensity to think about the future (Shipp & Aeon, Reference Shipp and Aeon2019). Those who characteristically place more psychological emphasis on the future are likely to perceive future policy payoffs as more worthwhile. Indeed, individuals with longer term psychological time horizons are more likely to engage in behaviours with long-term organisational (Joireman et al., Reference Joireman, Kamdar, Daniels and Duell2006) and environmental benefits (Milfont et al., Reference Milfont, Wilson and Diniz2012). Accordingly, those who focus more on the future may be more willing to accept delayed policy payoffs.
H2b: The policy preferences of those who characteristically focus more on the future vary less by whether a policy pays off before or after the end of their life, compared to those who focus more on the past.
Finally, political differences could affect rates of policy discounting. Individuals with more left-wing political beliefs tend to be more supportive of the kinds of policies that involve intertemporal trade-offs, such as climate change mitigation (Knollenborg & Sommer, Reference Knollenborg and Sommer2023; Tobler et al., Reference Tobler, Visschers and Siegrist2012; Zhao et al., Reference Zhao, Leiserowitz, Maibach and Roser‐Renouf2011). Such measures can be seen as involving equitable redistribution of resources and welfare over time, demonstrating a clear overlap between left-wing political priorities and low rates of temporal discounting (Cowen, Reference Cowen2004). Therefore, left-wing support might incline people towards endorsing policies whose benefits they will never live to see.
H2c: The policy preferences of those with more left-wing attitudes are less strongly affected by whether a policy pays off before or after the end of their life, compared to those with more right-wing attitudes.
Methods
Sample
To assess these hypotheses, I conducted a pre-registered conjoint experiment via Prolific, in the United Kingdom, on 17 April 2023.Footnote 3 This panel provider is increasingly used for research in political psychology (e.g. Greenaway, Reference Greenaway2023). My choice of the United Kingdom as the context for the experiment reflects two considerations: Prolific has a large pool of respondents in the United Kingdom, and no prior experimental work on policy discounting has been conducted in the United Kingdom. As well as shedding new light on the potential lifespan structure of policy discounting, the findings of this study therefore also provide valuable insight into whether the temporal discounting observed in the USA (Jacobs & Matthews, Reference Jacobs and Matthews2012), Japan (Sparkman et al., Reference Sparkman, Lee and Macdonald2021) and Finland (Christensen & Rapeli, Reference Christensen and Rapeli2021) also occurs in another important political context.
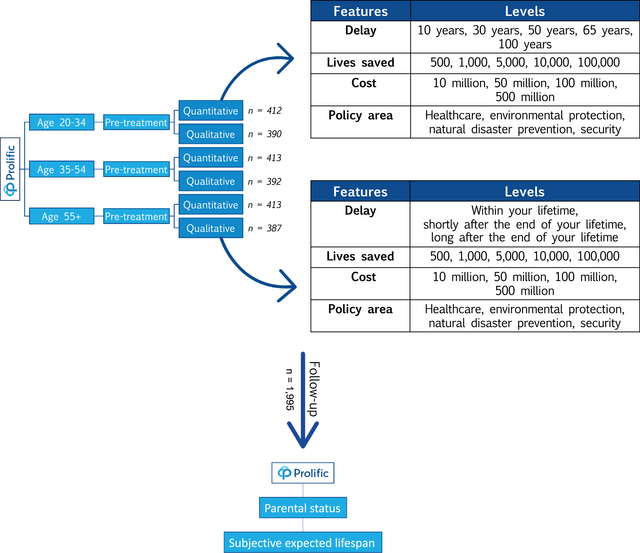
The online survey was fielded to three independent samples of approximately 800 respondents, using Prolific pre-screening criteria.Footnote 4 The first sample contained only respondents aged 20–34 (802), the second aged 35–54 (803), and the third 55 and over (800).Footnote 5 As the online Supporting Information shows, the sample contains similar proportions of men and women, and of different ethnic groups, to the wider population. I paid participants £0.75 for completing a survey of an estimated 5 minute length. The study received full ethical approval from the University of Essex Sub-Committee 3 (ETH2223-0950).
Experimental procedure
The conjoint experiment closely mimics the design used by Sparkman et al. (Reference Sparkman, Lee and Macdonald2021), with modifications. Respondents are presented with a series of choices between two hypothetical policy proposals ‘focused on saving lives’, and asked which policy they would choose if they had the choice. I approximately replicate Sparkman et al. (Reference Sparkman, Lee and Macdonald2021) because their study provided clear evidence of temporal discounting. Holding constant the experimental design across studies rules out that any absence of an effect is due to other design quirks, compared to past work.
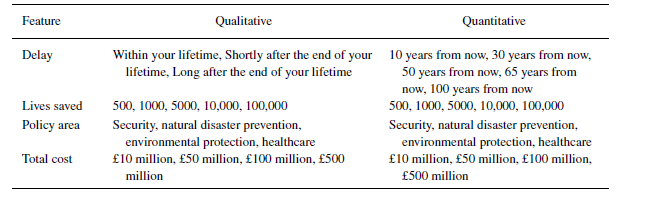
The policies randomly vary across the four features presented in Table 1. I randomise the total cost of the policy (£10 million, £50 million, £100 million, £500 million). I assign each a ‘policy area’ (security, natural disaster prevention, environmental protection, healthcare). As in Sparkman et al. (Reference Sparkman, Lee and Macdonald2021), the benefit of the policy was to ‘save lives’, with the size of the payoff being the total number of lives the policy is expected to save (500, 1000, 5000, 10,000, 100,000).Footnote 6 Respondents completed eight tasks.

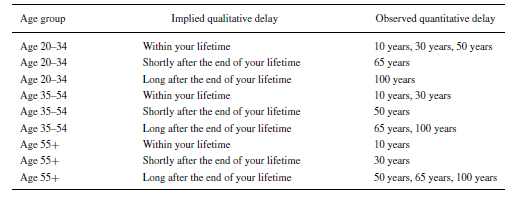
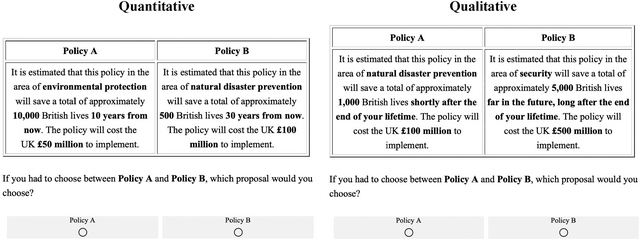
There are two versions of the experiment: quantitative and qualitative. In each version, respectively, the ‘delay’ feature of the conjoint profiles varies to show either a number of years before the policy is expected to pay off, or a statement of whether the benefits are expected within, beyond, or far beyond respondents’ own lifetimes. The quantitative version of the experiment assesses the effect of policy delays when respondents are left to infer naturally whether they will be alive to see those benefits, which may limit the size of the effect. The qualitative version assesses policy preferences when respondents’ attention is deliberately drawn to whether they will live to see the benefits. The specific levels of the delay features are chosen such that every respondent has the possibility of assessing policies that will pay off during, after, or well beyond their lifetime. This makes it possible to isolate whether the end of the lifespan marks an especially significant temporal threshold for citizens in evaluating policy. In the quantitative version, this is achieved by assuming an expected lifespan of approximately 75–85 years and matching respondents’ age groups to the delay periods, following the pre-registered schema in Table 2.Footnote 7
Rather than presenting the conjoint profile as a tabulated list of features, each was described in a short paragraph. Examples can be seen in Figure 2. The descriptions of the policies are kept quite abstract reflecting recent advice from Brutger et al. (Reference Brutger, Kertzer, Renshon, Tingley and Weiss2023), who show that abstract experimental designs are suitable for initially assessing the plausibility of hypotheses, before proceeding to a more in-depth and contextually rich study of those effects.
Example conjoint tasks.

Figure 3 summarises the randomisation procedure in the survey experiment. Within each age group sample, respondents were randomly split into two groups, each participating in one of the two possible versions of the conjoint experiment after answering pre-treatment questions on temporal focus, impartial beneficence, and political ideology (for wording and coding of all measures, see the Supporting Information). Block randomisation within evenly sampled age groups facilitates robust and powerful estimation of the effects of conjoint features within each age group, allowing me to estimate temporal discounting across and beyond the lifespan. Splitting respondents into three age groups also allows for the possibility of non-linear effects across the life cycle (see, e.g., Aspide et al., Reference Aspide, Brown, DiGiuseppe and Slaski2023), or of variation in effects across different generations owing, for example, to unique political socialisation.
Process flow of survey experiment.

Follow-up survey
Feedback on the original study noted two aspects overlooked in the original design. First, preferences over policy payoff delays may depend on people's own subjective life expectancy – how long they themselves expect to live – which may vary from the implicit lifespan assumed in the quantitative conjoint (Bago D'Uva et al., Reference Bago D'uva, O'donnell and Van Doorslaer2020). Second, parents might be less likely to discount policies that pay off after the end of their own lives because they assume that their children will benefit from those policies. Accordingly, respondents were later recontacted via Prolific to complete a short follow-up survey, 18–24 July 2023. I received complete responses from 1995 respondents of the total of 2405 who originally participated – approximately 83 per cent. I paid these participants £0.10 for completing a survey with a median completion time of 22 seconds. This survey asked participants whether they had any children and grandchildren, and how long they estimated they would continue to live. These items are used in the Supporting Information for exploratory analyses assessing whether parents have different discounting preferences and whether the effect of the end of the lifespan emerges when operationalising it in terms of respondents’ own subjective expected lifespans. This follow-up survey received full ethical approval from the University of Essex Sub-Committee 3 (ETH2223-1501).
Analytical approach
In the results below, I estimate and present marginal means (MMs) from these models, as they have a direct correspondence to my hypotheses. MMs represent the average probability that a conjoint profile is selected from a pair if it contains a given feature level, without relying on a comparison with a fixed reference category (Leeper et al., Reference Leeper, Hobolt and Tilley2019). This parameter is naturally interpreted as a measure of respondents’ preferences for a feature level, corresponding directly to H1a. I display the confidence intervals for all MMs in the figures, but for brevity – and because these intervals are invariably very narrow – I only mention the point estimate within the text. I also note the average marginal component effect (AMCE – again without confidence intervals) corresponding to every statistically significant difference between MMs that is mentioned, setting the reference category flexibly for these calculations. This is particularly relevant when assessing H1b, which requires comparisons between the effects of adjacent categories. In the Supporting Information, I supplement these analyses with the results of Bayesian monotonic effects models (Bürkner & Charpentier, Reference Bürkner and Charpentier2020).
Results
H1: Temporal discounting across and beyond the lifespan
Figure 4 presents the MMs of all feature levels across the qualitative and quantitative conjoints. The results reveal three main patterns. First, respondents prefer policies that cost less. Second, and most clearly, they prefer policies that save more lives. Third, and most relevantly, they prefer policies that pay off sooner rather than later.
MMs from conjoint experiments. Horizontal bars represent 95 per cent confidence intervals. The left panel displays MMs from qualitative conjoint, and the right panel displays MMs from quantitative conjoint among each age subgroup.
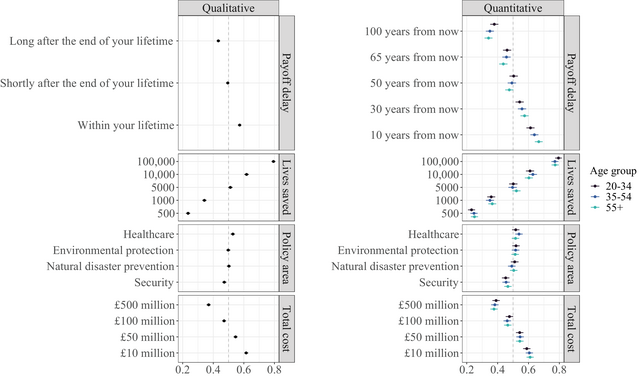
Looking first at the qualitative conjoint, the MMs indicate that a policy with benefits paying off within respondents’ lifetimes is significantly preferred over one that pays off shortly after the end of their life ( $AMCE = $ −0.08) and more so to one that pays off long after (AMCE = −0.14). Similarly, in the quantitative conjoint, across all age groups, preferences decrease as the policy pays off further into the future. For example, for the oldest respondents, a policy that pays off within 10 years is significantly more likely to be chosen than one with a 50-year payoff delay (AMCE = −0.19), and even more so than a policy with a 100-year payoff (AMCE = −0.32). As I show in the Supporting Information, when recoding the quantitative data following Table 2 and merging the resulting responses with the qualitative data, the pattern remains very similar. These results provide clear support to H1a. All else being equal, people prefer policies that pay off sooner, and therefore within their lifetimes, rather than later.
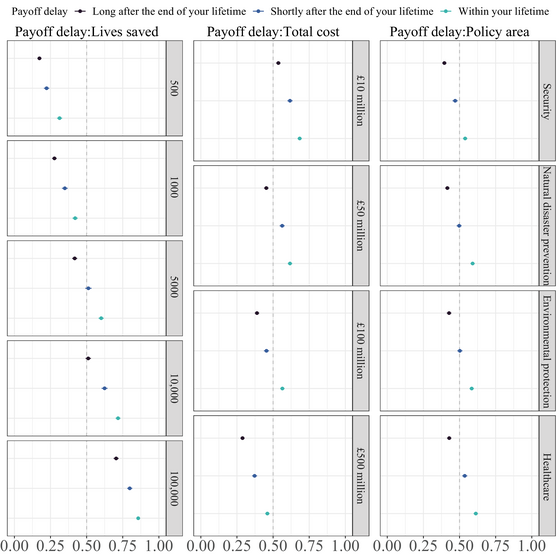
Figure 5 plots the MMs of each payoff delay conditional on other policy features. In general, when considered in tandem, the number of lives the policy will save – and to a lesser degree the cost of the policy – tends to overwhelm the timing of the payoff. People much prefer policies that save 100,000 lives far in the future to those that save only 500 lives within their lifetime. On this evidence, people are willing to make intertemporal trade-offs. At a given payoff size or cost, people prefer policies that take effect sooner rather than later, but they prefer later, bigger payoffs at lower costs to sooner, smaller payoffs at higher costs.
Conditional MMs from conjoint experiments, based on average component interaction effects. Horizontal bars represent 95 per cent confidence intervals.

But do citizens especially prefer policies that pay off within their lifetimes? The evidence presented in Figure 4 suggests not. The MMs suggest that the probability of selecting a policy that pays off shortly after the end of the respondent's life is approximately 50 per cent. It is only when the policy pays off even further into the future that it becomes more likely than not that respondents will reject the policy. Relative to a policy that pays off shortly after their lifetime, respondents are significantly less disposed to choose one that pays off longer after. Figure 5 also reinforces this finding, showing that the same pattern characterises preferences at any given number of lives saved, policy cost or policy area. People much prefer a policy that will take effect shortly after their life is over than many years further into the future, even if that policy will save 100,000 lives, or will only cost £10 million to implement.
Correspondingly, in the quantitative conjoint, there is little sign that preferences for policies with different payoff delays vary across age groups. If respondents were paying especial attention to whether a policy looks like it will pay off within their likely lifespan, then, according to the schema in Table 2, we would expect the largest difference in policy preference for 20–34-year-olds to occur between the 50-year and 65-year payoffs; for 35–54-year-olds, between the 30-year and 50-year payoffs; and for over 55–year-olds, between the 10-year and 30-year payoffs. Moreover, the differences between preferences for two different payoffs that both fall within the lifespan, or for different payoffs that both fall beyond the lifespan, would be relatively small. But this is not at all how respondents behave. Among 20–34-year-olds, there is relatively little difference between the MM of a 50-year payoff and that of a 65-year payoff (AMCE = −0.04), and the difference between the MMs of a 65-year payoff and a 100-year payoff is larger than between any two other levels (AMCE = −0.12). Among 35–54-year-olds, similarly, the difference between the MM of a 30-year and of a 50-year payoff is not especially large (AMCE = −0.07), while the MM of a 100-year payoff is much lower than that of a 65-year payoff, even though both fall beyond their expected lifespan (AMCE = −0.10). The same is true of over 55-year-olds, who significantly prefer a 65-year payoff to a 100-year payoff (AMCE = 0.08) and also significantly prefer a 30-year payoff to a 50-year payoff (AMCE = 0.09). Both effects are very similar in size to their preference for a 10-year rather than 30-year payoff (AMCE = 0.10).
These findings provide little support to H1b: although citizens prefer sooner policy payoffs over later policy payoffs, that is not because the sooner policy payoffs are more likely to occur within their own lifetimes. Whether a policy pays off within or beyond the lifespan does not dominate temporal discounting. In the Supporting Information, I present the results of Bayesian monotonic effects models which reinforce this finding. There I also show that substantively similar patterns to those described above hold in exploratory analyses operationalising respondents’ lifespans in terms of their subjective life expectancy.
H2: Individual differences
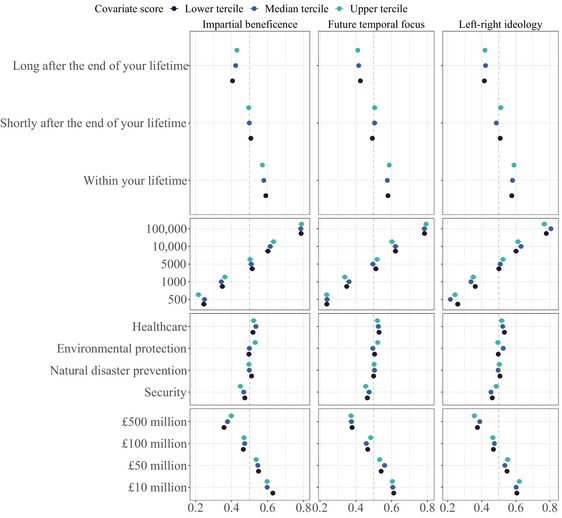
However, this null finding could mask heterogeneity across groups. To investigate this possibility, Figure 6 presents MMs across levels of pre-registered covariates, using the merged quantitative and qualitative data.Footnote 8 Across these covariates, preferences for policies paying off within, after, and long after the lifespan are very consistent. Those low in impartial beneficence have around a 0.59 probability of choosing a policy that pays off within their lifetime, around a 0.51 probability of choosing one that pays off shortly after and around a 0.41 probability of choosing one that pays off long after. MMs of payoff delays are similarly unchanged by levels of future temporal focus and by left-right ideology. Crucially, for all levels of every covariate, policies paying off shortly after the end of the lifespan are evaluated significantly worse than those paying off within the lifespan, and those paying off long after the end of the lifespan are evaluated significantly worse still. There is, therefore, little support for H2a, H2b and H2c. In the Supporting Information, I also show that this pattern is consistent for parents and non-parents.
MMs by covariate subgroup. Points represent the probability that a policy is chosen when it has a given feature level, amongst a given covariate tercile group. Horizontal bars represent 95 per cent confidence intervals.

Discussion
In principle, people prefer policies whose benefits they will live to see, but they also much prefer policies that will pay off shortly after the end of their lives over those that will pay off in the more distant future. They are willing to accept policies with a bigger societal impact even if they will never live to see that impact, but they would rather those benefits – big or small – come shortly after the end of their lives than much later. So it is not simply because delayed policy payoffs are more likely to occur after the end of our lives that we prefer sooner payoffs. Rather, within and beyond the lifespan – and across philosophical, psychological, political and personal differences – preferences for policy payoffs are simple: the sooner the better. But also, even when more impactful policies pay off much further into the future than less impactful policies, the bigger the better.
My findings contribute to the literature on temporal policy discounting in three ways. First, people continue to discount policy benefits long beyond the 30–50-year time horizons that researchers have considered to date, in a context that researchers have not considered to date (Christensen & Rapeli, Reference Christensen and Rapeli2021; Jacobs & Matthews, Reference Jacobs and Matthews2012; Sparkman et al., Reference Sparkman, Lee and Macdonald2021). In the United Kingdom, temporal discounting shows no sign of plateauing within a 100-year span. The scope of temporal discounting may be broader than previously thought. The second contribution is to rule out an explanation for this phenomenon. Citizens appear not to prefer nearer term payoffs just because they assume those payoffs are more likely to occur within their own lifetimes. So, in line with past work, it seems that temporal policy discounting is not a simple matter of selfish preferences or personal impatience (Jacobs & Matthews, Reference Jacobs and Matthews2012). Instead, scholars might be right to argue that it is mostly the uncertainty inherent in long-term policy promises that puts people off (Jacobs & Matthews, Reference Jacobs and Matthews2012). Uncertainty around whether policies will produce their promised benefits, and whether future politicians will be accountable to those promises, increases with time, regardless of when any given individual's life ends within that time span. The third contribution is, relatedly, to cast doubt on a number of potential individual differences underpinning temporal discounting. It is unlikely to be because they lack impartial beneficence, think insufficiently about the future, or are right wing that people engage in temporal discounting across and beyond the lifespan – utilitarian, future-orientated, left-wing people do it too. So do parents, despite their investment in the well-being of the next generation.
In future work, scholars should address some of the limitations of the present study. First, the abstract style in which the policies are communicated may fail to invoke the hypothesised lifespan effect. The lifespan effect might emerge when policies are communicated in a way that more strongly primes this aspect or related ideological factors, including those not captured by the simple left-right dimension – as a politician opposing a long-term policy intervention might do when convincing others to reject it. Future research could present policies in a more naturalistic form that deliberately primes relevant ideological concerns. Second and related, the lifespan might also come into play more in assessments of different kinds of policies. For example, the lifespan might be more relevant in cases where the timing of the societal benefits is more predictable than in those, such as natural disaster prevention, where the delay could easily be much shorter or longer than expected. Similarly, the lifespan could shape discounting much more in egotropic policy assessments when people weigh up policies that are likely to affect them directly. Future research could therefore benefit from a specific focus on particular policy problems and measures, rather than vague policy areas, tailoring the theoretical approach outlined in this paper to these particular issues. Third, my findings are limited to the United Kingdom. People may assess long-term policy interventions differently in contexts where life expectancy is lower (e.g. Bulgaria) or higher (e.g. Spain) than in the United Kingdom, or where they are more accustomed to having a direct say in policy decisions (e.g. Switzerland), or where long-term sustainability is a more well-established political concern (e.g. Germany). Future experimental work should therefore continue to expand the range of cases where temporal discounting has been observed by addressing different political contexts.
Acknowledgements
The author would like to thank Stefanie Reher, Lior Sheffer, Joseph Phillips, Alejandro Fernández-Roldán Díaz, Peter Allen and Rob Johns for valuable feedback on this project. He also thanks the editor and three anonymous reviewers for their generous engagement with the paper. The study was supported by an ESRC Postdoctoral Fellowship (ES/X007367/1) and a British Academy Postdoctoral Fellowship (PFSS23∖230040).
Conflict of interest statement
The author has no conflicts of interest to disclose.
Data availability statement
The data analysed in this study is available on OSF, along with code to reproduce all analyses: https://osf.io/rge8v/.
Ethics approval statement
The data collection in this study received ethical approval from the University of Essex Sub-Committee 3 (ETH2223-0950 and ETH2223-1501).
Online Appendix
Additional supporting information may be found in the Online Appendix section at the end of the article:


 Open access