


INTRODUCTION
Mediterranean Quaternary marine terraces have been the subject of research since the early years of the last century. Following a simplified scheme of a sea-level change cycle, each of these marine terraces is a gently seaward-dipping, wave-cut erosional surface developed on the substratum during transgression, and often covered by a veneer of shallow marine deposits during sea-level highstands. Typically, the terrace forms during a single sea-level highstand and provides insights to better understand the interaction between sea-level fluctuations and regional tectonic activity (Anderson et al., Reference Anderson, Densmore and Ellis1999; Zecchin et al., Reference Zecchin, Nalin and Roda2004, Reference Zecchin, Civile, Caffau, Sturiale and Roda2011; Muhs et al., Reference Muhs, Simmons, Schumann and Halley2011; Gurrola et al., Reference Gurrola, Keller, Chen, Owen and Spencer2014; Pedoja et al., Reference Pedoja, Husson, Johnson, Melnick, Witt, Pochat and Nexer2014; Ferranti et al., Reference Ferranti, Burrato, Sechi, Andreucci, Pepe and Pascucci2021). Under a combination of sea-level changes and low uplift rate, successive transgression-regression cycles could result in shallow-marine sediments reoccupying the same stratigraphic position over the same marine erosional surface (Cantalamessa and Di Celma, Reference Cantalamessa and Di Celma2004). Consequently, successive shallow marine deposits could be superimposed and separated by a composite surface (Leonard and Wehmiller, Reference Leonard and Wehmiller1992; Carobene and Ferrini, Reference Carobene and Ferrini1993; Ortlieb et al., Reference Ortlieb, Zazo, Goy, Dabrio and Macharé1996; Cantalamessa and Di Celma, Reference Cantalamessa and Di Celma2004; Lucchi, Reference Lucchi2009), resulting from multiple phases of erosion and deposition associated with different sea-level fluctuations. The younger transgressive wave ravinement surfaces (WRS) (sensu Zecchin et al., Reference Zecchin, Catuneanu and Caffau2019, and reference therein) may obliterate or rework older subaerial and/or transgressive deposits of the previous cycle hosted by the terrace (Cantalamessa and Di Celma, Reference Cantalamessa and Di Celma2004).
Because of the composite nature of the surface, the marine terrace is the result of multiple transgressive-regressive cycles (T-R) (Nalin et al., Reference Nalin, Massari and Zecchin2007, Reference Nalin, Lamothe, Auclair and Massari2020; Lucchi, Reference Lucchi2009; Zecchin et al., Reference Zecchin, Civile, Caffau, Sturiale and Roda2011). Recognizing the composite nature of the marine terraces along the coast of areas considered “almost tectonically stable” may reveal: (1) different sea-level fluctuations, and (2) the interaction between sea-level changes and local tectonic activity.
The Mediterranean coasts preserve many sedimentary and geomorphological features correlated to the last interglacial period (LIG, MIS 5e), (127–117 ka) (Lisiecki and Raymo, Reference Lisiecki and Raymo2005; Railsback et al., Reference Railsback, Gibbard, Head, Voarintsoa and Toucanne2015). The MIS 5e sea-level markers (e.g., marine terrace and marine sedimentary covers for areas considered tectonically stable or affected by mild tectonic activity), have received particular attention in order to reconstruct past sea-level fluctuations and evaluate long-term tectonic rates along the coasts of the Mediterranean (Pedoja et al., Reference Pedoja, Husson, Johnson, Melnick, Witt, Pochat and Nexer2014; Rovere et al., Reference Rovere, Raymo, Vacchi, Lorscheid, Stocchi, Gómez-Pujol, Harris, Casella, O'Leary and Hearty2016; Benjamin et al., Reference Benjamin, Rovere, Fontana, Furlani, Vacchi, Inglis and Galili2017; Stocchi et al., Reference Stocchi, Vacchi, Lorscheid, de Boer, Simms, van de Wal, Vermeersen, Pappalardo and Rovere2018). MIS 5e represents one of the substages within the MIS 5 stage (ca. 128–73 ka) during which the mean sea-level was 5–9 m higher than present (Kopp et al., Reference Kopp, Simons, Mitrovica, Maloof and Oppenheimer2009; Dutton and Lambeck, Reference Dutton and Lambeck2012; Dutton et al., Reference Dutton, Carlson, Long, Milne, Clark, DeConto, Horton, Rahmstorf and Raymo2015). Within MIS 5, there are two other interstadials when sea-level reached a relative highstand—MIS 5c (ca. 100 ka) and MIS 5a (ca. 80 ka). These, however, had sea-level peaks lower than MIS 5e, and ~20 m below the present. A recent global compilation of field data with different glacio-isostatic adjustment (GIA) calculations placed the sea level during MIS 5c and MIS 5a in a range between −24 ± 2 m and −22 ± 1 m, respectively (Creveling et al., Reference Creveling, Mitrovica, Clark, Waelbroeck and Pico2017).
The Island of Sardinia is located in the center of the western Mediterranean. It hosts well-exposed MIS 5e coastal deposits (Pascucci et al., Reference Pascucci, Sechi and Andreucci2014; Sechi et al., Reference Sechi, Andreucci, Stevens and Pascucci2020), and it is generally considered tectonically stable (Antonioli et al., Reference Antonioli, Ferranti and Kershaw2006; Ferranti et al., Reference Ferranti, Antonioli, Mauz, Amorosi, Dai Pra, Mastronuzzi and Monaco2006; Rovere et al., Reference Rovere, Raymo, Vacchi, Lorscheid, Stocchi, Gómez-Pujol, Harris, Casella, O'Leary and Hearty2016; Vacchi et al., Reference Vacchi, Marriner, Morhange, Spada, Fontana and Rovere2016), evinced by low-intensity seismicity (Rovida et al., Reference Rovida, Locati, Camassi, Lolli and Gasperini2020; Gorshkov et al., Reference Gorshkov, Panza, Soloviev and Brandmayr2021). The marine sequence of Cala Mosca (southwest Sardinia, Italy) is one of the well-known MIS 5e marker sites and has been considered the Tyrrhenian locus typicus since the beginning of the last century (Cerrone et al., Reference Cerrone, Vacchi, Fontana and Rovere2021). Since then, it has been used as a proxy to calibrate the Pleistocene sea-level curve and to support the tectonic stability of Sardinia (Lambeck et al., Reference Lambeck, Antonioli, Purcell and Silenzi2004; Antonioli et al., Reference Antonioli, Ferranti and Kershaw2006, Reference Antonioli, Anzidei, Lambeck, Auriemma, Gaddi, Furlani and Orrù2007, Reference Antonioli, Anzidei, Amorosi, Presti, Mastronuzzi, Deiana and Falco2017; Rovere et al., Reference Rovere, Raymo, Vacchi, Lorscheid, Stocchi, Gómez-Pujol, Harris, Casella, O'Leary and Hearty2016). However, generalized aseismic vertical motions along the island have been reported and validated by GPS measurements, relief inversion, and deep river incision (Buttau et al., Reference Buttau, Fanelli, Funedda, Ibba, Loi and Pillola2011; Serpelloni et al., Reference Serpelloni, Faccenna, Spada, Dong and Williams2013; Antonioli et al., Reference Antonioli, Anzidei, Amorosi, Presti, Mastronuzzi, Deiana and Falco2017; Quye-Sawyer et al., Reference Quye-Sawyer, Whittaker and Roberts2020). In addition, deformation of MIS 5e tidal notches (Mariani et al., Reference Mariani, Braitenberg and Antonioli2009) and offsetting of Middle to Upper Pleistocene shallow marine deposits by normal faulting have been reported recently (Cocco et al., Reference Cocco, Andreucci, Sechi, Cossu and Funedda2019; Casini et al., Reference Casini, Andreucci, Sechi, Huang, Shen and Pascucci2020). Furthermore, the pioneering stratigraphic study of Ulzega and Hearty (Reference Ulzega and Hearty1986) described the presence of a thin carbonate crust and patchy thin soil layer separating two possible superimposed marine sedimentary units in the Cala Mosca marine succession. These are both observed to lie above the present sea level and interpreted to be formed due to a double sea level fluctuation within MIS 5e (Hearty, Reference Hearty1986; Hearty et al., Reference Hearty, Hollin, Neumann, O'Leary, McCulloch, O'Leary and McCulloch2007). This interpretation is similar to that observed in other semi-stable areas of the Mediterranean region (Cerrone et al., Reference Cerrone, Vacchi, Fontana and Rovere2021, and references therein).
Millennial-scale oscillations of sea level within the MIS 5e substage have remained controversial due to perceived issues with chronological and dating methods (Pasquetti et al., Reference Pasquetti, Bini, Giaccio, Ratti, Vacchi and Zanchetta2021). By contrast, several other studies have attributed these highstands to MIS 5c and MIS 5a substages (Kindler et al., Reference Kindler, Davaud and Strasser1997; Andreucci et al., Reference Andreucci, Pascucci, Murray and Clemmensen2009, Reference Andreucci, Clemmensen and Pascucci2010b; Sechi et al., Reference Sechi, Andreucci and Pascucci2013, Reference Sechi, Andreucci and Pascucci2018b, Reference Sechi, Andreucci, Stevens and Pascucci2020; Coltorti et al., Reference Coltorti, Pieruccini, Montagna and Zorzi2015; Mauz et al., Reference Mauz, Shen, Elmejdoub and Spada2018). The precise chronological constraint of sea-level markers is therefore important. U/Th and amino acid racemization (AAR) ages obtained on Cladocora caespitosa corals and marine shells assigned the marine sequence of Cala Mosca to MIS 5e (139 ± 10 ka, 138 ± 8 ka, and 122 ± 5 ka) (Hearty, Reference Hearty1986; Ulzega and Hearty, Reference Ulzega and Hearty1986; Belluomini and Delitala, Reference Belluomini and Delitala1988; Coltorti et al., Reference Coltorti, Barca and Melis2007). However, Pasquetti et al. (Reference Pasquetti, Bini, Giaccio, Ratti, Vacchi and Zanchetta2021) recently re-examined the U/Th ages of Cala Mosca, arguing that these ages might not be reliable due to geochemical issues and, therefore, the attribution of these markers to MIS 5e. Luminescence is an alternative dating method that can be applied to shallow marine siliciclastic deposits and has been applied successfully in various coastal areas of the Mediterranean region and Sardinia (Mauz, Reference Mauz1999; Andreucci et al., Reference Andreucci, Pascucci, Murray and Clemmensen2009, Reference Andreucci, Clemmensen, Murray and Pascucci2010a, Reference Andreucci, Bateman, Zucca, Kapur, Akşit, Dunajko and Pascucci2012; Fornós et al., Reference Fornós, Clemmensen, Gómez-Pujol and Murray2009; Thiel et al., Reference Thiel, Coltorti, Tsukamoto and Frechen2010; Mauz et al., Reference Mauz, Fanelli, Elmejdoub and Barbieri2012, Reference Mauz, Shen, Elmejdoub and Spada2018; Zucca et al., Reference Zucca, Sechi, Andreucci, Shaddad, Deroma, Madrau, Previtali, Pascucci and Kapur2014b; Sechi et al., Reference Sechi, Andreucci, De Giudici and Pascucci2018a, Reference Sechi, Andreucci, Stevens and Pascucci2020; Cocco et al., Reference Cocco, Andreucci, Sechi, Cossu and Funedda2019; Casini et al., Reference Casini, Andreucci, Sechi, Huang, Shen and Pascucci2020; Ferranti et al., Reference Ferranti, Burrato, Sechi, Andreucci, Pepe and Pascucci2021).
The aims of this paper are: (1) to review the stratigraphic meaning of the section cropping out at Cala Mosca, and (2) to perform new chronometric dating of this section using luminescence methods, and thereby to tentatively determine the interaction between sea-level changes and local tectonic activity.
GEOLOGICAL SETTING AND STUDY AREA
The Corsica-Sardinia block is located in the western Mediterranean basin. It represents a segment of the south-European plate that was detached with an anticlockwise rotation to the present position after opening of the Liguro-Provençal Basin (LPB) during the Oligocene–Early Miocene (Fig. 1a) (Carminati et al., Reference Carminati, Lustrino and Doglioni2012). The Sardinia block consists of a Variscan crystalline basement and Permian, Mesozoic, and Cenozoic volcano-sedimentary covers (Carmignani et al., Reference Carmignani, Oggiano, Funedda, Conti and Pasci2016; Andreucci et al., Reference Andreucci, Pistis, Funedda and Loi2017a) (Fig. 1b). During the Cenozoic, tectonic evolution related to Northern Apennine dynamics led to the formation of several basins bounded by a series of normal and strike-slip faults with several orientations, usually inherited from Variscan anisotropies (Oggiano et al., Reference Oggiano, Funedda, Carmignani and Pasci2009). The southern sector of the island is dominated by the NW-SE oriented Campidano graben (Fig. 1b). The graben developed during multiple tectonic phases as a consequence of (1) transtensional tectonics related to the Northern Apennines collision in the Oligo-Aquitanian, (2) extensional tectonics due to the opening of the Balearic basin in the Burdigalian–Langhian, and (3) further extensional tectonics due to the opening of the southern Tyrrhenian back-arc basin during Plio-Pleistocene (Fig. 1a) (Casula et al., Reference Casula, Cherchi, Montadert, Murru and Sarria2001; Faccenna et al., Reference Faccenna, Speranza, Caracciolo, Mattei and Oggiano2002; Cocco et al., Reference Cocco, Funedda, Patacca and Scandone2012, Reference Cocco, Funedda, Patacca and Scandone2013). Despite the graben being considered almost tectonically stable and subjected to a post-rift stage since the Middle Pleistocene (post 700 ka); Casula et al. (Reference Casula, Cherchi, Montadert, Murru and Sarria2001) and Cocco et al. (Reference Cocco, Andreucci, Sechi, Cossu and Funedda2019) reported that the northwestern side was offset by vertical tectonic movements during the last 100 ka.
(a) Location map of the Corsica-Sardinia block: Algero-Provençal basin (APB) and Tyrrhenian basin in the western Mediterranean Sea. (b) Geological sketch-map of central-southern Sardinia (modified after Carmignani et al., Reference Carmignani, Oggiano, Funedda, Conti and Pasci2016). Peri-Tyrrhenian Geodetic Array (PTGA) velocity field is from Ferranti et al. (Reference Ferranti, Oldow, D'Argenio, Catalano, Lewis, Marsella, Avellone, Maschio, Pappone, Pepe and Sulli2008); locations and magnitudes of seismic events are from Rovida et al. (Reference Rovida, Locati, Camassi, Lolli and Gasperini2020); absolute vertical land motion is from Serpelloni et al. (Reference Serpelloni, Faccenna, Spada, Dong and Williams2013) and Antonioli et al. (Reference Antonioli, Anzidei, Amorosi, Presti, Mastronuzzi, Deiana and Falco2017); and geological cross-section (A–A′) across the Cagliari Gulf highlighting the main Cenozoic faults. (c) Geological map and geological cross-section (B–B′) of Cala Mosca (from Barca et al., Reference Barca, Melis, Pistis, Lecca, De Muro, Carboni, Cossellu, Kalb, Pusceddu and Tilocca2019).
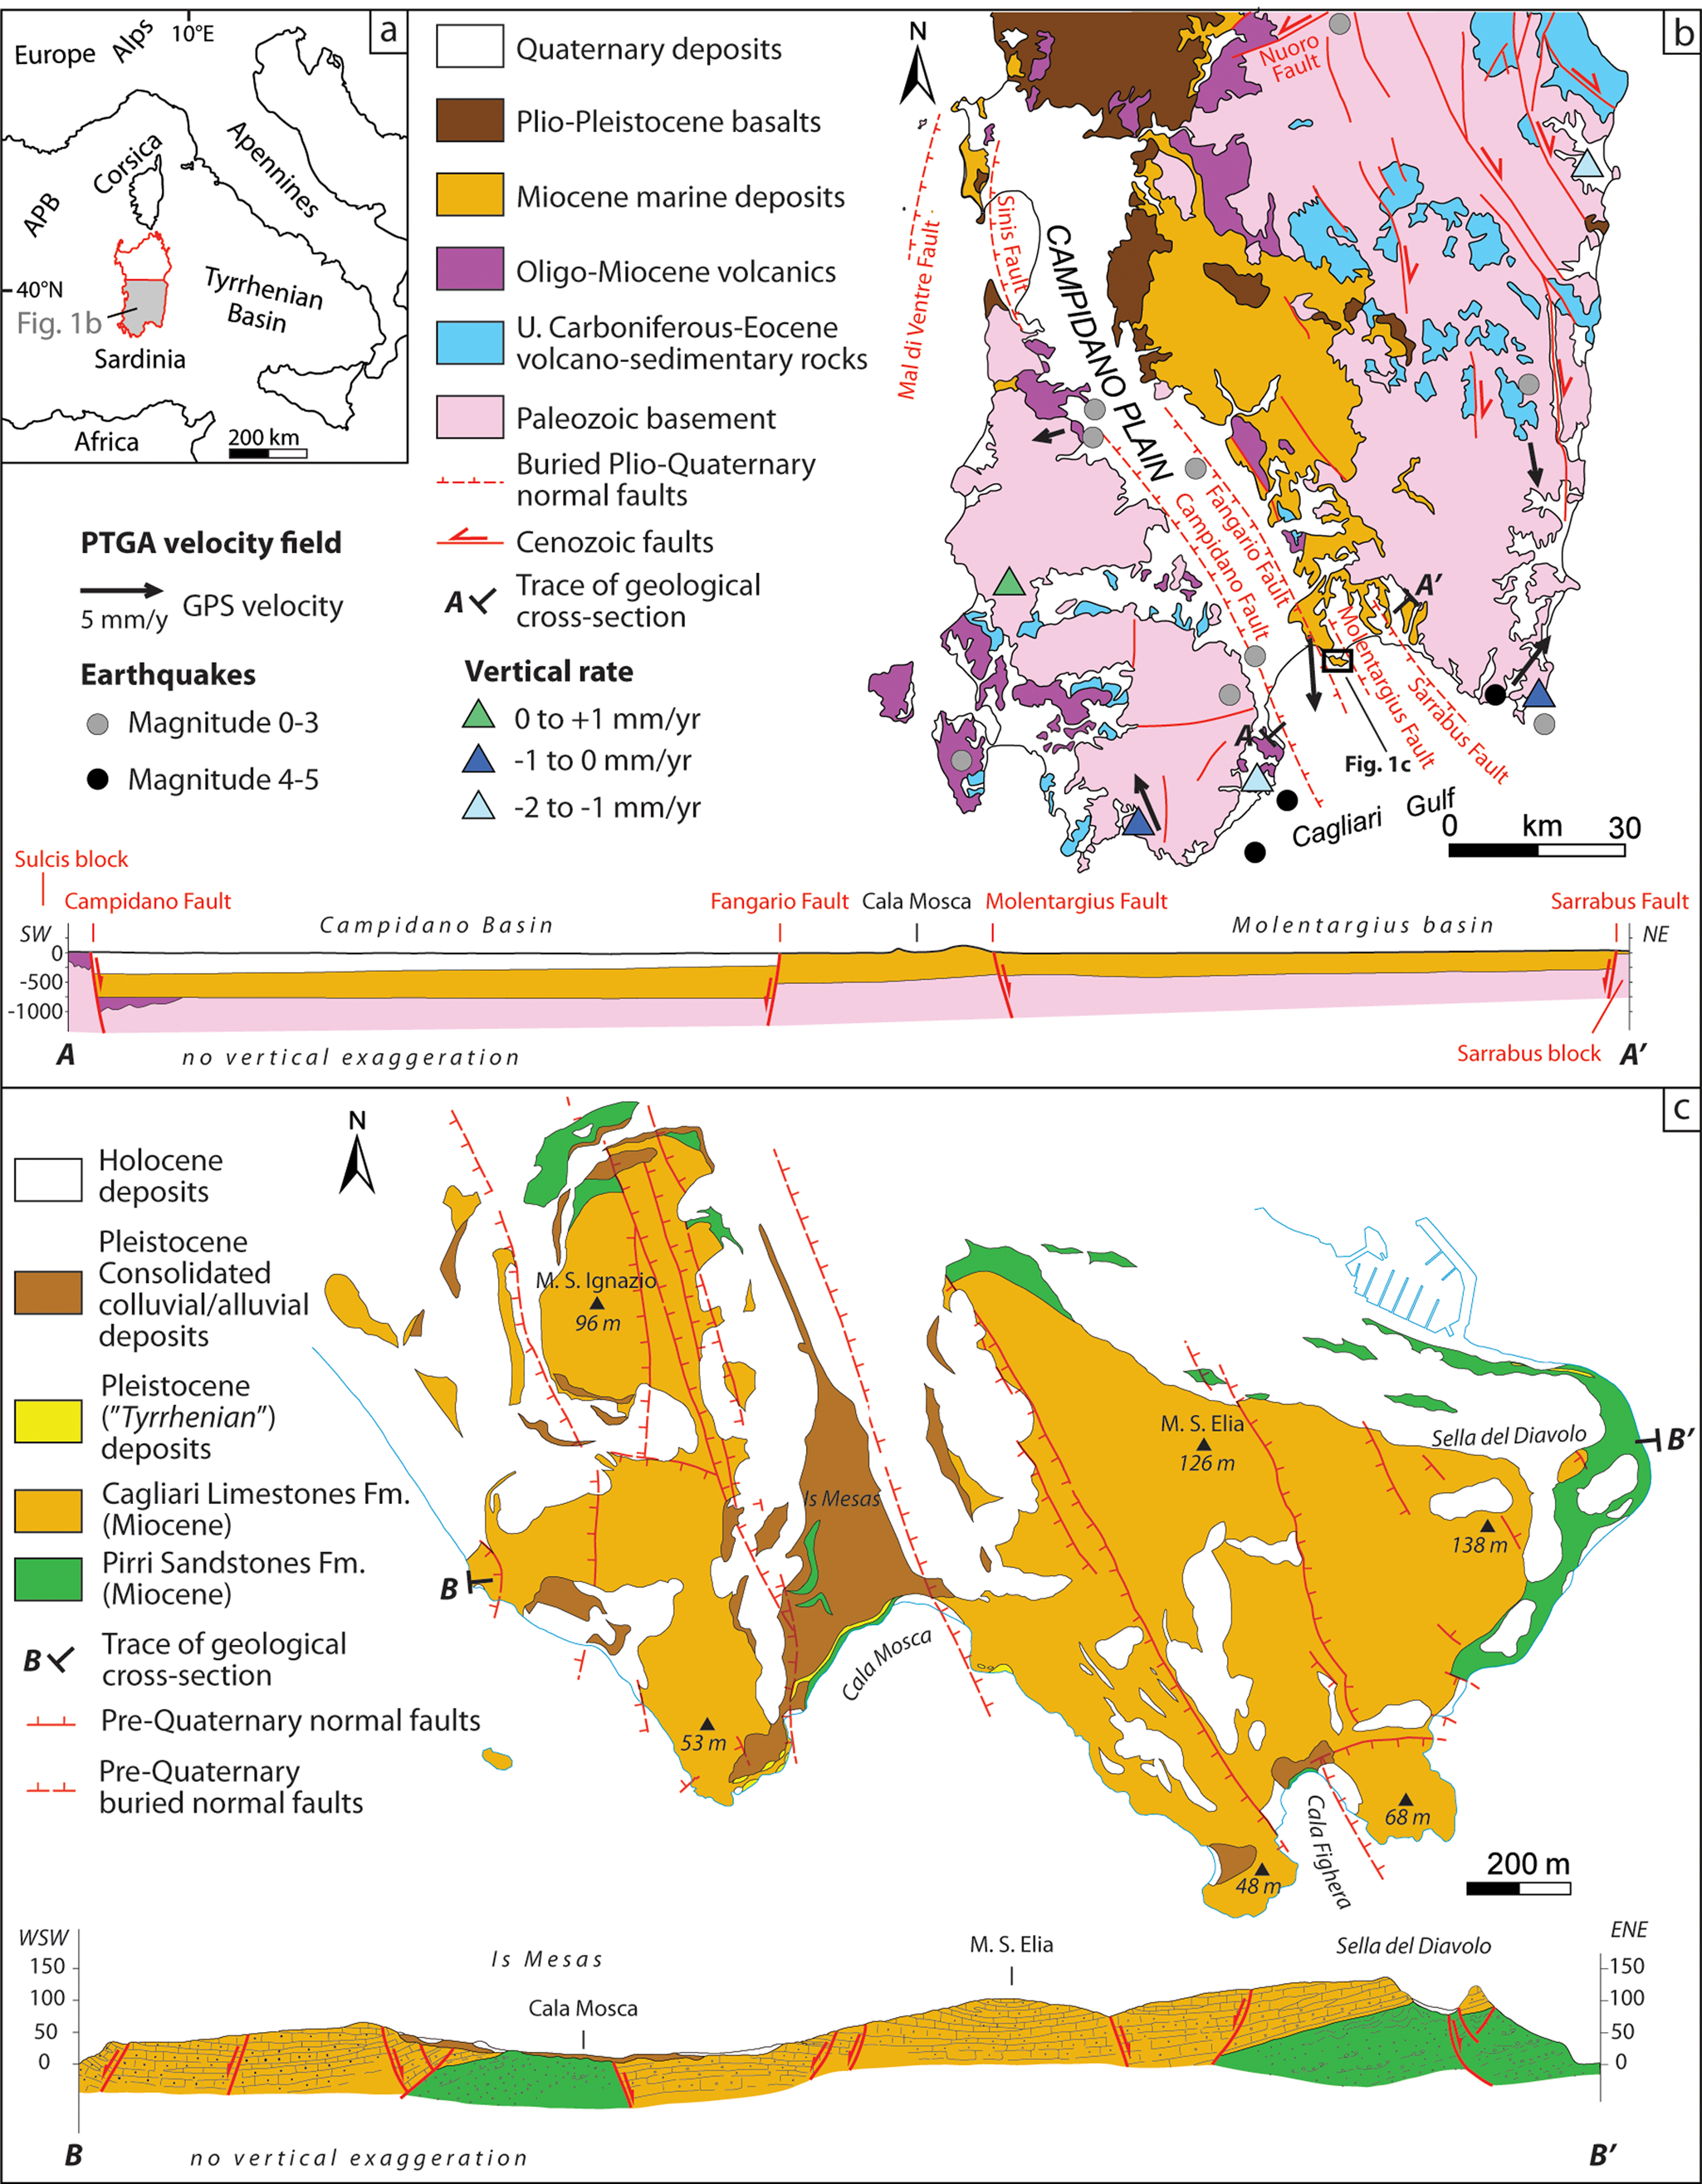
The southern part of the graben is characterized by normal faults offsetting the pre-Quaternary basement forming a complex horst and graben system bounded to the west by the Campidano fault and to the east by the Sarrabus fault (Fig. 1b). The study area is on a NW-SE oriented horst between the Campidano and Molentargius grabens to the west and on the east, respectively (Fig. 1b). Two minor normal faults bound the horst—the Fangario fault on the west and the Molentargius fault on the east (Fig. 1b, c). Even if the area of Cagliari is considered stable under slow subsidence (0.2–0.5 mm/yr), Ferranti et al. (Reference Ferranti, Oldow, D'Argenio, Catalano, Lewis, Marsella, Avellone, Maschio, Pappone, Pepe and Sulli2008) suggested the possible existence of an active tectonic structure associated with the Fangario fault due to lateral-shear deformation. Recently, low-magnitude earthquakes (M <4.5) and slow vertical movement of 1–2 mm/yr have been recorded for the surrounding area of Cagliari and the north-western part of the island (Serpelloni et al., Reference Serpelloni, Faccenna, Spada, Dong and Williams2013; Rovida et al., Reference Rovida, Locati, Camassi, Lolli and Gasperini2020).
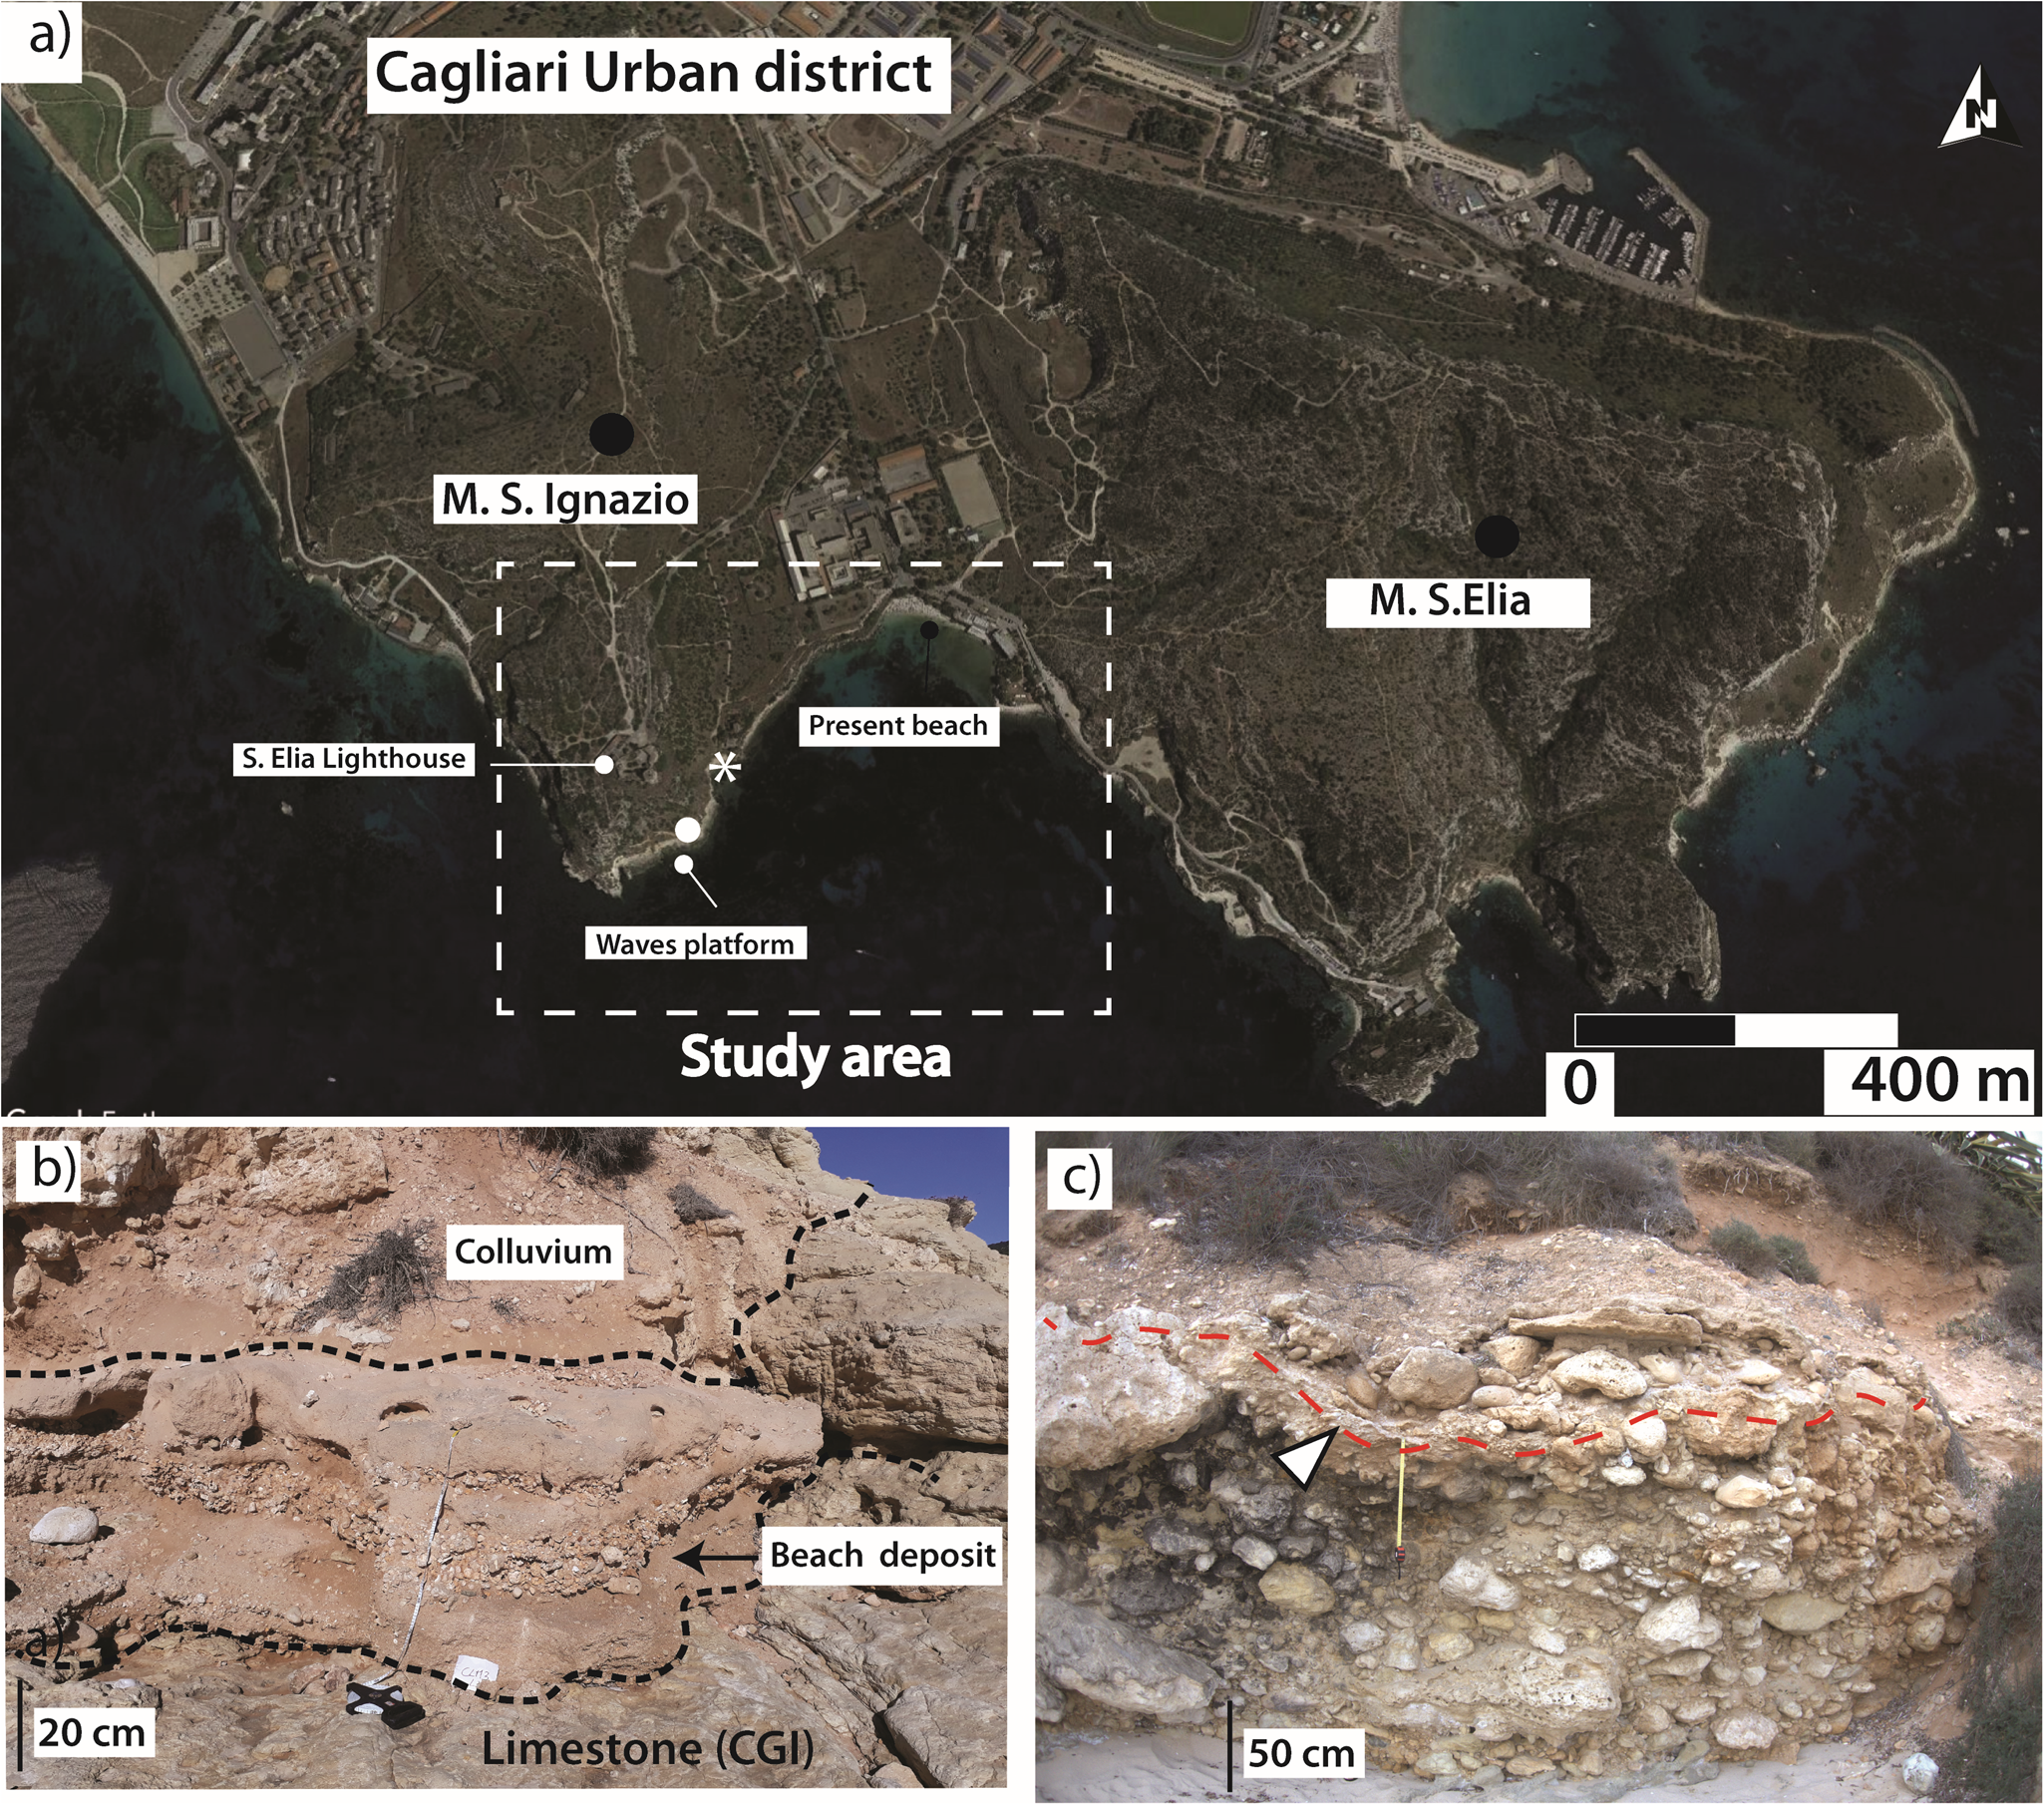
Presently, the Cala Mosca area consists of a small southward-opened embayment bounded by two promontories (Mt S. Ignazio and Mt S. Elia) (Figs. 1c, 2a) (Barca et al., Reference Barca, Melis, Annino, Cinnoti, Ulzega, Orrù and Pintus2005, Reference Barca, Melis, Pistis, Lecca, De Muro, Carboni, Cossellu, Kalb, Pusceddu and Tilocca2019). The Late Pleistocene marine succession crops out along the southern part of the bay, resting on a wave-cut platform carved into Miocene rocks. The succession is characterized by highly fossiliferous sandy to gravelly beach deposits (Fig. 2a). It is possible to observe the double gravel marine deposits reported in Ulzega and Hearty (Reference Ulzega and Hearty1986) divided by a surface with a carbonate crust and patchy thin soil described by Hearty (Reference Hearty1986) (Fig. 2b).
(a) Satellite view of Cala Mosca area; star and filled circle mark the respective field positions of stratigraphic sections in (b) and (c), respectively. (b) The type section of the Tyrrhenian stage at Cala Mosca. Bioclastic gravels and sands containing Persistrombus latus (Gmelin, Reference Gmelin and Gmelin1791) ex Strombus bubonius, and other warm-water fauna are found above a marine abrasion platform covered by >4 m of debris. For aeolian and colluvial deposits, Coltorti et al. (Reference Coltorti, Barca and Melis2007) reported a U/Th age of 122 ± 5 ka performed on Cladocora caespitosa. Erosional surface overlies the pre-Quaternary limestone (CGI) bedrock. (c) Field view of double gravel marine deposits (as reported in Ulzega and Hearty, Reference Ulzega and Hearty1986) divided by erosional surface with carbonate crust and patchy thin soil described by Hearty (Reference Hearty1986). Dashed red line and arrow indicate the erosional surface.
METHODS
Facies analysis and stratigraphy
A facies analysis was performed on the Upper Pleistocene sediments cropping out along Cala Mosca bay. The deposits were subdivided into facies based on their sedimentary (e.g., lithology, grain size, sedimentary structures) and macrofossil characteristics (see Fig. 3 for more details on facies nomenclature). Facies interpretations are based on Pascucci et al. (Reference Pascucci, Martini and Endres2009) for shallow-marine deposits and Andreucci et al. (Reference Andreucci, Panzeri, Martini, Maspero, Martini and Pascucci2014) for alluvial-colluvial deposits. Based on vertical and lateral facies relationships and lithology, facies were grouped into five facies associations (Fig. 3). Facies relationships are shown schematically in Figure 4. Twelve vertical logs were measured in the field (Fig. 5) and correlated according to sedimentary body lithologies and geometries. The unconformity-bounded stratigraphic units (UBSU) were defined and divided by major bounding surfaces visible on the outcrop. Three UBSUs were recognized and named U3a, U3b, and U4, based on the nomenclature of Pascucci et al. (Reference Pascucci, Sechi and Andreucci2014) (Fig. 5). Elevation above the present sea level was measured in the field with a metric tower rule. The chronological framework of the studied section was established by luminescence dating on shallow marine deposits.
Simplified description of the observed facies in the studied area. Facies are labeled using the following nomenclature: G = conglomerate; S = sandstone; W = reddish sandy-siltstone; b = boulders to cobbles; c = cobbles to pebbles; d = pebbles to granules; e = medium- to very coarse-grained sand; w = reddish silty-clay matrix; l = laminated; t = trough cross-bedded; u = low-angle cross-bedded; t = tabular; m = massive; r = root traces; i = good imbrication; o = openwork; and f = high fossiliferous. Thus, facies labeled Seu corresponds to sandstone (S) medium to very coarse grained (e) and low-angle cross-beds (u). Facies interpretation based on (Massari and Parea, Reference Massari and Parea1988; Pascucci et al., Reference Pascucci, Martini and Endres2009; Andreucci et al., Reference Andreucci, Clemmensen, Murray and Pascucci2010a, Reference Andreucci, Panzeri, Martini, Maspero, Martini and Pascucci2014). Wd = inferred water depth range (in meters).

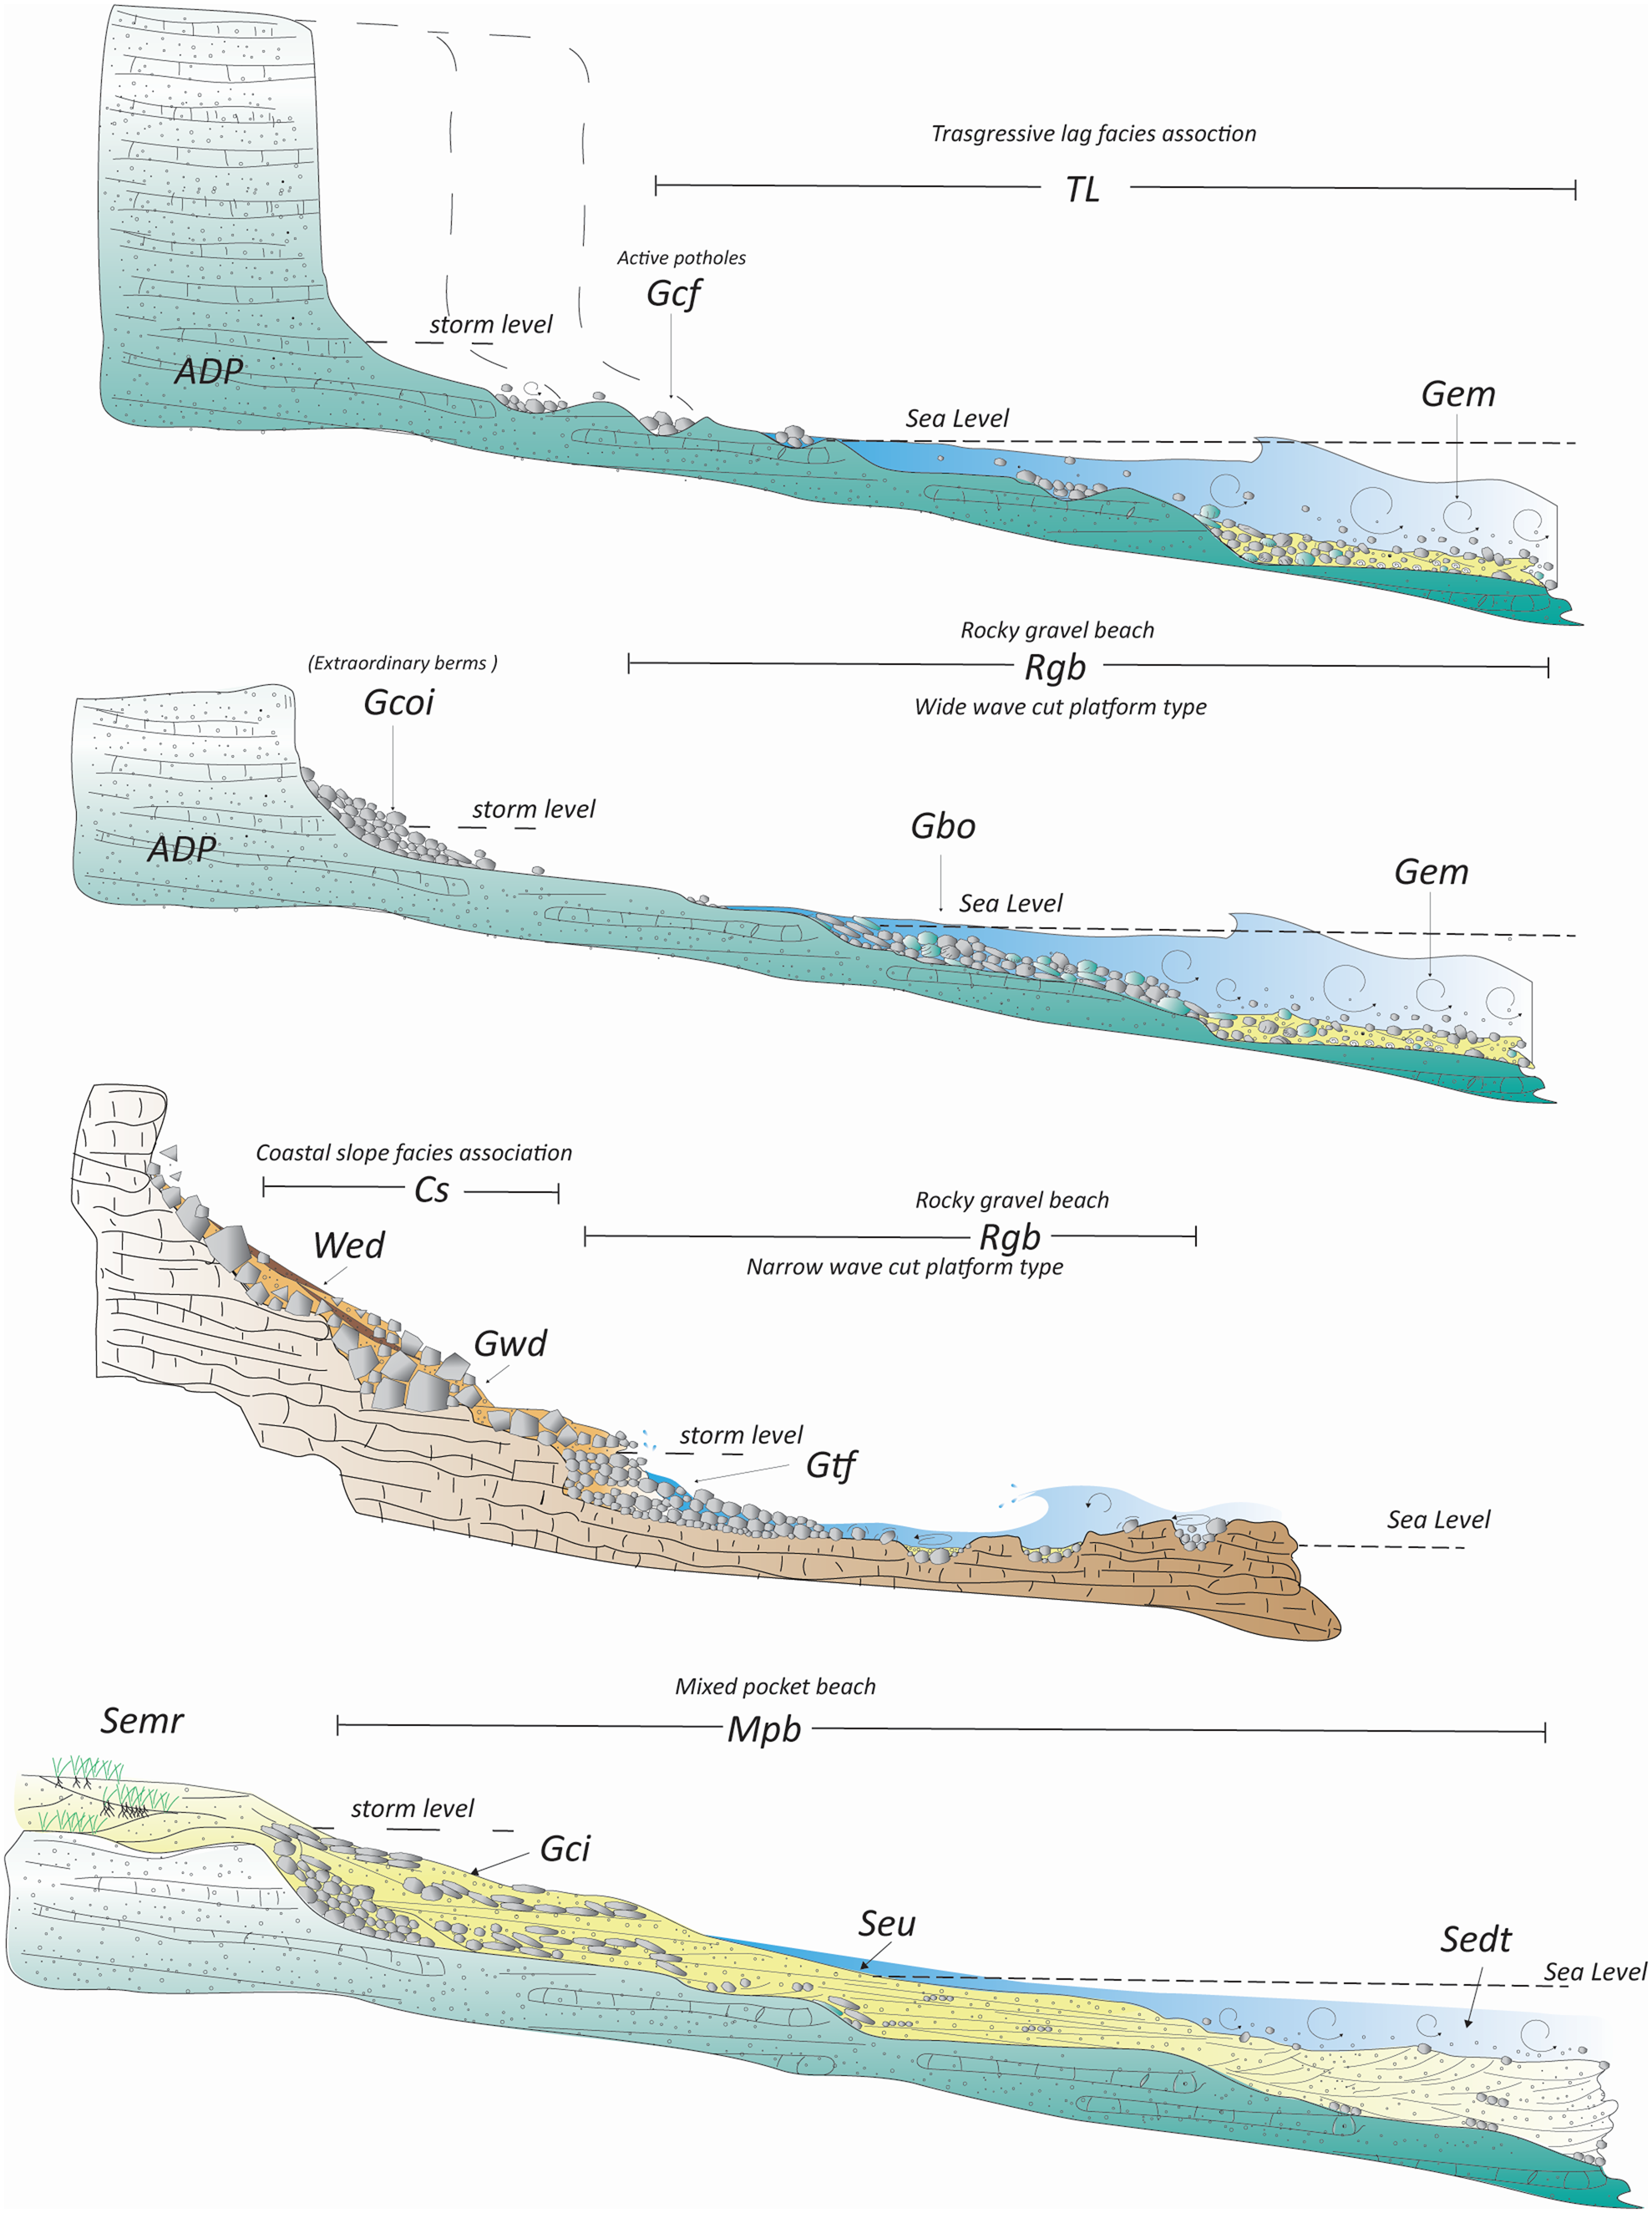
Representations of the different possible relationships of facies association Tl (transgressive lag) for Rgb (rocky gravel beach deposit) and facies association Mpb (mixed pocket beach). Facies distribution model was inferred by NW-SE transect perpendicular to present paleo-shoreline from land to seaward direction of outcropping Quaternary deposits.
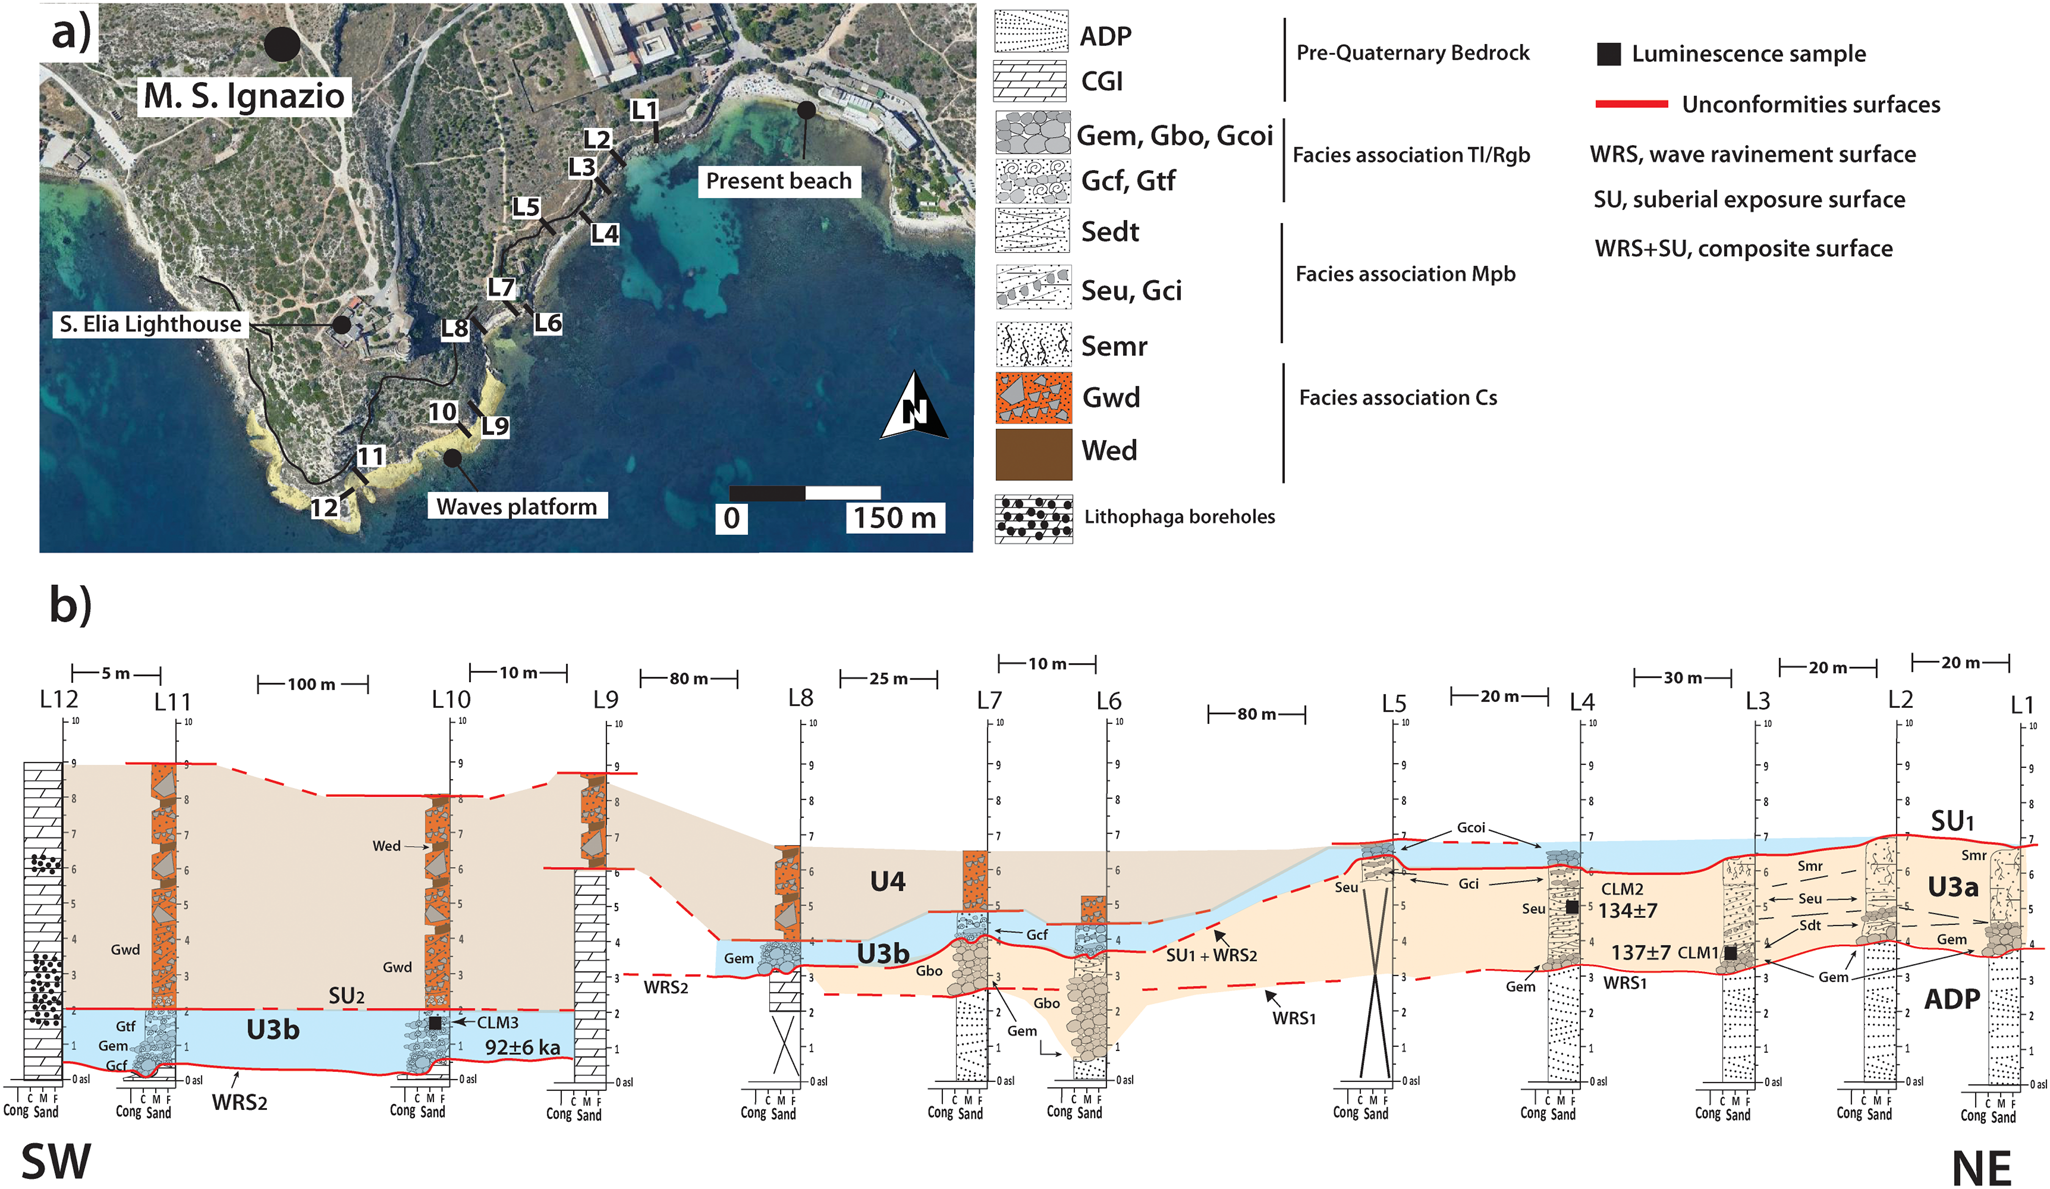
Stratigraphic cross-section of Cala Mosca Quaternary deposits, based on measured sections. (a) Satellite view of Cala Mosca Bay and position of measured logs along the studied Quaternary deposit. (b) Stratigraphic correlation of analyzed logs. Log L10 indicates the position of the section key marine succession described in Figure 2a. Log L6 indicates the gravel deposit shown in Figure 2b. Due to modern coastal morphology, the studied sections and their correlation (12 stratigraphic logs) were arranged along an idealized SW-NE transect. Assuming this direction is roughly perpendicular to the paleoshoreline, the transect crosses the paleo-marine system. Labels such as Gem indicate facies described in the text and Figure 3. Major unconformity-bounded units (U3a, U3b, and U4) are delimited by their respective unconformity surfaces (WRS1, SU1+WRS2, and SU2).
Luminescence dating procedure
Three samples (CLM1, CLM2, CLM3) (Table 1; Fig. 5) from the beach deposits were collected for luminescence dating purposes as blocks (~50 × 50 × 50 cm) and treated at the University of Sassari Luminescence Dating laboratory under subdued red light. The outer light-exposed part of the block (~10 cm) was removed and used to determine the field and saturation water content and total dose rate. Water content was measured following Casini et al. (Reference Casini, Andreucci, Sechi, Huang, Shen and Pascucci2020) and Sechi et al. (Reference Sechi, Andreucci, Stevens and Pascucci2020). The inner part was gently crushed, and the material was placed in 40% hydrochloric acid (HCl) and 30% H2O2 baths to dissolve carbonate cement and organic matter. The material was dry-sieved, and a sediment fraction of 90–180 μm was chosen for further laboratory analysis. Quartz and K-feldspar grains were isolated via density separation (see supplemental material). All measurements were performed with an automated Risø DA-20 TL/OSL reader, with quartz luminescence detected through a 7.5 mm UV filter (Hoya U-340), and the K-feldspar IRSL with combined Schott BG-39 and Corning 7-59 filters.
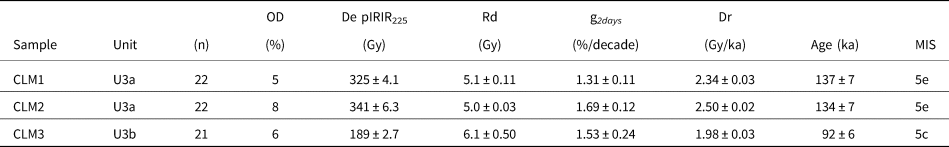
Summary of samples, stratigraphic unit interpreted, (n) the number of reliable aliquots used for dating, (OD; %) overdispersion of De expressed in percentage; K-feldspar pIRIR225 doses, (RD) residual dose; (g2days) fading rate; and (Dr) total dose rate (Gy/ka). Estimated ages in ka and related MIS (marine isotope stage). For more details of determination of ages and dose rates, see the Supplemental Material (Supplementary Table SM1).
Small-sized aliquots, 2 mm in diameter (i.e., containing some hundreds of grains), of quartz and K-feldspar grains were placed on stainless-steel discs using silicon oil as adhesive and stainless-steel cups. The quartz OSL signal was measured with the standard SAR protocol (Murray and Wintle, Reference Murray and Wintle2000, Reference Murray and Wintle2003), while K-feldspar grains were measured with the protocols, pIRIR225 (Thiel et al., Reference Thiel, Coltorti, Tsukamoto and Frechen2010, Reference Thiel, Tsukamoto, Tokuyasu, Buylaert, Murray, Tanaka and Shirai2015; Ferranti et al., Reference Ferranti, Burrato, Sechi, Andreucci, Pepe and Pascucci2021) and pIRIR290 (Buylaert et al., Reference Buylaert, Jain, Murray, Thomsen, Thiel and Sohbati2012; Thiel et al., Reference Thiel, Buylaert, Murray, Elmejdoub and Jedoui2012; Zucca et al., Reference Zucca, Andreucci, Akşit, Koca, Madrau, Pascucci, Previtali, Shaddad and Kapur2014a; Andreucci et al., Reference Andreucci, Sechi, Buylaert, Sanna and Pascucci2017b; Casini et al., Reference Casini, Andreucci, Sechi, Huang, Shen and Pascucci2020; Sechi et al., Reference Sechi, Andreucci, Stevens and Pascucci2020). To detect the portion of interest of OSL-quartz signal to calculate the equivalent dose (De), the first second (s) of signal decay was taken to which the following 2.6 s were subtracted as background (early background, i.e., Cunningham and Wallinga, Reference Cunningham and Wallinga2010), whereas the first 5 s were subtracted by the last 20 s (late background) for pIRIR signal. At least 21–22 reliable aliquots were measured for the De estimation.
The OSL quartz signals have good luminescence characteristics, dominated by fast component and satisfactory laboratory performance (recycling close to unity and low recuperation). However, OSL signals were beyond the saturation limit for all samples, and thus not used for dating. The pIRIR290 and pIRIR225 signals have suitable luminescence characteristics, thermal stability, and good laboratory performance (recycling ratios within 10% of unity and recuperation <5%). A representative dose response curve for both protocols is shown in Figure SM1. Both protocols gave low fading values of 1.21 ± 0.31%/decade for pIRIR290 and 1.51 ± 0.10%/decade for pIRIR225. However, pIRIR290 gave De ~26% (average of three samples) larger than pIRIR225. In order to investigate the source of this difference, dose recovery tests for both protocols were carried out by adding different laboratory doses (close to natural) onto sun-bleached aliquots of each sample (see supplemental material for details). The average recovery ratio after residual subtraction for pIRIR290 is 1.26 ± 0.03 (average of all samples), suggesting that the laboratory-measured dose overestimates the given dose by ~30% as observed. PIRIR225 shows a good dose recovery ratio (0.95 ± 0.01), with low unbleachable residual (~5 Gy) and fading rates, and thus it was the chosen protocol for dating. Given the low fading value, we decided not to correct the final pIRIR225 ages for fading.
A potential problem in dating is the incomplete resetting of the luminescence signal at deposition. However, by comparing signals with different bleaching ratios, it is possible to check the completeness of bleaching. When corrected for the dose overestimation pIRIR290 De for each sample, pIRIR290 De agreed with pIRIR225 De, and therefore final ages, suggesting that both signals were potentially well bleached at the same degree prior to deposition (for more details, see the Supplemental Material and Supplementary Fig. SM1).
The total dose rate was calculated using a Risø low-level gas flow beta multi-counter GM-25-5 (GMBC; Bøtter-Jensen and Mejdahl, 1988) based on the proposed method by Cunningham et al. (Reference Cunningham, Murray, Armitage and Autzen2018). Measured mass and activity concentrations of K, U, and Th (and/or progeny) were obtained with inductively coupled plasma mass spectrometry (ICP-MS) at SGS Minerals (Canada) and high-resolution gamma spectrometry (HRGS, Denmark DTU) analysis. The activities obtained with HRGS were converted to mass concentration with conversion factors (Guérin et al., Reference Guérin, Mercier and Adamiec2011, Reference Guérin, Mercier, Nathan, Adamiec and Lefrais2012) (Table SM1).
The advantage of the Cunningham et al. (Reference Cunningham, Murray, Armitage and Autzen2018) method is that the beta counter can provide a precise proportion of β dry dose rate for the sample when the concentrations of U, Th, and K for bulk sediment are known. The analysis also highlights that the K-contents (expressed in K%) in the studied samples are quite variable (Table SM1). To account for this potential variability, K% concentrations obtained for each sample by the three methods were averaged and used as a natural concentration of K% for bulk sediments to estimate the proportional contribution of this element on beta counts. (Table SM1).
However, the K-content of individual grains, and therefore the magnitude of the internal beta dose to the overall dose rate, is variable between grains, and it is difficult to estimate this for multiple-grain samples. Thus, as reported widely in literature, the internal contribution of β-dose is calculated on average K content of 12.5 ± 0.5% (Huntley and Baril, Reference Huntley and Baril1997) and internal abundance for 87Rb mean value of 400 ± 100 ppm, and corrected for grain-size attenuation (average of 90–180 μm) (Huntley and Hancock, Reference Huntley and Hancock2001).
The dry dose rates were corrected for moisture content, sample grain size, β-grain size attenuation (Guérin et al., Reference Guérin, Mercier, Nathan, Adamiec and Lefrais2012), and cosmic contribution. For moisture content, a 4% error on sample water content was used, and the cosmic contribution was based on the geographical position, altitude, and the measured sample burial depth following Prescott and Hutton (Reference Prescott and Hutton1994). Table SM1 reports the U, Th, and K concentrations, beta and gamma and measured dry and final total dose rates (for more details, see the Supplemental Material); final ages are listed in Table 1.
FACIES ANALYSIS AND DEPOSITIONAL PROFILES
Eleven facies were recognized and grouped into three shallow-marine (Tl, Rgb, Mpb) and one continental (Cs) facies associations (Fig. 3). A detailed description of facies associations is provided below, along with the depositional profiles for the studied deposits and a schematic of the lateral distributions of facies (Fig. 4).
Facies association: Tl transgressive lag
Facies association Tl is well developed along all the study area where it unconformably rests on the substrate or erosionally lies on facies associations Rgb and Mpb (rocky gravel beach, mixed pocket beach). The Tl association is dominated by clast-supported conglomerates with a sandy matrix and characterized from land to sea by facies Gcf and Gem (coastal pothole deposits; conglomerate lag) (Fig. 3; Fig. 4).
Facies Gcf: coastal pothole deposit
Facies Gcf crops out discontinuously only at the center of the bay, where it fills narrow depressions and grades upward into facies Gem or Gcoi (Figs. 6, 7). The base is carved into the substrate and occasionally is draped by a thin (maximum 5 cm thick) carbonate crust. Gcf ranges in thickness from 20–50 cm and is composed of clast-supported conglomerate with highly fossiliferous, chaotic-to-poorly sorted, granule-to-coarse sandy matrix (Fig. 6; Fig. 3). Clasts are sub-rounded to well-rounded (spherical or flat disc) pebbles and cobbles. Marine shells are mainly broken (Fig. 6a–d).
(a) Example of facies Gcf infilling erosional depression forming relict pothole (base of pothole indicated by red line). (b) Series of potholes (facies Gcf) carved on the top of U3a represented by gravelly berms (facies Gcoi). (c) Top view of the complete structure of pothole carved into facies Seu. The pothole is still preserved in the shape of the erosive structure and with its coarse filling materials (Gcf). (d) Vertical section of pothole carved and filled by Gcf on top of U3a (facies Seu). The subaerial calcrete crust mantles the top of the unit due to subaerial exposure of surface SU1. The pothole is capped by gravel berm (Facies Gcoi). (e, f) Outcrop views of different details of transgressive lag deposit (facies Gem); here Gem lies directly on the pre-Quaternary bedrock CGI and ADP.
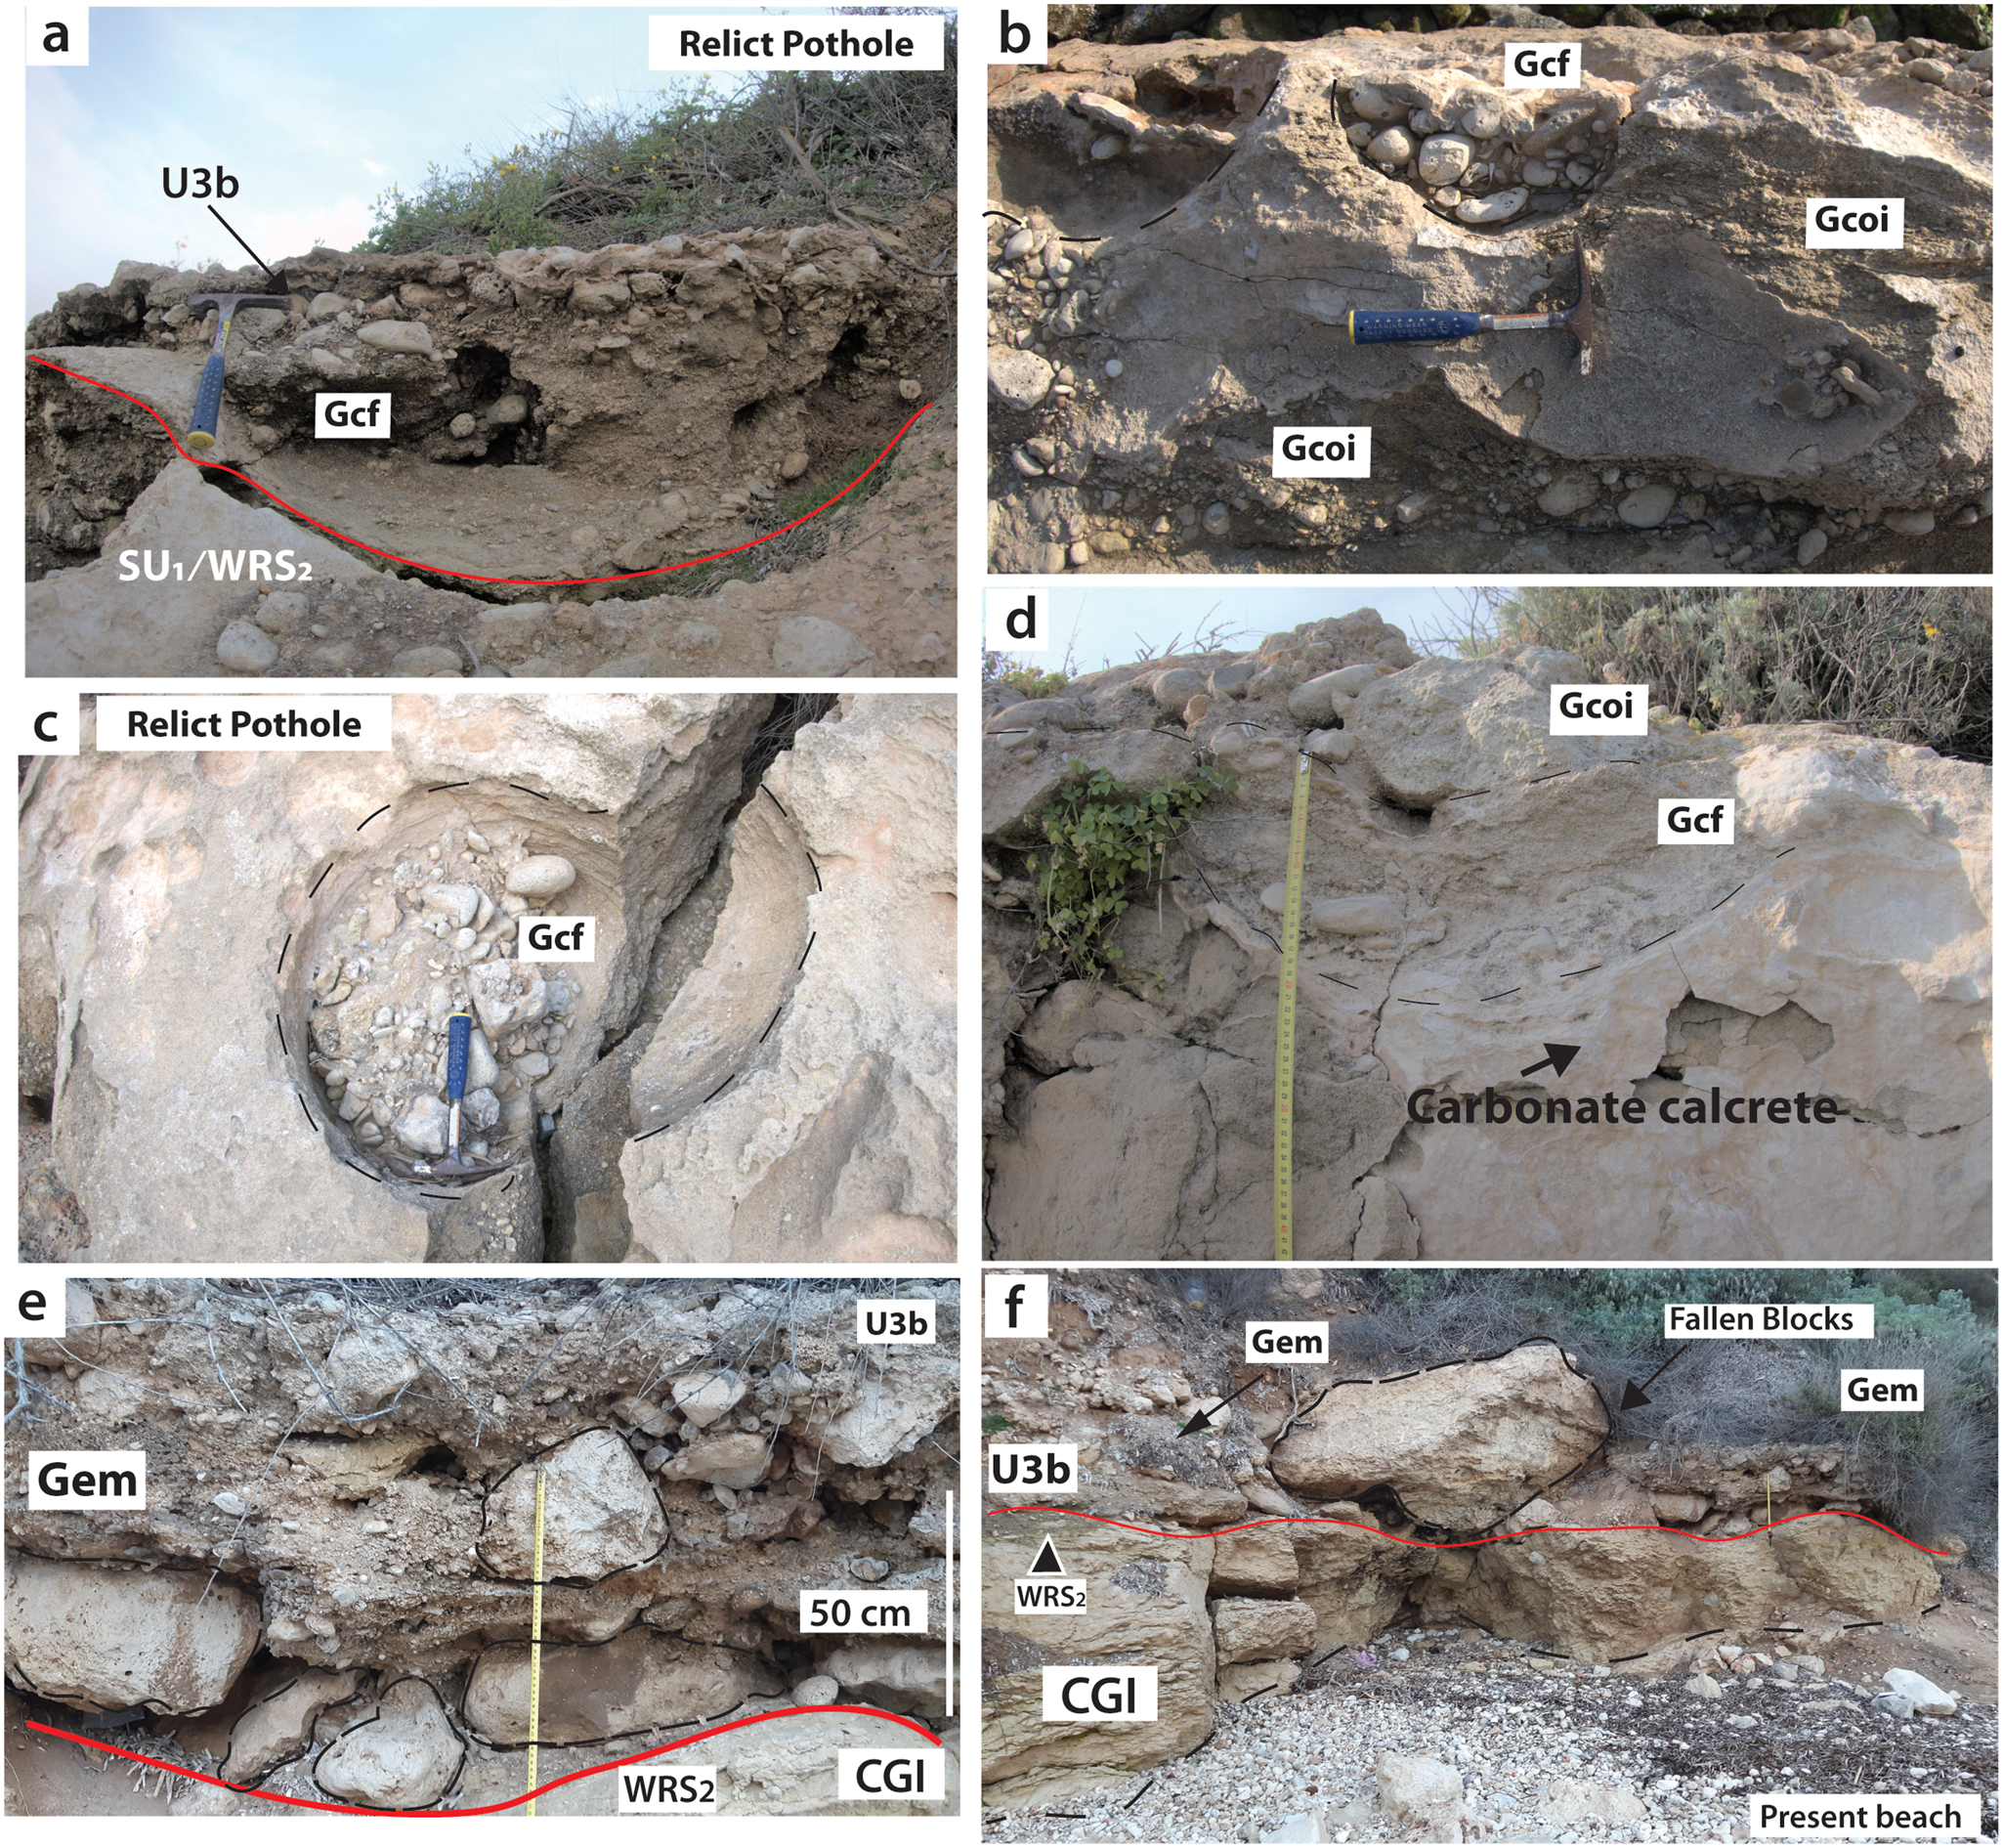
View of some field details of facies association Rgb. (a) The transgressive lag deposit; poorly structured rocky exposure (facies Gem) cropping out toward SE (looking from the sea). This erosional surface overlays the pre-Quaternary bedrock (CGI). Large mega boulders occur in this area due to the proximity of the cliff. (b) Field view of basal transgressive lag (facies Gem) passing to the seaward dipping gravel beach deposits (facies Gbo) formed at the base of cliff toe. (c) Field view of outcrop described by Hearty (Reference Hearty1986) and the unconformity composite surface dividing U3a from the overlying U3b (upper red line). The association of gravelly sediment mainly characterizes U3b lag facies Gcf and Gem, which are unconformable on Gbo, separated by the composite surface SU1+WRS1 (lower red line; see text for details). (d) Details of gravel beach deposit cut at the top and overlapped by second marine episode. (e, f) Pothole carved onto the top of Gbo, with details of the wavy erosional composite surface SU1+WRS2 and the thick hard carbonate crust formed by cementation of the coarse-grained sandstone at the top of Gbo.
Facies Gem: conglomerate lag
Facies Gem crops out continuously along the study area and unconformably rests on the substrate or overlies facies Gcf (Fig. 6e, f). This facies consists of cm-thick (up to 1 m thick) layers characterized by a poorly organized openwork conglomerate of pebble-sized clasts (Fig. 6e; Fig. 3). Clasts are sub-rounded, spherical, and/or disc-shaped pebbles to small boulders (Figs. 6e, f; 7e, f). Gravel composition reflects the local bedrock lithology. Carbonate clasts become dominant close to the limestone promontory and are pervasively bored by mollusks (lithofaga), poriferans, and algae. Clasts show faint seaward dipping imbrication, but often follow the morphology and inclination of the basal surface. In places, granules to very coarse sandy matrix with abundant fragmented marine shells fill the spaces among the clasts.
Interpretation of facies association Tl and depositional profile
The relationship of facies association Tl with the underlying erosional surface and overlying beach deposits (facies associations Rgb and Mpb, see below) suggests that Tl represents transgressive deposits draping a wave-cut platform formed by wave erosion and coastal-cliff retreat (Zecchin et al., Reference Zecchin, Catuneanu and Caffau2019). In particular, facies Gcf represents the trapped sediment infilling erosional potholes or pools (Figs. 4, 6c) (Sechi et al., Reference Sechi, Andreucci, Stevens and Pascucci2020). The Mediterranean Sea is microtidal, with tidal ranges ~35–50 cm. Potholes form above the intertidal zone in the supratidal zones from 0.5–2 m above the present sea-level. Facies Gem, in contrast, is interpreted as the transgressive lag (sensu Massari and Parea, Reference Massari and Parea1988, and Zecchin et al., Reference Zecchin, Catuneanu and Caffau2019, and reference therein) draping the shore platform in a fully submerged condition (subtidal zone; 0.5–2 m below present sea-level). Overall, facies association Tl shows a deepening upward trend indicated by the evolution from supratidal (facies Gcf) to subtidal conditions resulting from the marine transgression and shore retreat. Moreover, the depositional profile of Tl highlights the typical three-step evolution of a marine terrace that occurs during the early phase of transgression: (1) coastal cliff retreat and wave-cut platform development; (2) filling of the potholes in the intertidal zone, (3) mantling of the shore platform in subtidal conditions (Fig. 4) (Postma and Nemec, Reference Postma and Nemec1990).
Facies association Rgb: rocky coast gravelly beach deposit
Facies association Rgb crops out discontinuously as patches along the area and either rests unconformably on the substrate or overlies facies association Tl. Although Rgb does not show important lateral facies variations at the outcrop scale, different features reflect the local variability of substrate lithology (limestone or sandstones) and paleotopography (Fig. 4). Facies association Rgb is dominated by pebbly to bouldery clast-supported conglomerates and characterized from land-to-sea by facies Gcoi, Gbo, and Gtf (Fig. 3).
Facies Gcoi: Extraordinary gravelly berm
Facies Gcoi is observable in the northern inland part of the bay with E to W orientation. It consists of 20–70 cm thick tabular, slightly seaward dipping conglomerates of moderately to well-sorted, well-rounded, disc-shaped rounded cobbles and spherical oblate pebbles. Clasts have seaward dipping imbrication and an openwork clast-supported framework (Figs. 6–8). In places, it contains disseminated large (outsized) sub-rounded clasts, disarticulated chaotic organized broken marine shells, and rare patches of granules.
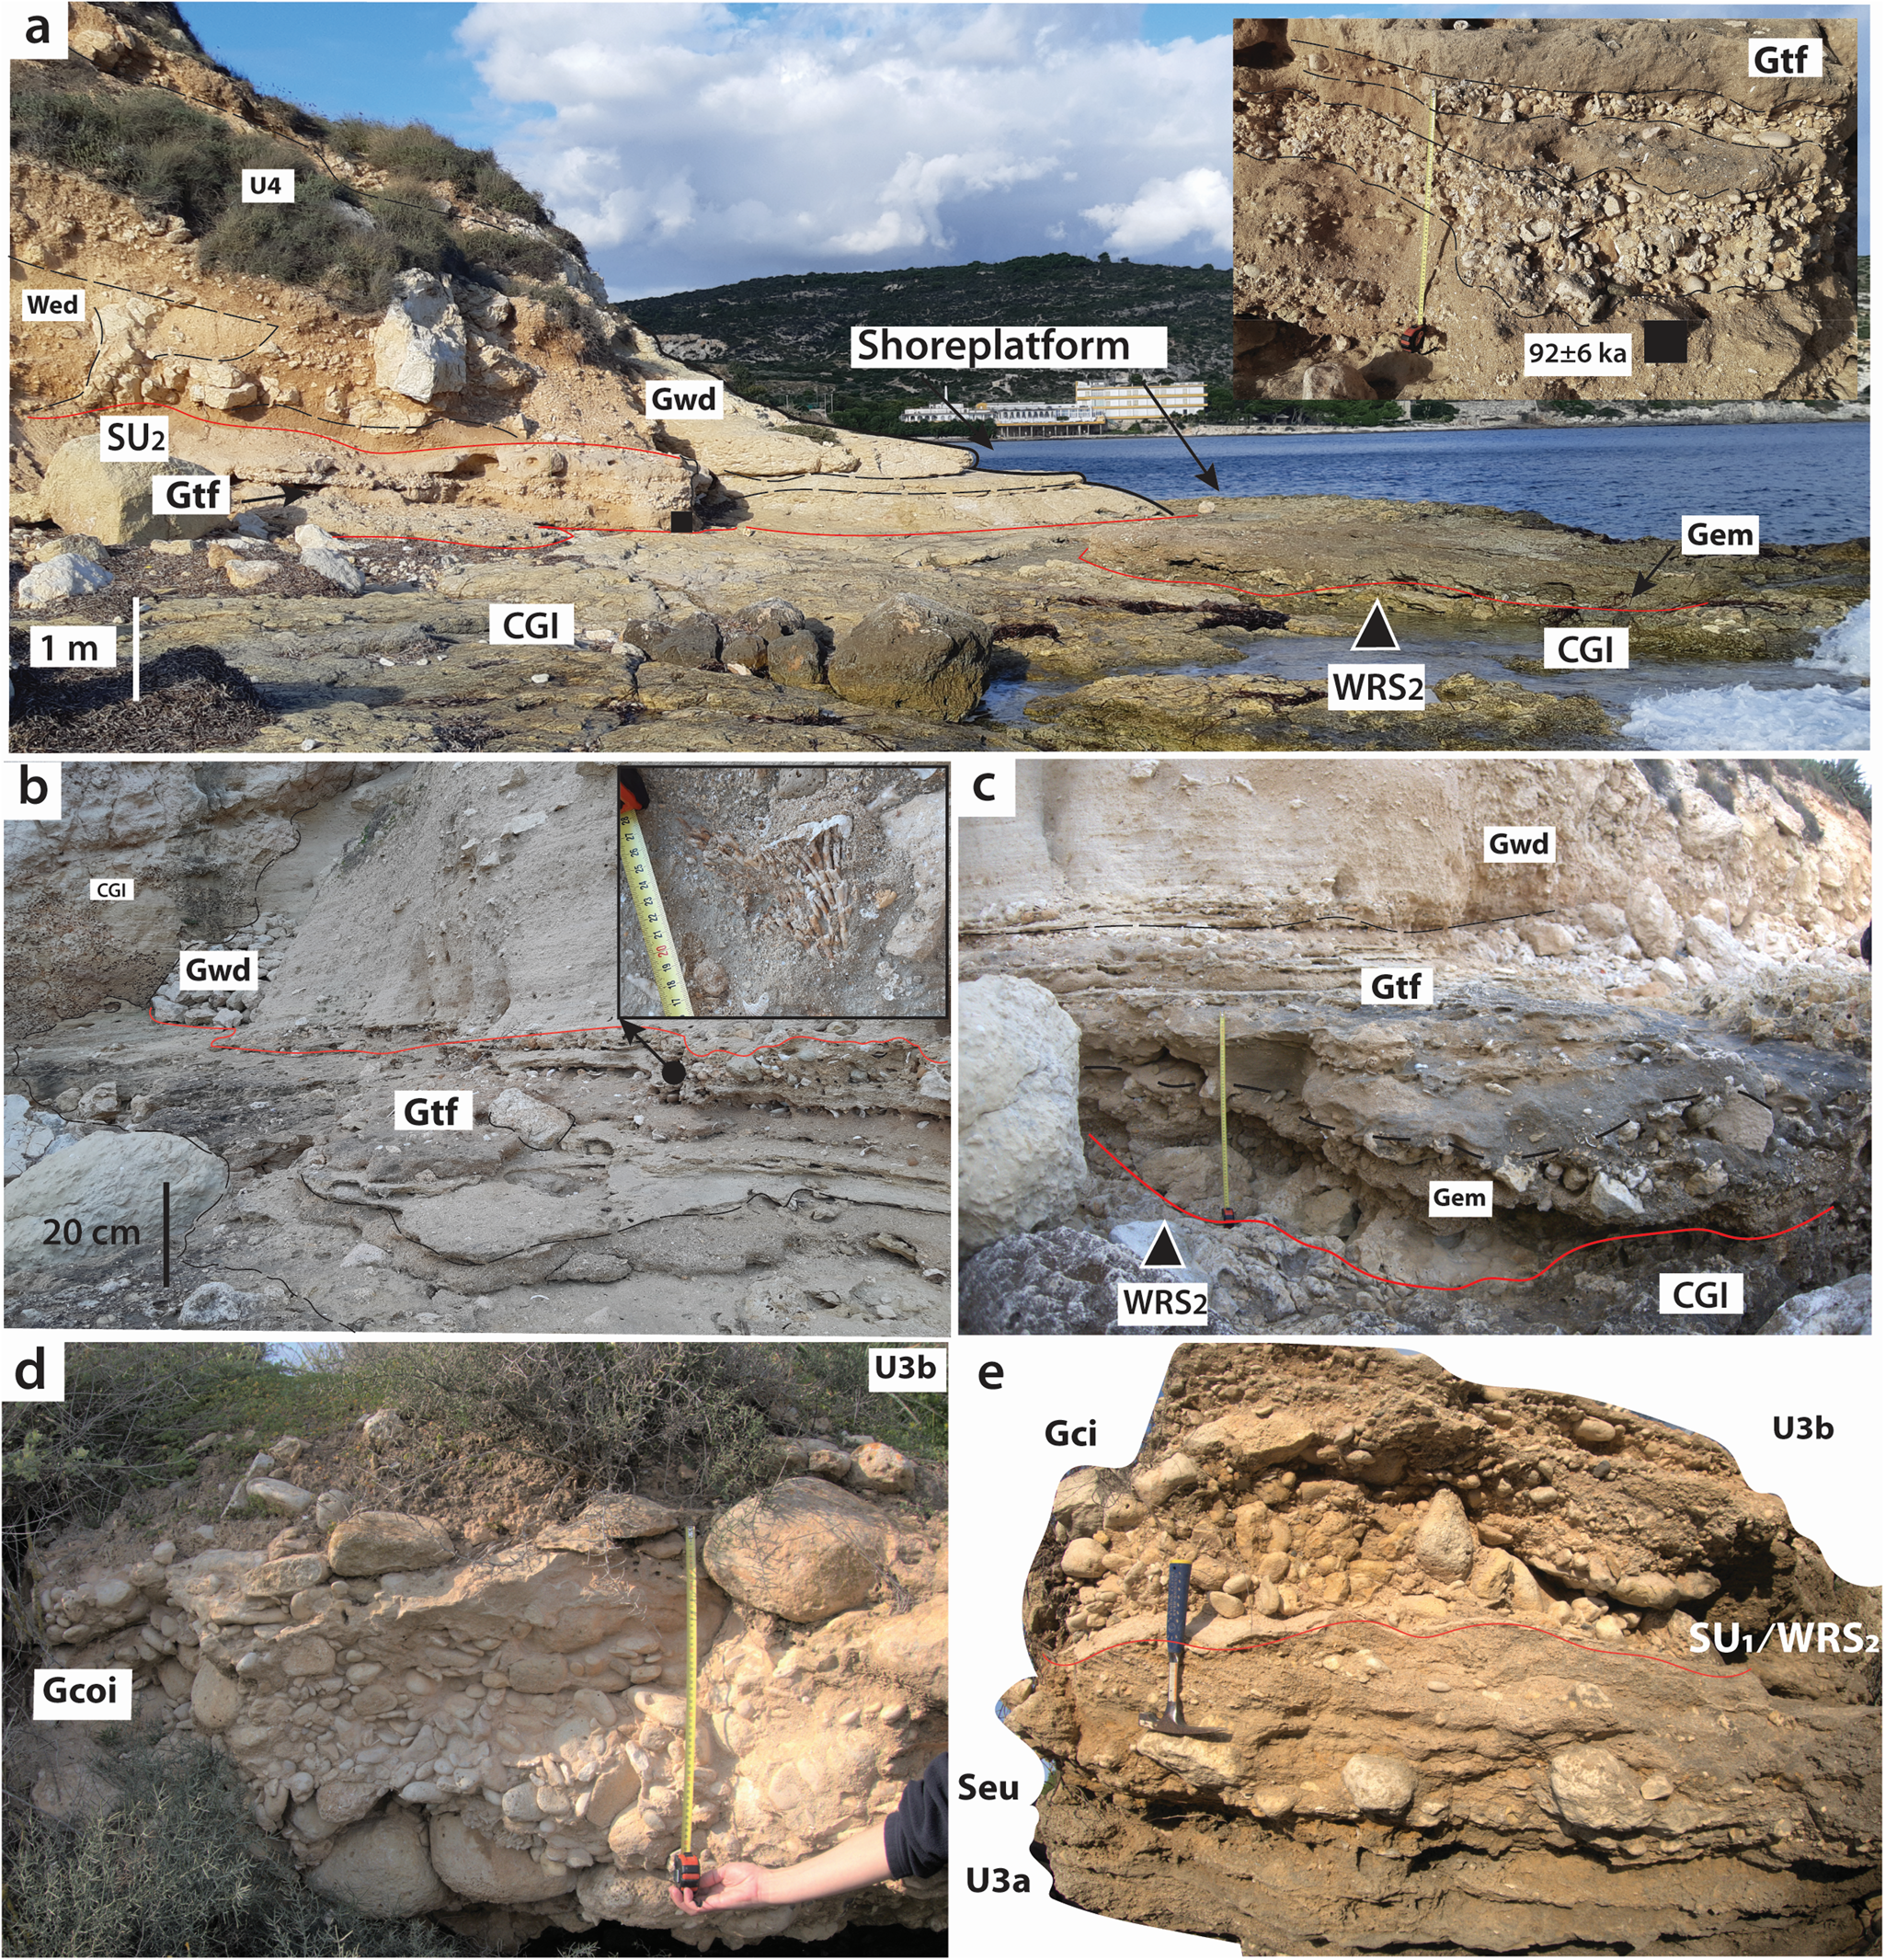
(a) Field view of interpreted facies association Rgb (Rocky gravel beach) resting on pre-Quaternary bedrock (CGI) wave-cut platform; inset detail of Facies Gtf (cliff talus beach, narrow pocket beach); black square indicates luminescence sample CML3 (92 ± 6 ka). (b, c) Detailed view of facies Gtf formed at the base of cliff and covered by cliff slope deposits (facies association Cs); inset shows a reworked piece of Cladocara caespitosa. (d, e) Field details of facies Gcoi (gravel berm); note especially the composite unconformity surface SU1+WRS2 cut on top facies Seu overlain by transgressive gravel berm (facies Gcoi). The preserved composite surface SU1+WRS2 and evidence of subaerial exposure make it possible to distinguish similar sedimentary deposits as different depositional units.
Facies Gbo: gravel beach face
Facies Gbo consists of a 1.5 m maximum thickness clast-supported conglomerate. Clasts range in size from pebbles to boulders showing various degrees of reworking, with a general openwork arrangement and slight traces of landward imbrication (Fig. 7). This facies is well preserved at the center of the bay, and at outcrop scale a slight seaward dip is observable. Generally, clasts range in size from pebbles to cobbles with variable shapes from subangular to well rounded, and scattered small sub-rounded boulders can be observed (Fig. 7a–c). Where the facies is well expressed, it may grade upward into 50 cm thick structureless coarse-grained conglomeratic sandstone with rounded granules and pebbles, and dispersed sub-rounded cobbles and boulders. Whole and broken marine shells are occasionally organized in layers with faint sandy cross lamination (Fig. 7d, e).
Facies Gtf: cliff-talus/beach face
Facies Gtf crops out only in the southwestern part of the bay, where it usually lies on facies association Tl (Fig. 8). It comprises alternate 20–40 cm thick seaward dipping wedges of coarse to medium sandstone with sparse granules and rounded pebble to openwork, very fossiliferous, clast-supported conglomerates. The latter are characterized by small rounded spherical to disc-shaped pebbles and granules, abundant whole and disarticulated marine shells, and a significant quantity of rounded pebble-size rhodoliths. In places, Gtf surrounds angular boulders, and in some places, where the facies shows better organization, faint low-angle crossed to planar stratification can be seen (Figs. 6e, f, 8). The mollusk fossil assemblage consists of rare Persististrombus latus Gmelin, Reference Gmelin and Gmelin1791 (= ex Strombus bubonius Lamarck, Reference Lamarck1822), abundant Astrea rugosa, Conus sp., Glycymeris glycymeris, Arca noae, and less abundant Euthria cornea, Gibbula varia, Patella aspera, Spondilus gaederopus, Cardium edule, Conus ventricosus, C. mercati, Cantharus viverratus, Gourmya sp., Solen cf. S. marginatus, Semicassis cf. S. undulata, Murex trunculus, Laevicardium sp., Aphorrais pespelecani, and Mytilus edule (Barca et al., Reference Barca, Melis, Annino, Cinnoti, Ulzega, Orrù and Pintus2005). Occasionally, small broken parts of Cladocora caespitosa can be found (Fig. 8b, c). The top shows 40 cm thick tabular medium- to coarse-grained sandstone with an abundant pale brownish muddy matrix characterized by lenses of angular granules, sub-rounded pebbles, and fragmented marine shells.
Interpretation of Facies association Rgb
Although there is a distinctive lateral and vertical trend, the general gravel characteristics and the relationships with the underlying facies association Tl indicated that Rgb represents a gravelly beach system developed along the rocky shore (Fig. 4) (Sanders, Reference Sanders2000; Felton, Reference Felton2002; Felton et al., Reference Felton, Crook, Keating and Kay2006; Bizzarri, Reference Bizzarri2010; Sechi et al., Reference Sechi, Andreucci and Pascucci2013, Reference Sechi, Andreucci, Stevens and Pascucci2020).
Facies Gcoi, dominated by moderate- to well-sorted openwork gravel (rounded and disc-shaped clasts) with a clear seaward dipping imbrication, represents the gravelly berms that most likely accumulated at the inland part of the marine terrace (supratidal gravel berm; Pascucci et al., Reference Pascucci, Martini and Endres2009). Moreover, Gbo and Gtf are characterized by spherical-/rolled-shaped and/or outsized clasts in seaward dipping strata, which allow interpretation of this facies as a gravelly beach face (Figs. 4, 8d, e). Facies Gbo and Gcoi show moderate to good stratal organization, indicating that this beach system developed over a gently inclined and wide shore platform. By contrast, Gtf is interpreted as the beach face formed at the base of the cliff proximal to the cliff-talus system and fed both by the colluvial debris flows and marine sediments deposited during storms (Fig. 8a, c) (Sanders, Reference Sanders2000; Sechi et al., Reference Sechi, Andreucci, Stevens and Pascucci2020). This facies does not show a good stratal organization suggesting that the beach face accumulated at the cliff base on a narrow marine terrace on hard limestone substrate.
Facies association Mpb: mixed pocket beach association
Facies association Mpb widely crops out on the eastern side of the study area, where it displays a maximum thickness of ~4.5 m and lies above facies association Tl (Fig. 9). Towards the SW, closer to the high cliff of S. Ignazio promontory, Mpb laterally grades into gravel-dominated deposits of facies association Rgb (Figs. 6, 7). Facies association Mpb is dominated by mixed sandy to gravelly well-stratified strata and characterized from land-to-sea by facies Semr, Gci, Seu, and Sedt (Fig. 3; Fig. 4).
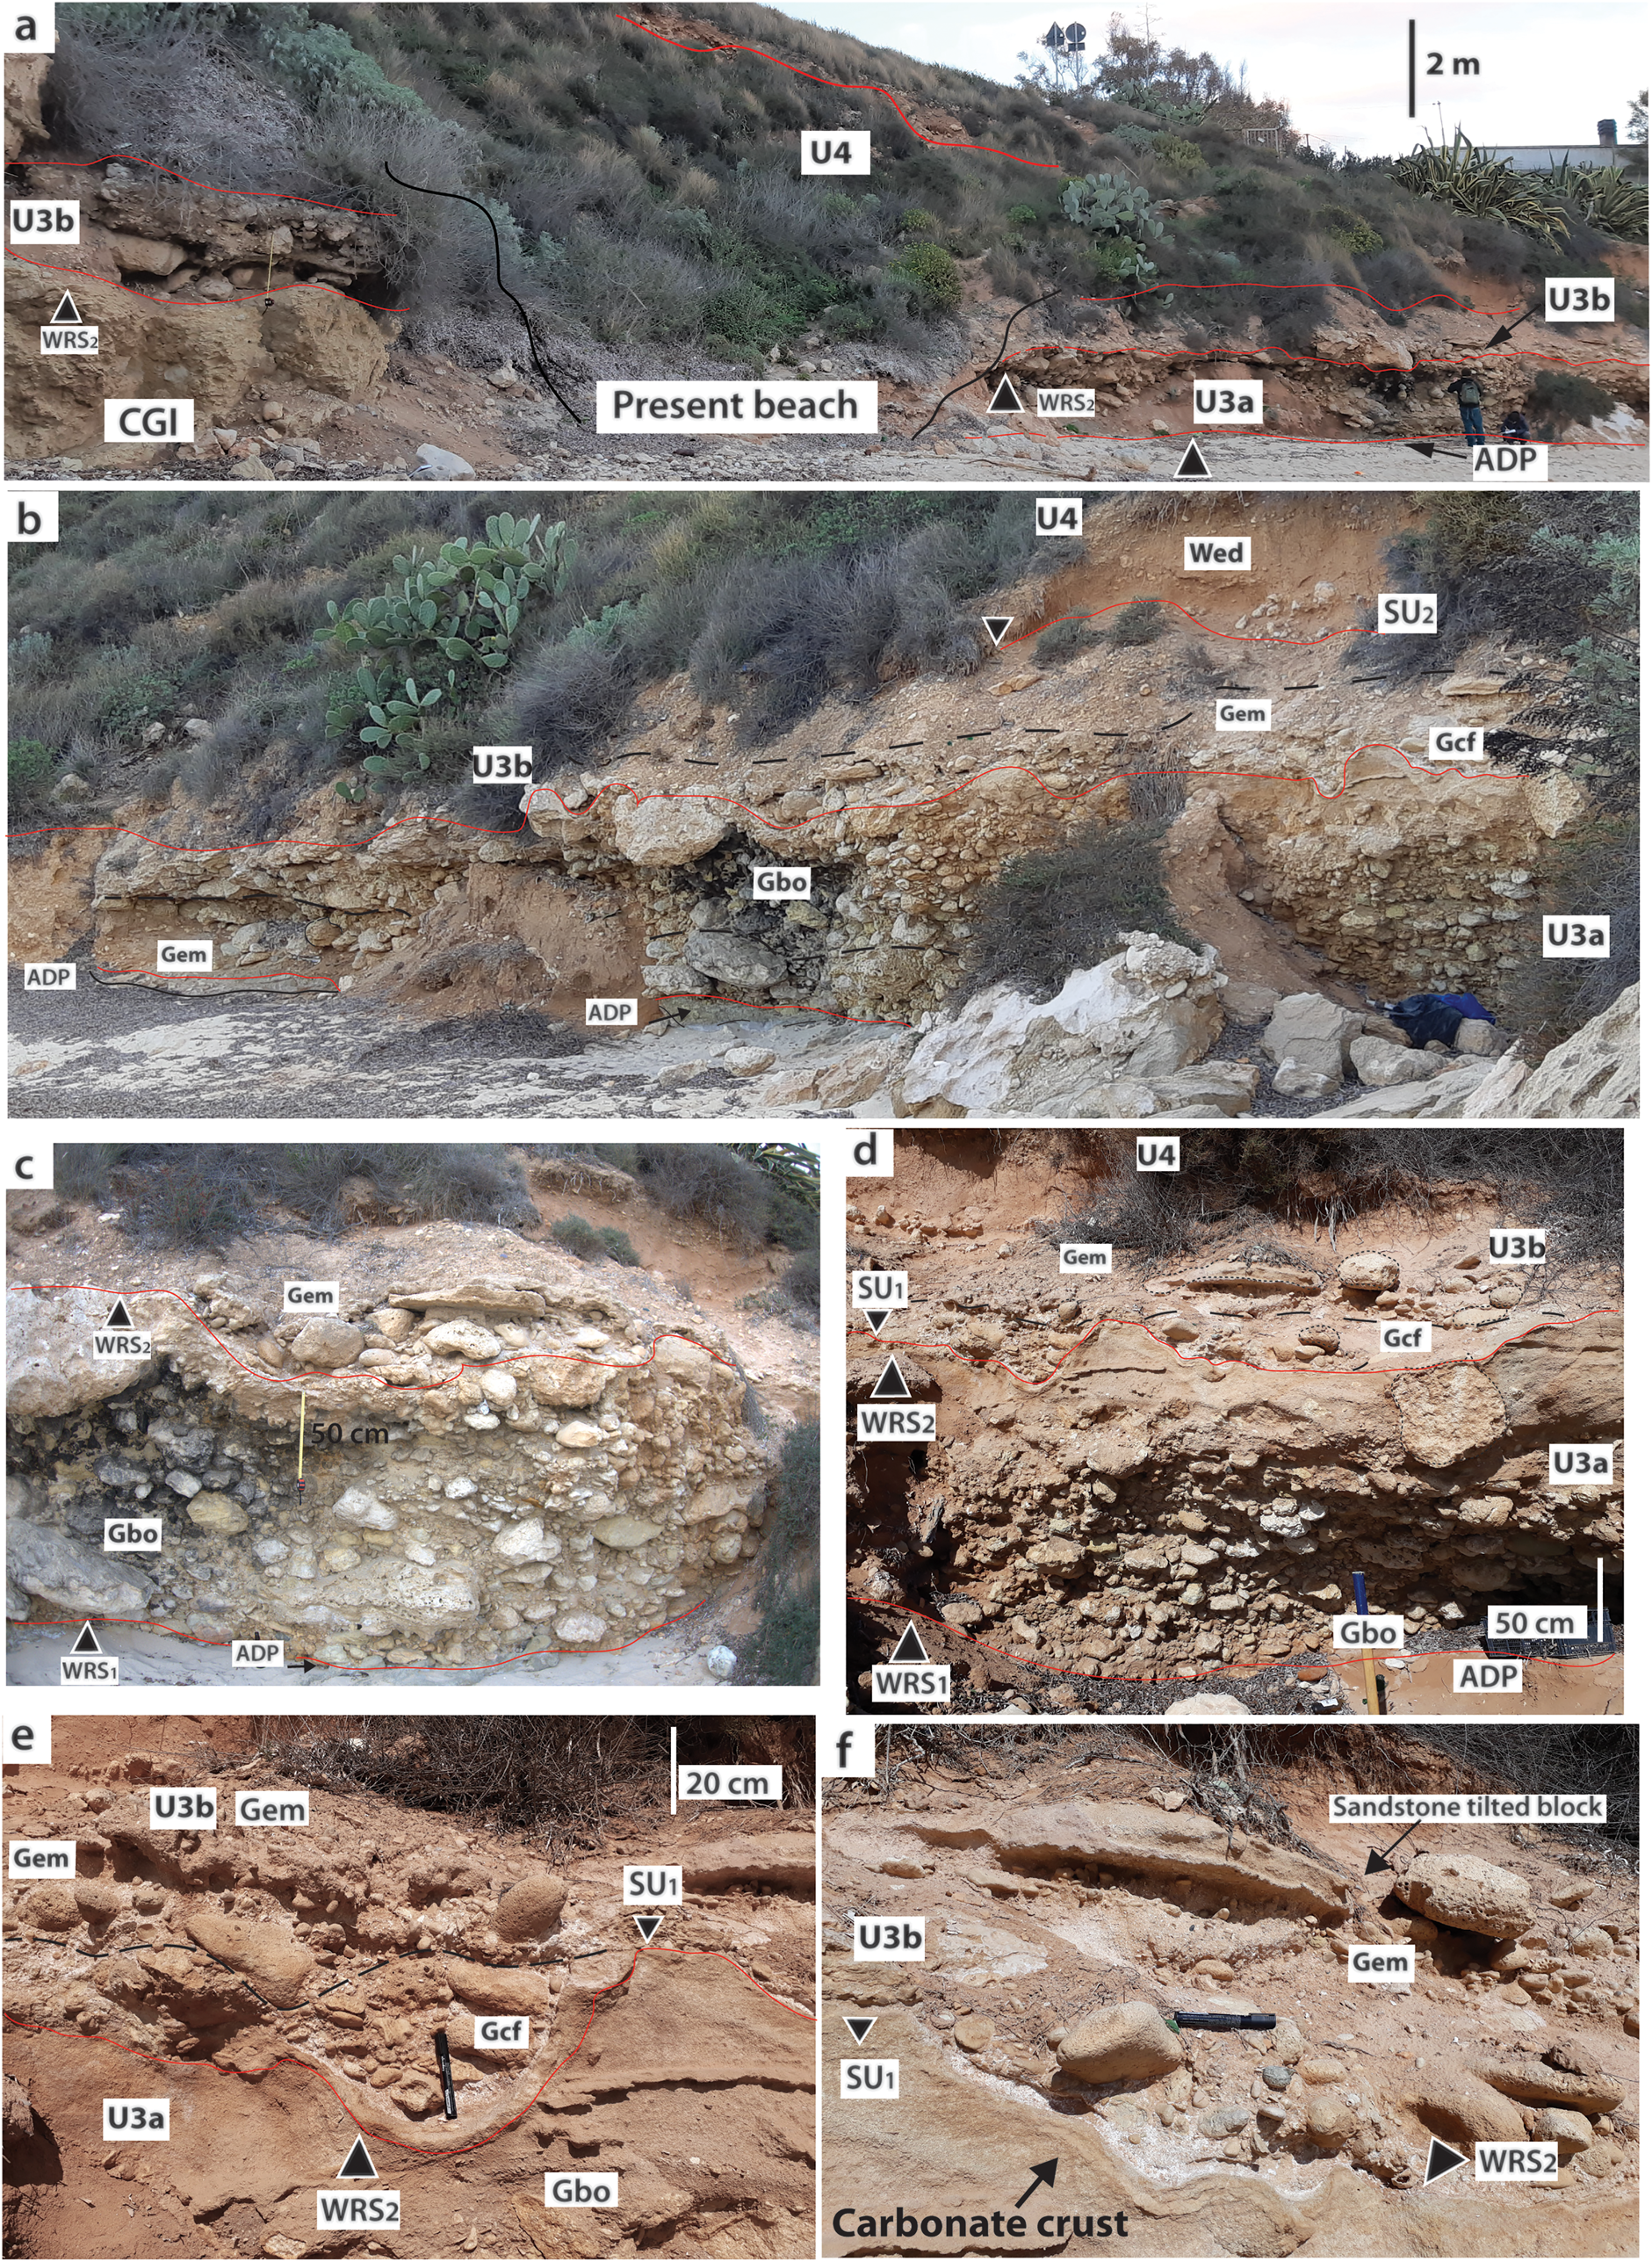
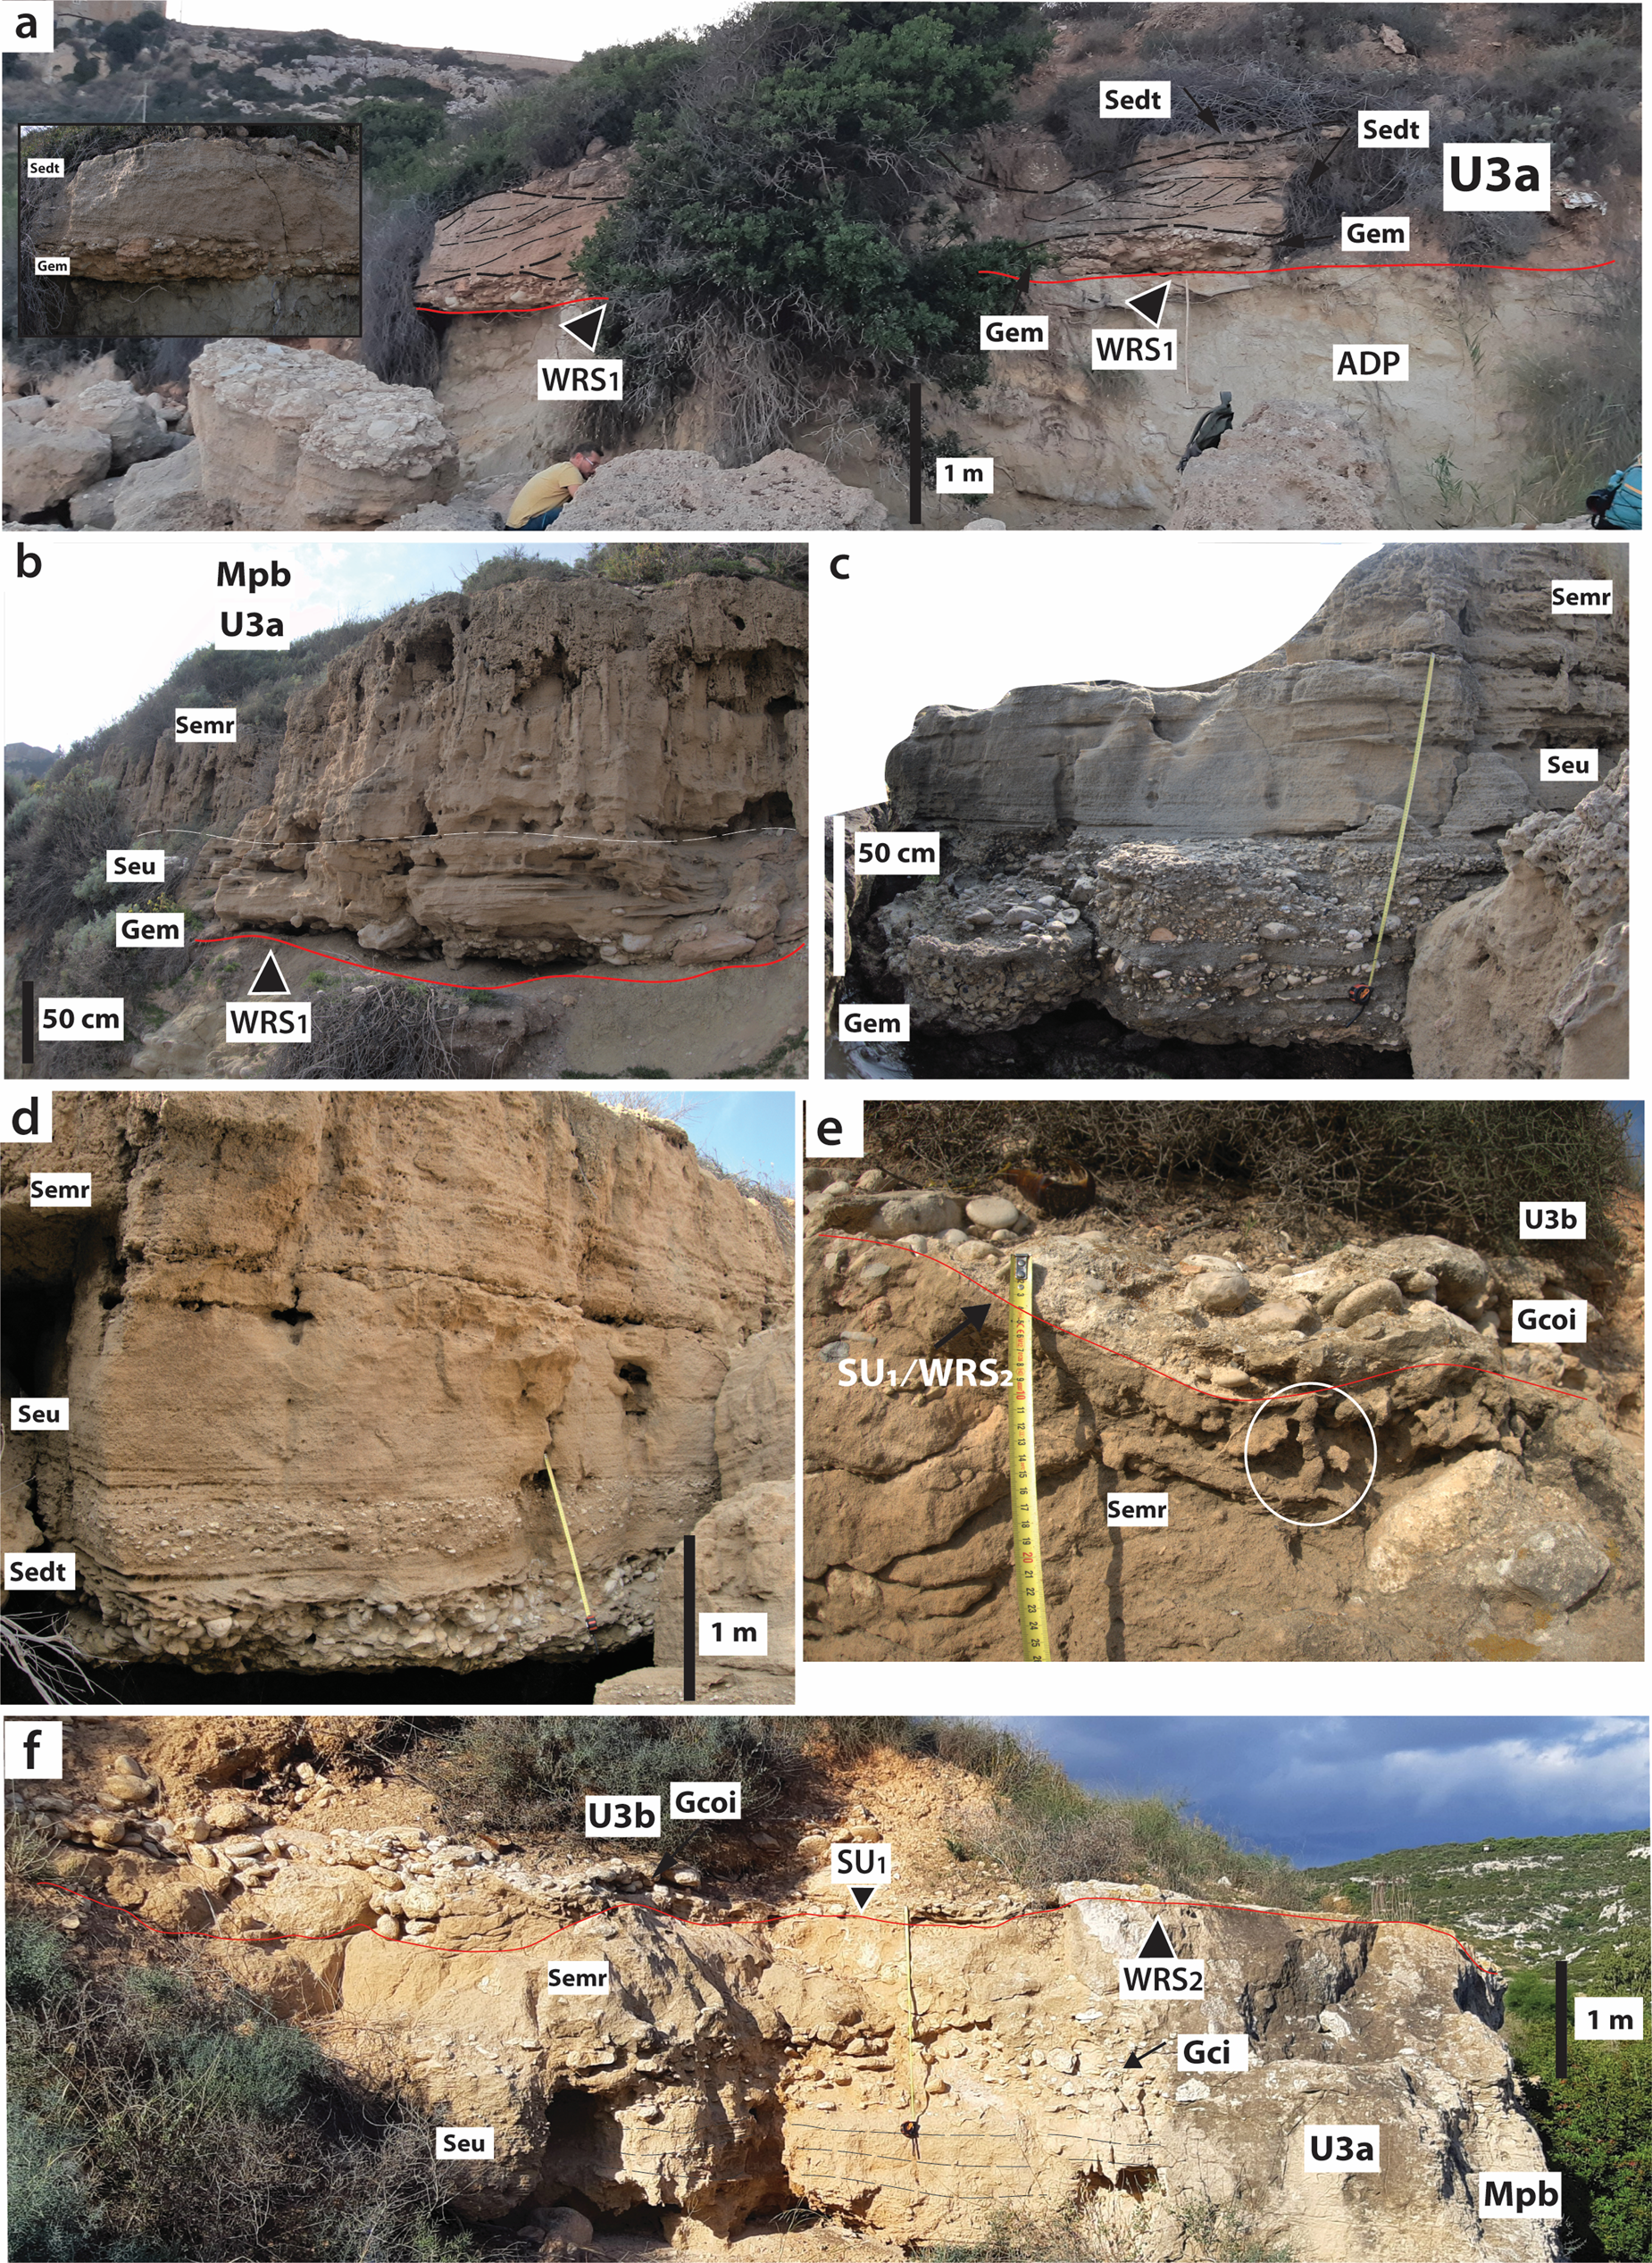
(a) Detail of upper shoreface deposit of Mpb, the transgressive lag deposit (Gem) at the base is unconformable on the ADP bedrock and cross-trough bedded sandstones of facies Sedt. Inset shows details of the transgressive lag and upper shoreface sedimentary structures. (b) Field view of facies association Mpb from the transgressive lag to the backshore environment (upward association of facies Gem, Seu, and Semr). WRS1 = first wave ravinement surface. (c, d) Details of facies association Mpb. (e) Field details of the composite surface SU1+WRS2 in facies Semr with fossil root trace (white circle) cut by gravel berm (facies Gcoi). (f) Field appearance of the composite terrace at the base U3a with facies association Mpb (Seu); beach face cut at the top by the composite surface SU1+WRS2 (red line) overlain by gravel berms (facies Gcoi).
Facies Semr: backshore
Facies Semr consists of a 1–2 m thick, poorly structured, well-sorted coarse- to medium-grained sandstone with rare and scattered rounded limestone pebbles. Pervasive plant root phytoturbation almost destroys the primary sedimentary structures. However, traces of flat laminations can still be discerned (Fig. 9b, d). Sedimentary structures become more evident moving seaward, and Semr grades into facies Gci and/or Seu.
Facies Gci: gravelly berms
Facies Gci is a 0.5–1 m thick openwork conglomerate comprising tabular beds or lenses of landward-imbricated, sub-rounded pebbles to cobbles, occasionally interlayered with strata of facies Seu (Figs. 8e, 9f).
Facies Seu: foreshore
Facies Seu consists of 1–1.5 m thick seaward dipping low-angle/parallel cross-laminated, well-sorted sandstone with scattered and/or aligned rounded pebbles, cm-thick layers of rounded granules, and broken or complete marine shells lying upside down. Heavy minerals are often aligned, forming a few millimeter thick dark laminae (Fig. 9c, d). This facies is occasionally interlayered with strata of facies Sedt.
Facies Sedt: upper shoreface
Facies Sedt is a 30–50 cm thick wavy sinuous, often trough-cross bedded coarse- to medium-grained sandstone interlayered with 10–20 cm thick layers of rounded granules and pebbles rich in fragments of seashells and sparse small, disc-shaped cobbles (Fig. 9d).
Interpretation of Facies association Mpb and depositional profile
The relationship of facies association Mpb with the underlying deposits of facies association Tl and its internal strata architecture suggest that it can be interpreted as a mixed sandy/gravelly pocket beach system developed on a rocky shore (Fig. 4). Facies Semr represents the backshore part of the mixed beach system grading landward from the extraordinary storm berms zone toward the incipient dune field. The low-angle cross-stratification of facies Seu indicates that these deposits formed in the foreshore zone of the mixed beach system dominated by swash and backwash (Postma and Nemec, Reference Postma and Nemec1990; Pascucci et al., Reference Pascucci, Martini and Endres2009). The alternation of bioclastic-rich and black laminae is related to winnowing by fair-weather waves, while clast-supported conglomerates (Gci) represent berm accumulations during storms (Sechi et al., Reference Sechi, Andreucci and Pascucci2013, Reference Sechi, Andreucci, Stevens and Pascucci2020) (Fig. 8e). The pervasive lithofaga boring testifies that clasts spent a significant period underwater before being carried onshore by major storms. Finally, facies Sedt is characterized by trough cross-stratification and sandy/gravelly bars most likely developed in the upper shoreface dominated by longshore currents. The occasional planar layers of granules and/or cross-stratified beds are interpreted as related to major storm events. The rock fragments were reworked from the nearby limestone cliff and/or carved from the sandstone shore platform. Facies association Mpb shows a clear shallowing-upward trend with trough-and-bar strata (upper shoreface) passing gradually into low-angle, cross-stratified sandy/gravelly bodies (foreshore and berms), and finally into structureless sandstone deposits (backshore).
Overall, Mpb is a prograding (normal regressive phase) mixed sandy/gravelly beach system (Fig. 4). The lateral variation from facies association Mpb to a gravelly beach system of Rgb is most likely due to the interplay between the paleotopography of the bay and wave currents. In particular, along the bay flanks and at the toe of the cliff, a gravel-dominated beach system developed, whereas the mixed sandy/gravelly deposits tend to be preferentially accumulated at the center of the bay, as occurs on several modern pocket beaches (Pascucci et al., Reference Pascucci, Sechi and Andreucci2014).
Facies association Cs: Cliff slope deposits
Facies association Cs crops out along the study area with a maximum thickness of ~8 m on the southwestern side and rests unconformably on the bedrock or facies association Rgb (Fig. 8a). Cs is mainly formed by alternation of facies Gdw and Wed (Fig. 3).
Facies Gwd: Cliff slope debris flow and rockfall deposits
Gwd is composed of meter-thick tabular strata or meter-wide lenses of normally graded matrix-supported breccia (Fig. 8a). It occurs as strata inclined at >30°, characterized by disorganized fining-upward, clast-supported framework with reddish to brownish sandy-silt matrix. Clasts reflect the cliff bedrock lithology ranging in size from pebbles to boulders, which are angular to subangular shaped.
Facies Wed: Cliff slope colluvial deposits
Facies Wed is characterized by a 0.5–1 m thick tabular or lenticular layer of medium- to fine-grained sand to siltstone with aligned very angular pebbles to cobbles at the base. Angular dispersed boulders may be present (Fig. 8a).
Interpretation of facies association Cs and depositional profile
Facies association Cs is interpreted to represent rock falls along the cliff flank, alternating with some generation of colluvial/incipient soil accumulated in concave-up depressions (Andreucci et al., Reference Andreucci, Panzeri, Martini, Maspero, Martini and Pascucci2014).
LUMINESCENCE CHRONOLOGY
The pIRIR225 ages derived for the specific samples are summarized in Table 1 and Figure 5. Samples CLM1 and CLM2 were collected on the northeastern side of the study area from the base (~3.5 m above present sea level = asl) and the top (~5 m asl) of mixed sandy/gravelly beach system (facies association Mpb; Logs 3 and 4 of Fig. 5). Derived pIRIR225 ages are 137 ± 7 ka and 134 ± 7 ka, respectively, showing an excellent consistency with each other (within errors) and with the previously published U/Th and amino acid racemization (AAR) ages of 139 ± 10 ka, 138 ± 8 ka, and 122 ± 5 ka (Ulzega and Hearty, Reference Ulzega and Hearty1986; Belluomini and Delitala, Reference Belluomini and Delitala1988; Coltorti et al., Reference Coltorti, Barca and Melis2007, Reference Coltorti, Pieruccini, Montagna and Zorzi2015). Sample CLM3 was collected on the southwestern side at the base of the cliff beach deposit (~1.8 m asl) of the gravelly beach system (facies association Rgb; Log 10 of Fig. 5) and gave a pIRIR225 age of 92 ± 6 ka.
STRATIGRAPHY AND BOUNDING SURFACES
Lateral correlations along the study area with the facies association stacking patterns, key discontinuity surfaces, and luminescence ages indicate the presence of three major unconformity-bounded units: U3a, U3b, and U4 (Fig. 5).
The lowermost unit, U3a, rests unconformably on the Miocene sandstone substrate (ADP; Figs. 5, 9a) and is bounded at the base by a smooth erosional surface cropping out from the NE to the center of the study area (Logs 1–6, Fig. 5). Unit U3a is characterized at the base by deposits of facies association Tl mantling the erosional surface on ADP. On the northeastern side of the bay (Logs 1–5, Fig. 5), unit U3a consists of a 3–4 m thick, well-developed mixed beach system (facies association Mpb), showing a clear shallowing-upward trend (progradation) from the upper shoreface to the backshore deposits (Fig 4, 5, 10). The erosional surface is interpreted as a wave ravinement surface (WRS1) developed during a transgression (sensu Zecchin et al., Reference Zecchin, Catuneanu and Caffau2019) (Fig. 10).
(a) Global sea-level curve from Waelbroeck et al. (Reference Waelbroeck, Labeyrie, Michel, Duplessy, McManus, Lambeck, Balbon and Labracherie2002) and Shackleton (Reference Shackleton2000); for the MIS 5e plateau, we use data from Sechi et al. (Reference Sechi, Andreucci, Stevens and Pascucci2020); for Sardinia and for Holocene sea transgression, we use data from Pascucci et al. (Reference Pascucci, De Falco, Del Vais, Sanna, Melis and Andreucci2018). The figure highlights the position of formation of accommodation space (A), sediment supply, and marine deposition related to sea-level fluctuation and inferred local tectonics. Arrows indicate the direction of the Cala Mosca block movements related to sea level. (b) Schematic showing how the marine terrace sedimentary cover may have preserved the recognized marine episodes and stratigraphic units (U3a, U3b) under the proposed model of differential local tectonics. Two small-scale marine cycles and key sequence boundaries are reported, along with the different depositional environments, depending on sea-level fluctuations. SU = subaerial erosive surface; WRS = wave ravinement surface; A = accommodation space available; SL = sea-level position.

From the NE to the central part of the bay towards the SW, a few cm-thick calcrete beds associated with a reddish palaeosol mantle the top of the U3a and mark a period of subaerial exposure (SU1, Logs 1–7, Fig. 5). At the center of the study area (Logs 6, 7, Fig. 5), U3a is characterized from the base upward by facies association Tl (transgressive lag) grading into a rocky gravelly beach system (facies association Rgb) (Figs. 4, 5, 8a–c). Unit U3a from the center toward the NE side is overlain by unit U3b, which does not crop out on the SW side of the study area (Figs. 5, 7, 8) and has luminescence ages of 137 ± 7 ka and 134 ± 7 ka (CLM1, CLM2, Table 1), and thus is referred to substage MIS 5e. U3b rests on, and is bounded by a second erosional surface at the base. U3b is observable along the entire study area, slightly increasing in elevation from SW (1 m asl) to NE (5 m asl; Fig. 5). U3b is mainly composed of transgressive deposits (facies association Tl; Figs. 4, 5, 7, 8), and along the inland part of the bay by extraordinary gravel-berm relict deposits (facies Gcoi) (Fig. 9e, f). This deposit lies unconformably on the subaerial surface SU1 at the top of U3a. The erosional surface on the NE side of the study area cuts the top of lithified U3a and forms erosional potholes (facies Gcf), which are draped by a few-cm thick carbonate crust and filled by facies Gcf (Fig. 9e, f). The second erosional surface represents a wave ravinement surface (WRS2) related to a second sea-level transgression. The WRS2 almost obliterates and reworks the first subaerial surface SU1. However, traces of SU1 are still observable as calcrete crust. The interplay of the two surfaces is interpreted as a composite surface (SU1 + WRS2) (sensu Nalin et al., Reference Nalin, Massari and Zecchin2007) (Fig. 9f). On the southwestern part of the bay, U3b is bounded at the base solely by WRS2, and it rests unconformably on the Miocene limestone substrate (Figs. 5, 8). In places, traces of pothole structures mantled by transgressive deposits (facies association Tl) can be observed at the base. Here, U3b mainly consists of ~1 m of rocky cliff talus to incipient gravel beach deposits (facies Gtf, facies association Rgb; Figs. 4, 8). A luminescence age of 92 ±6 ka (CLM3) indicates that U3b was formed during the MIS 5c substage. The subaerial surface SU2 separates the top of U3b from U4 (Figs. 5, 8a). The U4 is characterized by cliff slope deposits (Cs facies association) comprised of an alternation of debris flow and rockfall (Gwd) with meter-scale colluvial deposits (facies Wed) (Fig. 10a, c). Subaerial surface SU2 most likely developed during a sea-level fall, and the overlying deposits (U4) could be associated with cold/glacial phases during MIS 5b or the following MIS 4–MIS 2.
ELEVATION OF PALEO SEA-LEVEL MARKERS
Luminescence chronology indicates that the shallow marine sediments of U3 and U3b formed as a result of sea level fluctuations during MIS 5e (135–115 ka, U3a) and MIS 5c (ca. 100 ka, U3b). The stratigraphic superimposition of MIS 5c on MIS 5e has been observed in other areas along the NW coast of Sardinia. In particular, the relict sandy beach deposits of MIS 5c are superimposed on MIS 5e deposits, which crop out as sandy beach deposits or algal ridge bioconstruction (deposit build-up by intertidal red coralline algae) (Andreucci et al., Reference Andreucci, Clemmensen, Murray and Pascucci2010a; Sechi et al., Reference Sechi, Andreucci and Pascucci2013, Reference Sechi, Andreucci and Pascucci2018b, Reference Sechi, Andreucci, Stevens and Pascucci2020; Pascucci et al., Reference Pascucci, Sechi and Andreucci2014; Zucca et al., Reference Zucca, Sechi, Andreucci, Shaddad, Deroma, Madrau, Previtali, Pascucci and Kapur2014b). Moreover, uplifted MIS 7 marine terraces and related beach cover placed above the present sea level between 0.6 ± 1 m and 2.9 ± 0.2 m has been reported by Andreucci et al. (Reference Andreucci, Pascucci, Murray and Clemmensen2009) and Casini et al. (Reference Casini, Andreucci, Sechi, Huang, Shen and Pascucci2020).
Cemented beach deposits have been used as relative sea level (RSL) indicators in many MIS 5e studies (Pedoja et al., Reference Pedoja, Husson, Johnson, Melnick, Witt, Pochat and Nexer2014, and references therein). The paleo relative sea level (pRSL), uncorrected for glacial isostatic adjustment (GIA) for the double relict beach deposits, is here estimated for Sardinia based on Rovere et al. (Reference Rovere, Raymo, Vacchi, Lorscheid, Stocchi, Gómez-Pujol, Harris, Casella, O'Leary and Hearty2016, equations [1]–[4]).
To calculate pRSL, equations consider different parameters of processes acting near modern mean sea level environments, which shape both rocky and sedimentary coasts (e.g., the tide amplitude, the elevation of sea level indicator [measured in the field] and the mean high water height [calculated average of the elevation of the lower and upper limit of water height]). The choice of upper and lower limits depends on the morphology of the deposit studied (Rovere et al., Reference Rovere, Raymo, Vacchi, Lorscheid, Stocchi, Gómez-Pujol, Harris, Casella, O'Leary and Hearty2016).
For our calculation, field elevations (E) of sea level indicators are based on the elevations measured using a meter tape and the facies and stratigraphic interpretation. In the absence of a modern analogue, to calculate some of the parameters needed for pRSL calculation, we considered the elevations of the wave ravinement surfaces as the wave-breaking depth (the point of interaction between approaching waves and sea floor) as the lower limit of beach deposits, and the relict beach berms (facies Gci) as the upper limits. An error of ±10% of elevation to the measurement method and the average significant wave height (Hs 1.2 m) along with the tidal range (0.35m Cagliari tidal gauge) was used to solve the equations (Stocchi et al., Reference Stocchi, Vacchi, Lorscheid, de Boer, Simms, van de Wal, Vermeersen, Pappalardo and Rovere2018). The average calculated pRSLs (GIA-uncorrected) for sea level markers for the NW coast of Sardinia are 2.15 ± 0.9 m (MIS 5c) and 3.3 ± 0.6 m (MIS 5e), respectively, while pRSLs calculated for Cala Mosca differ slightly from these and are 5.8 ± 1 m (MIS 5c) and 5 ± 1 m (MIS 5e), respectively.
DISCUSSION
The composite terrace, regional tectonics, and sea-level marker at Cala Mosca
The revised stratigraphic analysis performed on the marine sedimentary deposits of the Cala Mosca marine terrace indicates the presence of two unconformably superimposed shallow marine depositional units (U3a and U3b) bounded at their base by two ravinement surfaces, WRS1 and WRS2. WRS1 cuts the top of the pre-Quaternary substrate, while WRS2 cuts the top of U3a and is the base of the second unit (U3b). Unit U3a is partially reworked, and U3b lies at the same elevation as U3b (i.e., at ~5 m asl). The interaction between the WRS2 and the older SU1 surface forms a composite unconformable surface (WRS2 + SU1). Recognition of the composite bounding (unconformities) surface led to the term for the marine terrace of Cala Mosca as a “composite marine terrace,” characterized by two superimposed shallow marine units.
This stratigraphic framework agrees with that previously reported by Hearty (Reference Hearty1986), who observed the presence of double beach deposits and interpreted them as the consequence of millennial-scale sea-level fluctuation within MIS 5e (Hearty et al., Reference Hearty, Hollin, Neumann, O'Leary, McCulloch, O'Leary and McCulloch2007). However, this hypothesis remains controversial owing to uncertainties of the corrected estimation of paleosea markers, post-depositional tectonic vertical motions, precise age estimation reliability, and the contribution of glacial isostatic adjustment (Barlow et al., Reference Barlow, McClymont, Whitehouse, Stokes, Jamieson, Woodroffe and Bentley2018; Mauz et al., Reference Mauz, Shen, Elmejdoub and Spada2018; Stocchi et al., Reference Stocchi, Vacchi, Lorscheid, de Boer, Simms, van de Wal, Vermeersen, Pappalardo and Rovere2018).
Our luminescence chronology indicates that shallow marine sediments of U3a were deposited during MIS 5e (137 ± 7 ka, 134 ± 7 ka) and those of U3b during MIS 5c (92 ± 6 ka) substages. The age of U3a agrees with the previous U-series and amino acid racemization ages (139 ± 10 ka, 138 ± 8 ka, and 122 ± 5 ka) (Hearty, Reference Hearty1986; Ulzega and Hearty, Reference Ulzega and Hearty1986; Belluomini and Delitala, Reference Belluomini and Delitala1988; Coltorti et al., Reference Coltorti, Barca and Melis2007). The MIS 5e mean sea level peaked 5–9 m higher than the present, while during MIS 5c the coastline at the time of its formation was ~22 m lower than the present (Fig. 10a) (Waelbroeck et al., Reference Waelbroeck, Labeyrie, Michel, Duplessy, McManus, Lambeck, Balbon and Labracherie2002; Kopp et al., Reference Kopp, Simons, Mitrovica, Maloof and Oppenheimer2009; Dutton and Lambeck, Reference Dutton and Lambeck2012; Dutton et al., Reference Dutton, Carlson, Long, Milne, Clark, DeConto, Horton, Rahmstorf and Raymo2015). However, this contrasts with the observed field evidence and opens different questions. (1)Is Sardinia as tectonically stable as previously considered? (2) Is the sea level curve of the Mediterranean region well constrained? (3) Does Sardinia record local sea-level fluctuations that differ from those at the global scale? If the island has been tectonically stable at least since the Pleistocene, one of the major causes of the differences between RSL indicators and the global sea level (GSL) curve might be related to GIA effect.
A compilation of field data related to the GIA rebound has placed the peak of MIS 5e sea level between 2–2.5 m at Cala Mosca (Stocchi et al., Reference Stocchi, Vacchi, Lorscheid, de Boer, Simms, van de Wal, Vermeersen, Pappalardo and Rovere2018). The modeling, however, was based on the assumption of elevation of the MIS 5e double beach interpretation of Hearty (Reference Hearty1986). By contrast, the MIS 5c- and MIS 5a-dated sea-level indicators are less constrained than MIS 5e, and the lack of available GIA correction for this time period makes it challenging to compare the regional to global data for the Mediterranean Sea. Nevertheless, Creveling et al. (Reference Creveling, Mitrovica, Clark, Waelbroeck and Pico2017) placed these two between −24 m and +2 m, and between −22 and +1 m, respectively, using a large dataset of globally distributed sites. This uncertainty makes it difficult to place the Cala Mosca MIS 5c deposits into the global pattern of sea level.
Stratigraphic superimposition of MIS 5c on the MIS 5e sea highstands conflicts with sea-level fluctuations that occurred within the MIS 5 stage (Fig. 10a) and with what might be expected for a stable region such as Sardinia (Antonioli et al., Reference Antonioli, Ferranti and Kershaw2006; Ferranti et al., Reference Ferranti, Antonioli, Mauz, Amorosi, Dai Pra, Mastronuzzi and Monaco2006; Rovere et al., Reference Rovere, Raymo, Vacchi, Lorscheid, Stocchi, Gómez-Pujol, Harris, Casella, O'Leary and Hearty2016). Shallow marine deposits related to MIS 5c and stratigraphically superimposed on the MIS 5e deposits were observed in other areas along the Sardinian coast (Andreucci et al., Reference Andreucci, Clemmensen, Murray and Pascucci2010a; Sechi et al., Reference Sechi, Andreucci and Pascucci2013, Reference Sechi, Andreucci, Stevens and Pascucci2020). Moreover, a tilted MIS 5e notch and different fault-bounded domains recording vertical movements offsetting shallow marine deposits of MIS 5e and MIS 7 have been reported for the northwest and east coasts of Sardinia (Mariani et al., Reference Mariani, Braitenberg and Antonioli2009; Buttau et al., Reference Buttau, Fanelli, Funedda, Ibba, Loi and Pillola2011; Cocco et al., Reference Cocco, Andreucci, Sechi, Cossu and Funedda2019; Casini et al., Reference Casini, Andreucci, Sechi, Huang, Shen and Pascucci2020). Recent high-resolution DGPS measurements also showed a significant variability of vertical velocities along the western Sardinia coast, with a few sites recording localized uplift at moderate rates (1.6 ± 0.6 mm/yr to 1.0 ± 0.3 mm/yr; Antonioli et al., Reference Antonioli, Anzidei, Amorosi, Presti, Mastronuzzi, Deiana and Falco2017) and occurrence of low-magnitude earthquakes (M <4.5) along the Campidano graben (Rovida et al., Reference Rovida, Locati, Camassi, Lolli and Gasperini2020).
The evidence suggests different possible scenarios. (1) If Sardinia, as a whole block, was tectonically stable and affected only by slow subsidence (negative displacement) according to the worldwide standard sea-level curve and GIA model for the central-western Mediterranean (Vacchi et al., Reference Vacchi, Marriner, Morhange, Spada, Fontana and Rovere2016), the MIS 5c marine terraces should be placed at −22 m or lower under continuous subsidence. The MIS 5e marine terraces should be placed at +5–9 m under stable conditions, or at lower positions under active subsidence (Fig. 10a). In this case, it is necessary to admit that highstand peaks (MIS 5c and MIS 5a) that occurred after MIS 5e are still not well constrained in amplitude and elevation (Creveling et al., Reference Creveling, Mitrovica, Clark, Waelbroeck and Pico2017) and/or that the Quaternary RSL curve in the Mediterranean is characterized by unrecognized high-frequency sea-level oscillations below the sensitivity of presently available dating methods (Pasquetti et al., Reference Pasquetti, Bini, Giaccio, Ratti, Vacchi and Zanchetta2021). (2) If, by contrast, we assume a continuous regional uplift (positive displacement) as the driving factor in rising the MIS 5c to the present, the MIS 5e beach deposits would have risen to a higher elevation (~27–31 m) with a 0.27 mm/yr rate with a down-stepping terrace staircase pattern (Ferranti et al., Reference Ferranti, Burrato, Sechi, Andreucci, Pepe and Pascucci2021).
Because the two highstands, MIS 5e and MIS 5c, differ in time, amplitude, and position, we have to infer that Sardina is not an entirely stable block, but is characterized by fault-bounded domains that have been affected by local vertical movements (negative and/or positive), with respect to the regional setting. This scenario might include syn-depositional interaction between positive and negative vertical movements triggered by the Quaternary tectonic evolution of the Campinano graben domain (Ferranti et al., Reference Ferranti, Oldow, D'Argenio, Catalano, Lewis, Marsella, Avellone, Maschio, Pappone, Pepe and Sulli2008; Cocco et al., Reference Cocco, Funedda, Patacca and Scandone2013, Reference Cocco, Andreucci, Sechi, Cossu and Funedda2019). The combination of local subsidence due to lateral-shear deformation of the southern sector of the basin with slow regional uplift led to differential vertical movements of the structural horst and graben forming the Cagliari area (Valensise and Pantosti, Reference Valensise and Pantosti1992; Doglioni and Prosser, Reference Doglioni and Prosser1997; Thompson and Parsons, Reference Thompson and Parsons2016).
At first, syn-depositional MIS 5e negative vertical movement ([subsidence + high fault slip rate] > regional uplift) offset the Cala Mosca horst downward and brought the MIS 5e deposits to the MIS 5c sea-level position (i.e., 22 m below the present). Later, positive (low regional uplift > [subsidence + slip rate]) uplifted the horst and the composite terrace to the present sea-level position (Fig. 10b).
In conclusion, the chronostratigraphic framework of the Cala Mosca marine section, together with other areas along the Sardinia coast, mismatches with the model of Quaternary regional stability of the whole Sardinia block and suggests that the island is characterized by several fault-bounded domains that were affected by local vertical movements during the Pleistocene (Mariani et al., Reference Mariani, Braitenberg and Antonioli2009; Cocco et al., Reference Cocco, Funedda, Patacca and Scandone2013, Reference Cocco, Andreucci, Sechi, Cossu and Funedda2019; Casini et al., Reference Casini, Andreucci, Sechi, Huang, Shen and Pascucci2020). Although this model seems to be the simplest explanation and our preferred alternative, different questions remain unaddressed, and further investigations need to be carried out at the regional scale.
CONCLUSIONS
Detailed facies analysis and stratigraphic interpretation of Pleistocene terraced marine deposits of Cala Mosca have allowed us to recognize the presence of a composite marine terrace. This is characterized by two unconformably superimposed depositional marine units (U3a and U3b) bounded at the base by two different ravinement surfaces (WRS1 and WRS2). Surface WRS1 cuts the top of the pre-Quaternary substrate, while WRS2 is formed at the top of U3a and bounds the bottom of the second marine deposit (U3b). During deposition of unit U3b, it partially reworked U3a, and reoccupied almost the same stratigraphic position now at ~5 m above present sea level. Luminescence chronology (pIRIR225 protocol) dated U3a to MIS 5e substage (137 ± 7, 134 ± 7 ka), which is in good agreement with independent ages obtained with the U/Th and AAR methods, and pIRIR225 protocol dated unit U3b to MIS 5c (92 ± 6 ka).
The superimposition of the two units and their stratigraphic position above present sea level suggest different scenarios in which high-frequency sea-level oscillation and tectonic activity that occurred during MIS 5 have to be considered. This leads to alternative hypotheses that might explain the present chronostratigraphic framework. (1) The two MIS 5c and MIS 5a highstands are still not well constrained in amplitude and elevation and the well-established and widely accepted/documented position of MIS 5e substage. (2) The Quaternary relative sea level curve of the Mediterranean region is characterized by unrecognized high-frequency oscillations, mostly occurring below the sensitivity of the presently available dating methods. (3) Late Quaternary deposition in Sardinia was controlled by localized vertical uplift and subsidence.
Whichever is the preferential hypothesis, recognition of composite unconformity surfaces and the measured chronological data for the Cala Mosca Pleistocene marine deposits indicate that the site cannot be linked to a single sea-level highstand, and thus used to reconstruct sea-level fluctuations for MIS 5e. In this scenario, recognizing erosional structure and bounding surfaces such as composite surfaces is needed to discern a single marine terrace from one concealing more than one sea level event. Composite marine terraces may highlight undetected local tectonic activity that must be considered when using relict beach deposits as paleo sea-level indicators.
Supplementary Material
The supplementary material for this article can be found at https://doi.org/10.1017/qua.2022.45
Financial Support
This research was supported by funds and financial support to SA, VP, and DS provided by a grant from Reagione Autonoma Sardegna: L.R. 7/2007, Bando 2017—Cambiamenti climatici e neottettonica—La Sardegna un continente semi stabile (P.I. V. Pascucci). Partial funding to VP has been provided by Fondo di Ateneo per la Ricerca 2020 and to SA by Project FdS 2020.


 Open access