


Lipid metabolism plays an important role in maintaining energy homoeostasis, and its disorder causes some metabolic diseases such as fatty liver, type 2 diabetes and cardiovascular disease(Reference Peirce, Carobbio and Vidal-Puig1–Reference Zechner, Zimmermann and Eichmann4). Lipolysis, also called hydrolysis of TAG, is the core process of lipid metabolism(Reference Montagner, Polizzi and Fouché5), and it is defined as the biochemical process by which TAG is broken down into fatty acids (NEFA) and glycerol under the function of multiple enzymes(Reference Schweiger, Schreiber and Haemmerle6,Reference Lafontan and Langin7) . The three main neutral lipases: adipose triglyceride lipase (ATGL), hormone-sensitive lipase (HSL) and monoglyceride lipase participate in the process of hydrolysing TAG into FA(Reference Recazens, Mouisel and Langin8). The first step of TAG hydrolysis was catalysed by ATGL to provide FA and diglycerides (DG)(Reference Haemmerle, Moustafa and Woelkart9,Reference Granneman, Moore and Krishnamoorthy10) . HSL also have the capacity of hydrolysing TAG to DG, but it is mainly responsible for the hydrolysis of DG to monoglycerides (MG)(Reference Gaidhu, Anthony and Patel11–Reference Lampidonis, Rogdakis and Voutsinas13). Monoglyceride lipase, as its name indicates, hydrolyses MG to FA and glycerol(Reference Scalvini, Piomelli and Mor14). Lipolysis is a critical process controlling the mobilisation and storage of TAG. Unlike ATGL and monoglyceride lipase, HSL is the only lipase directly regulated by neuro-humoural signalling(Reference Garton, Campbell and Cohen15,Reference Tsiloulis and Watt16) . The regulatory domain of HSL has sites of reversible phosphorylation and could be regulated by the cAMP/PKA pathway(Reference Garton, Campbell and Cohen15). Pro- and anti-lipolytic hormones, such as catecholamines and insulin, respectively, can control the intracellular levels of cAMP to regulate the activity of cAMP-dependent protein kinase (PKA). PKA can lead to phosphorylation of HSL to increases its translocation from cytosol to the face of lipid droplets, significantly enhancing its lipolysis activity by conformational changes(Reference Recazens, Mouisel and Langin8). In addition, HSL shows a wide range of substrates as it effectively hydrolyses tri-, di- and monoglycerides, even cholesterol, and others substrates(Reference Kim, Yoo and Huong Luu Le17,Reference Krintel, Osmark and Larsen18) . All these features give HSL a key role in basal and stimulated lipolysis.
In humans, the clinical characteristics of the carrier with mutated HSL gene were firstly reported to be dyslipidemia, hepatic steatosis, systemic insulin resistance and diabetes(Reference Albert, Yerges-Armstrong and Horenstein19). Similarly, systemic Hsl-deficient mice have a higher risk of insulin resistance, hepatic steatosis and inflammation, showing that metabolic dysregulations in Hsl-deficient mice are also mainly driven by impaired Hsl function(Reference Mulder, Sorhede-Winzell and Contreras20,Reference Roduit, Masiello and Wang21) . In addition, adipose-specific Hsl deficiency mice showed hepatic steatosis, lipodystrophy, macrophage infiltration, and impaired FA oxidative activity(Reference Xia, Cai and Yang22). Some research has reported that Hsl-deficient mice showed greater susceptibility to obesity and lower ability to increase lipolysis under fasted or stimulated conditions(Reference Wang, Laurin and Himms-Hagen23,Reference Haemmerle, Zimmermann and Hayn24) . Therefore, it is no doubt that HSL is the essential enzyme for the maintenance of energy homoeostasis.
The metabolic patterns of different nutrients always keep a relative dynamic balance to maintain energy homoeostasis(Reference Marshall25). Changes in some key enzymes/proteins of lipid metabolism would inevitably lead to a remodelling of overall nutrient metabolism(Reference Walker, Sugden and Gibbons26,Reference Burri, Thoresen and Berge27) . For example, the deficiency of PPARα, which is a nuclear receptor to regulate lipid catabolism genes(Reference Montagner, Polizzi and Fouché5), reduced glucose utilisation and expressions of the genes related to glucose transporter, uptake and glycolysis(Reference Walker, Sugden and Gibbons26,Reference Cha, Han and Su28) . However, inhibiting the synthesis of l-carnitine, which plays a critical role in transporting long-chain fatty acids from the cytosol into mitochondria for fatty acid oxidation(Reference Desai, Singh and Sapkale29), could promote glucose utilisation and protein deposition through energy homoeostasis remodelling in fish(Reference Li, Li and Ning30). In the mice, the global deficiency of Atgl improved glucose and insulin tolerance and exhibited a better glucose uptake(Reference Morigny, Houssier and Mouisel31). These studies have shown the functions of different enzymes/proteins in the overall nutrient metabolism. However, as an important lipolysis enzyme, the functions of HSL in overall metabolism have not been evaluated in detail. Therefore, studying the effects of HSL on lipid, carbohydrate and protein metabolism could help people to further understand the nutritional regulatory functions of HSL.
Zebrafish (Danio rerio) is a classical animal model being widely used in human disease research and the elucidation of fundamental biological questions(Reference Den Broeder, Kopylova and Kamminga32–Reference Quinlivan and Farber35). Therefore, we choose zebrafish as a model to explore the systemic nutrient metabolism when hsl gene was knocked out. This could provide a theoretical basis for understanding the nutritional regulation of Hsl. In addition, excessive fat accumulation is already a severe problem in current aquaculture, causing many adverse effects, including lowered growth, metabolic disorders, impaired immune functions and stress resistance for farmed fish(Reference Li, Lu and Jiang36,Reference Yan, Liao and Wang37) . Hence, how to promote the ability of fish to mobilise fat has been a hot area for fish physiologists. Previous studies have shown that Hsl presents in fish and performs a similar lipolytic function to that of mammals(Reference Liu, Mai and Ai38–Reference Sun, Ji and Li40). In addition, the fish with excessive fat deposition are often accompanied by abnormal hsl expression(Reference Cruz-Garcia, Sanchez-Gurmaches and Bouraoui41–Reference Jin, Lu and Yuan44). Therefore, using zebrafish as a model to explore the functions of Hsl in fish could also help to understand the regulatory mechanisms of fish lipid metabolism. In the present study, we used either hsla-knockout or Hsl enzyme activity inhibitor to construct zebrafish models with Hsl dysfunction. By measuring the growth, swimming activity, oxygen consumption rate, biochemical changes, and the expressions of key genes and proteins in lipid, glucose and protein metabolism, the present study is the first to examine the roles of Hsl in systemic nutrient metabolism.
Materials and methods
Animal ethical approval
All animals were conducted following the Guide for the Care and Use of Laboratory Animals formulated by the Ministry of Science and Technology of China. The study was approved by the Committee on Ethics of Animal Experiments of East China Normal University (Approval ID: F20190101).
Animal source and maintenance
All adult zebrafish (0·4 to 0·5 g) with six months of age were obtained from the Institute of Hydrobiology, Chinese Academy of Sciences (Wuhan, China). Fish were maintained in a recirculating water system with mechanical filtration, and the cycle of 14 h light and 10 h dark at 28°C. After mating between healthy adult zebrafish, fertilised eggs were obtained to be kept in Petri dishes with static water at 28°C. Zebrafish larva were transferred to a recirculating water system 15 d post-fertilisation to feed twice a day with freshly hatched Artemia salina.
Establishment of hsla-knockout zebrafish line
The hsla-knockout zebrafish (lipea, NCBI: https://www.ncbi.nlm.nih.gov/gene/568368) were established using the CRISPR/Cas9 technique as described in our previous study(Reference Lu, Ma and Wang33). The CRISPR/Cas9 target sites were designed using the online tool (ZiFiT Targeter version 4.2, http://zifit.partners.org/ZiFiT/). The Cas9 messenger RNAs were obtained by in vitro transcription from pCS2-nCas9n using the mMESSAGE mMACHINE T3 kit (Invitrogen). Double-strand DNA for specific gRNA synthesis was amplified by PCR from pT7-gRNA. The target single-guide RNAs (sgRNAs) was produced using TranscriptAid™ T7 High Yield Transcription Kit (Thermo Scientific). T Cas9 messenger RNA and sgRNA were mixed in proportion and injected into one-cell-stage embryos using the Picoliter Microinjector PLI-100A (Warner Instruments). The F0 founders carrying mosaic mutations were identified by high-resolution melt analysis and heteroduplex motility assay and mated with WT zebrafish to produce heterozygous F1 offspring. The heterozygotes were allowed to self-cross to acquire the homozygous mutants (F2), resulting in the deletion of –7 bp fragment on the target sites (online Supplementary Fig. 1). The hsla mutation locus was confirmed by genomic DNA sequencing. After the natural mating of F2, the homozygous hsla knockout (hsla -/-) line (F3) was obtained to produce enough offspring for the subsequent experiment.
Experimental design
To explore the role played by Hsl in zebrafish metabolic homoeostasis, we used gene knockout and Hsl inhibitor separately to verify the effects of Hsl dysfunction on systemic nutrient metabolism. In the present study, only male zebrafish was used consistently for experiments to avert the effect of sex difference.
For the first experiment, the constructed hsla-knockout zebrafish were raised with Artemia salina to mature for 3 months. The obtained ninety male zebrafish of each genotype with similar weight (WT and hsla -/-: 38 ± 1 mg) were allocated randomly to three 200-litre aquariums for the growth trial (n 3). All tanks were conducted in a recirculating system. Both WT and hsla -/- fish were fed with a purified basic diet at a feeding rate of 4 % body weight two times per d (10.00 and 18.00) for 5 weeks. The formulation of the basic diet is presented in the Table 1. Casein was used as the basic dietary protein source. Soyabean oil was used as the basic dietary lipid source. Dietary ingredients were ground into fine powder. All the ingredients were thoroughly mixed with soyabean oil firstly, and then water was added to made stiff dough. The mixed ingredients were finally made to expanded pellets with 0·35–1 mm diameter, which were produced by using a double-helix plodder (F-26, SCUT industrial factory). The experimental diets were stored at −20°C until the usage for the feeding experiment.
The formulation and proximate composition of the basic diet and wheat flour dough particles and their composition analysis
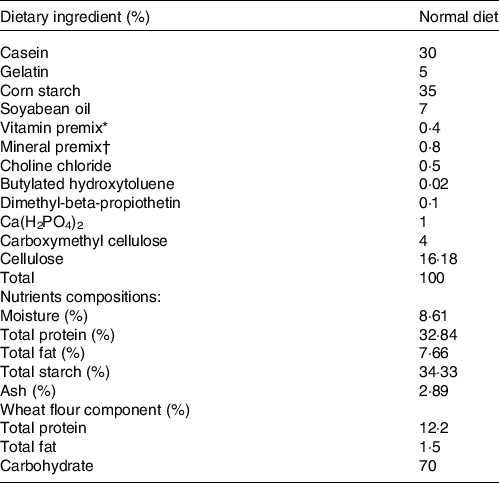
* Vitamin premix (mg/kg): 500 000 mg retinyl acetate; 50 000 mg cholecalciferol; 2500 mg all-rac-a-tocopheryl acetate; 1000 mg menadione nicotinamide bisulfite; 5000 mg thiamine hydrochloride; 5000 mg riboflavin; 5000 mg pyridoxine; 5000 μg cobalamin; 25 000 mg inositol; 10 000 mg pantothenic acid, 100 000 mg choline; 25 000 mg niacin; 1000 mg folic acid; 250 mg biotin; 10 000 mg ascorbic acid.
† Mineral premix (g/kg): 314.0 g CaCO3; 469.3 g KH2PO4; 147.4 g MgSO4.7H2O; 49.8 g NaCl; 10.9 g Fe (II) gluconate; 3.12 g MnSO4.H2O; 4.67 g ZnSO4.7H2O; 0.62 g CuSO4.5H2O; 0.16 g KI; 0.08 g CoCl2.6H2O; 0.06 g NH4 molybdate; 0.02 g NaSeO3.
For the second experiment, during the acclimation period, the fish were fed a commercial diet (protein 52 %, lipid 8 %) (Shandong Shengsuo Fishery Culture Feed Research Center, Co., Ltd) for 2 weeks. After that, 180 zebrafish with initial weight 0·315 ± 0·005 g were randomly allocated to two treatments: Control and HSL-IN-1 (three replicates per treatment, thirty fish per replicate). HSL-IN-1 (HY-101509, MedChemExpress (MCE)), a potent and orally active HSL inhibitor, was dissolved in dimethyl sulfoxide. Wheat flour dough can be solidified by mixing wheat flour and suitable amount of water. In experiments, we mixed the wheat flour and inhibitor and added 20 % water to make a dough. Then we used household mini grinder (Yongkang Tianqi Shengshi Industry and Trade Co., Ltd) to ground the dough into small-size particles. Afterwards, we screened the particles to obtain wheat flour dough in the size of sixteen meshes to twenty meshes (0·83–1 mm), which is the suitable size for adult zebrafish to eat according to our previous experiment(Reference Han, Qian and Limbu45,Reference Han, Liu and Limbu46) . The diet for the HSL-IN-1 group contained 80 mg/kg of HSL-IN-1. Each morning, dough particles at 1 % of body weight, containing HSL-IN-1 or not, were fed to fish in different groups, respectively. Afterwards, the fish in both treatments were fed with the basic diet at 3 % of their body weight with two times per d (10.00 and 18.00) for 5 weeks.
In both feeding experiments, the weight of all fish in each tank was recorded every week, and the feeding amount was adjusted accordingly. At the end of the feeding trial, all fish was fasted for 12 h, then the whole body, liver, muscle, and blood samples were collected and frozen immediately for further analysis.
Behaviour analyses and oxygen consumption rate
Movement behaviour was recorded by using an automated live video-tracking system (ZebraLab software; ViewPoint Life Sciences), as described in our previous study(Reference Han, Qian and Limbu45). The camera was calibrated to detect infrared light and was set to 25 frames per second. During the tracking, fish were illuminated with both infrared light and white light with 75 lux in the ZebraCube for 24 h (light/dark, 14 h/10 h). The integration period (the time intervals used to measure distance swum in each experiment) was 2 min for experimental animal. The swimming activity level was evaluated by calculating the total movement length (mm) during each video recording period. The OCR was measured as described previously(Reference Han, Liu and Limbu46). After being starved for 24 h, twelve zebrafish from each type (n 12) were weighed and then separately transferred into a chamber that contained 0·66 litres of fresh water. The OCR was gauged by standard polarographic techniques using a Clark-type Oxygen Meter (SI Strathkelvin Instruments Oxygen Meter, Model 782, plus Mitocell MT 200) at 28°C after 1 h of enclosure within the chamber. The OCR was expressed as micrograms of O2 consumed per minute per gram of body weight.
Biochemical analyses
The samples were weighed and homogenised on ice in nine volumes (v/w) of PBS (1×) and then centrifuged at 2500 × g at 4°C for 30 min. The supernatant was collected and stored at −80°C until analysis. The concentrations of TAG (glycerophosphate oxidase – peroxidase (GPO-PAP) method, 510 nm), NEFA (acetyl coenzyme A synthase – acetyl coenzyme A oxidase – peroxidase (ACS-ACOD-POD) method, 546 nm)NEFA, glycogen (anthrone colorimetry, 620 nm), lactate (lactate dehydrogenase – 5-methylphenazinium methosulfate – nitroblue tetrazolium (LDH-PMS-NBT) method, 530 nm) and pyruvate (pyruvate oxidase method, 505 nm) in tissue were measured using LabAssay kits (Cat. No. A110–1, A042–2, A043–1, A019–2 and A081–1, Jiancheng Biotech Co.), respectively, according to the manufacturer’s instructions. The total protein content of whole body (six fish from each treatment, n 6) was measured by the Kjeldahl method after acid digestion using a 2300 Kjeltec Analyzer Unit (FOSS Tecator). The total lipid content of whole body (six fish from each treatment, n 6) was evaluated by extracting lipid using chloroform/methanol (2:1, v/v) according to the method previously described(Reference Li, Limbu and Ma47). The extracted lipid was used for the subsequent analysis of lipid composition. The lipid samples (six samples per treatment) dissolved in chloroform were pointed on Silica Gel TLC plates (200 mm × 200 mm). Firstly, a solvent system consisting of 0·25 % KCl/methanol/isopropyl acid chloroform/methyl acetate (9/10/25/25/25 by volume) was used to isolate the polar lipids for 100 min. Then, another solvent system consisting acetic acid/ether/isohexane (1·5/25/80 by volume) was used to isolate the natural lipids for 150 min. Subsequently, all the TLC plates were put in an oven at 50°C for 30 min and then dyed with iodine for 20 min. The separated TAG, DG, MG and phospholipids from the whole body was quantified by TLC scanner (Kezhe KH-3000) at room temperature according our previous method(Reference Han, Liu and Limbu46).
Histological H&E, Nile Red and PAS staining
Neutral lipid accumulation was visualised using Nile Red staining in live zebrafish, as shown in our previous study(Reference Han, Liu and Limbu46). Nile Red (N3013; Sigma) was dissolved in acetone at 2 mg/ml as the stock solution. Three fish from each treatment were dyed in water containing 0·1 mg/ml Nile Red for 5 h at 28°C in a lightproof environment. After that, the fish were washed in the tank containing fresh water for five times, at 30 min intervals. At last, the fish were anesthetised with MS-222 (17 mg/l) (tricaine methanesulfonate, Sigma-Aldrich) and photographed by using an Olympus SZX16 FL stereomicroscope (Olympus) at an excitation wavelength of 488 nm. Six pieces of fish livers and intestines from each treatment were fixed in 4 % paraformaldehyde solution and then embedded in paraffin. Sections of 5-μm thickness were used for the subsequent staining of Harris’s hematoxylin–eosin mixture (H&E) and periodic acid Schiff(Reference Abo Alrob and Lopaschuk48) staining as depicted in our previous study(Reference Li, Lu and Jiang36).
Quantitative real-time PCR
Total RNA from liver, muscle and viscera tissues was extracted by using a TriPureReagent (Aidlab) for subsequent cDNA synthesis according to the manufacturer’s protocol. The quality of RNA and cDNA was tested by a NANODROP 2000 Spectrophotometer (Thermo) as described previously(Reference Han, Wang and Li49). The genes of elongation factor 1α and (ef1α) and β-actin were used as the housekeeping gene controls for the normalisation of gene expression. The qPCR reaction consisted of 95°C for 10 min, 40 cycles of 95°C for 5 s and 60°C for 18 s. The primers for qPCR were designed to overlap an intron by using the National Center for Biotechnology Information (NCBI) website and synthesised by Ruimian Biological Technology Co., Ltd (Shanghai, China). The melting curves of amplified products were generated to ensure the specificity of assays at the end of each PCR. The qPCR efficiency was between 97 % and 104 %, and the correlation coefficient was over 0·97 for each gene. The qPCR was conducted by using the 2 – ΔΔ Ct method according to our previous research(Reference Lu, Ma and Wang33). All the primer sequences for qRT-PCR analysis are shown in Table 2.
Primer sequences for qRT-PCR analysis in zebrafish

Western blotting
The muscle tissues from each genotype (three pooled samples per assay, one sample was mixed with tissues from three fish, about 50 mg) were used for the western blot analysis. Muscle homogenates were prepared by using the RIPA lysis buffer (Beyotime Biotechnology) for western blot analysis. Proteins were separated by using 8 % or 12 % sodium dodecyl sulphate-polyacrylamide gel electrophoresis (SDS-PAGE) and transferred electrophoretically to nitrocellulose membranes. Membranes were incubated for 1 h in a blocking solution containing 5 % bovine serum albumin in a mixture of TRIS-buffered saline (TBS) and polysorbate 20 (TBST). Membranes were washed briefly in a mixture of TBST and incubated overnight at 4°C with the anti-mTOR (1:800, #2972, CST), anti-GAPDH (1:3000, AB0036, Abways) and anti-A-tubullin (1:3000, M1501–1, HuaBio) antibodies. Afterwards, the blots were washed to remove excessive primary antibody binding and finally were incubated for 1 h with horseradish peroxidase-conjugated secondary antibody. The western blot images were obtained by using the Odyssey CLx Imager (Licor).
Statistical analyses
Independent-samples t test was performed to evaluate the significant differences among measured variables (P < 0·05). All data were conducted using the SPSS Statistics 28.0 software (IBM). Figures were generated using GraphPad Prism version 6.1 (https://www.graphpad.com/scientific-softw are/prism/, GraphPad Software Inc.).
Results
The effect of impaired Hsl function on growth and exercise activity
In the 5-week feeding trial, the hsla -/- zebrafish showed retarded growth (Fig. 1(a)) and markedly lower final body weight (Fig. 1(b)) but demonstrated significantly higher condition factor (Fig. 1(c)) when compared with the WT fish. However, there were no differences in growth (Fig. 1(f)) and final body weight (Fig. 1(g)) between the control and HSL-IN-1-treated groups, but the HSL-IN-1-treated fish showed markedly higher viscerosomatic index (VSI) (Fig. 1(h)) than the control group. Compared with their WT siblings, hsla -/- zebrafish showed a lower respiration rate (Fig. 1(e)), but there was no difference in the swimming activity, which was measured by swimming distance during the assay period (Fig. 1(d)), between the two genotypes. Accordingly, the HSL-IN-1-treated group also showed a significantly lower respiration rate (Fig. 1(j)) than the control group, but there was no difference in the swimming activity (Fig. 1(i)) between the two treatments.
The effect of impaired Hsl function on growth and exercise activity. WT and hsla -/- fish: (a) growth curve of; (b) final body weight; (c) condition factor (%) = 100 × final fish weight/(final fish length)3; (d) swimming activity (n 6); (e) the OCR was calculated as OCR = (ΔO2 concentration (ug/l) × water volume (l))/(fish weight (g) × time (min)). Control and HSL-IN-1-treated fish: (f) growth curve; (g) final body weight; (h) viscerosomatic index: visceral weight/body weight × 100 %; (i) swimming activity; (j) OCR. All data are presented as mean ± sem. *P ≤ 0·05, **P ≤ 0·01, ***P ≤ 0·001.

Impaired Hsl function caused lipid accumulation
The hsla -/- zebrafish exhibited more abdominal fat deposition (Fig. 2(a)) and had visible white adipose tissue (Fig. 2(b)) in viscera than WT fish. Correspondingly, the HSL-IN-1-treated fish also showed more abdominal fat deposition (Fig. 2(i)) and had visible adipose tissue (Fig. 2(j)) in viscera compared with the control group. These are representative results of the treatment (Fig. 2(a),(b),(i),(j)). Furthermore, the hsla -/- zebrafish had markedly higher TAG contents in whole body, muscle, liver and viscera (Fig. 2(c)–(e) and (g)), and significantly higher levels of FFA in the liver and visceral tissue (Fig. 2(f) and (h)). The whole-body lipid was remarkably increased in the fish fed with HSL-IN-1 treatment compared with the control group (Fig. 2(k)). Accordingly, significantly higher TAG content was found in the muscle, liver and viscera in the HSL-IN-1-treated fish than in the control group (Fig. 2(l), (m) and (o)). The HSL-IN-1-treated fish showed higher FFA content in liver but lower that in viscera compared with control group (Fig. 2(o)–(p)).
Impaired Hsl function caused lipid accumulation. WT and hsla -/- fish: (a) H&E staining of intestine and attached adipose tissue, scale bars, 100 μm; (b) pictures taken after Nile Red staining, scale bars, 2 mm; (c) the total TAG content in whole-body fish; (d) TAG content in muscle; (e) TAG content in liver; (f) non-essential fatty acid (NEFA) content in liver; (g) TAG content in viscera; (h) NEFA content in viscera. Control and HSL-IN-1-treated fish: (i) H&E staining of intestine and attached adipose tissue, scale bars, 100 μm; (j) pictures taken after Nile Red staining, scale bars, 2 mm; (k) the total lipid content in whole-body fish; (l) TAG content in muscle; (m) TAG content in liver; (n) NEFA content in liver; (o) TAG content in viscera; and (p) NEFA content in viscera. All data are presented as mean ± sem. *P ≤ 0·05, **P ≤ 0·01, ***P ≤ 0·001. H&E, hematoxylin–eosin.

The effect of impaired Hsl function on gene expressions of lipid metabolism
Compared with the WT fish, the hsla -/- zebrafish showed lower expression of atgl, hsla, hslb and cpt1aa, and higher expression of pparaa in liver (Fig. 3(a)), and lower expression of atgl, hsla, hslb, pparab, cpt1aa and acox1 in muscle (Fig. 3(b)), whereas in viscera, it demonstrated lower expression of hsla, atgl, cpt1aa, and acox1, and higher expression of pparaa (Fig. 3(c)). These genes were associated with the process of lipolysis and fatty acid oxidation. Similarly, the HSL-IN-1-treated fish exhibited lower expression of atgl, hsla, pparaa, and cpt1aa in liver (Fig. 3(e)), but there was no difference between HSL-IN-1 treatment and control groups in the expression of genes related to lipolysis and fatty acid oxidation, including atgl, hsla, pparaa, cpt1aa, and acox1 either in muscle or viscera (Fig. 3(f) and (g)). The expression of key lipogenesis-related genes such as srebp1c, acc, fasn and dgat1a was markedly increased in the liver of hsla-mutant zebrafish compared with WT fish (Fig. 3(d)). However, the fish treated with HSL-IN-1 showed significantly lower expression of acc, fasn and dgat1a than the control group (Fig. 3(h)).
The effect of impaired Hsl function on gene expressions of lipid metabolism. WT and hsla -/- fish: (a) the expression of lipolysis and fatty acid oxidative (FAO)-related genes in fish liver (n 6); (b) the expression of lipolysis and FAO-related genes in fish liver (n 6); (c) the expression of lipolysis- and FAO-related genes in fish liver (n 6); (d) the expression of lipogenesis-related genes in fish liver (n 6). Control and HSL-IN-1-treated fish: (e) the expression of lipolysis- and FAO-related genes in fish liver (n 6); (f) the expression of lipolysis- and FAO-related genes in fish liver (n 6); (g) the expression of lipolysis- and FAO-related genes in fish liver (n 6); (h) the expression of lipogenesis-related genes in fish liver (n 6). All data are presented as mean ± sem. *P ≤ 0·05, **P ≤ 0·01, ***P ≤ 0·001. atgl, adipose triglyceride lipase; hsla, hormone-sensitive lipase a; hslb, hormone-sensitive lipase b; ppara, peroxisome proliferator-activated receptor αa; pparab, peroxisome proliferator-activated receptor αb; cpt1aa, carnitine palmitoyl transferase 1aa; acox1, acyl-CoA oxidase 1; srebf1c, sterol regulatory element-binding transcription factor 1c; acc, acetyl-CoA carboxylase; fasn, fatty acid synthase; dgat1a, diglyceride acyltransferase 1a.

Impaired Hsl function changed lipid profile of whole body
The proportion of different lipid classes present in whole body was changed by hsla -/- or HSL-IN-1 treatment. In the hsla -/- zebrafish, the percentages of TAG and DG were increased significantly compared with WT fish, while the proportions of MG and phospholipids were significantly reduced (Fig. 4(a)–(e)). Besides, in these changes between the hsla -/- zebrafish and WT fish, phospholipids contributed the greatest part (46·57 % v. 37·52 %) (Fig. 4(a)). In the HSL-IN-1-treated fish, the percentages of DG, MG and phospholipids were reduced markedly compared with the control group, while only the proportion of TAG was significantly increased (Fig. 4(f)–(j)). Besides, in these changes between the HSL-IN-1 treatment and control group, TAG contributed the greatest proportion of the total lipids (50·57 % v. 62·85 %) (Fig. 4(f)).
Impaired Hsl function changed lipid profile of whole body. WT and hsla -/- fish: (a) the average proportion of lipid class composition; (b) the percentage of TAG to total lipid (n 8); (c) the percentage of diacylglycerol (DG) to total lipid (n 8); (d) the percentage of monoglyceride (MG) to total lipid (n 8); (e) the percentage of phospholipid (PL) to total lipid (n 8). Control and HSL-IN-1-treated fish: (f) the average proportion of lipid class composition; (g) the percentage of TAG to total lipid (n 8); (h) the percentage of DG to total lipid (n 8); (i) the percentage of MG to total lipid (n 8); (j) the percentage of PL to total lipid (n 8). All data are presented as mean ± sem. *P ≤ 0·05, **P ≤ 0·01, ***P ≤ 0·001.

The effect of impaired Hsl function on carbohydrate metabolism
The hsla -/- zebrafish exhibited markedly lower content of glycogen in liver and muscle than WT fish (Fig. 5(a) and (b)). Accordingly, the pyruvate concentration in the muscle of hsla -/- zebrafish was significantly increased compared with the control group, but there was no difference in the concentration of lactate in muscle between two genotypes (Fig. 5(c) and (d)). Consistently with this, the expressions of gene-related glycogen phosphorylase were markedly increased in hsla -/- zebrafish, including pyg(L) in liver and pygmb in muscle, compared with WT fish (Fig. 5(e) and (f)). In the genes related to glucose transport and glycolysis, the hsla -/- zebrafish showed higher expression of gck4, pfk, pk and lower expression of glut2 in liver, and higher expression of glut2 and pk in muscle than WT fish (Fig. 5(g) and (h)). The fish treated with HSL-IN-1 showed significantly higher glycogen content in liver but significantly lower glycogen content in muscle than the control group (Fig. 5(i) and (j)). Furthermore, the content of lactate in muscle of HSL-IN-1 group was markedly increased compared with the control group (Fig. 5(k)). Consistently with this, the expression of pyg(L) in liver was markedly reduced, but the expression of pygmb was significantly increased in the muscle of fish treated with HSL-IN-1 compared with the control group (Fig. 5(l) and (m)). The fish treated with HSL-IN-1 exhibited higher expression of gck4 and lower expression of glut2, pfk, pk, and pdha1a in liver, along with higher expression of glut2, pfk, pk, and pdha1a in muscle, as compared with the control group (Fig. 5(n) and (o)).
The effect of impaired Hsl function on carbohydrate metabolism. WT and hsla -/- fish: (A) the content of glycogen in liver; (b) the content of glycogen in muscle; (c) the content of lactate in muscle; (d) the content of pyruvate in muscle; (e) the expression of glycogen phosphorylase-related genes in liver; (f) the expression of glycogen phosphorylase-related genes in liver; (g) the expression of glucose transport and glycolysis-related genes in liver; (h) the expression of glucose transport and glycolysis-related genes in muscle. Control and HSL-IN-1-treated fish: (i) the content of glycogen in liver; (j) the content of glycogen in muscle; (k) the content of lactate in muscle; (l) the expression of glycogen phosphorylase-related genes in liver; (m) the expression of glycogen phosphorylase-related genes in muscle; (n) the expression of glucose transport and glycolysis-related genes in liver; (o) the expression of glucose transport and glycolysis-related genes in muscle. All data are presented as mean ± sem. *P ≤ 0·05, **P ≤ 0·01, ***P ≤ 0·001. pyg(L), glycogen phosphorylase in liver; pygma, glycogen phosphorylase muscle a; pygmb, glycogen phosphorylase muscle b; glut2, glucose transporter 2; gck4, glucokinase 4; pfk, phosphofructokinase; pk, pyruvate kinase; pdha1a, pyruvate dehydrogenase E1 subunit alpha 1a.

The effect of impaired Hsl function on protein metabolism
The hsla -/- zebrafish showed significantly lower whole-body protein content than their WT siblings (Fig. 6(a)). Among genes related to protein or amino acid breakdown, the expression of apn was increased markedly in the hsla -/- zebrafish, but there was no difference in the expressions of bckdha, bca2 and mtor between two genotypes (Fig. 6(b)). Moreover, the hsla -/- zebrafish showed lower expression of T-mTOR protein, which is essential for protein synthesis, than WT fish (Fig. 6(c) and (d)). The content of whole-body protein was significantly reduced in the fish treated with HSL-IN-1 compared with the control group (Fig. 6(e)). The fish treated with HSL-IN-1 showed higher expression of apn and glud1a and lower expression of bca2 in muscle than the control group (Fig. 6(f)). Furthermore, the expression of T-mTOR protein in HSL-IN-1-treated fish tended to reduce as compared with the control group (Fig. 6(g) and (h)).
The effect of impaired Hsl function on protein metabolism. WT and hsla -/- fish: (a) the content of protein in whole-body fish; (b) the expression of protein and amino acid metabolism-related genes in muscle;(Reference Den Broeder, Kopylova and Kamminga32) the protein expression of T-mTOR in muscle. Control and HSL-IN-1-treated fish: (e) the content of protein in whole-body fish; (f) the expression of protein and amino acid metabolism-related genes in muscle; (g and h) the protein expression of T-mTOR in muscle. All data are presented as mean ± sem. *P ≤ 0·05, **P ≤ 0·01, ***P ≤ 0·001. apn, aminopeptidase N; bckdha, branched-chain keto acid dehydrogenase E1 subunit α; bca2, asns, asparagine synthetase; mtor, mechanistic target of rapamycin kinase. T-mTOR, total mechanistic target of rapamycin kinase; GAPDH, glyceraldehyde-3-phosphate dehydrogenase.

The effect of impaired Hsl function on the inflammation and apoptosis
The hsla -/- zebrafish exhibited higher expression of cas3, cas8, il1β and il8 in liver, while expressed higher cas9, il1β and il8 in muscle than their WT siblings (Fig. 7(a) and (b)). Similarly, the fish treated with HSL-IN-1 showed higher expression of cas3, il10 and il12a in liver, while expressed higher cas9, il10 and il12a in muscle compared with the control group (Fig. 7(c) and (d)). The genes mentioned above are all associated with inflammation and apoptosis.
The effect of impaired Hsl function on the inflammation and apoptosis. WT and hsla -/- fish: (a) the expression of inflammation and apoptosis-related genes in liver; (b) the expression of inflammation and apoptosis-related genes in muscle. Control and HSL-IN-1-treated fish: (c) the expression of inflammation and apoptosis-related genes in liver; (d) the expression of inflammation and apoptosis-related genes in muscle. All data are presented as mean ± sem. *P ≤ 0·05, **P ≤ 0·01, ***P ≤ 0·001.

Discussion
The effect of impaired Hsl function on growth and exercise activity
Normal metabolic homoeostasis is essential for the growth of living organisms(Reference Karpac and Jasper50). Lipolysis plays a key role in the mobilisation of energy from fat sources such as TAG. Therefore, as a rate-limiting enzyme in the process of lipolysis, we hypothesised that the impaired function of Hsl would have an impact on the growth of zebrafish. In the present study, the hsla -/- zebrafish showed a significant decline in growth. Similar to our result, in the other zebrafish model with defective lipolysis, the atgl-deficient fish also exhibited significant growth retardation(Reference Han, Qian and Limbu45). In mammals, the eight-month-old mice with global or specific-adipocyte Hsl-knockout both developed a lower weight gain than the WT group(Reference Xia, Cai and Yang22). Therefore, Hsl inhibition might reduce growth through disturbing energy metabolism. In animal trials, the OCR is a visible indicator to describe the basal respiration, energy expenditure, ATP production and oxidative capacity of living organisms(Reference Rose, Frye and Slattery51). In the present study, the hsla-knockout zebrafish and the HSL-IN-1-treated fish both exhibited a significant decrease in OCR but showed similar movement activity. Horikoshi et al. (Reference Horikoshi, Yan and Terashvili52) showed that when enhancing the utilisation of exogenous fatty acids, the human cardiomyocyte had a higher OCR associated with basal and maximum respirations. Therefore, our results suggest that the decrease in OCR in the hsla-knockout zebrafish and HSL-IN-1-treated fish is most likely unrelated to the movement activity. Whether the change of OCR could show more efficient metabolism requires further studies to follow. Interestingly, our results show that the protein accretion in the hsla-knockout zebrafish and HSL-IN-1-treated fish were significantly lower than their control groups. Therefore, the decrease in OCR was possibly related to the decreased protein accretion, which is metabolically expensive compared with lipid deposition.
The role of Hsl in lipid metabolism
Disturbances in lipolysis could affect overall lipid homoeostasis and thus induce the development of obesity, diabetes and CVD(Reference Peirce, Carobbio and Vidal-Puig1,Reference Cerk, Wechselberger and Oberer2) . However, the functions of Hsl in the whole-body energy and lipid homoeostasis in zebrafish have not been investigated. In our results, we found that the hsla -/- and HSL-IN-1-treated zebrafish exhibited (1) more conspicuous intestinal adipose tissue, (2) greater TAG accumulation in different tissues including liver, muscle, and viscera, and (3) reduced expressions of the genes involved in lipolysis and fatty acid oxidation compared with the WT or Control group. These were in agreement with previous studies in the Hsl-KO mice and human with mutated HSL gene, in which noticeable hepatic steatosis was found(Reference Albert, Yerges-Armstrong and Horenstein19,Reference Xia, Cai and Yang22,Reference Haemmerle, Zimmermann and Hayn24) . In addition, the adipose-specific Hsl-knockout mice exhibited significant hepatic TAG deposition, impaired lipolytic activity and marked dysregulation of lipid metabolism, including down-regulation of mRNA levels of genes involved in lipogenesis (Cebp1a and Srebp1c), lipid uptake (Cd36 and Fabp4) and lipid synthesis (Fasn and Dgat2)(Reference Pajed, Taschler and Tilp53). As one of the rate-limiting enzymes for lipolysis, ATGL had been reported in many previous studies. The Atgl deficiency in mice and human both showed marked hepatic steatosis and severe lipid accumulation in whole body(Reference Haemmerle, Lass and Zimmermann54,Reference Fischer, Lefevre and Morava55) . In our previous research, the atgl-knockout and Atgl-inhibitor-treated zebrafish both exhibited conspicuous lipid accumulation and lipid metabolism disorder(Reference Han, Qian and Limbu45,Reference Han, Liu and Limbu46) . Therefore, we could infer that the deficiency of Hsl can weaken the lipolytic activity and the expressions of the genes related to lipid catabolism, leading to lipid accumulation in zebrafish. This was also consistent with the reduction in OCR. In the following TLC assay, we found the hsla -/- zebrafish showed higher relative contents of TAG and DG. Considering Hsl has a hydrolytic activity for TAG and DG, our TLC data indicate that the hsl deficiency directly led to the accumulation of TAG and DG. Similarly, for the Atgl-inhibitor-treated zebrafish, the TAG content was also markedly increased, indicating that abnormal lipolysis is a major factor in altering lipid profile. All these verified that the Hsl deficiency impairs lipid metabolism, inducing severe lipid accumulation in multiple tissues.
Regulation of Hsl in glucose and protein metabolism
In order to cope with the dynamic nutrient environment, cells need to accurately and dynamically reshape metabolic pathways to maintain energy homoeostasis. Therefore, disturbances in lipid metabolism may cause changes in glucose metabolism(Reference Abo Alrob and Lopaschuk48). In mammals, Park et al. (Reference Park, Kim and Wang56) reported that Hsl-KO mice were protected from diet-induced insulin resistance in heart and skeletal muscle, boosted insulin-stimulated cardiac glucose uptake, and improved the glucose metabolism. Additionally, some previous studies reported that Hsl-inhibitor-treated mice and Hsl-deficient mice showed increased glucose tolerance and insulin sensitivity and increased hepatic insulin action(Reference Voshol, Haemmerle and Ouwens57,Reference Girousse, Tavernier and Valle58) . Accordingly, the mice lacking adipocyte Hsl increased insulin-mediated phosphorylation of AKTp-Ser473, a core protein downstream of the insulin signalling pathway, exhibiting beneficial impacts on systemic glucose homoeostasis(Reference Morigny, Houssier and Mairal59). In the present study, we found hsla -/- zebrafish showed significant glycogen content reductions in both liver and muscle, implying enhanced glycogen utilisation. In addition, hsla -/- zebrafish elevated contents of the glucose metabolites, including lactate and pyruvate, in muscle, suggesting that the products of glycogen breakdown were being used for oxidative and energy supply. Consistent with the above biochemical results, the expressions of the genes related to glycogen catabolism (pygma and pyg(L)) and glycolysis (glut2, gck, pfk and pk) were enhanced in hsla -/- zebrafish, and a similar gene expression pattern was also observed in the Hsl-inhibitor-treated zebrafish. These data strongly suggested that Hsl deficiency reduces glycogen accumulation and enhances glycogen and glucose utilisation in zebrafish.
Compared with lipid and glucose metabolism, protein metabolism also plays an essential role in energy metabolism and homoeostasis. Our finding from the present work showed that hsla -/- zebrafish and fish treated with Hsl inhibitor both exhibited a reduction of protein in the whole body. A series of mammalian and fish studies have reported that the mTOR pathway activates a phosphorylation cascade to accelerate protein synthesis and inhibit proteolysis in muscle(Reference Li, Li and Ning30,Reference Inoki, Corradetti and Guan60,Reference Wang and Proud61) . The present work further indicated that the protein expression of T-mTOR was reduced in the muscle of the hsla-knockout and Hsl-inhibitor-treated zebrafish, but the mRNA expression of apn, which is related to protein catabolism, was markedly increased. Additionally, our previous study demonstrated that atgl-KO zebrafish also showed a significantly lower protein content than their WT siblings(Reference Han, Qian and Limbu45). Therefore, the lipolysis disorder due to Hsl deficiency could inhibit the mTOR pathway and enhance the catabolism of protein as an energy source.
Regulation of Hsl in inflammation and apoptosis
Metabolic disorders such as obesity, diabetes, hepatic steatosis and nonalcoholic fatty liver diseases are often accompanied by inflammation and infiltration of immune cells(Reference Targher, Bertolini and Scala62–Reference Cheng, Yang and Ge64). In our present study, the hsla -/- and HSL-IN-1-treated zebrafish showed visible fat accumulation and abnormal lipid metabolism. The present work further indicated that the hsla -/- and HSL-IN-1-treated zebrafish showed higher expressions of the genes related to inflammation and apoptosis, including cas3, cas8, cas9, il1β, il8, il10, and il12a in liver and muscle. In mammal, the global Hsl-KO and adipose Hsl-KO mice both exhibited macrophage infiltration in adipose tissues and systemic inflammation, accompanied with the higher expressions of inflammation-related genes, including Tnfa, Il6, INOS, Cxxl9, and Cxcl10 (Reference Xia, Cai and Yang22,Reference Cinti, Mitchell and Barbatelli65) . A previous study reported that the mice lacking Hsl specifically in adipose tissue showed increased hepatic lipid accumulation and the mRNA expressions of immune cell markers (Dd11c and F4/80). Hepatic steatosis has been reported to cause the recruitment of inflammasome and activate the immunity and inflammation to develop fibrosis and cirrhosis in liver(Reference Peng, French and Tillman66,Reference Szabo and Petrasek67) . In addition, excessive lipid deposition in hepatocytes of mice would also induce oxidative stress and increased level of lipopolysaccharide, which can be recognised by Toll-like receptor 4 (TLR4), the macrophage marker that activates downstream signalling pathways to increase inflammatory cytokine production like Il1β, Il8, I10 and Tnfa (Reference Mandrekar and Szabo68,Reference Kayagaki, Wong and Stowe69) . Therefore, our present study demonstrated that the Hsl inhibition-caused lipid accumulation possibly induced the recruitment of inflammasome or lipopolysaccharide to activate the expressions of the downstream genes related to inflammation and apoptosis. Considering the biological function of HSL, the phenotype of lipid deposition should be mainly caused by the impaired function of HSL. In addition, a lot of studies have proved that lipid accumulation could cause inflammation(Reference Peng, French and Tillman66–Reference Kayagaki, Wong and Stowe69). It should be pointed out that the knowledge about the direct connection between Hsl and inflammation or apoptosis has not been established. Therefore, whether the Hsl could directly regulate inflammation and/or apoptosis still requires further studies.
The differences between gene-knockout and enzymic inhibition models
In the present study, we used gene-knockout and enzymic inhibition, respectively, to study the regulatory functions of Hsl in nutrient metabolism in fish. Although most phenotypes were similar between the two models, our results also showed some parameters which had different and even opposite responses between the hsla-knockout and HSL-IN-1-treated fish. We noticed that in the 5-week feeding trial, the hsla-/- zebrafish showed retarded growth; however, enzymic inhibition of Hsl did not significantly reduce growth. Considering the inhibiting efficiency of biochemical inhibitor is normally lower than the gene-knockout method(Reference Rossi, Velentza and Steinhorn70), the 5-week inhibitor feeding was probably not longer enough to show significant difference in growth. In addition, the hsla-knockout and HSL-IN-1-treated fish both exhibited lipid accumulation in liver. The expressions of lipogenesis-related genes, including srebp1c, acc, fasn and dgat1a, were significantly increased in the hsla-knockout fish compared with WT. This could be a compensatory response induced by the hsla-knockout-caused reduction of endogenous fatty acids. However, the expressions of these genes showed the opposite trend in the Hsl-inhibitor-treated fish. In addition, the hsla-knockout fish showed enhanced glycogen utilisation, indicating the elevated energy production from carbohydrate rather than lipids, but the HSL-IN-1-treated fish showed higher glycogen accumulation in liver. These inconsistent results could be caused by the differences between complete inhibition (gene knockout) and partial inhibition (biochemical inhibition) of Hsl function(Reference Iborra, Jackson and Cook71–Reference Ogiyama, Yamaguchi and Kurikawa73) or caused the possible side effects of HSL-IN-1 in inhibiting lipogenesis genes and elevating glycogen accumulation. Although these are still waiting for further evaluation, the phenotype differences between genetic and biochemical inhibition for the same enzyme are commonly reported. For example, the atgl-knocked fish showed significantly retarded growth compared with WT, whereas the Atgl-inhibitor-treated fish exhibited significantly increased weight gain compared with control group(Reference Han, Qian and Limbu45,Reference Han, Liu and Limbu46) . In addition, the lipid content of muscle in the cpt1b-knockout fish was significantly higher than WT(Reference Li, Li and Ning30); however, there was no significant difference in the lipid content of muscle between the control group and Cpt1-inhibitor-treated fish(Reference Li, Wang, Limbu and Li74). All these indicate the importance to use different animals or cell models in identifying the function of a given gene or protein.
Conclusion
The present results demonstrated that the Hsl dysfunction in zebrafish caused retarded growth and reduced oxygen consumption rate, accompanied with the higher mRNA expressions of the genes related to inflammation and apoptosis in liver and muscle. Moreover, the Hsl dysfunction also induced TAG accumulation in multiple tissues, including liver, muscle, and viscera, and reshaped lipid profile with higher proportions of TAG and DG in total lipids. Furthermore, the Hsl dysfunction decreased the glycogen and protein content in tissues, accompanied with the enhanced breakdown of glucose and protein, and reduced activation of mTOR pathway. Our results illustrate that Hsl is a crucial metabolic enzyme for growth, health and maintenance of nutrient homoeostasis in organisms. Therefore, this study could provide valuable insights into the functions of Hsl on nutrition regulation and provide a potential regulatory target to improve animal health.
Acknowledgements
All authors contributed experimental assistance and intellectual input to this study.
This work was financed by the National Natural Science Fund of China (31830102).
Z.-Y. D. and M.-L. Z. conceived the original concept. J.-G. W., Z.-Y. D. and M.-L. Z. designed the experimental strategies and sampling plans. J.-G. W. and S.-H. Z. performed the feeding experiments. J.-G. W., S.-H. Z., Y.-C. Q. and Y.-C. L. contributed to the collection of samples. J.-G. W. performed the molecular and biochemistry detections. Z.-Y. D., M.-L. Z., Y. L. and F.Q. provided essential materials and technical supports. Z.-Y. D., J.-G. W. and Y.-F. Q. drafted and revised the manuscript. All authors read and approved the final manuscript.
All authors declare no conflicts of interests.
Supplementary material
For supplementary material/s referred to in this article, please visit https://doi.org/10.1017/S0007114522003622


