


In the 1960s, Chilean population was affected by a high incidence of infectious diseases (300 per 100·000 inhabitants) and prevalence of infant mortality of 24 %(Reference Kaempffer and Medina1). Additionally, 37 % of children had undernutrition(Reference Willett, Bendich and Deckelbaum2) and approximately 20 % were anaemic(Reference Ríos, Olivares, Amar and Underwood3). Public health policies and programs were focused on decreasing maternal–child mortality, undernutrition and micronutrient deficiency(Reference Albala, Vio and Kain4). However, during the last decades, Chile has faced an extremely rapid nutrition transition(Reference Albala, Vio and Kain4,Reference Vio, Albala and Kain5) .
Currently, Chile leads in obesity burden, with one of the highest prevalence worldwide(Reference Afshin and Forouzanfar6). According to the latest National Health Survey, 31 % of adult population (≥15 years) is obese, whereas the prevalence of overweight is almost 40 %(7). The prevalence of excess weight, defined as the combined prevalence of overweight and obesity, has increased from 6 % in the 1980s(Reference Vio, Albala and Kain5) to 71 % in 2016(7). Additionally, 9 % of children <5 years are overweight, increasing this prevalence to 31 % in children >5 years(Reference Corvalán, Garmendia and Jones-Smith8,9) . In contrast, the prevalence of anaemia is no longer a public health issue in Chilean women (<5 %) and neither is stunting or underweight(10,Reference Atalah, Amigo and Bustos11) . Thus, Chile is considered as a country facing post-transitional stages in the nutrition transition(Reference Garmendia, Alonso and Kain12). This nutrition situation contrast with the reality of several Latin-American neighbouring countries that are facing early stages of this transition, where undernutrition and obesity coexist at the individual, household and country levels(Reference Lanas, Bazzano and Rubinstein13). In Ecuador, 9 % of the adult population have excess weight and anaemia at the individual or household level(Reference Freire, Silva-Jaramillo and Ram14), while in Guatemala, 48 % of children <5 years are stunted, 49 % have anaemia and 5 % have excess weight(Reference Ramirez-Zea, Kroker-Lobos and Close-Fernandez15), whereas in Uruguay, 10 % of children are stunted and have excess weight(Reference Severi and Moratorio16).
This period of nutritional change in Chile has been concomitant with rapid economic growth characterised by the reduction in poverty rates (i.e. extreme poverty defined as a monthly per-capita income of $US 154 or less decreased from 3·5 % in 2006 to 2·6 % in 2015)(Reference Gammage, Alburquerque and Durán17,Reference De Gregorio18) . However, according to the 2015 OCDE Inequality Report(19), Chile has the highest inequality level in the region, showing the lowest reduction in the GINI coefficient (–3·1 %), a well-known inequality index, in the period 2002–2011, compared with Argentina (–10·3 %), Bolivia (–12·4 %), Ecuador (–3·8 %) and Uruguay (–5·4 %)(Reference Amarante20).
The relationship between socioeconomic status (SES) and several nutritional status indicators such as excess weight has been previously described(Reference Wang and Beydoun21–Reference Barros, Victora and Horta24). In Chile, a study including more than 1 500 000 Chilean children (mean age 76·3 (sd 4·35) months) showed that poorest children had a higher prevalence of stunting compared with wealthier children(Reference Bustos, Munoz and Vargas25), whereas Azar et al.(Reference Azar, Franetovic and Santos26) found that high-middle SES adolescents assessed by the mother’s education level were less likely to be overweight or obese, compared with those with a low socioeconomic level. Similar results were found in a cohort study which included adults living in the Valparaíso Region of Chile, where low SES women showed a significant increase in BMI and waist circumference (WC) compared with high SES women in a 10-year period; in men, neither BMI nor WC differs by SES(Reference Amigo, Vásquez and Bustos27).
In addition to the influence of SES, previous studies have reported that ethnicity may play a key role on nutritional status of Chilean population. Currently, 10 % of Chilean population identifies themselves as indigenous, being the largest preference Mapuche(28). Bustos et al. (Reference Bustos, Munoz and Vargas25) reported that first-grade school Mapuche children were shorter than non-Mapuche children. Additionally, a recent longitudinal study in which pre-schooler children was followed for 2 years indicated that being indigenous was a risk factor for developing overweight or obesity at 6 years(Reference Kain, Leyton and Baur29). Similar findings were reported at school-age children where indigenous children had a 6 % higher risk of being obese compared with non-indigenous children(Reference Bustos, Munoz and Vargas25). Nonetheless, there is still controversy on whether part of the observed nutritional differences by ethnicity are actually due to SES differences(Reference Amigo, Erazo and Bustos30).
To date, the relationship between malnutrition, SES and ethnicity has not been studied in a Chilean national representative sample. Therefore, the aim of the current study is to assess the relationship between all malnutrition forms (e.g. excess weight, anaemia), socioeconomic indicators defined by the income and education level and ethnicity in a representative sample of Chilean women and men. Our goal is to describe how different forms of malnutrition are present on a post-transitional country that has alarming SES, ethnicity and sex inequalities.
Population and methods
Double burden series
The current article corresponds to one of a series of papers exploring the double burden of malnutrition in LAC; therefore, sample, methods and data analyses definitions were made on agreement with all other countries. Some of these definitions or categories do not apply to the context of Chile but have been kept in the manuscript to keep comparability across articles.
Data source and sampling
National Health Survey 2016–2017: nutritional status and demographic characteristics
Data on height, weight, education, monthly household income level and ethnicity were obtained for adults (>20 years) from the latest available Chilean National Health Survey (ENS) conducted in 2016–2017(7).
The 2017 ENS included 6233 participants aged >15 years, using a random household sampling (multistage, cluster sample and stratification by urban–rural and region population), had a high rate of response of 85 %(10). For the current study, subjects were excluded according to the following criteria: age <20 years (n 355), no available anthropometric measurements (n 750) and no available education level (n 46). Final sample included 5082 adults, 3257 women and 1825 men.
Nutritional status
Subjects were classified as underweight, overweight and obese using BMI (kg/m2) following the WHO criteria(31). Excess weight was defined as BMI ≥25 kg/m2. Given the physiological changes in height during late adulthood(Reference Sorkin, Muller and Andres32) and also the relationship between the obstetric risk and short stature(33), we only estimated the short stature prevalence in women and men between 20 and 49 years. Short stature was classified according to the tenth percentile of the sample distribution (height <1·49 m for women and <1·62 m for men). Undernutrition was defined as the presence of either underweight, short stature or anaemia (see below for definition).
Socioeconomic status
Education and monthly household income levels were considered as indicators of SES. Education level of the participants was classified as: (i) low (<8 years); (ii) medium (8–12 years) and (iii) high (>13 years) based on self-reported years of completed schooling. All participants were asked to report their monthly household income using eleven categories that ranged from less than $US 77·999 Chilean Pesos (CLP) (about $US 116) to more than $US 1·573·000 CLP (about $US 2348). We categorised the monthly household income in four levels as low (less than $US 295·999 CLP), medium (between $US 296·000 and $US 1·000·000 CLP) high (more than $US 1·000·000 CLP) and non-responders that accounted for a 14·6 % of final sample. Additionally, we provided descriptive information about bare-earth floor, use of firewood or carbon for cooking, public sanitary sewer system, public water network connection and electricity as an indirect indicator of SES.
Ethnicity
Ethnicity was classified by asking ‘Do you belong or are you a descendant of any of the nine indigenous peoples recognizes by law in Chile?’ which had ten possible answers (i.e. Aymara, Rapa-Nui (Pascuenses), Quechua, Mapuche, Acatameno (Lincai Antai), Coya, Kawesqar (Alacalufes), Yagan (Aymara) or Diaguita). We dichotomised the variable into ‘yes’ (belong to any of the nine indigenous peoples) and ‘no’ (do not belong).
National Health Survey 2003: anaemia information
Due to the lack of hemoglobin (Hb) information in 2016–2017 ENS, anaemia and the corresponding education information was obtained from the last national survey that had micronutrient status information that was the 2003 ENS(10). The 2003 ENS is a cross-sectional national representative sample which included 3619 participants (women, n 1973), aged ≥17 years, stratified by urban–rural and region population and had a rate of response of 90 %. Sampling procedures followed a multistage, stratified and cluster design.
Anaemia
Given the vulnerability of developing iron deficiency and anaemia in women and the median age of menopause in Chilean women(Reference Blümel, Chedraui and Calle34), Hb concentration was determined only in women population ≥20 years. Women were excluded if they were <20 years (n 86), had no available Hb measurement (n 144) or education information (n 4). In total, we analysed available Hb data of 829 (20–49 years) and 910 (>49 years) women. Hb concentration was determined by colorimetric method(10). Anaemia was defined according to the WHO criteria as Hb concentration <12 g/dL(Reference Chan35). Hb values were not adjusted by altitude, because this information was not available in the 2003 ENS. Women were classified with a low (<8 years), medium (8–12 years) and high (>13 years) education level based on self-reported years of completed schooling.
Statistical analyses
We estimated the prevalence and 95 % CIs of indicators of overweight, obesity, excess weight, underweight, short stature and anaemia according to sex, ethnicity, age groups, monthly household income and education levels. Continuous and categorical variables were described as means or percentages and 95 % CI, respectively. To compare our findings with the results of other Latin American countries included in this ‘Double Burden Series’, we classified adult population by age categories: 20–49 years and >49 years. Differences in means and proportions of excess and undernutrition by SES and ethnicity were tested using the test for linear combinations (‘lincom’ command in Stata 12.0). The statistical significance level was set at P < 0.05. All the statistical analyses were performed with Stata version 12 (Stata Corp.) incorporating appropriate survey sample weight.
Results
Age, education level, ethnicity and household characteristics of the sample stratified by income levels are shown in Table 1. The average age of 20–49 year samples was 34·6 years in women and 33·2 years in men, while in adults >49 years it was 62·9 years in women and 63·1 years in men. Additionally, 8 % of the subjects identified themselves as indigenous. Most of the participants had medium education level (women (53·1 %) and men (44·7 %)) and were classified as medium monthly household income level. Younger adults (20–49 years) had higher educational levels compared with older adults (>49 years). As expected, there was a positive relationship between education level and monthly household income levels and household characteristics; for example, women and men with a highest income had highest education, and women and men with lower income were more likely to use firewood or carbon for cooking and had less water and sanitation facilities than women and men that had a highest income level. Interestingly, 12·4 % of low SES adults identified themselves as indigenous, whereas only 3 % of high SES adults indicated being indigenous.
Sample characteristics by household income in Chile based on the 2016–2017 National Health Survey
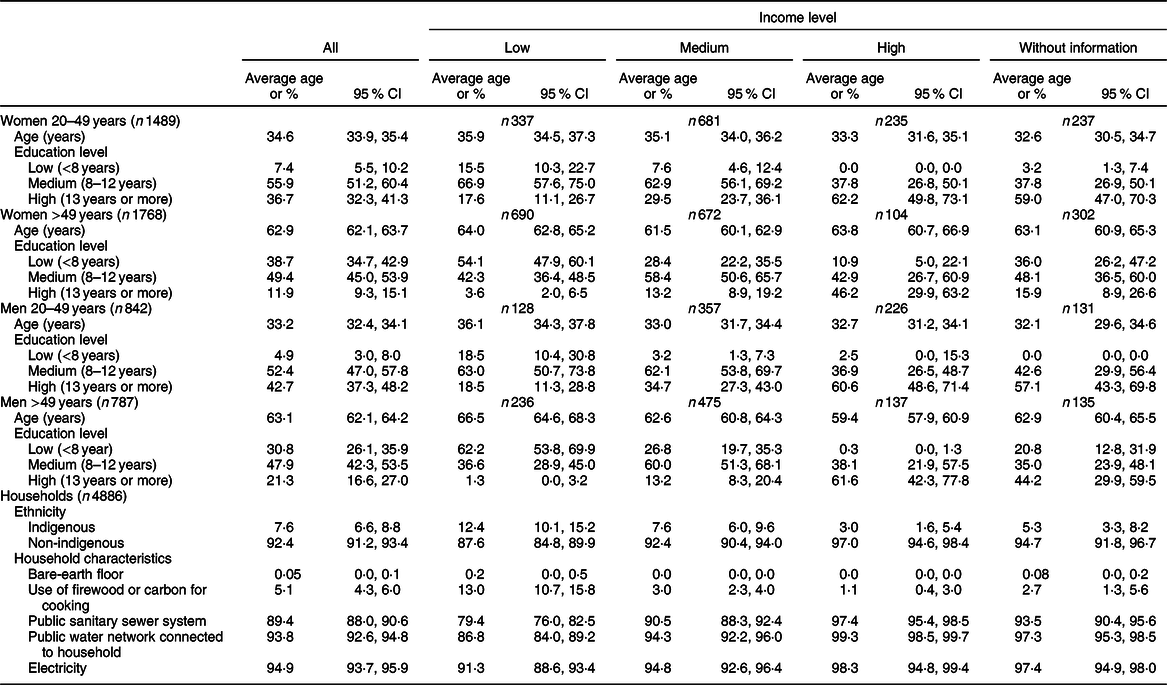
ENS, National Health Survey.
Nutrition status in adult Chilean population
Most of the population (78·7 % in women and 77·2 % in men) had excess weight, whereas short stature and anaemia were below 13 and 8 %, respectively. Underweight was almost negligible (<2 % in both sexes) (Table 2). Obesity was more prevalent in women than in men, while the opposite was seen for overweight prevalence (P < 0·05). Furthermore, in both sexes, the prevalence of obesity increased with age.
Malnutrition’s prevalence by household income, education level and ethnicity among adult women and men in Chile based on the 2016–2017 National Health Survey

§ Weighted %.
‖ Overweight: BMI ≥25 and <30 kg/m2 for women and men.
¶ Obesity: BMI ≥30 kg/m2 for women and men.
†† Overweight/obesity: BMI ≥ 25 kg/m2 for women and men.
‡‡ Underweight: BMI < 18·5 kg/m2 for women and men.
§§ Short stature: height < 1·49 m for women 20–49 years, height < 1·62 m for men 20–49 years.
‖‖ Anaemia: defined as <120g/l for women. The sample size for anaemia was 829 for women 20–49 years and 910 for women +50 years. The data were based on the 2003 National Health Survey (ENS).
* P value < 0·05 medium v. high.
† P < 0·05 high v. low.
‡ P < 0·05 low v. medium.
** Indigenous v. non-indigenous.
Nutrition status, socioeconomic status and ethnicity in women
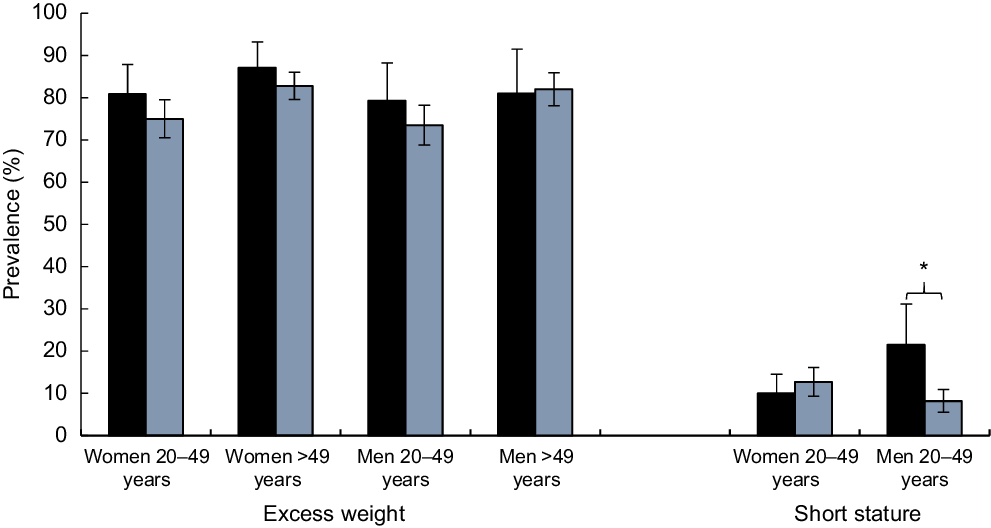
We observed an inverse association between SES (either by income or educational level) with excess weight (<49 years) and obesity (>20 years) (P < 0·05) (Table 2; Figs 1 and 2). Obesity was also more frequent among indigenous than non-indigenous young women (<49 years; P < 0·05); however, these differences did not reach statistical differences among older women (P > 0·05) (Fig. 3).
Prevalence of excess weight and short stature in men and women by income. Low, low income level, medium; medium income level; and high, high income level. ![]() , low;
, low; ![]() , medium;
, medium; ![]() , high. Women 20–49 years (n 1489), women > 49 years (n 1768), men 20–49 years (n 842), men > 49 years (n 983). *P value < 0·05
, high. Women 20–49 years (n 1489), women > 49 years (n 1768), men 20–49 years (n 842), men > 49 years (n 983). *P value < 0·05

Prevalence of excess weight and short stature in men and women by education level. ![]() , low (0–7 years);
, low (0–7 years); ![]() , medium (8–12 years);
, medium (8–12 years); ![]() , high (>12 years). Women 20–49 years (n 1489), women > 49 years (n 1768), men 20–49 years (n 842), men > 49 years (n 983). *P value < 0·05
, high (>12 years). Women 20–49 years (n 1489), women > 49 years (n 1768), men 20–49 years (n 842), men > 49 years (n 983). *P value < 0·05

Prevalence of excess weight and short stature in men and women by ethnicity. ![]() , indigenous;
, indigenous; ![]() , non-indigenous. Women 20–49 years (n 1489), women > 49 years (n 1768), men 20–49 years (n 842), men > 49 years (n 983). *P value < 0·05
, non-indigenous. Women 20–49 years (n 1489), women > 49 years (n 1768), men 20–49 years (n 842), men > 49 years (n 983). *P value < 0·05
In young women (<49 years), short stature was more frequent among low-educated women (P < 0·05), while undernutrition was more frequent among mid-educated women (P < 0·05) and anaemia among high-educated women (P < 0·05). No significant differences in undernutrition indicators were observed in older women (>49 years; P > 0·05) by SES (Table 2).
Nutrition status, socioeconomic status and ethnicity in men
In men, excess weight did not significantly differ by SES or ethnicity, except for a lower prevalence of overweight among the young men (<49 years) with low education (P < 0·05, Figs 1 and 2).
In the case of undernutrition indicators, we observed an inverse relationship between education and short stature (P < 0·05); short stature was also more prevalent among indigenous men than in non-indigenous (P < 0·05) (Fig. 3).
Discussion
Our results showed that Chile presents a high prevalence of excess weight (78·7 % in women and 77·2 % in men), as well as a low prevalence of undernutrition (anaemia in women (7·2 %), short stature (13 %) and underweight (<1 %) in men and women). Compared with other countries in the region, the prevalence of obesity and excess weight in the Chilean population is critically high. Our results are only comparable with those reported in Mexican and Salvadorian adult population, in which 71 and 33 % of women aged >20 years had excess weight and obesity, respectively(Reference Ng, Fleming and Robinson36), while other Latin American countries have shown a lower prevalence of obesity and excess weight in adults. In contrast, the prevalence of anaemia in childbearing age women and underweight is the lowest in the region(Reference Mujica-Coopman, Brito and López de Romaña37). Additionally, compared with other countries in the region, for example, Mexico, where the prevalence of short stature is significantly high in low education and low SES adults compared with those with high SES(Reference Castro-Porras, Rojas-Russell and Aedo-Santos38), Chilean population statures seems to be linked with socio-economic factors, showing that people from lower SES are more likely to be shorter that people from higher SES. As a result, the double burden situation does not exist in Chile anymore(Reference Atalah, Amigo and Bustos11); similar trends of the nutrition situation have been described in post-transitional countries in which undernutrition problems are eradicated but replaced by excess weight issues.
Potential explanations for this situation are related to the rapid nutritional transition experienced by Chilean population(Reference Albala, Vio and Kain4,Reference Vio, Albala and Kain5) . In 1960s, the prevalence of undernutrition in children (<6 years) was 37 %, dropping to 2·9 % in 2000(Reference Willett, Bendich and Deckelbaum2). Successful policies and programs such as the universal access to the healthcare system and the implementation of national complementary food programs have been key strategies to eradicate undernutrition in the country(Reference Brito, Olivares and Pizarro39). The improvement of sanitary conditions (e.g. sewage system)(Reference Schlesinger, Weinberger, Figueroa and Underwood40,Reference Dangour, Watson and Cumming41) and the mandatory Fe wheat flour fortification (30 mg of Fe/kg of wheat flour) have been described as key public health actions to prevent anaemia and underweight in vulnerable population(Reference Olivares, Pizarro and Hertrampf42,Reference Ríos-Castillo, Brito and Olivares43) . Despite these successful results, Chile is facing an alarming prevalence of excess weight(7). It is well-known that several factors influence the nutritional status (e.g. dietary intake, socioeconomic status, healthcare facilities)(Reference Black, Victora and Walker44). Over the last decades, Chile has experienced rapid economic changes. Between 1980 and 2014, the average rate of economic growth was 5 %, being the highest rate in Latin America(Reference De Gregorio18). This situation has influenced the population’s dietary patterns, increasing the consumption of energy-dense, sugar and fat-rich food, known as a ‘Western diet’(Reference Popkin45). Trade liberalisation and rapid expansion of supermarkets and fast-food restaurants have profoundly influenced the dietary pattern(Reference Rebolledo, Reyes and Corvalán46). Also, the increase in income in families has promoted greater portion sizes and away-home food intake(Reference Corvalán, Garmendia and Jones-Smith8,Reference Popkin and Reardon47) . Concomitant with the changes of food habits, the prevalence of sedentary lifestyle had continuously increase affecting more than 80 % of adult Chilean population(7).
We found a higher prevalence of obesity and excess weight in women compared with men, while men population had a higher prevalence of overweight than women. Previous research has indicated a complex relationship between sex, SES and the prevalence of excess weight and obesity(Reference Garawi, Devries and Thorogood48). On one side, it has been shown that women are more likely to choose added sugar and high-fat content foods compared with men, which may promote the weight gain due to an excess of energy intake(Reference Kanter and Caballero22). Additionally, men classified in the low socioeconomic level had shown higher rates of occupation compared with women. Occupation in the lowest socioeconomic level population remained a significant source of physical activity and subsequently a higher energy expenditure, which may explain the differences found in the prevalence of obesity compared by sex in the low SES group(Reference Kanter and Caballero22).
However, not only dietary intake and physical activity may explain these differences, cultural factors, such as the role of woman in the society and differences on bodyweight concerns, self-esteem(Reference Phares, Steinberg and Thompson49) and dissatisfaction of their body by sex(Reference Williamson and Delin50) also define particular views of the beauty that do not necessarily follow biomedical standards may also contribute to explain our findings(Reference Robinovich, Ossa and Baeza51). An interesting work recently published by Keller et al.(Reference Keller, Kling and Fuchs52) in children showed that encouragement to eat is reinforced in males but not in females. Additionally, their findings indicated that females have a higher neural reactivity to high-energy food compared with male children, which may contribute to the higher risk of obesity in females than males later in life.
In addition, our results showed that poorer and less educated women had a higher prevalence of obesity compared with the richest, while in men, no significant differences were found in obesity and excess weight prevalence’s comparing by income and educational level. Contrary, less educated men had a lower prevalence of overweight compared with those with a higher educational level. Differences in malnutrition prevalence by sex and SES have been also shown in other countries of the region. Results of a novel modelling of nutrition stages dynamics in Colombian population showed that the burden of excess weight is likely higher in those with lower SES(Reference Meisel, Sarmiento and Olaya53). Additionally, Hernandez et al. (Reference Hernandez, Reesor and Murillo54) found that food insecure women had a greater percentage of obesity and overweight compared with food secure women, while among men the proportion of obesity and overweight was similar between food secure and food insecure participants.
Female sex is a well-known risk factor for inequity and poverty(Reference Doyal55). Findings from a large study conducted by Wells et al.(Reference Wells, Marphatia and Cole56) which included data from sixty-eight countries showed that wealth and sex inequalities are associated with the prevalence of obesity in women. Despite the rapid economic growth, Chile is affected by a dramatic income inequality. It has been reported that the income distribution is fourteen times lower in the poorer quartile compared with the richest(Reference Gammage, Alburquerque and Durán17). In the USA, it has been described that poorer people have a less varied diet and less access to healthier food(Reference Larson, Story and Nelson57). Low cost and easily accessible food are characterised by a high content of sugar, low-quality fat and increased palatability, which may explain a higher energy intake and a subsequent higher prevalence of obesity in poorer adults. However, women have a higher risk of food insecurity and inadequate dietary intake which may promote buying low cost and high-energy dense food. Also, it has been described that low SES woman has reduced participation in food’s budget leading to poorer nutrient-quality diets(Reference Wells, Marphatia and Cole56), which may partially explain the sex differences in the prevalence of obesity in low SES adults.
We also found that richer and higher educated women had a lower prevalence of excess weight and short stature compared with the poorer group, while men with a higher income and education level were less likely to have short stature compared with the poorest and lowest education level group. It has been speculated that women with a higher educational level might develop obesity-preventing health behaviour, as well as better healthcare access(Reference Cohen, Rai and Rehkopf58) that may partially explain the lower prevalence of excess weight. Additionally, a potential explanation for the link between SES and short stature is that height is closely related to a variation in net nutrition, meaning that poorer people probably have a more deficient diet, affecting early development and stature(Reference Perkins, Subramanian and Smith59,Reference Núñez and Pérez60) .
For the first time in Chile, we are showing in a national representative sample of adults that indigenous women (<49 years) have a higher prevalence of obesity, while men (<49 years) have a higher prevalence of short stature compared with non-indigenous population. It has been previously described a complex interaction between ethnicity, inequality and sex differences in indigenous population in Chile. Indigenous tend to have a lower SES and education level, which may affect the variety of the diet and the preference for low-cost and ultra-processed foods which may promote a positive energy balance and a subsequent higher risk of obesity in women. Additionally, a recent study conducted by Fernández et al.(Reference Fernández, Pereira and Corvalán61) showed that indigenous boys have a higher risk of precocious gonadarche and pubarche. In European and US boys(Reference Silventoinen, Haukka and Dunkel62,Reference Biro, McMahon and Striegel-Moore63) , early puberal onset has been inversely associated with height in adulthood, which may explain the shorter height that we found in indigenous men compared with non-indigenous; higher adversity during infancy and adolescence may also contribute to long-term short stature.
Current programs and policies focused on preventing obesity
In Chile, there are several initiatives in place to promote breast-feeding, a known protective factor of obesity for both the children and the mother(Reference Bel, Wagner and Feldman64–Reference Owen, Martin and Whincup67). Baby Friendly Hospitals(Reference Schellhorn and Valdés68) that promote early bonding and latching ensure perinatal breast-feeding education, breast-feeding consultancy after birth and control the early introduction of formula, breast-feeding education to pregnant women and breast-feeding support for breast-feeding mothers, including lactating clinics, through primary healthcare and the multi-sectoral program ‘Chile Crece Contigo’(Reference Schellhorn and Valdés68), and a six months paid maternity leave(69). There is also the ‘Vida Sana’ program that was one of the first strategies that Chile developed against obesity. This program offers free-charge dietitian, medical and physical interventions in public healthcare centers for population between 2 and 64 years. Considering that obesity is a multifactorial disease, in 2006, the Chilean government endeavoured the implementation of a public–private strategy, ‘Estrategia Global contra la Obesidad’ (EGO), as a multi-sectorial and multidisciplinary collaborative initiative between the Chilean Ministry of Health and the WHO. This strategy was aimed to tackle the high rates of obesity and chronic diseases through the promotion of healthy diet and active lifestyle. Additionally, as an effort to promote healthy eating patterns and ensure healthier environments for children, Chile implemented the first food labelling and advertising law (Law 20.606), which included the use of a warning label on packaged foods with excess calories, sodium, sugars or saturated fats as well as restricted marketing of those foods to children and restriction to sell or promote those foods in nursery schools or schools(Reference Corvalán, Garmendia and Jones-Smith8,Reference Corvalán, Reyes and Garmendia70,Reference Corvalán, Reyes and Garmendia71) .
All these strategies have faced several challenges for an adequate implementation and do not consider evaluation components as part of their implementation. There have been several efforts to evaluate these policies, but evaluation components need to be incorporated in the phase of the design to be able to properly assess the effectiveness of the different actions, considering a sex, SES and ethnicity approach. This information is key to prevent inefficient allocation of valuable resources and to improve the current public health actions. Our study should contribute in highlighting high-risk groups in which to focus action as we included a large and national-representative data of women and men population. Our study also highlights the need of collecting updated data on anaemia prevalence in women of childbearing age as well as extending data collection on children to better monitor the nutritional trends in the country.
Conclusions
Currently, Chilean adult population presents a high prevalence of obesity and overweight while undernutrition (including anaemia) is low. Nutrition status of the population varies importantly by sex, SES and ethnicity highlighting the need that future policies and programs address these important inequalities.
Acknowledgements
Acknowledgements: The authors thank the Ministry of Health of Chile for supplying the databases (Chilean National Health Surveys 2010 and 2003). Also, the authors thank the Latin American Nutrition Leadership Program (Programa LILANUT) for the coordination of this supplement. We declare not receiving sponsorship from any industry. Financial support: The current study is a secondary analysis of databases, and no specific funds were available for this purpose. Conflicts of interest: M.F.M.-C., D.N.-R., S.L.-A. and C.C. have no conflicts of interest. Authorship: C.C. and M.F.M.-C. designed the research; D.N-R. and S.L.-A. led the data compilation; S.L.-A. led the statistical analyses; C.C., D.N-R. and S.L.-A. provided input on study execution; M.F.M.-C. wrote the first draft of the manuscript; C.C., M.F.M.-C., D.N-R. and S.L.-A. led the interpretation of the data and manuscript completion. All authors contributed to data interpretation and manuscript writing and read and approved the final manuscript. Ethics of human subject participation: The National Health Surveys and their informed consents were approved by the Ethics Committee of the Medicine School of the Faculty of Medicine, Pontifical Catholic University of Chile before its execution, in accordance with the Helsinki Declaration. The National Health Surveys data are available by the Epidemiology Department, Ministry of Health with no identifiable information on survey’s participants.


