

Introduction
Public interest and concerns about foods and lifestyles that maintain and improve health have increased lately. However, it is difficult for individuals to detect their dietary imbalances. An accurate assessment of dietary intake is essential for identifying the relationship between health and nutrition. Dietary survey methods include methodologies, such as the weighed record method, 24-h dietary recalls, dietary history, and food frequency questionnaires (FFQs); however, each method has specific advantages and disadvantages.(Reference Barrett-Connor1) The weighing method can measure the amount of food ingested quantitatively and qualitatively with high accuracy; however, it places a heavy burden on the participant and requires manpower and time for data processing. The 24-h recall relies on the participant’s memory and requires a long interview with a skilled interviewer. In contrast, the FFQ is an easy method for collecting information and understanding dietary habits; nevertheless, it has limitations, such as the inability to determine the exact amount of food ingested. Thus, conventional dietary survey methods have strengths and several shortcomings.
Significant progress has been made in information and communication technology (ICT) worldwide. Various innovative tools incorporating ICT have also been developed for dietary surveys. Emerging technologies used to address the challenges associated with dietary assessment include food recording via mobile systems (applications),(Reference Carter, Albar and Morris2) 24-h dietary recall,(Reference Blanton, Moshfegh and Baer3,Reference Bradley, Simpson and Poliakov4) and FFQs(Reference Forster, Fallaize and Gallagher5,Reference Sabir, Rosendahl-Riise and Dierkes6) via online tools (web-based), camera-based tools,(Reference Illner, Freisling and Boeing7) and wearable sensors.(Reference Dimitratos, German and Schaefer8,Reference Fontana, Higgins and Schuckers9) The use of ICT eliminates the need for an interviewer to be present, and participants can create dietary records (DRs) at their own pace, thus saving time and costs. Furthermore, the standardisation of protocols for data collection is expected to improve the quality, consistency, and completeness of data and reduce the effort of interviewers and data entry personnel.(Reference Ngo, Engelen and Molag10) Some tools have been used in national nutritional surveys conducted in the United States(Reference Moshfegh, Rhodes and Baer11–Reference Subar, Kirkpatrick and Mittl13) and Europe.(Reference Carter, Albar and Morris2,Reference Forster, Fallaize and Gallagher5,Reference Simpson, Bradley and Poliakov14) However, ICT in nutritional epidemiology in Japan remains insufficient.
Recently, self-monitoring of diet using smartphones has attracted attention. However, Japanese diet-tracking mobile applications vary in their ability to assess dietary intake.(Reference Shinozaki and Murakami15) Moreover, applications that allow users to self-record food intake have exhibited suboptimal performance, particularly because of foods missed during recording and inconsistencies in the application’s food database.(Reference Chen, Berkman and Bardouh16) Therefore, self-monitoring technologies must be further developed and evaluated.
In 2005, the Ministry of Health, Labour and Welfare and Ministry of Agriculture, Forestry and Fisheries of Japan jointly published the ‘Japanese Food Guide Spinning Top (Japanese Food Guide ST)’(17–19) based on Dietary Guidelines for Japanese,(20) which serves as a guide for achieving a healthy diet. In Japan, meals consist of ‘dishes’ that combine multiple foods flavoured using traditional seasonings.(Reference Murakami, Livingstone and Sasaki21,Reference Shinozaki, Murakami and Asakura22) The Japanese Food Guide ST expresses the amount of food consumed daily in terms of ‘dishes’ rather than ‘nutrients’ or ‘food’ for each of the five dish categories that characterise the Japanese diet: grain dishes, vegetable dishes, main dishes, milk, and fruits. It is designed to improve significantly unbalanced diets by presenting a quantitative reference for daily diets in a simple and straightforward fashion.(Reference Yoshiike, Hayashi and Takemi23) Greater dietary adherence to the Japanese Food Guide ST reduces the risk of mortality and cardiovascular disease, especially cerebrovascular disease, in Japanese adults.(Reference Kurotani, Akter and Kashino24)
Despite their benefits, the Japanese Food Guide ST has not been systematised online using ICT yet. Therefore, we developed an ICT-based online system involving the Japanese Food Guide ST to streamline the collection of dietary intake data and facilitate the assessment of dietary balance. The aim of this study was to examine the utility and applicability of the system by comparing the dietary balance scores obtained from the system with nutrient and food intake data calculated using the weighing method in the DR survey. This system is expected to enable dietitians and other professionals to simplify data collection for dietary balance assessment. In the future, if the online dietary balance survey system is developed enough to be applied at the individual level, it may be possible for individuals to independently adopt habits that maintain and improve their health.
Experimental methods
Study design and participants
Because the study design and participants have been described in detail elsewhere,(Reference Tousen, Shimomura and Yasudomi25) only a brief description is provided in this report. From October 2021 to December 2021, participants were recruited online via an e-mail magazine operated by Healthcare Systems Co., Ltd. Individuals who were informed and consented to participate were enrolled as study participants if they were deemed eligible for participation based on background research. The inclusion criteria for participation in the study were as follows: (1) Japanese nationals aged 20–80 years at the time of providing informed consent and (2) those without serious cerebrovascular, heart, liver, kidney, gastrointestinal, or infectious diseases. The exclusion criteria were as follows: (1) pregnant or breastfeeding women; (2) those requiring continuous treatment, medication, or lifestyle guidance because of the disease; and (3) those involved in other clinical trials. The requisite sample size for this study was estimated using G * Power 3.1.9.6.(Reference Faul, Erdfelder and Buchner26) Based on an assumed correlation coefficient of 0.5, a significance level of 5%, and a power of 80%, the estimated sample size was 29 individuals. Accordingly, 52 participants were enrolled in this study to accommodate potential dropouts. Of these participants, those who were retired, those who were taking supplements that affect urinary metabolites, and those who were unable to collect urine were excluded, and finally, 34 participants were included in the final analysis. The participants’ age, sex, height, and weight were collected via a web-based questionnaire. Participants were asked to self-report their height and weight, which were then used to calculate the body mass index (BMI).
Ethical approval
This study was conducted according to the guidelines laid down in the Declaration of Helsinki, and all procedures involving study participants were approved by the Human Research Committees of the National Institutes of Biomedical Innovation, Health and Nutrition and other facilities (approval number: Ken-ei 168, approval date: 2 December 2021). Written informed consent was obtained from all participants before participating in this survey.
Dietary survey
In January 2022, data collection from the DRs and non-face-to-face interviews were conducted. Dietary intake data were collected using a semi-weighted household DR for 1 day, excluding Sundays and public holidays. The survey was conducted based on the method used in the National Health and Nutrition Survey (NHNS) in Japan.(27) All participants recorded the weights of all the foods consumed using a pre-prepared kitchen scale. If weighing was not possible (e.g. meals were consumed on the go), portion sizes or amounts of food consumed and details of the leftovers were estimated. All meals consumed by the participants were also photographed using smartphone cameras in addition to DR. The participants took pictures of their meals according to a meal photography manual developed to standardise food photography and sent the pictures to the researchers by uploading them to the LINE mobile application (LINE Co., Ltd., Tokyo, Japan) and Google Cloud (Google LLC, CA, USA). To improve the data quality of the DR, non-face-to-face interviews were conducted by six dietitians and/or registered dietitians using the web-based meeting system Zoom (Zoom Video Communications, Inc., San Jose, CA, USA) based on the DRs and meal photographs. The main purpose of the interview was to verify the accuracy and completeness of the dietary information provided by the participants. From February to March 2022, six trained dietitians and/or registered dietitians converted the food portion sizes or quantities estimated and recorded by participants into food weights according to a dietary survey manual. These food weights were then coded according to the food code table based on the Standard Tables of Food Composition in Japan.(28) Using these data, the energy, nutrient, and food intakes were calculated. Food group categorisation was performed based on the NHNS classification.
Online dietary balance survey system using the Japanese Food Guide ST
The Japanese Food Guide ST is based on the Dietary Guidelines for Japanese published in 2000 and suggests the types and amounts of food that individuals should consume daily to promote health.(Reference Yoshiike, Hayashi and Takemi23) The meals described in the guide comprise grain dishes (e.g. rice, bread, and noodles), vegetable dishes (e.g. vegetables, mushrooms, potatoes, and seaweed), main dishes (meat, fish, eggs, and soybeans), milk (milk and dairy products), and fruit (fruits and 100% fruit juice) (Supplementary Figure 1). Rather than focusing on the intake of specific nutrients, this approach emphasises a balanced diet through the appropriate distribution of dishes, focusing on the main ingredients of each dish. In the Japanese Food Guide ST, the term ‘serving (SV)’ is used to indicate the quantity of each dish. One SV is defined according to the weight of the main ingredient or the main nutrient content of the main ingredient, depending on the dish category. One SV of a grain dish contains approximately 40 g of carbohydrates. The weight of the main ingredient in one SV of each vegetable dish is approximately 70 g. One SV of main dishes contains approximately 6 g of protein, and one SV of milk provides approximately 100 mg of calcium. The weight of the main ingredient in one fruit SV is approximately 100 g. The recommended SVs of food for each category and the recommended total energy intake are specified according to sex, age, and physical activity level. The recommended energy intake from snacks and alcoholic beverages is < 200 kcal/day (Supplementary Figure 1).(19,Reference Yoshiike, Hayashi and Takemi23,Reference Kurotani, Akter and Kashino24) In the Japanese Food Guide ST, dietary balance is defined as the number of SVs of grain dishes, vegetable dishes, main dishes, milk, and fruit that must be consumed. In other words, the goal is to consume nutrients and energy in a balanced manner by consuming the appropriate amounts of dishes and foods. For example, the basics for a balanced diet are 5–7 SVs for grain dishes, 5–6 SVs for vegetable dishes, 3–5 SVs for main dishes, 2 SVs for milk, and 2 SVs for fruit. In our online balance system, the same definition of dietary balance is used.
The online dietary balance survey system based on the Japanese Food Guide Spinning Top we developed. On the webpage of this system, the dietitian can select the photograph registered on the set date, which will lead to the editing screen. The dietitian can register the servings (SVs) and calories while referring to photographs of the food consumed. The dietitian will then be prompted to select the ‘Category of the dish’ followed by the ‘Name of the dish’. If the dish is not listed, the dietitian can select a dish type that is similar to the actual dish consumed and enter the name of the dish in the ‘Dish you actually ate’ column. When the dietitian selects the ‘Name of the dish’, the SV and standard portion size are automatically displayed on the screen. The dietitian can manually correct the SV if the portion size set as a standard differs from the actual intake value. Similarly, the dietitian can adjust the calorie content of ‘Snacks, confections, and sweetened beverages’ and ‘Alcoholic beverages’. The balance scores were calculated using the system. Images including identifiable branded food products are reproduced with permission.

In this study, we developed an online dietary balance survey system for dietitians, based on the Japanese Food Guide ST (Figure 1). When a dietitian enters the meal details into the system while looking at registered photographs, the system calculates the total SVs for each dish category. This system is a tool for dietitians and specialists to systematically collect and organise intake data based on food groups and portion sizes. Therefore, it does not independently evaluate the quality of the overall meal or calculate a comprehensive nutrient balance score. Original and modified dish categories (‘Grain dishes’; ‘Vegetable dishes’; ‘Main dishes’; ‘Milk’; ‘Fruits’; ‘Drinking water and unsweetened tea’; ‘Snacks, confections, and sweetened drinks’; and ‘Alcoholic beverages’) were established based on the Japanese Food Guide ST SV quick reference table.(29) This table forms part of the Japanese Food Guide ST and provides definitions and specific examples of the standard serving size (SV) for dish categories. It is designed to help users estimate standard serving sizes for different foods and facilitate accurate dietary assessments. The SVs and intakes for each dish category were calculated in the same manner as the Japanese Food Guide ST described above and were defined as a dietary balance score. The dietary balance score represents the total daily SV for each dish category, as determined by the Japanese Food Guide ST. The units for each dietary balance score were as follows: SV for ‘Grain dishes’, ‘Vegetable dishes’, ‘Main dishes’, ‘Milk’, and ‘Fruits’; kcal for ‘Snacks, confections, and sweetened drinks’ and ‘Alcoholic beverages’; and ml for ‘Drinking water and unsweetened tea’. In this system, 178 dishes were registered based on the SV quick reference table (Supplementary Figure 1).
Data entry into the online dietary balance survey system
From November to December 2022, six dietitians and/or registered dietitians entered the dietary data based on the meal photographs entered by the participant in the online dietary balance survey system. Although the dietitians and/or registered dietitians who conducted non-face-to-face interviews also participated in data entry, they did not refer to the dietary survey records or notes taken during the interviews; they only entered the data based on information from the meal photographs. Thus, the potential for observer bias was minimised. On the webpage of the online dietary balance survey system, the dietitians could select the photograph of the dishes consumed from the 1-day dietary survey mentioned above, which led to the editing screen. The dietitians entered the SVs and calories derived while referring to photographs. The dietitian could select the ‘Category of the dish’ and then the ‘Name of the dish’ from the edit screen to describe the dish while looking at the photographs. If the dish was not listed, they were prompted to select a dish type similar to that dish and enter the dish’s name in the ‘Dish you actually ate’ column. When the dietitian selected the ‘Name of the dish’ from dish categories (‘Grain dishes’, ‘Vegetable dishes’, ‘Main dishes’, ‘Milk’, and ‘Fruits’), the SV and standard portion size were automatically displayed on the screen. The dietitian could manually correct the SV if the amount consumed was higher or lower than the standard portion. Similarly, the dietitian could adjust the calorie content of ‘Snacks, confections, and sweetened beverages’ and ‘Alcoholic beverages’. The amount of ‘Drinking water’ and ‘Unsweetened tea’ was recorded in the system by the dietitian. Through these operations, the system displays the daily dietary balance scores for each dish category.
To ensure accurate estimation of portion sizes and categorisation of dishes, the dietitians referred to standardised portion sizes and the official commentary and Q&A sections on quantification of the SVs described in the Japanese Food Guide ST published by the Ministry of Agriculture, Forestry and Fisheries of Japan.(30,31) In addition, they considered the relative proportions of the foods in the photographs and adjusted the SVs based on generally accepted estimation guidelines. If a dish was not listed in the predefined database, the dietitians selected the most similar dish in terms of the main ingredients and portion size to ensure consistency with the Japanese Food Guide ST.
Statistical analyses
All statistical analyses were performed using the IBM SPSS Statistics version 25 (IBM Corp., Armonk, NY, USA). Dietary data are presented as the median (25th and 75th percentiles) and tested for normality using the Shapiro–Wilk test. Correlation analyses were performed to evaluate the association between dietary intake and the online system. As the Japanese Food Guide ST is a dish-based guideline, the SVs for each category represent approximate nutrient intakes. Therefore, examining the relationships between SV-based intake estimates and nutrient intakes derived from the DR provides insight into how well the system reflects actual dietary patterns. We calculated Spearman’s correlation coefficients to evaluate the relationship between the dietary balance scores of each dish category (‘Grain dishes’, ‘Vegetable dishes’, ‘Main dishes’, ‘Milk’, and ‘Fruits’) obtained from the system and the corresponding nutrient or food group intakes estimated from DR. Nutrient and food group intakes from the DR were calculated based on food weights and standard food composition tables. For correlation analyses, dietary balance scores were converted into the estimated weights of nutrients or food components according to the definitions in the Japanese Food Guide ST: 40 g of carbohydrate per SV for grain dishes, 70 g of main ingredients for vegetable dishes, 6 g of protein for main dishes, 100 mg of calcium for milk, and 100 g of fruit for fruits. In the guide, the SV of vegetable dishes is calculated from the weight of the vegetables, mushrooms, algae, and potatoes consumed, and the SV of the main dish is calculated from the weight of the protein sources consumed, such as meat, seafood, eggs, soybeans, and soybean products. Accordingly, the estimated intakes from the system were compared with the total intake of these food groups calculated from the DR. For a properly balanced diet, the balance score would be 5–7 for grain dishes, 5–6 for vegetable dishes, 3–5 for fish and meat dishes, 2 for milk/dairy products, and 2 for fruits. Correlation coefficients were considered based on the criteria proposed by Schober et al.(Reference Schober, Boer and Schwarte32) as follows: negligible (0.00–0.10), weak (0.10–0.39), moderate (0.40–0.69), strong (0.70–0.89), and very strong (0.90–1.00). In addition, Bland–Altman plots(Reference Bland and Altman33,Reference Bland and Altman34) were used to assess the level of agreement between intake estimates from the system and those obtained from the DR. Comparisons were made using the following indicators: carbohydrate intake (g) for grain dishes, vegetable dish group intake (g) for vegetable dishes, protein intake (g) for main dishes, calcium intake (mg) for milk, and fruit intake (g) for fruits. Statistical tests were two-sided, and a significance level of < 5% was considered statistically significant.
Results
Basic characteristics of the study participants and the online dietary balance scores
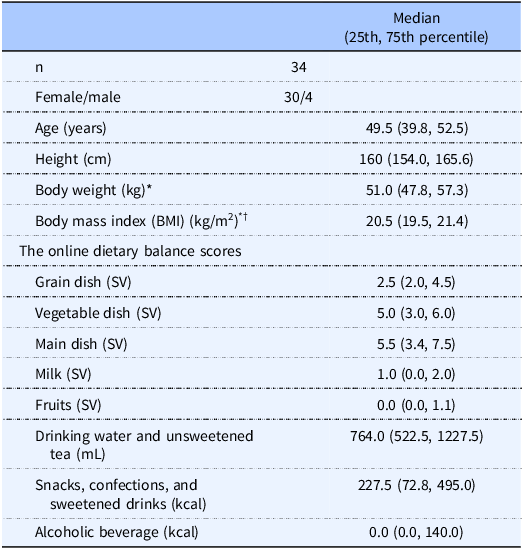
Table 1 presents the basic characteristics of the participants. The participant’s height and weight were self-reported. Body weight and BMI were collected from 33 individuals because the weight of one individual was not recorded. In general, the participants had the average weight and height of a Japanese individual.(27) The dietary balance scores obtained from the online dietary balance survey system are listed in Table 1.
Basic characteristics of the study population and the online dietary balance scores

SV: serving.
* One person’s body weight was not recorded, so body weight and body mass index were collected from 33 people.
† Calculated using self-reported height and body weight values.
Associations between the online dietary balance scores and nutrient intakes from DR
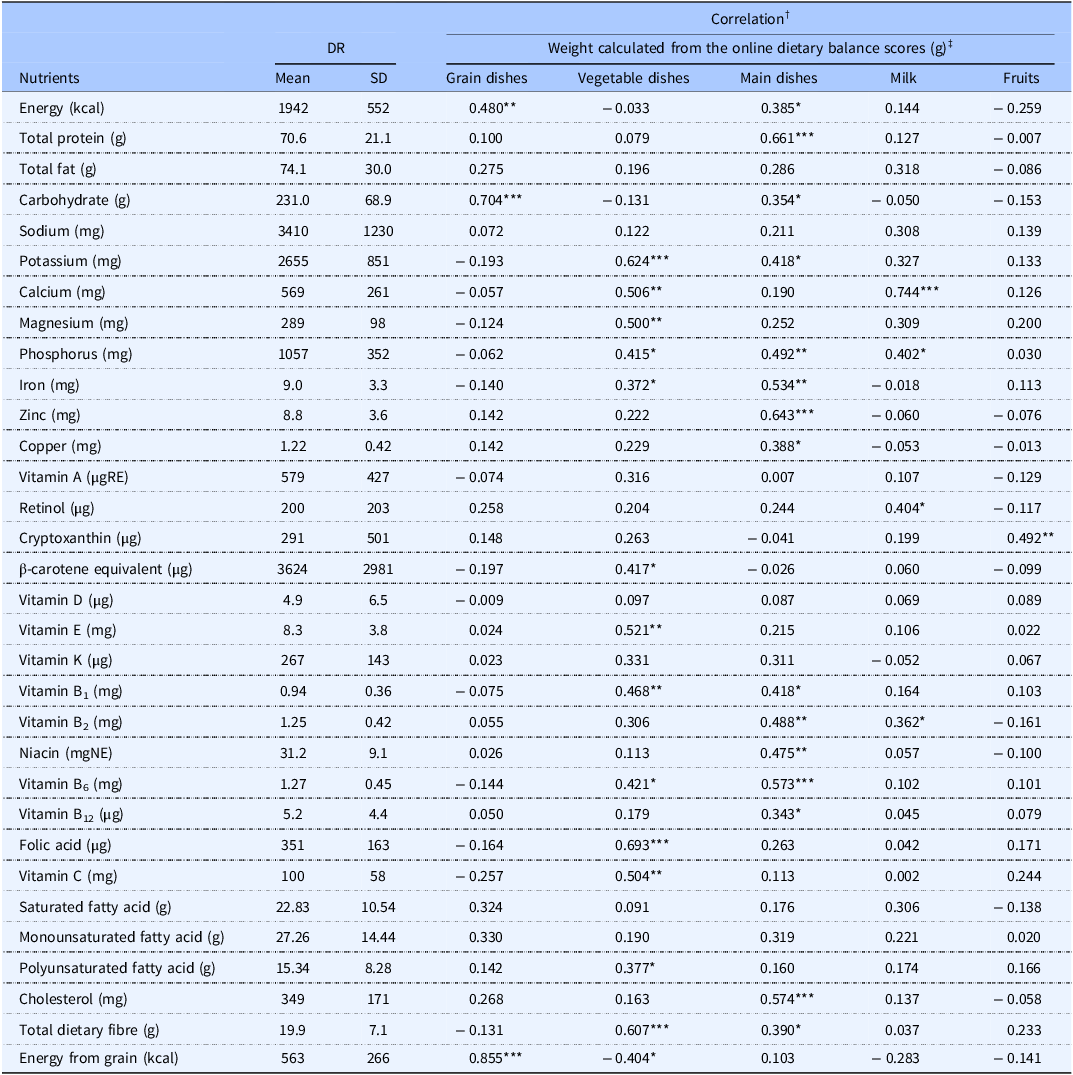
Table 2 shows the relationship between the dietary balance scores derived from the Japanese Food Guide ST and nutrient intakes from the DR. The scores of grain dishes were strongly positively correlated with carbohydrate intake and the grain energy ratio, which is the ratio of energy derived from cereals out of the total energy intake (r = 0.855, p < 0.001). The scores of vegetable dishes were significantly positively correlated with the intake of potassium (r = 0.624, p < 0.001), folic acid (r = 0.693, p < 0.001), and total dietary fibre (r = 0.607, p < 0.001). The scores of main dishes were significantly and positively correlated with total protein (r = 0.661, p < 0.001) and zinc (r = 0.643, p < 0.001) intake. The score of milk was significantly and positively correlated with calcium intake (r = 0.744, p < 0.001). The score of fruits was positively correlated with cryptoxanthin intake (r = 0.492, p < 0.01). Other correlations between scores and nutrient intakes are shown in Table 2.
Association between the online dietary balance scores derived and nutrient intakes from the DR (n = 34)

DR, dietary record; SD, standard deviation.
† The values indicate Spearman’s correlation coefficients between weight estimates derived from the online dietary balance scores and food intakes obtained from the DR. * p < 0.05, ** p < 0.01, *** p < 0.001.
‡ Weight calculated from the dietary balance scores (g) were converted from the dietary balance scores obtained using the online dietary balance survey system. Conversion was based on the definitions in the Japanese Food Guide Spinning Top and was calculated according to the major nutrient or food content per serving for each category: grain dishes were converted using 40 g of carbohydrate, vegetable dishes using 70 g of the weight of the main ingredient, main dishes using 6 g of protein, milk using 100 mg of calcium, and fruit using 100 g of the weight of the main ingredient.
Associations between the online dietary balance scores and food intakes from DR
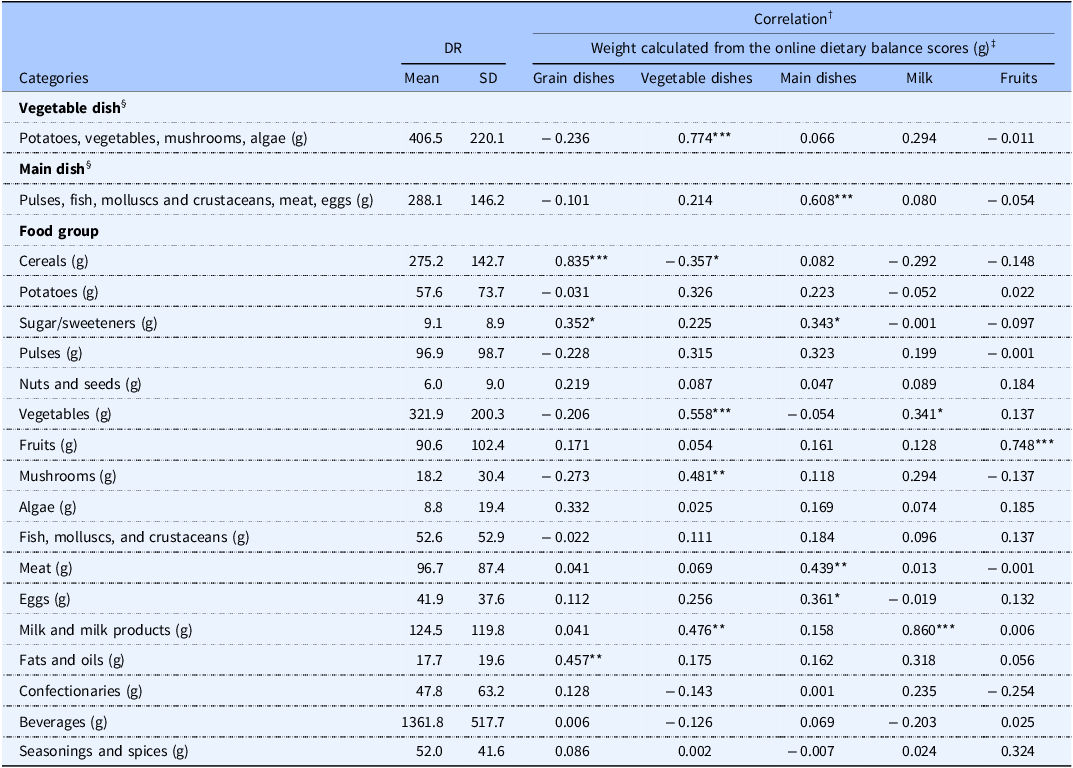
Table 3 shows the relationship between the dietary balance scores derived from the Japanese Food Guide ST and food intakes from the DR. The dietary balance score of grain dishes was significantly and positively correlated with cereal intake (r = 0.835, p < 0.001). The scores of vegetable dishes showed a significant positive correlation with the vegetable dish group intake (r = 0.774, p < 0.001). The score of main dishes was significantly and positively correlated with the main dish group intake (r = 0.608, p < 0.001) and was also positively correlated with meat intake (r = 0.439, p < 0.01). The milk score was significantly and positively correlated with milk and milk product intake (r = 0.860, p < 0.001). The fruit score was significantly and positively correlated with fruit intake (r = 0.748, p < 0.001). Other correlations between dietary balance scores and food intake are shown in Table 3.
Associations between the food/nutrient weights calculated from online dietary balance scores and food intakes from the DR (n = 34)
SD, standard deviation; SV, serving.
† The values indicate Spearman’s correlation coefficients between weight estimates derived from the online dietary balance scores and food intakes obtained from the DR. * p < 0.05, ** p < 0.01, *** p < 0.001.
‡ Weight calculated from the dietary balance scores (g) were converted from the dietary balance scores obtained using the online dietary balance survey system. Conversion was based on the definitions in the Japanese Food Guide Spinning Top and was calculated according to the major nutrient or food content per serving for each category: grain dishes were converted using 40 g of carbohydrate, vegetable dishes using 70 g of the weight of the main ingredient, main dishes using 6 g of protein, milk using 100 mg of calcium, and fruit using 100 g of the weight of the main ingredient.
§ These categories are presented as the total intake of the main ingredient food group, based on the definitions in the Japanese Food Guide Spinning Top. The main ingredients of Vegetable dish are Potatoes, Vegetables, Mushrooms, and Algae, whereas the main ingredients in the Main dish are Pulses, Fish, Molluscs and crustaceans, Meat, and Eggs.
Agreement between the online dietary balance scores and nutrient or food intakes from DR
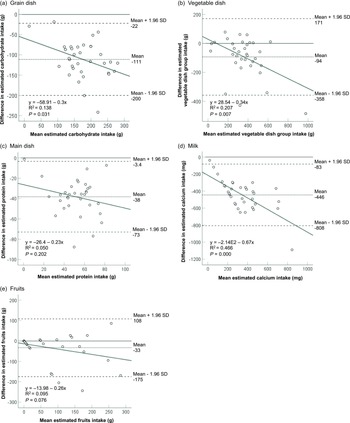
Figure 2 shows a Bland–Altman plot that assesses the agreement between the food or nutrient intakes estimated by the SV–based dietary balance score and that by the DR. The mean differences for the grain, vegetable, main dish, milk, and fruit dishes were −111 g, −94 g, −38 g, −446 mg, and −33 g, respectively. The limits of agreement (mean difference ± 1.96 standard deviation of difference) were –200 to −22 g, −358 to 171 g, −73 to −3.4 g, −808 to −83 mg, and −175 to 108 g, respectively. In addition, the difference between the dietary balance scores and values of the DR shown on the Y axis was negatively biased. This suggests a fixed error in which the value derived from the dietary balance scores was underestimated (grain dish/vegetable dish/main dish/milk, p < 0.001; fruits, p < 0.05). Furthermore, regression analysis was performed to assess the proportional error between the dietary balance scores and the DR value. A significant slope was observed in dish categories, excluding main dish and fruits (grain dish, p < 0.05; vegetable dish, p < 0.01; milk, p < 0.001). This indicates that the difference between each estimate tends to increase as the average intake increases.
The values on the X-axis represent the mean of intake estimated by online dietary balance scores from each dish category and each food group intake from the dietary record (DR), and the values on the Y-axis represents the difference in intake estimated from each method (the intake estimated from the online dietary balance score minus the intake estimated from the DR). The foods and nutrients used for each index were based on the food category definitions in the Japanese Food Guide ST as follows. (a) Grain dish, carbohydrates; (b) Vegetable dishes, vegetable dish group (potatoes, vegetables, mushrooms, and algae); (c) Main dishes, protein; (d) Milk, milk and milk products; and (e) Fruits, fruit intakes. SD, standard deviation. The solid line represents zero bias; the dotted line represents the mean bias of difference in the estimated intakes; the broken line represents mean ± 1.96 SD (limits of agreement). The p value indicates the significance of the regression line.

Discussion
In this study, we examined the utility and applicability of an online dietary balance survey system developed based on the Japanese Food Guide ST. To achieve a balanced Japanese diet, the combination of dishes consumed and each dish’s weight (volume) are important. Since Japanese meals consist of multiple dishes, eating an appropriate combination of grain dishes (which are sources of carbohydrates), vegetable dishes, and main dishes (which are mainly sources of protein), along with milk/dairy products and fruit, in appropriate amounts contributes to a balanced diet. The dietary balance scores for each dish category obtained from the system showed significant correlation between the foods that defined each dish category and the intake of nutrients, which are the major components of that food (Tables 2 and 3). This result is consistent with the definition used in the Japanese Food Guide ST and reflects the idea of assessing dietary balance based on the consumption of each dish category, rather than individual nutrient intakes. In addition, trends in errors in nutrient and food intakes estimated from online dietary balance were clarified. To the best of our knowledge, this study is the first to incorporate the balance scores derived from concept from a Japanese dietary guide into an online system and verify them via comparison with data from DRs.
Regarding the online dietary balance score based on the Japanese Food Guide ST, the score of grain dishes is calculated as the total intake of rice, bread, and noodles.(Reference Yoshiike, Hayashi and Takemi23) Therefore, the dietary balance scores derived from grain dishes were strongly and positively correlated with carbohydrate intake (r = 0.704, p < 0.001) and cereal intake (r = 0.835, p < 0.001). In Japan, the carbohydrate energy ratio is 51.2%, which is higher than the energy intake from dietary proteins (14.5%) and fats (34.3%) and is one of the characteristics of the Japanese diet.(27) The fact that our system was able to confirm the validity of the balance score from grain dishes is particularly important in evaluating Japanese diets.
The main ingredients of vegetable dishes in the online dietary balance score are vegetables, mushrooms, potatoes, and seaweed, defined as sources of vitamins, minerals, and dietary fibre.(Reference Yoshiike, Hayashi and Takemi23) The dietary balance scores of vegetable dishes were moderately correlated with vegetable intake (r = 0.558, p < 0.001) and mushroom intake (r = 0.481, p < 0.01), whereas it was strongly correlated with vegetable dish group intake (total weight of potatoes + vegetables + mushrooms + algae) (r = 0.774, p < 0.001). However, the scores of vegetable dishes were not correlated with the intake of potatoes and algae. As the Japanese diet is composed of various foods,(Reference Suzuki, Goto and Ota35) the correlation between the scores of vegetable dishes and individual food groups, such as potatoes and algae, was thought to be low. The scores of vegetable dishes were significantly correlated with vitamin (vitamins E, B1, and C), mineral (potassium, calcium, and magnesium), and dietary fibre intakes. The results showed that this system might be useful for predicting the intake of vitamins, minerals, and dietary fibre from meals.
Fish, meat, eggs, and soybeans that are the main ingredients in main dishes in the online dietary balance score are defined as sources of protein.(Reference Yoshiike, Hayashi and Takemi23) The dietary balance scores of main dishes were significantly correlated with meat intake (r = 0.439, p < 0.01), main dish group intake (total weight of pulses + fish, molluscs, and crustaceans + meat + eggs) (r = 0.608, p < 0.001), and intake of nutrients, such as total protein (r = 0.661, p < 0.001), phosphorus (r = 0.492, p < 0.01), iron (r = 0.534, p < 0.01), zinc (r = 0.643, p < 0.001), vitamin B2 (r = 0.488, p < 0.01), niacin (r = 0.475, p < 0.01), vitamin B6 (r = 0.573, p < 0.001), and cholesterol (r = 0.574, p < 0.001). The reason for the low correlation with the intake of pulses and of fish, molluscs, and crustaceans, in addition to the same reasons as for the vegetable dishes, could be that more of the participants in this study selected meat over fish and seafood as their main dishes. Bland–Altman analysis of the main dishes showed relatively high agreement with the data from the DR, as the limits of agreement were narrower than those of other dish categories. Furthermore, no proportional error was observed because the slope of the regression line was not significant. These results indicate that the intakes implied by the online dietary balance score of the main dish have relatively high validity among the five dish categories.
According to the Bland–Altman analysis of milk, the mean difference between the dietary balance scores of milk and calcium intake described in the DR was large. Additionally, the wide limit of agreement (mean difference ± 1.96 standard deviation) was considered to indicate poor agreement. The mean difference was also strongly and negatively biased, indicating that intake estimates from the scores were significantly underestimated. However, this is natural because foods other than milk and dairy products can serve as sources of calcium. Spearman’s correlation analysis showed that the dietary balance scores of milk were significantly correlated with calcium and milk/dairy product intake described in the DR. Thus, the dietary balance scores of milk and dairy products can be considered appropriate for the assessment of dietary balance if it was used while taking into account the underestimation of intake.
Contrary to our expectations, the dietary balance scores of fruit converted to fruit weight did not show a significant correlation with vitamin C and potassium intakes; however, a strong correlation was found with fruit intake (r = 0.748, p < 0.001). Notably, 19 of the 34 study participants did not eat fruit. Fruit intake may be difficult to assess using dietary data from a single day as it may be influenced by seasonal and regional factors. Nevertheless, bananas (r = 0.567, p < 0.001), citrus fruits (r = 0.504, p < 0.01), apples (r = 0.512, p < 0.01), fresh fruits (r = 0.461, p < 0.01), and strawberries (r = 0.356, p < 0.05) were significantly correlated with the fruit score (data not shown).
The online dietary balance score is an approximate value estimated using the number of nutrients and food groups that serve as standards for each dish category. This score is designed to assess the overall balance based on dish categories, rather than to provide a precise estimate of nutrient or food intake. Therefore, this value is not perfectly consistent with the total dietary nutrient intake described in the DR. In this study, Bland–Altman analysis showed that the nutrient and food intakes estimated from the online dietary balance scores were underestimated compared with the DR estimates in all dish categories, and the difference increased with increasing average intake. This may be due to differences in the methods used to calculate the dietary balance score and the DR-based calculation: the dietary balance score is based on predefined portion values representing standard portion sizes, whereas the DR-based nutrient intakes are calculated from weighed food records. Therefore, given the differences in the definition and calculation method of the balance score and the calculation method of nutrients and food groups from the DR, this difference is considered reasonable. It is important to note that the dietary balance assessment system is not intended to provide precise nutrient or food intakes but rather to assess the balance of food categories in the entire meal. The high correlation coefficients observed between system-derived and DR-derived values indicate that the system reliably reflects the overall dietary balance even when absolute intakes differ. Thus, the system demonstrates acceptable utility for assessing dietary balance.
Dietary surveys determining the exact amounts of nutrients and foods consumed are associated with high costs and various difficulties.(Reference Barrett-Connor1) The new online nutrition survey system described in our study, which was based on the Japanese Food Guide ST, significantly reduced the burden on the participants. The participants simply took a picture of each meal with their smartphones and uploaded it to the cloud system. There was no need to weigh food with a kitchen scale, record the weights with pen and paper, or conduct lengthy interviews. However, the researcher followed the procedure recommended by the Japanese Food Guide ST and entered the balance scores into the system based on the photographs taken by the participants. The only materials required for input were the system and photographs imported into the system, and the person in charge of the input could work anytime and anywhere. This system has the potential to simplify data collection by reducing various problems associated with dietary survey data collection, such as simplifying the procedures for participants and researchers, standardising data entry tasks, and reducing the risk of human error.
This study has some limitations. Firstly, the findings are primarily applicable to Japanese female adults as most of the participants were women; thus, the generalisability of the results was limited. Although underestimation of dietary intake is usually more prevalent among women, overreporting was observed among women in the 2012 National Health and Nutrition Survey of Japanese adults.(Reference Murakami, Livingstone and Okubo36) Several factors have been demonstrated to influence the accuracy of reporting, including obesity, diet, sex, socioeconomic status, and study setting.(Reference Hill and Davies37) Furthermore, the median BMI of the participants was low, suggesting that the system’s capacity to assess dietary intake in overweight/obese individuals was not evaluated thoroughly.
Secondly, the information obtained from the meal photographs had to be entered into the system by a registered dietitian. Because it requires some knowledge and experience to infer the weight of food from its image, the validity of this method may be reduced if performed by a layperson. Recently, several DRs have been developed using ICT images. There are two main types of dietary surveys that use image analysis: those conducted by trained evaluators and those that automatically analyse images. The estimation of portion size by direct visual inspection of digital photographs by trained evaluators has been evaluated in studies conducted in the United States(Reference Williamson, Allen and Martin38–Reference Martin, Nicklas and Gunturk40) and Italy.(Reference Turconi, Guarcello and Berzolari41) A Danish study showed that this method is effective and feasible if a standardised filming protocol is followed and analysed by trained personnel.(Reference Dahl Lassen, Poulsen and Ernst42) Moreover, the present study followed a similar process, with a skilled dietitian responsible for evaluating the images. In nutritional research, identifying food types and estimating their weights from photographs are critical processes and skills required by evaluators.(Reference Tousen, Shimomura and Yasudomi25) Despite the exploration of ICT-based tools for photograph-based dietary assessment in several studies, food image analysis technology is currently insufficient, and technological evaluation of dietary intake has not yet been realised.(Reference Höchsmann and Martin43) The method of data collection and the accuracy of the tool employed may influence the assessment of dietary intake through a method that utilises a portable digital assistant to estimate dietary intake from photographs.(Reference Kikunaga, Tin and Ishibashi44) According to Stumbo, identifying foods from photos and estimating their proportions requires standardised photography and additional information.(Reference Stumbo45) These findings indicate that, in order to utilise photograph-based meal assessment tools within the public health domain, it is imperative to enhance the accuracy of these tools and standardise them.
Lastly, the representation of dietary balance outcomes in this system is not demonstrated in the panel illustration (Supplementary Figure 1). Currently, this system aggregates input data and calculates dietary balance scores, but the evaluation itself is based on the evaluation criteria of the Japanese Food Guide ST and is not performed automatically by the system. However, it is anticipated that the system will be developed into a tool for assessing dietary balance using illustrated data by incorporating the characteristic panel diagrams of the Japanese Food Guide ST. The dish-based approach is intuitive for both meal preparers and consumers, as it focuses on actual dishes rather than individual ingredients.(Reference Yoshiike, Hayashi and Takemi23) The system is anticipated to simplify the input, data collection, and assessment of dietary balance and serve as a self-monitoring tool to promote healthy eating behaviours among individuals.
Conclusions
This study examined the applicability and utility of an online dietary balance survey system developed by the authors based on the Japanese Food Guide ST. Although this system was not designed for precise estimation of nutrient and food intake, the online dietary balance scores obtained from the online dietary balance survey system were considered useful for understanding the dietary balance in the Japanese diet. This ICT-based system can streamline the complex data collection and input involved in dietary surveys, facilitating dietary balance assessments. If it enables users to easily identify dietary imbalances, they may adopt healthier eating habits independently.
Supplementary material
To view supplementary material for this article, please visit https://doi.org/10.1017/jns.2025.10031
Acknowledgements
The authors would like to express their gratitude to the participants in the dietary survey and to the registered dietitian who conducted the interviews and data entry.
Author contributions
Funding acquisition, Y.T., M.K., and H.T.; development of an online dietary balance survey system, Y.T., K.O., A.F., M.H., and H.T.; investigation in dietary survey, Y.T., C.S., N.N., H.O., M.F., and H.T.; data entry into online dietary balance survey system, Y.K. and Y.T.; methodology, Y.T. and H.T.; analysis, Y.T. and N.S.; writing — original draft, N.S.; writing — review and editing, Y.T., N.S., T.K., M.K., and H.T.; supervision, H.T. All authors have read and agreed to the published version of the manuscript.
Financial support
This work was supported by MAFF Commissioned project study on ‘Project for the realization of foods and dietary habits to extend healthy life expectancy’ (grant number: JPJ009842).
Competing interests
N.N., H.O., M.F., M.H., K.O., and A.F. are employees of Healthcare Systems Co., Ltd. All other authors have no conflict of interest.


 Open access