

Folate is the generic name commonly used to designate a group of water-soluble vitamers from B complex found naturally in foods( Reference Blakley 1 ). Main dietary folate sources are green leafy vegetables, legumes, fruits, liver and yeast extract. Folate plays an essential role as a coenzyme in single-carbon transfers, participating in the metabolism of amino acids and nucleic acids. Folic acid (FA) is the most oxidised and stable synthetic form of folate used in vitamin supplements and in food fortification. Since the 1990s it has been recognised that periconceptional FA supplementation can prevent neural tube defects, an important cause of perinatal mortality and infant paralysis( 2 , Reference Czeizel, Dudás and Paput 3 ). As a result, a number of recommendations and actions were adopted in several countries to supplement fertile women and to increase the FA content in their diets. Food fortification is the practice of deliberately increasing the content of an essential micronutrient, i.e. vitamins and minerals, in a food so as to improve the nutritional quality of the food supply and provide a public health benefit with minimal risk to health( 4 ). Since 1998, mandatory fortification of enriched wheat flour and other enriched grain products with FA and B vitamins has been taking place in the USA and Canada, and at present is implemented in up to seventy-seven countries( 5 ). By this strategy, manufacturers are required to add regulated levels of FA to wheat flour and other grain products( 6 ). In Europe, however, safety concerns of a population-based exposure to high FA intakes have been the main reason to deny mandatory fortification( 7 ) and consequently in most European countries FA fortification takes place on a voluntary basis only. Voluntary fortification is the addition of micronutrients to food products by manufacturers at their own discretion. Fortified food groups and levels of FA addition can vary widely, as observed in The Netherlands (15–500 μg/100 g)( Reference Verkaik-Kloosterman, Tijhuis and Beukers 8 ) and Spain (15–1569 μg/100 g or 100 ml)( Reference Samaniego-Vaesken, Alonso-Aperte and Varela-Moreiras 9 ). The main type of products being fortified are ready-to-eat breakfast cereals (RTEC), non-alcoholic beverages, and milk and other milk products( Reference Samaniego-Vaesken, Alonso-Aperte and Varela-Moreiras 9 ). Certainly, voluntarily FA-fortified products may help increase this vitamin’s intake among the population, as they are usually its main dietary source( 7 ). However, since FA content data are still scarce in food composition tables and databases( Reference Bouckaert, Slimani and Nicolas 10 ), dietary folate assessment of the population can be inaccurate. For several years, our research group has been compiling and updating the first food composition database which includes FA-fortified products commercialised in Spain, as well as analysing the FA content in the main food groups( Reference Samaniego-Vaesken, Alonso-Aperte and Varela-Moreiras 9 , Reference Samaniego-Vaesken, Alonso-Aperte and Varela-Moreiras 11 ).
The Mediterranean diet comprises a high intake of major folate sources such as green leafy vegetables, fruits, legumes and nuts. This healthy food pattern, which is part of the Spanish culture and identity, has changed gradually over the last 40 years to a less balanced diet( Reference Varela-Moreiras, Avila and Cuadrado 12 , Reference León-Muñoz, Guallar-Castillón and Graciani 13 ). Moreover, recent dietary surveys conducted in Spain report that women of fertile age are not meeting their folate requirements from diet alone since the average dietary folate intake in women was estimated to be less than 60 % of their recommended intake (i.e. Recommended Nutrient Intake (RNI) for folate)( Reference Varela-Moreiras, Avila and Cuadrado 12 ). Conversely, pharmacological FA supplementation is the method of choice for European women who are planning a pregnancy and seek medical counselling( 7 ). However, a recent survey that involved nineteen countries (n 22 925) including Spain found that a large proportion of women of childbearing age (64 % in Spain v. 83 % Europe) were actually unaware that periconceptional FA supplementation could reduce the risk of birth defects( Reference Bitzer, von Stenglin and Bannemerschult 14 ).
In the context of a healthy diet, breakfast is a common dietary habit in many cultures, although each country has its own unique characteristics. The traditional Spanish breakfast typically includes coffee, cocoa or tea with/without milk, a slice of bread with olive oil or tomato paste, pastries, cookies and, more recently, RTEC have become quite popular( 15 ). Natural or commercial fruit juice may also be included. In addition, fruit intake is recommended, but compliance is low. Dairy products are highly accepted among the Spanish population, although a sharp decline in consumption has been observed in the last 10 years( Reference Varela-Moreiras, Ávila and Cuadrado 16 ). National dietary guidelines recommend inclusion of at least four different food groups for a nutritionally balanced breakfast( 15 ). It is also recommended that breakfast should provide about 20–25 % of the total daily energy intake( Reference Deshmukh-Taskar, Radcliffe and Liu 17 ), but currently a high and increasing proportion of the population is skipping the habit of breakfast or at best including only one or two food groups( 15 ).
The main objective of the present study was to examine the contribution of a representative number of FA-fortified food products to the RNI for folate or exceeding the Upper Level (UL) of intake for FA among fertile women by the potential consumption of a typical breakfast meal.
Materials and methods
Breakfast simulation model design
Healthy breakfast models that included different combinations of food and beverage groups were selected from the national dietary guidelines( Reference Dapcich, Salvador Castell and Ribas Barba 18 ). Folate intakes were calculated on the basis of average recommended serving sizes and by adding the FA content from fortified foods to the unfortified natural folate content of each foodstuff. Sources of data were a food composition database, which included the analytical FA contents from sixty-eight products compiled and analysed by our group from 2006 to 2011( Reference Samaniego-Vaesken 19 ), and data from the Spanish food composition tables published by Moreiras et al.( Reference Moreiras, Carvajal and Cabrera 20 ). Simulation of ten breakfast models that reflected the different breakfast menus recommended within the Spanish Dietary Guidelines( Reference Dapcich, Salvador Castell and Ribas Barba 18 ) and three scenarios of fortified product inclusion were evaluated (Table 1). Food and beverage groups included were grains and derivatives, milk and milk products, fats and oils, beverages (non-milk), fruits, tomatoes and sugar. FA-fortified products included were RTEC, cookies, whole milk, whole yoghurt and commercial fruit nectar (Table 1). First, the proportion of total daily recommended energy intake and the natural folate content of the unfortified breakfast models were calculated. These data were obtained from the Spanish food composition tables( Reference Moreiras, Carvajal and Cabrera 20 ). Then, the inclusion of combinations of one, two or three FA-fortified products, with two FA fortification levels according to European Regulation( 21 ), were used for each breakfast model. Analytical FA data from the sixty-eight fortified products were segmented into two fortification levels, calculated as a percentage of the Daily Reference Intake (DRI, 200 µg)( 21 ) for FA according to the manufacturer’s recommended serving of each product (L1, ≤16 % of the DRI or ≤33 µg FA/serving; L4, ≥35 % of the DRI or ≥70 µg FA/serving), reflecting lower and higher fortification levels available on the market. In addition, the average and 95th percentile (P95) of serving sizes consumed by women of childbearing age were used for assessing the FA UL( Reference Buttriss 22 ). Breakfast meals were evaluated using the energy and nutrient recommendations for women aged 16–49 years, folate (RNI, 400 µg/d) and the FA UL (1000 µg/d)( Reference Moreiras, Carvajal and Cabrera 23 , 24 ).
Breakfast models and scenarios for folic acid (FA)-fortified food intake simulation
Folic acid-fortified product sampling
Each food product was acquired in duplicate at supermarkets and retail stores from the Madrid Region. Food samples were RTEC (n 25), cookies (n 10), yoghurt (whole; n 5), cow’s milk (whole; n 25) and fruit nectar (n 3). Samples were stored at room or refrigeration temperature until individual processing (grinding and/or homogenising) and finally aliquots were flushed with nitrogen and frozen at −20°C. On the day of analysis, samples were thawed, weighed (0·5–1 g diluted to a final 15 ml volume), extracted, purified and analysed in duplicate as described in the following section.
Folic acid quantification in fortified food products
The analysis of FA-fortified food products involved the following steps: (i) tri-enzyme extraction from the food matrix( Reference Martin, Landen and Soliman 25 ); (ii) purification and concentration by affinity chromatography with folate-binding protein; and (iii) finally separation and quantification by reversed-phase HPLC with UV detection( Reference Póo-Prieto, Haytowitz and Holden 26 , Reference Bagley and Selhub 27 ). A Standard Reference Material (SRM 1846) and an International Standard( Reference Sharpless, Schiller and Margolis 28 , 29 ) were used throughout the analysis to test for accuracy. FA was used as standard and obtained from Sigma (Spain) in analytical grade. Standard stock solutions were prepared separately in 1 % (w/v) ascorbic acid, protected from light and stored at −80°C. Concentrations were calculated by measuring FA absorbance at k=282 nm with a spectrophotometer (Beckman DU-650, EE UU) and by molar extinction coefficient (27 600 litres/mol per cm)( Reference Blakley 1 ).
Results
Average FA fortification levels were calculated after affinity chromatography–HPLC analysis of sixty-eight food products (Table 2), yielding four fortification levels from which the highest and lowest (1 and 4; L1 and L4) were studied. For whole milk, higher fortification levels were obtained analytically; thus L1 was non-existent and we used level 3 (L3; 26–34 % of the DRI=51–69 µg FA/serving). For cookies, analysed fortification levels were lower: L1 and L3 only; and for fruit nectar only L4 was obtained (Table 2). Natural folate content data (unfortified values) for these products as compiled from the food composition tables( Reference Moreiras, Carvajal and Cabrera 20 ) are also presented (Table 2).
Folic acid (FA) fortification levels and energy content of the different food groups

* L1 (level 1), ≤33 µg FA/serving (≤16 % of the Daily Reference Intake (DRI, 200 µg) for FA per serving as declared by manufacturers); L3 (level 3), 51–69 µg FA/serving (26–34 % of the DRI); L4 (level 4), ≥70 µg FA/serving (≥35 % of the DRI)( 21 ).
† n is the number of products from each fortification level.
‡ Serving sizes recommended for adults( Reference Dapcich, Salvador Castell and Ribas Barba 18 ).
§ Spanish food composition table by Moreiras et al.( Reference Moreiras, Carvajal and Cabrera 20 ).
|| Data were not available for these products.
Breakfast scenarios including one fortified product or the combination of two or three different FA-fortified items, at two fortification levels (L1 and L4), were studied for adult women (16–49 years) as a percentage of their recommended folate intake (RNI for the Spanish population( Reference Moreiras, Carvajal and Cabrera 23 )) and the FA UL( 24 ). On average, most of models accounted for 20–25 % of total daily energy recommendations (RNI; 9146·4–9627·8 kJ/d (2185–2300 kcal/d)), whereas natural folate content was on average 4–23 % of women’s recommended folate intake (16–92 µg of FA).
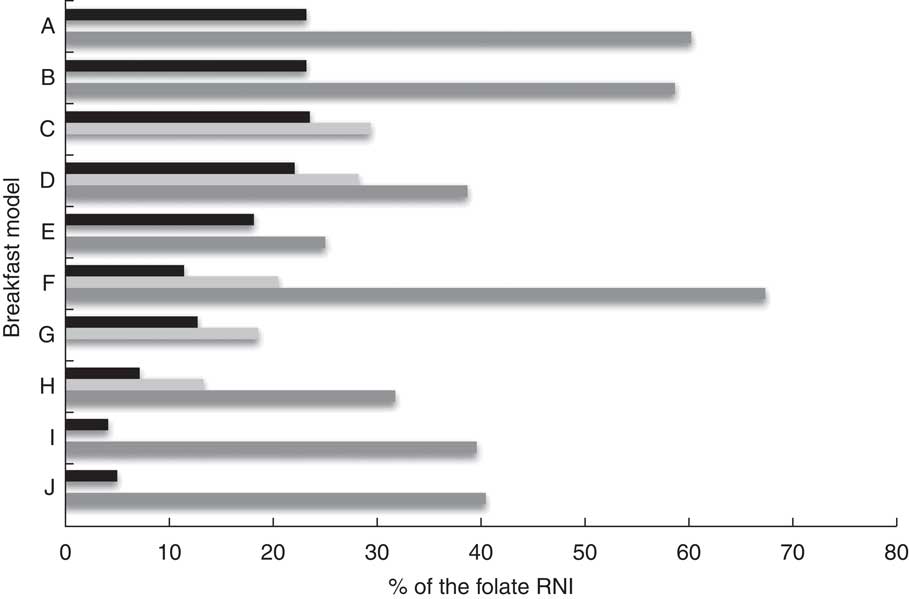
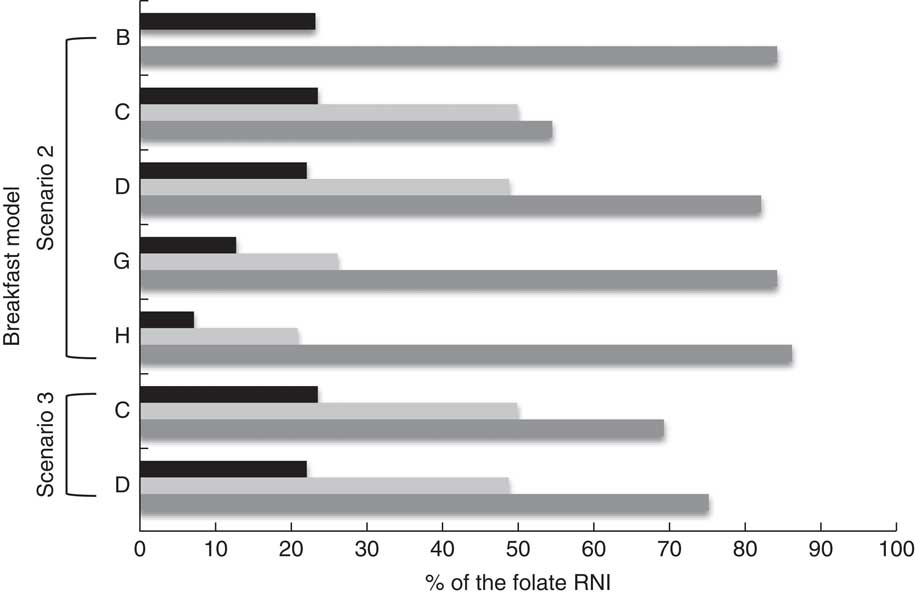
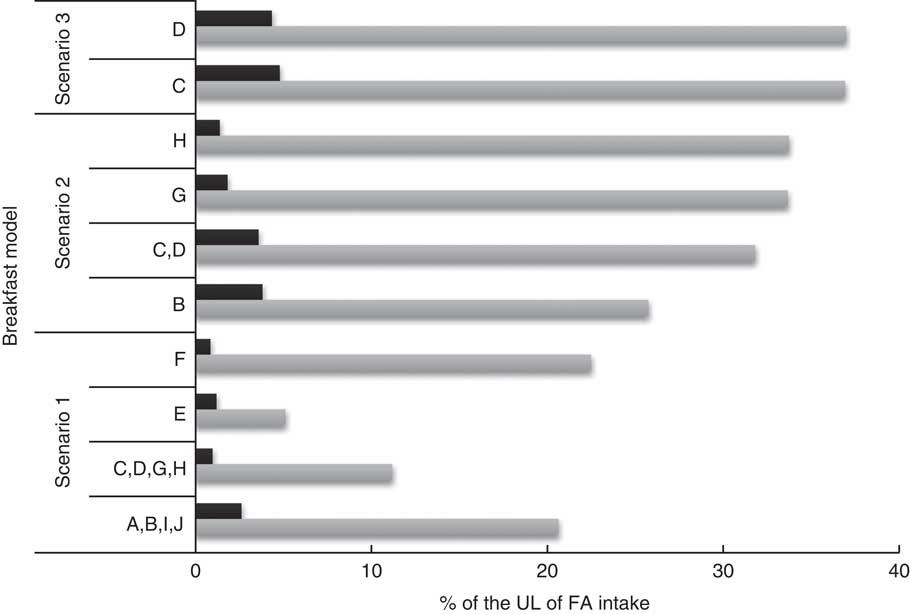
Figure 1 shows the contribution of FA-fortified products to each breakfast model’s natural folate content. Breakfast model F, which included L4-fortified whole-milk yoghurt, unfortified bread and butter and a piece of fruit, provided the highest percentage, 67·4 % of the folate RNI (269·6 µg of FA), followed by breakfast models A and B, which included FA-fortified whole cow’s milk, sugar and natural orange juice plus bread and olive oil (A) or bread, butter and jam (B). The latter two models include orange juice which is a major source of natural folate, providing 23 % of the daily RNI per serving (92 µg of FA). Based on our data, L4-fortified whole-milk yoghurt was the highest FA source, followed by L4-fortified whole milk. The major increase from an unfortified breakfast was observed for model J (whole milk with sugar and toasted white bread with natural tomato), which provided only 5 % of the folate RNI when unfortified (20 µg of FA), but when a serving of fortified whole milk was included it increased its contribution up to 40·5 % of the RNI (162 µg of FA). Overall, the inclusion of one product at the lowest FA fortification level (L1) accounted for 13–29 % of women’s daily RNI for folate (52–116 µg of FA), while the addition of one product at the highest fortification level (L4) provided an average of 20–60 % of the RNI (80–240 µg of FA; Fig. 1). Models B, D, G and H, including two fortified products, whole milk or whole-milk yoghurt plus fruit nectar, RTEC or cookies (Table 1), contributed ≥80 % of the RNI (≥320 µg of FA; Fig. 2). Models C and D, with three fortified products each, accounted for 70–75 % of the RNI (280–300 µg of FA; Fig. 2). At recommended, average and P95 serving sizes, none of the scenarios exceeded the FA UL for adults (1000 µg/d; Fig. 3). The highest FA levels were observed when three L4-fortified products, fruit nectar, whole milk and cookies, were consumed at P95 (37 % of the UL, Scenario 3).
Scenario 1: effect of the inclusion of one food fortified with folic acid (FA) in different breakfast models on the percentage of the Recommended Nutrient Intake (RNI) for folate (400 µg/d) provided in breakfast, according to fortification level (![]() , unfortified;
, unfortified; ![]() , L1;
, L1; ![]() , L4), among women of childbearing age (16–49 years), Madrid Region, Spain. Unfortified, natural folate content per serving; L1 (level 1), ≤33 µg FA/serving (≤16 % of the Daily Reference Intake (DRI, 200 µg) for FA per serving as declared by manufacturers); L4 (level 4), ≥70 µg FA/serving (≥35 % of the DRI)(
21
). For breakfast models A, B, C, D, I and J including whole milk, no L1 was obtained and L3 (level 3) is represented instead: L3, 51–69 µg FA/serving (26–34 % of the DRI). For C and D, fruit nectar only provided L4
, L4), among women of childbearing age (16–49 years), Madrid Region, Spain. Unfortified, natural folate content per serving; L1 (level 1), ≤33 µg FA/serving (≤16 % of the Daily Reference Intake (DRI, 200 µg) for FA per serving as declared by manufacturers); L4 (level 4), ≥70 µg FA/serving (≥35 % of the DRI)(
21
). For breakfast models A, B, C, D, I and J including whole milk, no L1 was obtained and L3 (level 3) is represented instead: L3, 51–69 µg FA/serving (26–34 % of the DRI). For C and D, fruit nectar only provided L4
Scenarios 2 and 3: effect of the inclusion of two or three foods fortified with folic acid (FA) in different breakfast models on the percentage of the Recommended Nutrient Intake (RNI) for folate (400 µg/d) provided in breakfast, according to fortification level (![]() , unfortified;
, unfortified; ![]() , L1;
, L1; ![]() , L4), among women of childbearing age (16–49 years), Madrid Region, Spain. Unfortified, natural folate content per serving; L1 (level 1), ≤33 µg FA/serving (≤16 % of the Daily Reference Intake (DRI, 200 µg) for FA per serving as declared by manufacturers); L4 (level 4), ≥70 µg FA/serving (≥35 % of the DRI)(
21
). For breakfast models B and C including whole milk, no L1 was obtained and L3 (level 3) is represented instead: L3, 51–69 µg FA/serving (26–34 % of the DRI). For C and D, fruit nectar only provided L4
, L4), among women of childbearing age (16–49 years), Madrid Region, Spain. Unfortified, natural folate content per serving; L1 (level 1), ≤33 µg FA/serving (≤16 % of the Daily Reference Intake (DRI, 200 µg) for FA per serving as declared by manufacturers); L4 (level 4), ≥70 µg FA/serving (≥35 % of the DRI)(
21
). For breakfast models B and C including whole milk, no L1 was obtained and L3 (level 3) is represented instead: L3, 51–69 µg FA/serving (26–34 % of the DRI). For C and D, fruit nectar only provided L4
Scenarios 1, 2 and 3: percentage contributions of foods fortified with folic acid (FA) in different breakfast models to the Upper Level (UL) of FA intake (1000 µg/d) according to consumption/fortification level (![]() , average (g)/L1;
, average (g)/L1; ![]() , P95 (g)/L4) among women of childbearing age (16–49 years), Madrid Region, Spain. Average, average level of consumption for the fortified product(
Reference Buttriss
22
); P95, 95th percentile of consumption for the fortified product(
Reference Buttriss
22
); L1 (level 1), ≤33 µg FA/serving (≤16 % of the Daily Reference Intake (DRI, 200 µg) for FA per serving as declared by manufacturers); L4 (level 4), ≥70 µg FA/serving (≥35 % of the DRI)(
21
)
, P95 (g)/L4) among women of childbearing age (16–49 years), Madrid Region, Spain. Average, average level of consumption for the fortified product(
Reference Buttriss
22
); P95, 95th percentile of consumption for the fortified product(
Reference Buttriss
22
); L1 (level 1), ≤33 µg FA/serving (≤16 % of the Daily Reference Intake (DRI, 200 µg) for FA per serving as declared by manufacturers); L4 (level 4), ≥70 µg FA/serving (≥35 % of the DRI)(
21
)
Discussion
Daily breakfast consumption has been acknowledged to contribute significantly to overall diet nutrient adequacy( Reference Rampersaud, Pereira and Girard 30 ). Other suggested benefits are related to better weight control and intellectual/cognitive performance, and also to the creation and/or consolidation of adequate dietary habits. Our results show that at existing levels of FA fortification available on the Spanish market, the combined inclusion of up to three different products as part of a breakfast meal could have a positive impact on fertile women’s dietary folate intakes, without exceeding the UL of FA intake. All food products included in the breakfast models are consumed regularly, to different extents, by the Spanish population( Reference Varela-Moreiras, Avila and Cuadrado 12 ). It seems feasible to state that a breakfast meal consistent with Spanish Dietary Guidelines, in terms of energy content and food group inclusion, could also increase FA intakes when fortified products are included. The breakfast meal is considered of importance among the Spanish population not only nutritionally but also culturally; however, recent surveys show that mainly children and adolescents are becoming ‘breakfast skippers’( 15 , Reference Serra-Majem, Ribas and Pérez-Rodrigo 31 ). Also, a high percentage of the adult population declares to have just a cup of coffee with/without milk for breakfast( 15 ). Considering this fact, the effectiveness of breakfast product fortification could be limited. In the past few years, however, public health campaigns have been developed and implemented nationwide to promote daily breakfast intake( 32 ). For example, part of the Spanish Strategy for Nutrition, Physical Activity and Prevention of Obesity (NAOS Strategy), promoted by the Ministry of Health, Social Services and Equality, focused on the importance of a healthy breakfast within the goal of promoting healthy diets and preventing childhood obesity. Activities from NAOS included school visits throughout the country by trained nutrition educators, press releases, distribution of brochures and posters, and national television and radio commercials underlining the importance of ‘the first meal of the day’ and the food groups that should be included for a balanced breakfast (https://www.msssi.gob.es/en/campannas/campanas07/obesidad.htm). However, most of these campaigns were targeted at school-age children and therefore can have only limited impact on women. According to the literature, campaigns targeted to women of fertile age and counselling on FA importance is an area mainly concerning gynaecologists and other health-care practitioners such as pharmacists. In this regard, a review by Brito Garcia and Serra Majem( Reference Brito García and Serra Majem 33 ) on Spanish public health or policy actions to tackle micronutrient deficiencies underlines a lack of action by authorities when it comes to policy measures, including the case for FA awareness among women of childbearing age.
Research has shown that comprehensive nutritional labels on fortified food product packages can be essential tools for consumer education and, potentially, for the improvement of folate intakes( Reference Buttriss 22 , Reference Cowburn and Stockley 34 ). In our studies we observed that a high percentage of the labels from FA-fortified products included a nutritional ‘vitamin content claim’ in compliance with European Regulations( 21 ). However, health claims linking FA with ‘maternal tissue growth during pregnancy’ (‘effect on a normal pregnancy’, as accepted by the European Food Safety Authority( 35 )) were included on only a minor proportion of these labels( Reference Samaniego-Vaesken, Alonso-Aperte and Varela-Moreiras 9 ). FA content of products must be included by regulation in the ingredients list and on the nutritional label as content per 100 g or 100 ml, additionally contents per food serving are also declared( 21 ); nevertheless, health claims are only voluntary at present. As such, food labelling can be useful for communicating nutritional and health messages to target populations; however, it seems that this is a largely missed opportunity in the case of the Spanish fortified products. A nutritional education approach that includes a description of nutrition labels, how to use their information, serving guidance and awareness of FA importance for women at periconceptional age are key issues to be undertaken by public health authorities and health professionals. In addition, manufacturers must provide consumers with relevant and clear information on their labels, according to the age or physiological target group (i.e. pregnancy, lactation, elderly, etc.). Women of childbearing age should be encouraged to include a balanced and varied breakfast meal on a daily basis in order to contribute to their overall energy and nutrient intakes and to comply with nutritional recommendations.
A limitation of our study is that food intake throughout the day – whether fortified or not, which obviously may contribute to folate intake – was not taken into account. It could be expected that FA-fortified products in addition to the average daily intake of natural folate sources might reach women’s recommended folate intake of 400 µg/d. But national food consumption and diet assessment studies indicate this is not the case: folate requirements are not being met( Reference Varela-Moreiras, Ávila and Cuadrado 16 , Reference Ruiz Moreno, Del Pozo de la Calle and Cuadrado 36 ). Some authors emphasise that it is quite difficult to achieve the recommended folate intake through regular diet alone, as most foods commonly eaten are only low to moderate folate sources and the higher sources, such as liver and yeast extracts, are not eaten frequently or in amounts large enough to supply sufficient folate in the diet( Reference Abraham and Webb 37 ). Furthermore, vitamin bioavailability is usually much lower in folate from natural sources when compared with synthetic FA. Folate intakes of the Spanish population have been evaluated in several studies (MAGRAMA( Reference Varela-Moreiras, Ávila and Cuadrado 16 ), ENUCAM( Reference Ruiz Moreno, Del Pozo de la Calle and Cuadrado 36 ), EnKid( Reference Aranceta Bartrina and Serra-Majem 38 )) and potentially insufficient intakes were found in target and vulnerable groups such as women of childbearing age, children and the elderly. The average dietary folate intake in adult women was estimated to be approximately 250 µg/d, i.e. the folate gap is roughly 150 µg/d( Reference Varela-Moreiras, Avila and Cuadrado 12 ). Major dietary sources were green leafy vegetables and legumes. Nevertheless, to date there is no reliable information on the impact of voluntarily fortified food consumption and total FA intakes are probably being underestimated. The assessment of micronutrient intakes from fortified foodstuffs was described as a difficult task due to the relative absence of compositional data in tables and food composition databases( Reference Bouckaert, Slimani and Nicolas 10 ) and the rapidly growing market for these products. Our previous study showed that the availability of voluntarily FA-fortified products is widespread on the Spanish market and that different vitamin amounts are being added to diverse food groups by manufacturers( Reference Samaniego-Vaesken, Alonso-Aperte and Varela-Moreiras 9 ). In addition, consumer choice is overwhelmed by a huge number of novel foods and recipes, namely convenience and ‘ready-to-eat’ foods that may include folate as natural source but also added FA. Analytical folate data from a representative number of fresh-cut green-leaf products and ready-to-eat meal samples were recently reviewed by Fajardo et al.( Reference Fajardo, Alonso-Aperte and Varela-Moreiras 39 ), these foodstuffs represent an important number of dietary sources that contribute to overall folate intakes. Food composition tables used in Spanish nutritional surveys include only a limited number of FA-fortified products, mainly RTEC. Fortification levels in the present study were established according to the European Regulations( 21 ) that include FA ‘Daily Reference Intakes’ (DRI, 200 µg) as guidance for nutritional labelling. Noteworthy, in Spain, women’s folate recommendation actually duplicates the DRI value. In addition, our previous studies showed that FA contents in food were higher than those declared on labels by manufacturers (‘overages’)( Reference Samaniego-Vaesken 19 ). Therefore, a more reliable approach was to use analytical instead of label FA data for the calculation of intakes. A suitable assessment of folate status is compelling, not only because suboptimal intakes of FA may be related to a deficiency condition, but also because adverse effects and risks after long-term exposure to high concentrations are not well known( 7 ).
In other European countries such as Ireland, voluntary fortification improved the dietary intake adequacy of a number of micronutrients, including FA, and did not contribute to excessive intakes within an adult’s diet. Breakfast cereals and non-alcoholic beverages were the main fortified items consumed( Reference Hannon, Kiely and Flynn 40 ). In The Netherlands, since 2007 there has been a maximum fortification level exemption for voluntarily FA-fortified products, which is set at 100 µg/418·6 kJ (100 kcal). Interestingly, it was established that at current food intake patterns of this country, this FA level is considered safe for adults and children( Reference Verkaik-Kloosterman, Beukers and Buurma-Rethans 41 ). In Spain, however, voluntary fortification has not been evaluated recently. Back in 1998, Serra-Majem studied Spanish children’s food and nutrient intakes. His findings revealed deficiencies for Fe, vitamin C, vitamin E, vitamin D, folate and vitamin B6 ( Reference Serra-Majem 42 ). The author concluded that the RNI for certain nutrients are difficult to achieve through consumption of unfortified foods. Further publications highlighted that fortified RTEC could make a significant contribution to children’s mineral and vitamin requirements( Reference Serra-Majem, García-Closas and Ribas Barba 43 ).
Conclusion
At existing levels of voluntary FA food fortification on the Spanish market, the inclusion of FA-fortified products as part of a breakfast meal could positively impact the nutritional quality of the diet of fertile women without involving a risk for excessive FA exposure. Nevertheless, with the aim of making adequate food choices, nutritional education strategies that include FA food fortification within the context of a healthy diet is a priority issue that needs to be undertaken by public health authorities. Further studies are required to design, monitor and validate strategies to improve folate and FA intakes of fertile women.
Acknowledgements
Acknowledgements: The authors thank Paul Finglas, Jenny Plumb and Anthony Wright from the Institute of Food Research, Norwich, UK, and Rosalía Poó-Prieto from CEU San Pablo University, Madrid, Spain, for assistance with method development, food composition database development and helpful comments. Financial support: This work was funded by the Spanish Ministry of Education and Science (grant number AGL2005-06957: ‘Folic acid content and bioavailability in fortified foods in Spain. Impact on folate intake in population groups at risk and evaluation as potential functional foods’). The Spanish Ministry of Education and Science had no role in the design, analysis or writing of this article. Conflict of interest: None. Authorship: The study was designed by G.V.-M. and E.A.-A.; M.L.S.-V. carried out the analyses and article writing. All authors contributed in interpreting the data and critically reviewing the manuscript. Ethics of human subject participation: Ethical approval was not required for this study.


