


Highlights
-
• Sensitive measures are needed to assess the effects of bilingualism on executive functions (EFs).
-
• Bilingualism is made up of several complex experiences that interact with EF.
-
• We used mouse-tracking to examine the relation between L2 experiences and EF.
-
• L2 age of acquisition and switching frequency predicted EF on Stroop and Flanker tasks.
-
• The effects of L2 experiences on EF depend on the attentional demands of the task.
1. Different bilingual experiences predict different executive functions: Evidence from mouse-tracking
Cognitive psychology relies on fundamental tools such as accuracy and reaction time (RT) to glean insights into cognitive processes, decision-making and response strategies. These variables, being both cost-effective and universally applicable across various paradigms, have been the cornerstone of cognitive research. However, their limitations become apparent when it comes to elucidating the dynamic nature of decision-making processes over time (Freeman & Ambady, Reference Freeman and Ambady2010). When canonical measures fall short and risk overinterpretation, it becomes imperative to explore newer and more nuanced metrics. Therefore, in this study, we used a dynamic mouse-tracking paradigm to dissect bilinguals’ response selection and attentional processes.
Bilingualism is one of the important experiences that increases neuroplasticity and reshapes executive functions (EFs), which are defined as higher-order cognitive functions such as working memory capacity, inhibitory control and task switching, all of which involve attentional control (Bialystok, Reference Bialystok2017; Diamond, Reference Diamond2013; Friedman & Miyake, Reference Friedman and Miyake2017). Bilinguals aptly navigate competition between two active languages in their minds (Kroll et al., Reference Kroll, Bobb and Hoshino2014, Reference Kroll, Dussias, Bice and Perrotti2015; Thierry & Wu, Reference Thierry and Wu2007; Wu & Thierry, Reference Wu and Thierry2010), fostering neural adaptations that exert a lasting impact on EF regions (reviews in Deluca et al., Reference DeLuca, Segaert, Mazaheri and Krott2020; Grant et al., Reference Grant, Dennis and Li2014; Grundy et al., Reference Grundy, Anderson and Bialystok2017a; Pliatsikas, Reference Pliatsikas2020). These neural adaptations often translate into bilinguals outperforming their monolingual counterparts on nonverbal EF tasks (e.g., Bialystok, Reference Bialystok2009; Bialystok et al., Reference Bialystok, Craik, Klein and Viswanathan2004; Bialystok et al., Reference Bialystok, Poarch, Luo and Craik2014; Costa et al., Reference Costa, Hernández, Costa-Faidella and Sebastián-Gallés2009; Prior & MacWhinney, Reference Prior and MacWhinney2010; Singh et al., Reference Singh, Fu, Rahman, Hameed, Sanmugam and Agarwal2015). Nonetheless, these effects are not universally replicated (reviews in Gunnerud et al., Reference Gunnerud, Ten Braak, Reikerås, Donolato and Melby-Lervåg2020; Grundy, Reference Grundy2020; Lehtonen et al., Reference Lehtonen, Soveri, Laine, Järvenpää, De Bruin and Antfolk2018; Ware et al., Reference Ware, Kirkovski and Lum2020).
Two potential reasons for this inconsistency arise. First, the cognitive measures may lack the necessary sensitivity to delve beyond conventional metrics, thereby failing to capture the intricate aspects of decision-making over time. Second, the wide array of individual differences in bilingual experiences is often overlooked (Yurtsever et al., Reference Yurtsever, Anderson and Grundy2023). Despite the recent emphasis on recognizing bilingualism as a complex construct interacting with sociolinguistic variables and contexts (Gullifer & Anderson, Reference Gullifer and Anderson2023; Backer & Bortfeld, Reference Backer and Bortfeld2021; Chung-Fat-Yim et al., Reference Chung-Fat-Yim, Calvo and Grundy2022; Leivada et al., Reference Leivada, Westergaard, Duñabeitia and Rothman2021; Luk & Grundy, Reference Luk and Grundy2023; Pot et al., Reference Pot, Keijzer and De Bot2018; Titone & Tiv, Reference Titone and Tiv2023; Yamasaki et al., Reference Yamasaki, Stocco and Prat2018), many studies examining the relations between bilingualism and EFs still dichotomize groups into “monolingual” and “bilingual.” This oversimplified approach can be problematic given that it overlooks crucial linguistic and contextual variations that could potentially obscure real effects (Grundy, Reference Grundy2020; Yurtsever et al., Reference Yurtsever, Anderson and Grundy2023).
In light of these considerations, the present study employed a sensitive and dynamic mouse-tracking paradigm (Freeman & Ambady, Reference Freeman and Ambady2010) to examine how individual bilingual experiences are related to EFs. This approach is a cost-effective alternative to functional neuroimaging. Neuroimaging techniques have long been useful in examination of cognitive efficiency between monolinguals and bilinguals. We will first discuss neuroimaging evidence and then compare how mouse-tracking can complement and extend the current dialogue.
Neuroimaging techniques such as electroencephalography (EEG) and functional magnetic resonance imaging provide one path to examine cognitive processes that are not observable at the behavioral level alone and can measure the efficiency of performance on EF tasks (Luck, Reference Luck2014; van Heuven & Coderre, Reference van Heuven and Coderre2015). For example, Abutalebi et al. (Abutalebi et al., Reference Abutalebi, Della Rosa, Green, Hernandez, Scifo, Keim, Cappa and Costa2011) compared German–Italian bilinguals and Italian monolinguals on a Flanker task and found that bilinguals used the anterior cingulate cortex (ACC) less than monolinguals in dealing with the conflicting stimuli, despite similar behavioral performance. The ACC is highly involved with monitoring and moderating conflict in the brain (Botvinick et al., Reference Botvinick, Braver, Barch, Carter and Cohen2001; Carter et al., Reference Carter, Braver, Barch, Botvinick, Noll and Cohen1998; Shenhav et al., Reference Shenhav, Botvinick and Cohen2013; Sheth et al., Reference Sheth, Mian, Patel, Asaad, Williams, Dougherty and Eskandar2012); thus, Abutelabi et al.’s findings demonstrate that their bilinguals were more efficient at handling conflict resolution in the ACC than monolinguals. The finding that bilinguals use the ACC more efficiently than monolinguals has been replicated several times with different designs, populations and tasks (e.g., Anderson et al., Reference Anderson, Grundy, Grady, Craik and Bialystok2021; Rodríguez-Pujadas et al., Reference Rodríguez-Pujadas, Sanjuán, Fuentes, Ventura-Campos, Barrós-Loscertales and Ávila2014).
EEG studies provide complementary findings for more efficient cognitive processing in bilinguals than monolinguals. Zunini et al. (Reference Zunini, Morrison, Kousaie and Taler2019) used a task-switching paradigm to demonstrate that French–English bilinguals had smaller switching and mixing costs than monolinguals, with mostly similar electrophysiological patterns in the brain, suggesting that bilinguals need the same number of resources to perform the task better than monolinguals. However, bilinguals did have larger N2 and smaller P3 amplitudes than monolinguals. These patterns suggest that bilinguals prioritize early attention to facilitate faster task-set reconfiguration at later stages in processing, consistent with more efficient processing for bilinguals than monolinguals. Recent reviews of the literature suggest that these are common findings: bilinguals demonstrate enhanced processing at early and more automatic stages to alleviate the burden from later stages of processing, which is a sign of efficiency (Antoniou, Reference Antoniou2023; Grundy et al., Reference Grundy, Anderson and Bialystok2017a). Together, neuroimaging techniques provide a useful avenue by which to examine the efficiency of processing on EF tasks, but the cost and accessibility associated with such technology limits its use. Fortunately, alternative methods, such as MouseTracker (Freeman & Ambady, Reference Freeman and Ambady2010), provide a behavioral solution to examine multiple cognitive processes and response strategies before response execution, without the cost (Spivey et al., Reference Spivey, Grosjean and Knoblich2005).
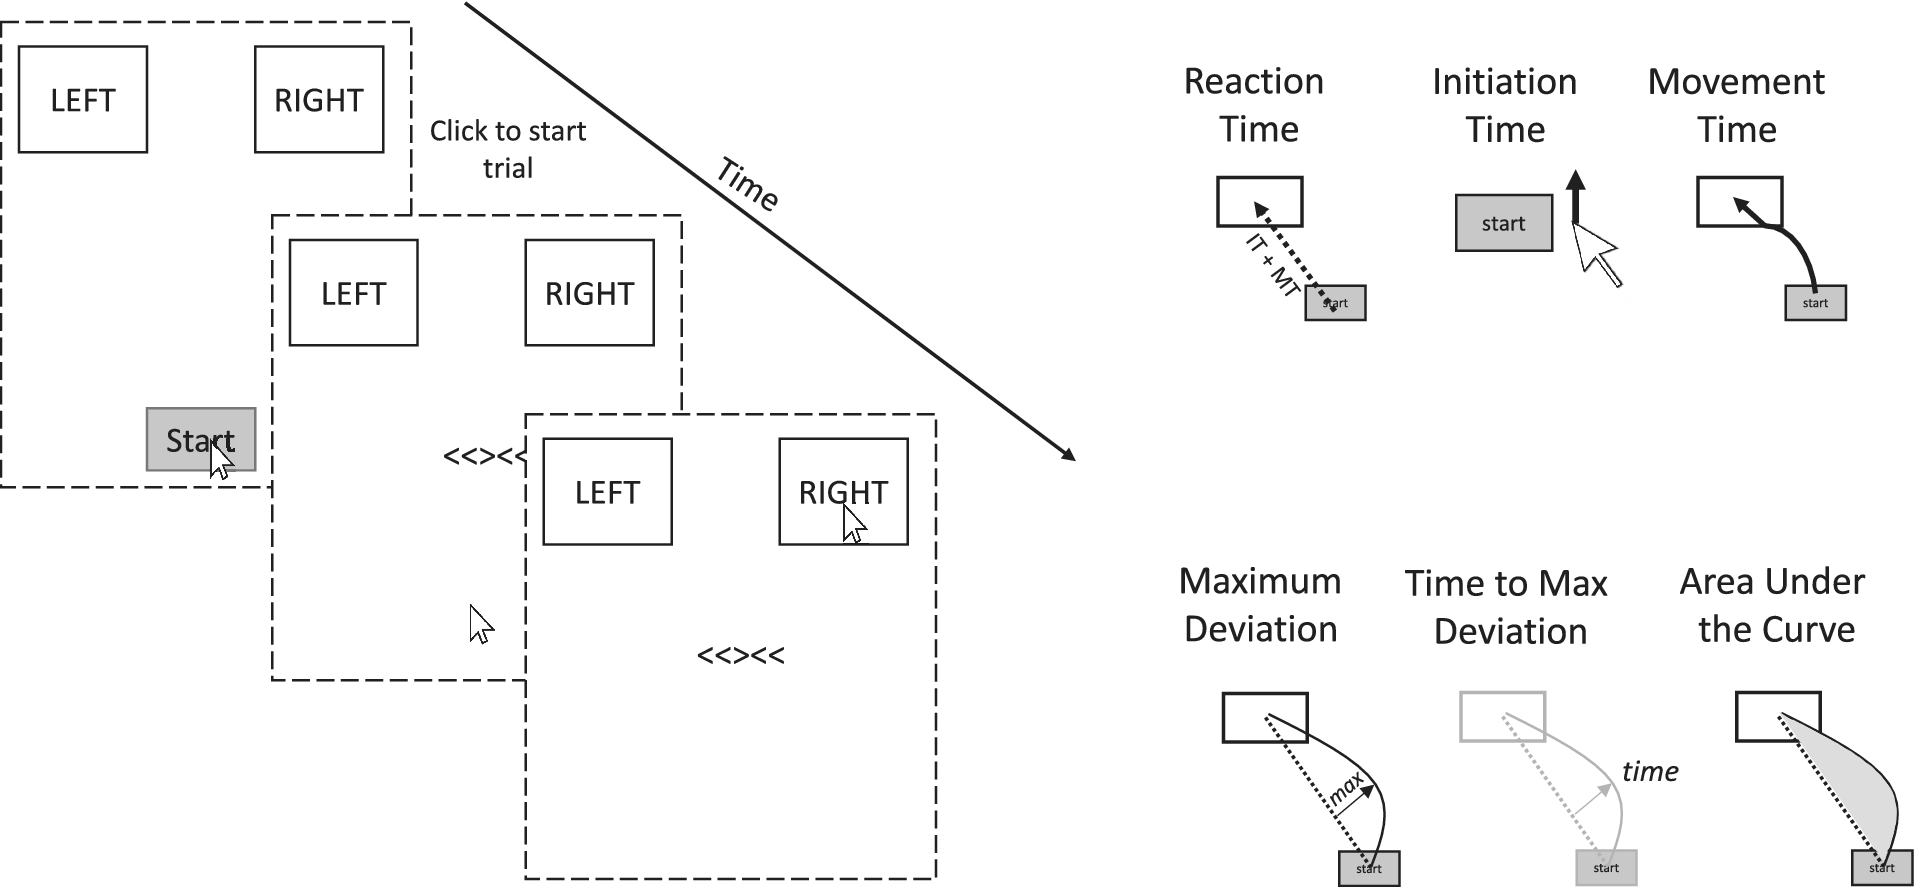
The prototypical mouse-tracking paradigm involves a binary forced-choice decision task between two options represented as buttons on the computer screen (Schoemann et al., Reference Schoemann, O’Hora, Dale and Scherbaum2021). Mouse-tracking involves using a computer mouse to measure x- and y-axis coordinates as participants initiate and move toward a target over time. Motor responses, such as the movement of one’s arm to select an option, are frequently updated through our perceptual and cognitive processing. These measurements of ongoing and continuous movement metrics, as measured through mouse-tracking software, give insights into the dynamics of cognition and decision-making (Freeman & Ambady, Reference Freeman and Ambady2010). This allows for a dynamic set of measures to be calculated, including the time it takes to initiate a movement after the stimulus appears, and the deviation from the most direct path to the correct response (see Figure 1). These mouse-tracking metrics have been shown to be more reliable than overall RTs (Grundy, Reference Grundy2022).
The mouse-tracking paradigm that allows for the examination of several behaviors that occur before response completion. Reused with permission from Grundy (Reference Grundy2022).
Spivey et al. (Reference Spivey, Grosjean and Knoblich2005) were the first to implement a mouse-tracking methodology to capture continuous cognitive dynamics during a spoken language task. Participants were presented with two objects on the screen, one target and one competing, displayed in the upper right or left corners. Participants were given auditory instructions on which stimulus to select with a mouse click, 500 ms after the images were presented. Competing stimuli were chosen to assess the impact of competition on lexical activation via motor output. The trials consisted of either phonologically dissimilar (control items; e.g., fountain-chair) or similar words (distractor items; e.g., sink-rink). Results showed that the distractor items yielded longer total response times than the control items. In addition, distractor items yielded greater deviations from the target compared to the control condition, indicating larger effects of spatial attraction toward the competing object in the distractor conditions than in the control conditions.
Bartolotti and Marian (Reference Bartolotti and Marian2012) investigated language competition between monolinguals and bilinguals using eye-tracking and mouse-tracking methodologies. Participants learned words in an artificial language (e.g., shundo → acorn) and then completed a word recognition task. In this task, they clicked on pictures corresponding to the translation of the learned words (e.g., a picture of an acorn as the target, or a shovel as the phonological competitor). Their findings revealed no group differences in accuracy and response-time metrics. However, the competitors affected the mouse movements of monolinguals and bilinguals differently. Monolinguals exhibited greater deviation along the x-coordinates toward the competitors than targets. In contrast, competitors did not affect bilinguals’ x-coordinate motion but did affect their y-coordinates. This pattern suggested that bilinguals were equally drawn to both the target and competitor. In other words, they experienced language competition between responses, but they resolved it earlier and more successfully than monolinguals. Moreover, bilinguals used executive control not to eliminate interference completely, but to maintain goals.
Incera and McLennan (Reference Incera and McLennan2016) used mouse-tracking to examine Stroop task performance between monolinguals and bilinguals. The authors demonstrated that bilinguals took longer to initiate their responses, but once movement toward the target began, they were more efficient in their path to the correct response. Incera and McLennan concluded that bilinguals behaved more like experts than monolinguals, in that they took longer to process initial demands to facilitate performance at later stages of response execution. Incera and McLennan (Reference Incera and McLennan2018) followed this study using a diverse sample of bilinguals from different language backgrounds and examining bilingualism on a continuum. The authors found that higher bilingualism scores, as measured by the percentage of time exposed to a second language, were associated with a reduced Stroop effect (incongruent minus congruent trials), as measured by a smaller deviation toward the incorrect response (i.e., more direct path to correct response) on incongruent than congruent trials. This finding was only borne out of the Stroop task, not the Flanker task, and the authors suggested that this could be because bilingualism leads to better prepotent response inhibition (EF component assessed on the Stroop task) rather than resistance to distractor interference (EF component assessed on the Flanker task). Alternatively, it could be that bilingualism is more likely to influence EF on more demanding tasks (Stroop) than less demanding tasks (Flanker). Kousaie and Phillips (Reference Kousaie and Phillips2017) further highlighted the importance of examining both tasks, given that bilinguals were faster and more accurate on the Stroop task than monolinguals. However, bilinguals only outperformed monolinguals on accuracy of the Flanker task, not RTs. They also demonstrated using ERPs that distinct cognitive processing between monolinguals and bilinguals emerged depending on whether the Flanker or Stroop task was used. These findings highlight the importance of examining both the Stroop and Flanker tasks within the same experiment.
The Stroop findings from these experiments complement Incera and McLennan’s previous work by demonstrating that bilingualism enhances efficiency of performance on an EF task that cannot be measured with RTs alone. More recently, Damian et al. (Reference Damian, Ye, Oh and Yang2019) showed that Chinese–English bilinguals had smaller maximum deviations and area under the curve (AUC) for the most direct path to the correct response than English monolinguals, consistent with the previous work. Additionally, bilinguals had significantly later initiation times for both the Simon and spatial Stroop tasks than monolinguals, again consistent with the previous work. However, contrary to the previous work, bilinguals were earlier to initiate responses than monolinguals for the Flanker task. One of the reasons for this discrepancy in initiation times for the Flanker task compared to the Stroop task observed in Damian et al. (Reference Damian, Ye, Oh and Yang2019) could be that the Flanker task is less challenging, and more demanding tasks are required to observe an effect of bilingualism on EF. Alternatively, individual bilingual experiences could influence outcomes in different directions. Previous work has shown that age of L2 acquisition (L2 AoA; Deluca et al., Reference DeLuca, Rothman, Bialystok and Pliatsikas2019), L2 proficiency (Singh & Mishra, Reference Singh and Mishra2013; Tse & Altarriba, Reference Tse and Altarriba2012), L2 use (Qi et al., Reference Qi, Qin, Zhang and Yun2023), L1/L2 balance (Yow & Li, Reference Yow and Li2015), and L1/L2 switching frequency (Liu et al., Reference Liu, Yang, Jiao, Schwieter, Sun and Wang2019; Soveri et al., Reference Soveri, Laine, Hämäläinen and Hugdahl2011a, Reference Soveri, Rodriguez-Fornells and Laine2011b) all influence EFs in the brain. Thus, it is possible that variations in the L2 experiences of the sample populations across the studies drove the outcomes observed.
To resolve discrepancies in the literature, the present study used a dynamic mouse-tracking paradigm to examine the individual influences of different second-language experiences on initiation times and movement dynamics on conflict tasks. We tested young adult bilinguals with a Flanker and a Stroop task and examined conflict effects and sequential congruency effects (SCEs; Gratton et al., Reference Gratton, Coles and Donchin1992). SCEs measure the extent to which individuals’ responses are influenced by the preceding trial, shedding light on their ability to swiftly disengage attention—a valuable proxy for executive functioning. Specifically, when the previous trial is incongruent, the conflict effects that follow (incongruent–congruent) are smaller than when the previous trial is congruent. Smaller SCEs are typically interpreted as indicative of more effective conflict management (Gratton et al., Reference Gratton, Coles and Donchin1992), and SCEs become smaller with practice (Egner et al., Reference Egner, Ely and Grinband2010). Conflict and SCEs are two EF effects that have been shown to be modified by bilingualism by some (e.g., Costa et al., Reference Costa, Hernández, Costa-Faidella and Sebastián-Gallés2009; Grundy et al., Reference Grundy, Chung-Fat-Yim, Friesen, Mak and Bialystok2017b), but not others (e.g., Morton & Harper, Reference Morton and Harper2007; von Bastian et al., Reference von Bastian, Souza and Gade2016).
1.1. The present study
Bilingualism has been shown to lead to smaller SCEs due to bilingual experiences contributing to more rapid disengagement of attention (Antoniou, Reference Antoniou2023; Chung-Fat-Yim et al., Reference Chung-Fat-Yim, Calvo and Grundy2022; deMeurisse & Kaan, Reference deMeurisse and Kaan2023; Grundy & Bialystok, Reference Grundy and Bialystok2018; Grundy et al., Reference Grundy, Chung-Fat-Yim, Friesen, Mak and Bialystok2017b; 2017c; Grundy & Keyvani-Chahi, Reference Grundy and Keyvani Chahi2017; Grundy et al., Reference Grundy, Pavlenko and Bialystok2020; Mishra et al., Reference Mishra, Hilchey, Singh and Klein2012). Therefore, we hypothesized that more bilingual experiences (e.g., earlier Age of acquisition [AoA], greater L2 use, proficiency and switching) would be associated with smaller Flanker and Stroop effects. Furthermore, we expect that the effects would be stronger in the Stroop task, consistent with previous work (Incera & McLennan, Reference Incera and McLennan2018). The individual bilingual experiences that lead to these changes in attentional disengagement are unknown, but like the conflict effects, we generally expect that more bilingual experience (e.g., L1/L2 switching frequency) will predict smaller SCEs.
The Flanker and Stroop tasks were chosen because they are two of the most commonly used EF tasks and they exercise attentional demands differently. The Stroop task is generally more difficult than the Flanker task given that it involves suppressing word reading, which is a difficult automatic process to stop (Heitz & Engle, Reference Heitz and Engle2007; Lu & Proctor, Reference Lu and Proctor1995). It is important to emphasize that much of the present study was necessarily exploratory, given that there is a paucity of research on bilingualism and EF using mouse-tracking, and none have examined which mouse-tracking metrics best capture the association between bilingual experiences and conflict and SCE effects. Nonetheless, we generally predicted that greater bilingual experiences would lead to smaller conflict effects and SCEs.
2. Methods
2.1. Participants
We recruited 101 bilingual participants from undergraduate courses at Iowa State University in exchange for course credit. Data from three participants were excluded for partial completion of the study. The data analysis was conducted with a final sample of 98 (42 females, M age = 19.54, SD age = 1.5). Participants were assessed for language experience and proficiency using the Language and Social Background Questionnaire (LSBQ; Anderson et al., Reference Anderson, Mak, Keyvani Chahi and Bialystok2018; Luk & Bialystok, Reference Luk and Bialystok2013). Language proficiencies are calculated as the average score of self-reported proficiencies in speaking, understanding, reading and writing. Frequency of L1 and L2 use, balance, and language switch frequency were computed using a scale of 0–4 by asking how frequently they used each of the languages in various domains of daily life. Parental education is indicated on a scale of 1–5. We present the descriptive statistics and data ranges in Table 1. Fifty-seven bilinguals reported English as their first language (L1). Non-English first languages included Spanish (n = 11), Arabic (n = 4), Chinese (n = 4), Korean (n = 4), Gujarati (n = 2), Japanese (n = 2), Vietnamese (n = 2), Indonesian (n = 1), Kinyarwanda (n = 1), Mizo (n = 1), Portuguese (n = 1), Tagalog (n = 1), and unreported (n = 7). A majority of participants reported L2 as Spanish (n = 39) or English (n = 30). Other second languages reported included German (n = 3), Chinese (n = 2), Arabic (n = 1), Bahasa Melayu (n = 1), Bosnian (n = 1), Burmese (n = 1), French (n = 1), Hindi (n = 1), Italian (n = 1), Lao (n = 1), Mandarin (n = 1), Swahili (n = 1), Twi (n = 1), Urdu (n = 1), and unreported (n = 12).
Descriptives for demographic and language background information
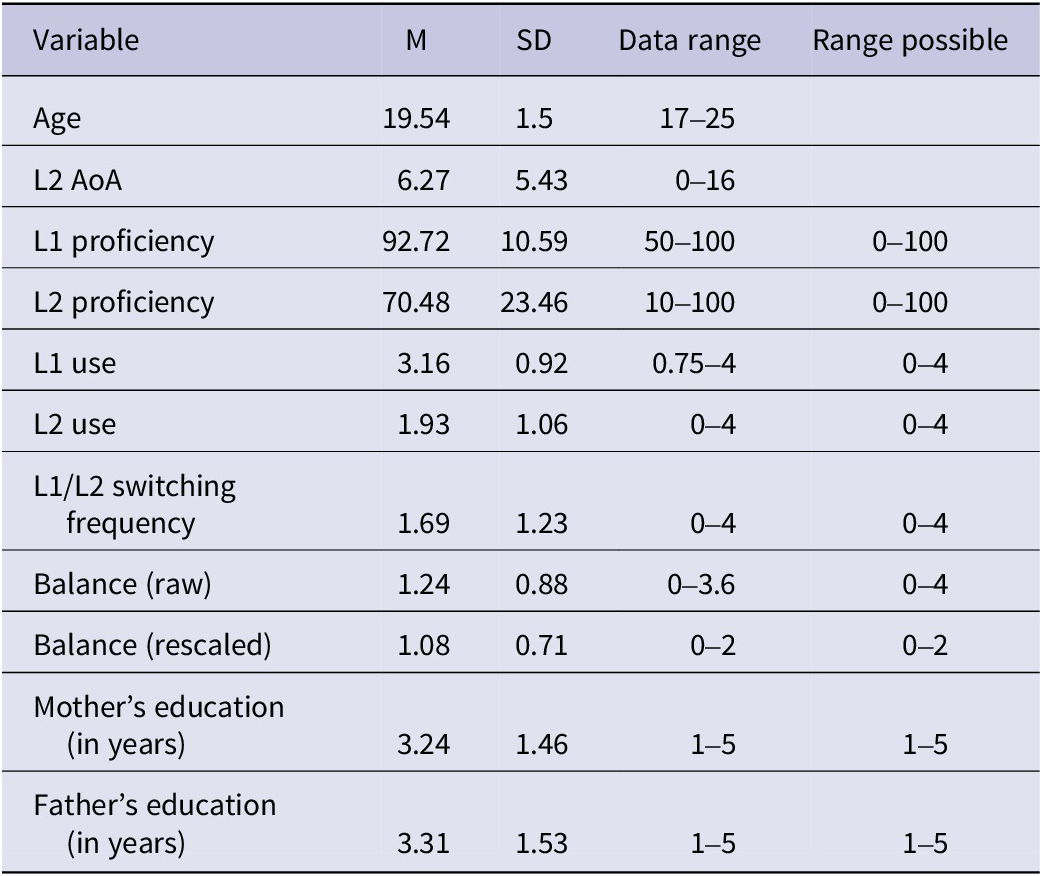
Note: L1 = first language; L2 = second language; AoA = age of acquisition; M = mean; SD = standard deviation. The raw balance variable indicates 0 = L1 dominant; 2 = L1/L2 Balanced and 4 = L2 dominant. The rescaled balance variable indicates 0 = unbalanced and 2 = balanced.
Previous literature surrounding SCE with mouse-tracking using a Simon task was analyzed to have an effect size of Cohen’s d = .71 for RT and d = 0.81 for AUC (Scherbaum & Kieslich, Reference Scherbaum and Kieslich2018). In the present study, we used the PANGEA online power analysis tool (Westfall, 2015 calculator available at https://jakewestfall.shinyapps.io/pangea/) to determine the minimum number of participants needed to achieve at least 80% statistical power. This calculation was based on an alpha level of 0.05 and a conservative effect size of d = 0.71 for the interaction term between the current trial and previous congruency in our ANOVA. The analysis revealed that 28 participants would be required to detect the SCE with 80% power, so our sample size was deemed more than sufficient.
2.2. Materials
We designed the experiment using Mousetracker software (Freeman & Ambady, Reference Freeman and Ambady2010) and used a Dell MS116 Wired Mouse to collect data. Each trial consisted of two response boxes on the top left and right corners of the screen, and a Start button on the bottom center. When participants clicked the Start button, the stimulus appeared in the center of the screen. We asked the participants to move their mouse and click the correct response box as quickly as they could. We set the interstimulus interval to 1000 ms. The stimulus and response boxes stayed on the screen until the response. If the response time was longer than 2500 ms, an error message appeared and urged the participants to respond faster. After incorrect responses, a red X appeared in place of the stimulus for the duration of 1000 ms.
In the Flanker task, the stimuli were either congruent or incongruent arrows. We asked the participants to respond to the center flanker and ignore the flanking ones. The response boxes read “left” and “right,” respectively. In the Stroop task, the stimuli consisted of color names, either congruent with the font color or incongruent (e.g., BLUE written in red ink). We asked the participants to respond to the font color and ignore the written word. The response boxes read “RED/GREEN” on the left and “ORANGE/BLUE” on the right box.
We obtained several outcome variables from the mouse-tracking paradigm. Initiation time refers to the time from clicking the Start button to the initiation of mouse movement. Movement time refers to the time between initiation and completion of the click response. RT refers to the total time between clicking the Start button and clicking the response box. It is calculated as the sum of initiation time and movement time. Maximum deviation is the distance of maximum deviation from a straight line that connects the Start point and the response box. Large deviations are observed more often on incongruent trials due to participants overcorrecting their initially incorrect response. Time to maximum deviation refers to the time from initiation to reaching the maximum deviation point. AUC refers to the area under the curve of the mouse movement trajectory relative to a straight line connecting the Start point and response box. AUC always produces a positive value regardless of the relative position to the straight line.
2.3. Procedure
Participants were tested in a computer lab. Upon signing the consent form, they were presented with the mouse-tracking task. Participants completed 96 trials of the Stroop task and 96 trials of the Flanker task. The order of the tasks was counterbalanced across participants. Trial types were randomized within each task. Upon completion, they completed the language and demographics survey. The total study duration was approximately 30 min.
3. Results
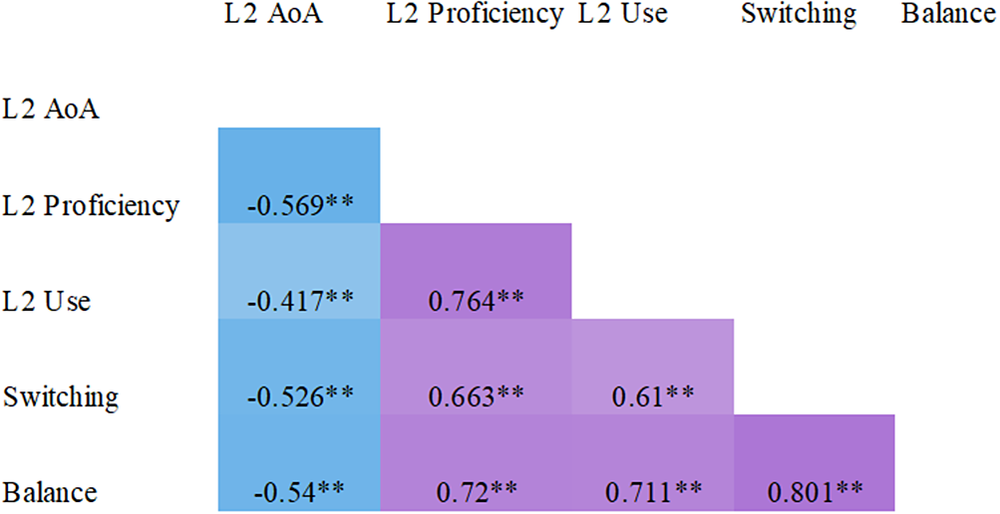
To facilitate transparency and reproducibility, all the raw data used for the following analyses are available on Figshare: https://doi.org/10.6084/m9.figshare.25357060. Table 2 provides the means and standard deviations (SDs) for all conflict effects and SCEs and Figure 2 presents the correlations between L2 variables for the present sample.
Means and standard deviations for conflict and sequential congruency effects
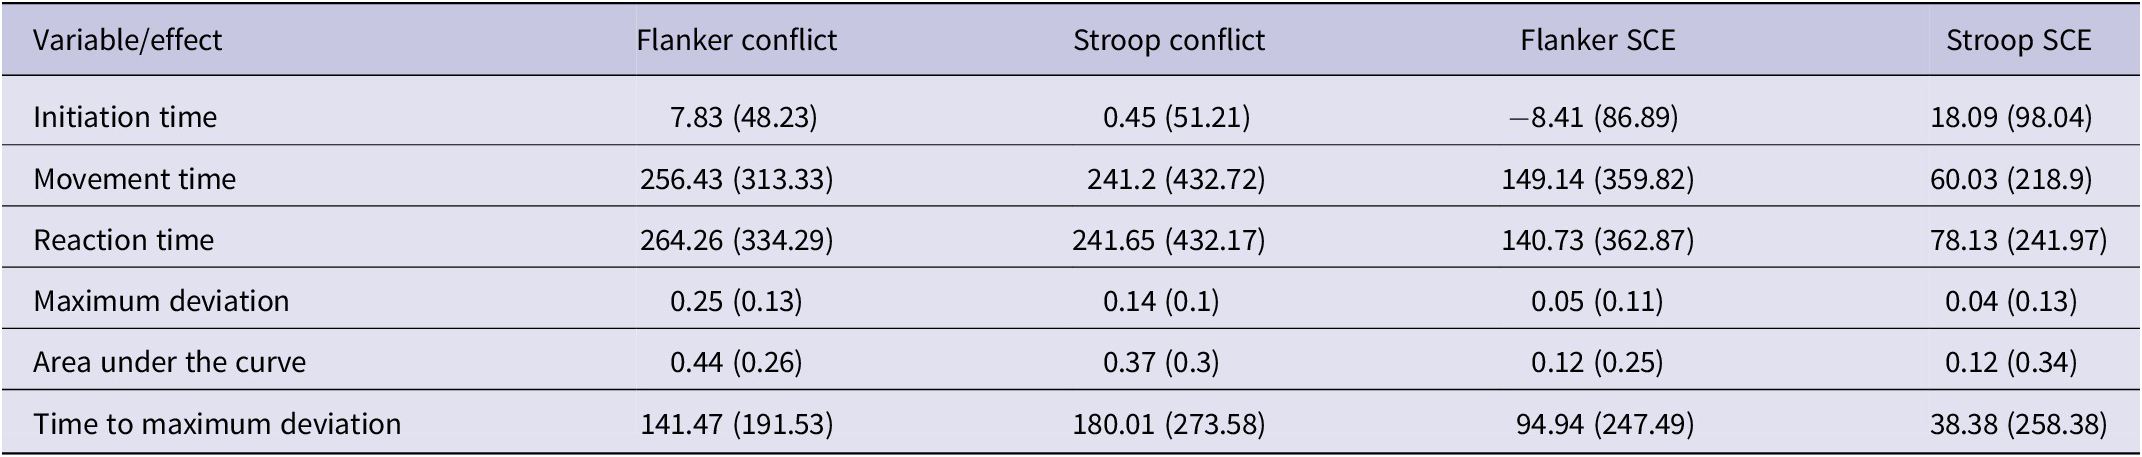
Note: SCE = sequential congruency effect.
Heatmap for Pearson r correlation coefficients between second language (L2) variables.
Note: Purple values indicate positive correlations, and blue values indicate negative correlations. Darker values indicate stronger correlations, and lighter values indicate weaker correlations. All p < 0.01.
To investigate the independent contributions of L2 experiences on executive functioning, we conducted a series of multiple regression analyses using jamovi software (jamovi project, 2023). We report the independent contributions of each L2 experience (by controlling for the variance from the other L2 variables) on the Flanker effect, Stroop effect, Flanker SCE and Stroop SCE by adding all L2 experiences into the same model for each of the dependent variables. All variance inflation factor scores were less than 3.5 for the following analyses; thus, collinearity between L2 experiences was not an issue, despite strong correlations between experiences. In all models, we included L2 AoA, L2 proficiency, L2 use, L1/L2 balance and L1/L2 switching frequency as independent variables. We present the inferential statistics in Table 3.
Inferential statistics of language experiences on mouse-tracking variables
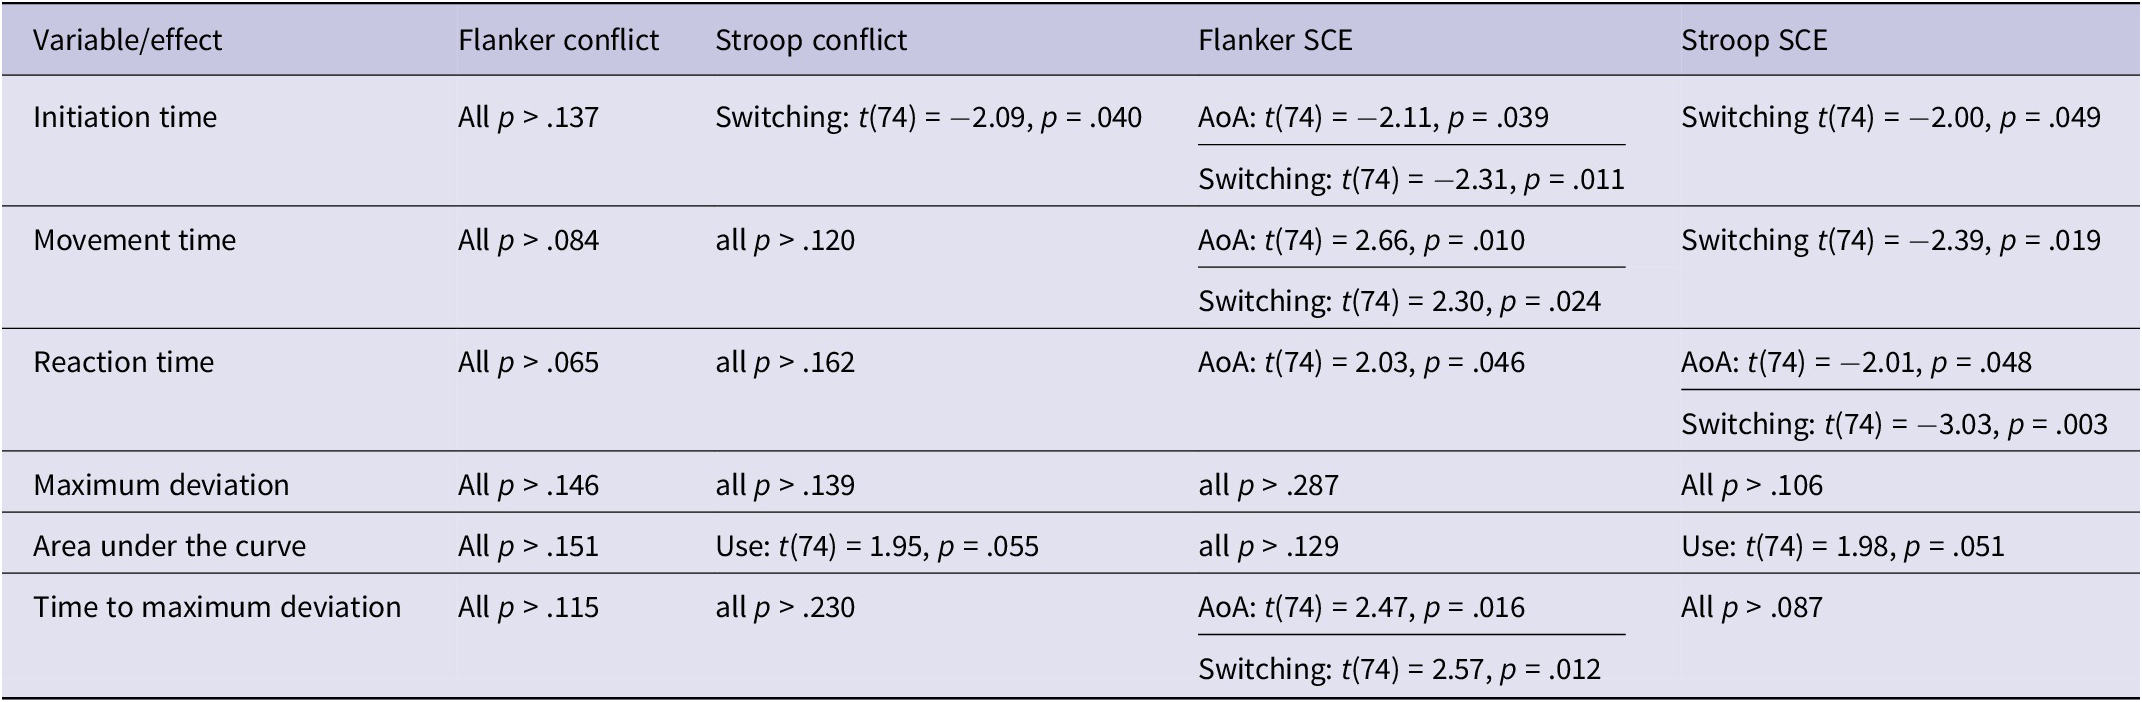
Note: SCE = sequential congruency effect; AoA = age of acquisition.
All models included L2 AoA, proficiency, use, balance and switching frequency as predictors in the multiple regression models.
The cell content represents the inferential statistic for the regression models. The rows represent each outcome variable for the effects.
3.1. Flanker and Stroop effects
Flanker and Stroop effects are each calculated by subtracting the congruent from the incongruent trials. Figure 3 represents the relation between L2 variables and Flanker (top panel) and Stroop effects (bottom panel) that reached (p ≤ 0.05) or approached (p ≤ 0.1) conventional levels of significance (see also Supplementary Figure 1 for correlations between mouse-tracking metrics and all dependent variables).
Partial correlations (after controlling for all other L2 variables) for L2 variables predicting all Flanker (top panel) and Stroop (bottom panel) effects by dependent variable during mouse-tracking that reached (p ≤ 0.05, p ≤ 0.01) or approached (p ≤ 0.1) conventional levels of statistical significance. Gray contours represent 95% confidence intervals.
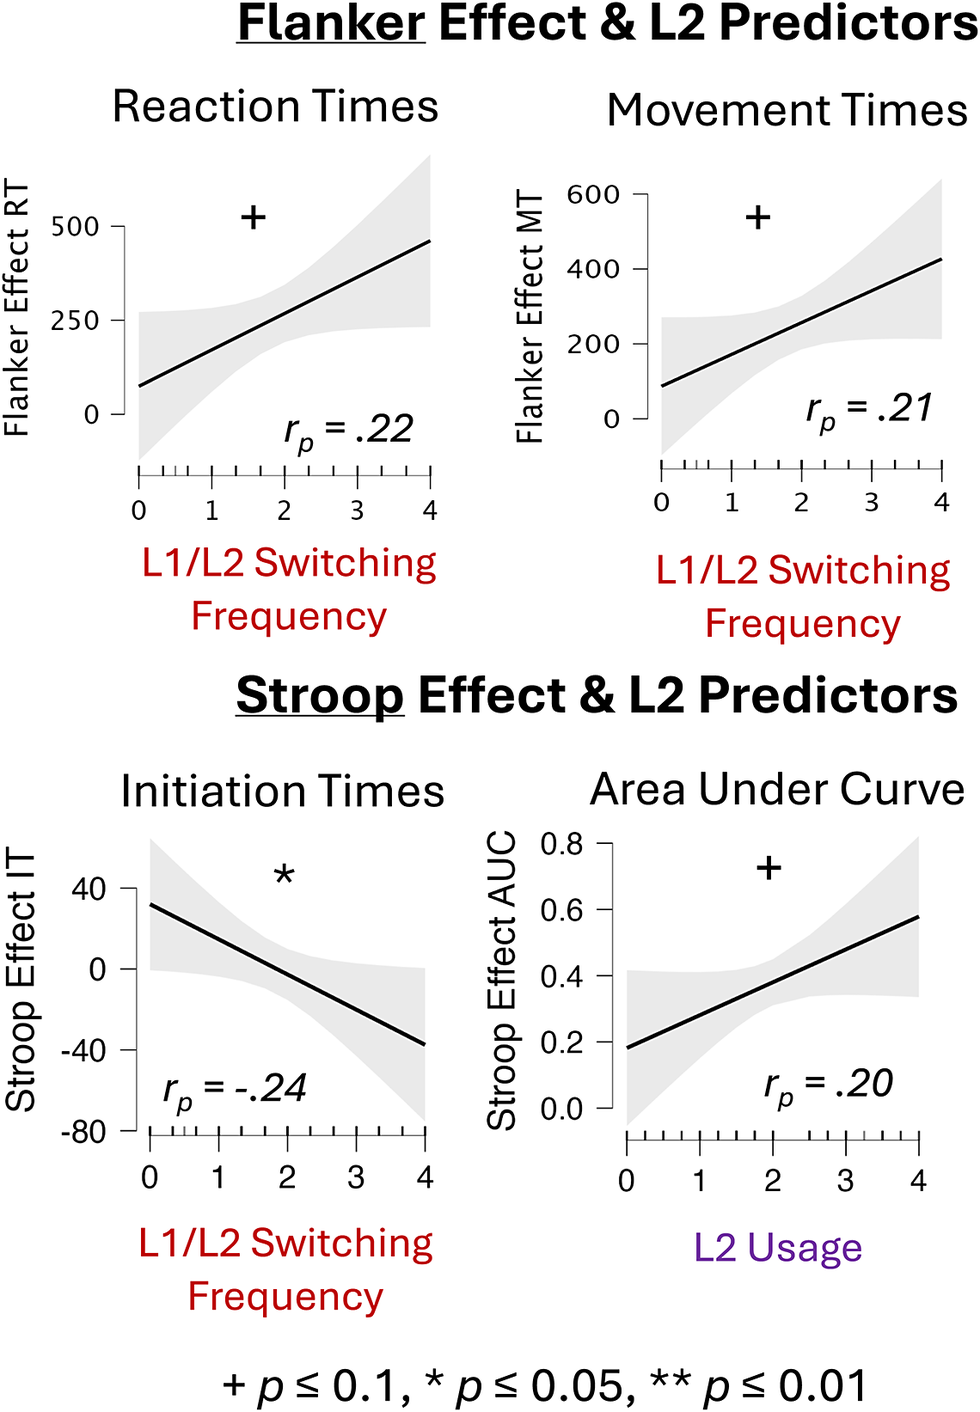
There were no significant relations between L2 experiences and Flanker effects for any of the DVs that reached conventional levels of significance. For Stroop, more L1/L2 switching frequency predicted smaller initiation time Stroop effects. No other significant associations emerged.
3.2. Flanker and Stroop SCE
The SCE (calculated as [(cI-cC)-(iI-iC)]Footnote 1)) is the difference between the congruency effect following congruent stimuli and the congruency effect following incongruent stimuli, and generally represents the influence of previous trial congruency on conflict (i.e., Flanker or Stroop) effects.
Table 3 and Figure 4 represent the relation between the L2 variables and Flanker SCEs that reached or approached conventional levels of significance. The Y-axis represents the size of the SCE, with higher scores representing more influence from the previous trial on current trial performance.
Partial correlations (after controlling for all other L2 variables) for L2 variables predicting SCEs on the Flanker task by dependent variable during mouse-tracking that approached (p ≤ 0.1) or reached (p ≤ 0.05, p ≤ 0.01) conventional levels of statistical significance. Gray contours represent 95% confidence intervals.
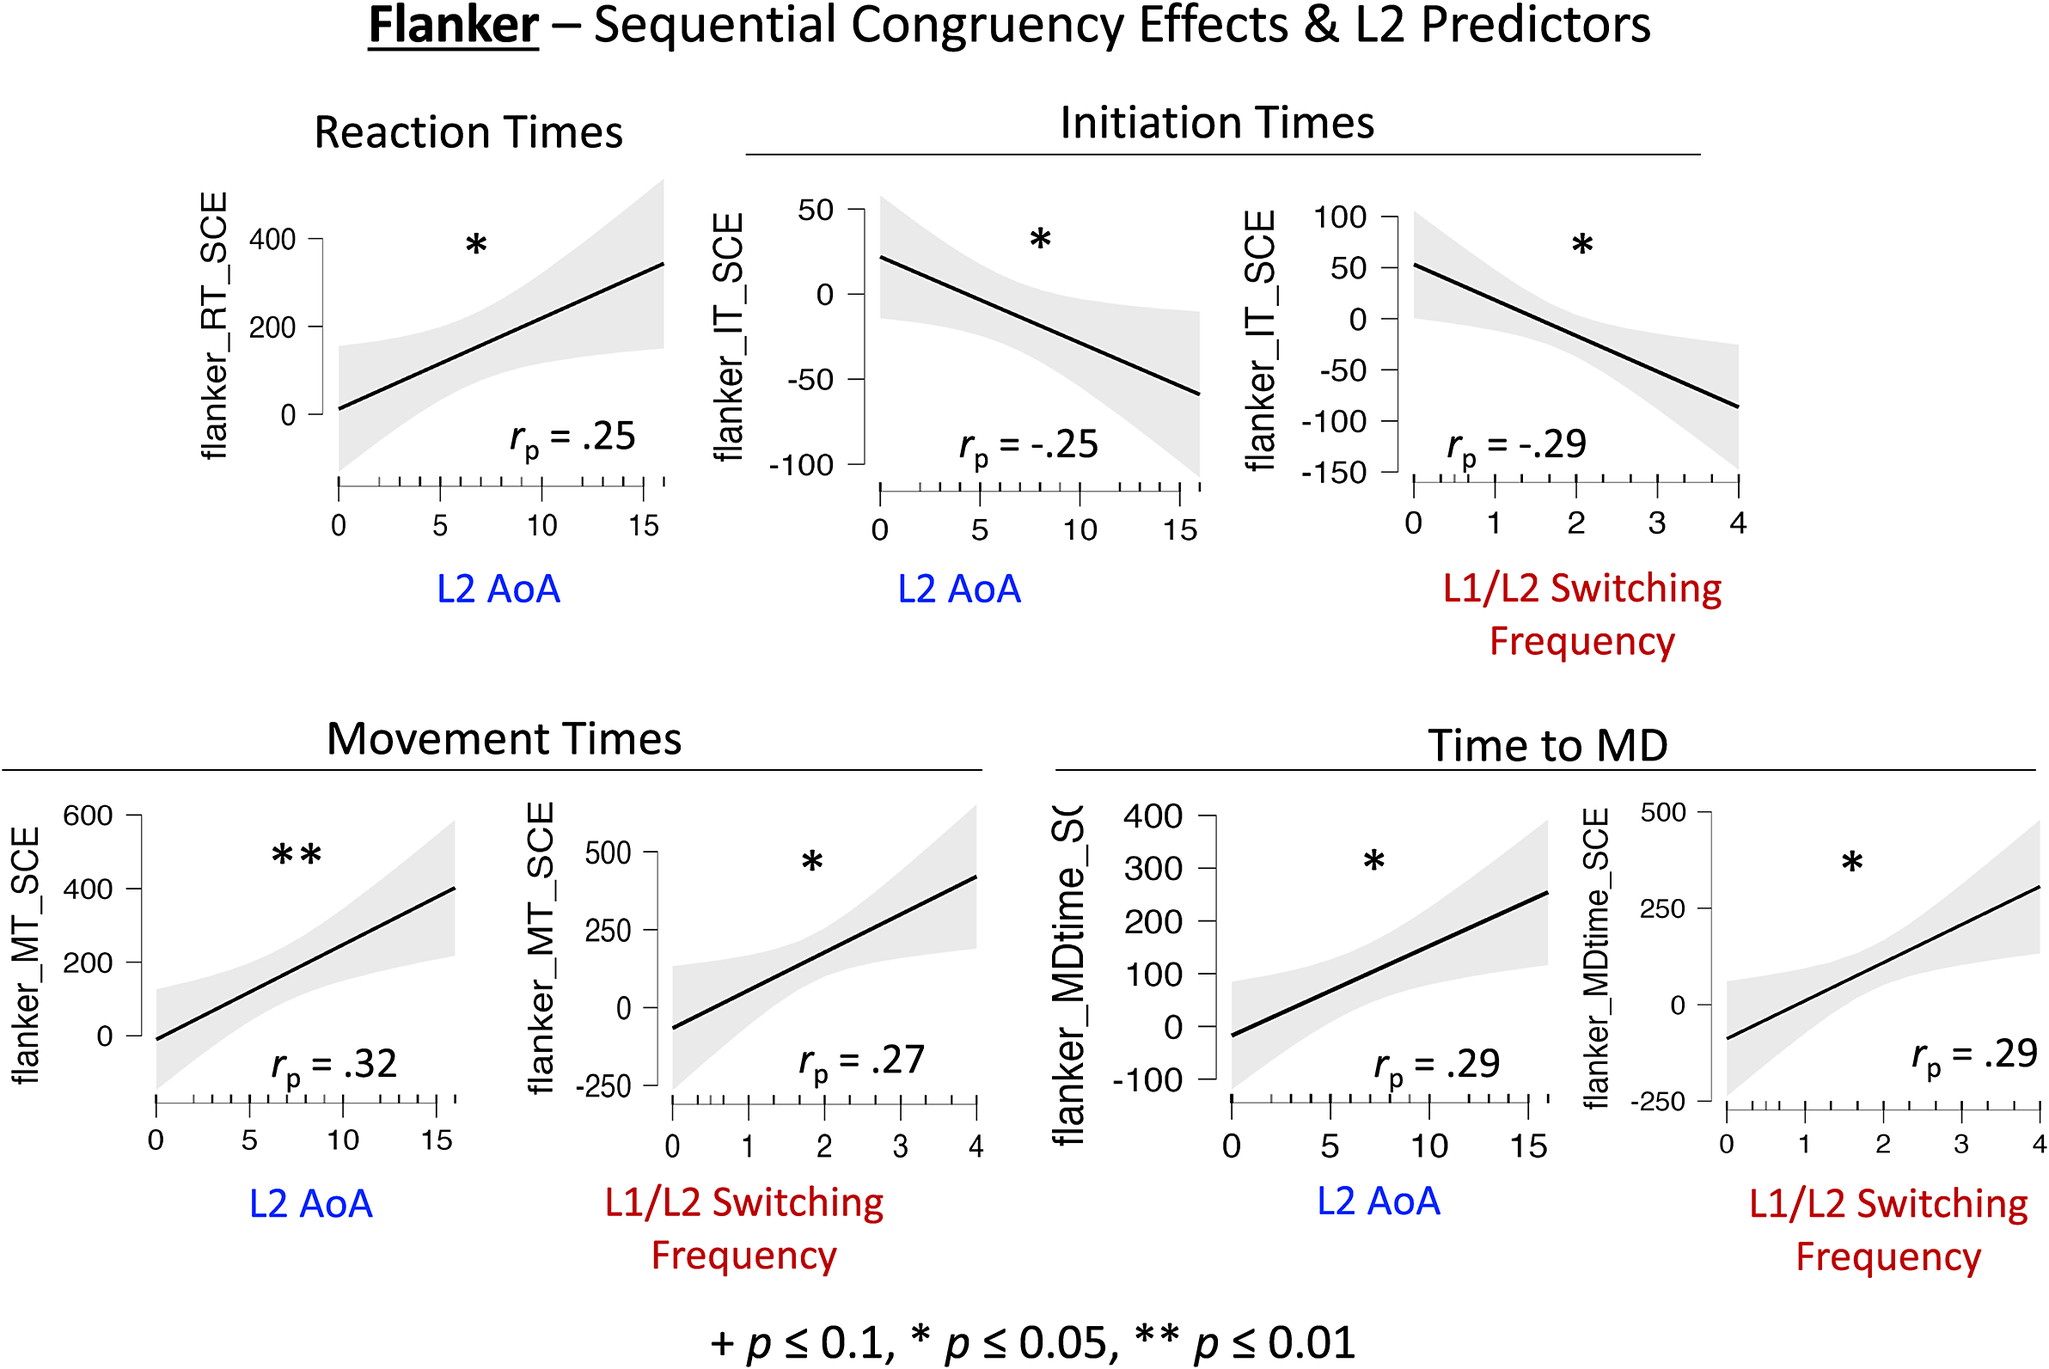
AoA and switching frequency consistently predicted the DVs. For initiation time, later AoA and more L1/L2 switching frequency were associated with smaller SCEs. For movement time and time to maximum deviation, the directions were reversed; earlier AoA and less L1/L2 switching frequency were associated with smaller SCEs. For RT, earlier AoA was associated with smaller RT SCEs (see Figure 4).
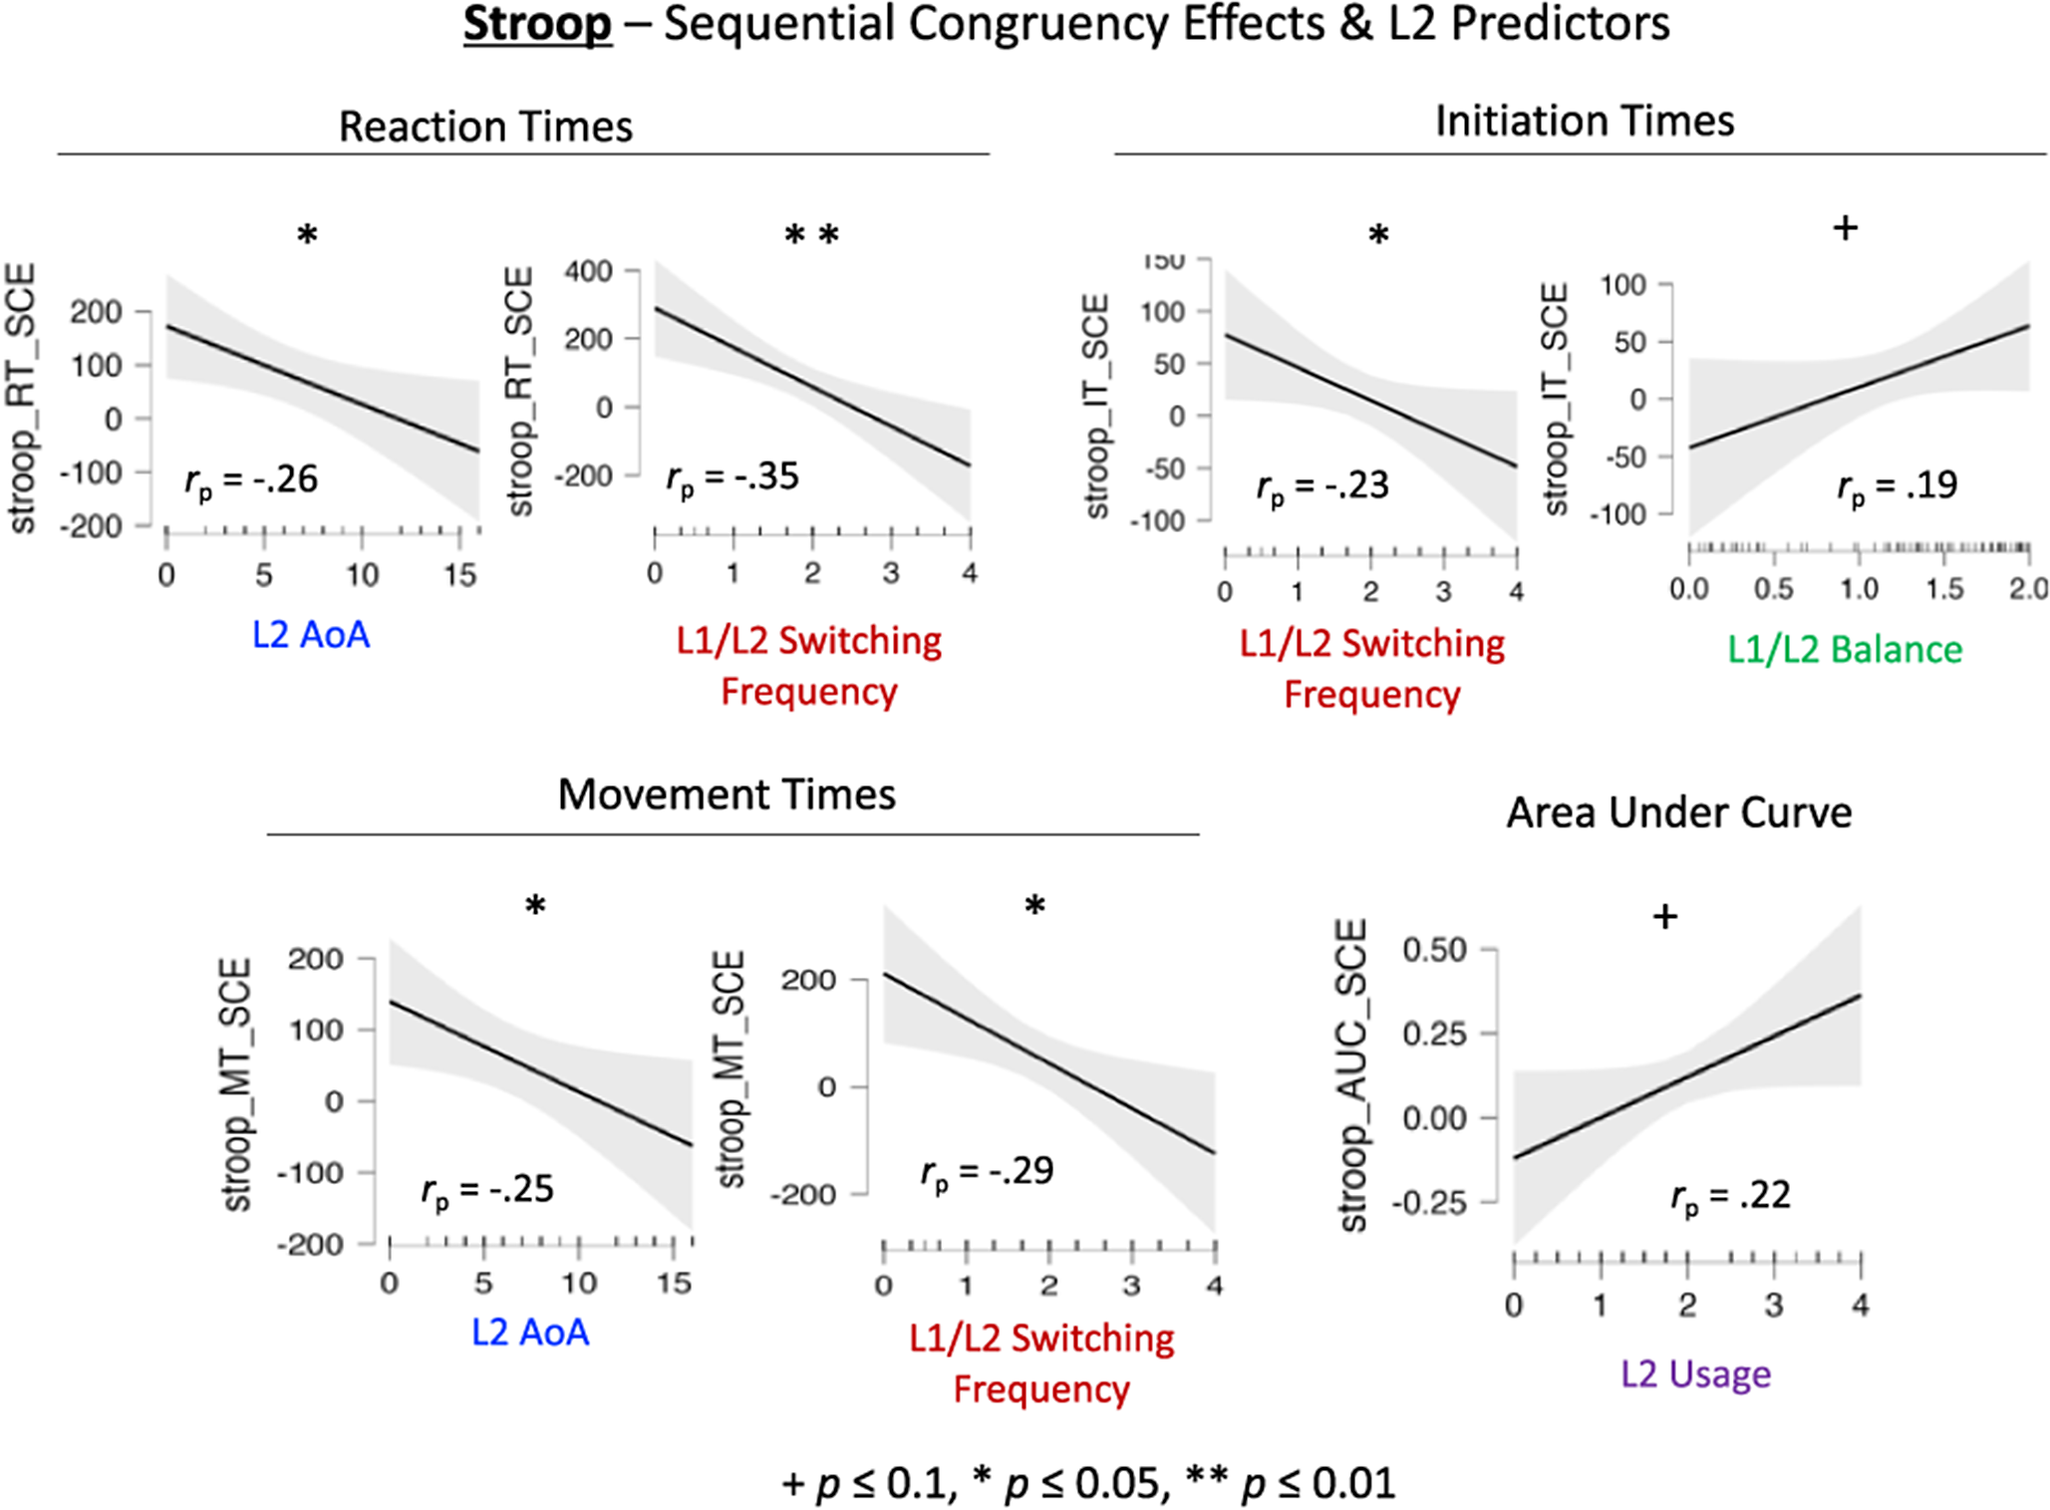
Table 3 and Figure 5 represent the relation between L2 variables and Stroop SCEs that reached or approached conventional levels of significance. Higher frequency of language switching was negatively associated with the SCE on initiation time, movement time and RT. Later AoA was also associated with smaller SCE RTs and movement times. No other effects reached conventional levels of significance.
Partial correlations (after controlling for all other L2 variables) for L2 variables predicting SCEs on the Stroop task by dependent variable during mouse-tracking that approached (p ≤ 0.1) or reached (p ≤ 0.05, p ≤ 0.01) conventional levels of statistical significance. Gray contours represent 95% confidence intervals.
4. Discussion
The present study examined the independent contributions of bilingual experiences on EFs using Flanker and Stroop mouse-tracking tasks. Several important findings emerged: 1) Mouse-tracking metrics captured the link between bilingualism and EFs that were not identified when solely examining overall RTs. 2) SCEs captured more relations between bilingual experiences and performance than simple conflict effects. 3) Second-language AoA and L1/L2 switching frequency consistently predicted EF outcomes. 4) The manner in which L2 AoA and L1/L2 switching frequency predicted EF outcomes depended on the nature of the task (more demanding: Stroop, less demanding: Flanker). These findings are discussed below and highlight the importance of embracing the complexity of the effects of bilingualism on cognition and the use of more sensitive measures to capture these effects.
4.1. Overall RTs and conflict effects are not enough
We demonstrate here that mouse-tracking is particularly well-suited for exploring the cognitive processes linked to bilingualism, which may not be adequately captured by overall RTs (see also Bartolotti & Marian, Reference Bartolotti and Marian2012). We did not show a significant association of L2 experiences with RTs on Flanker and Stroop conflict effects; however, significant predictors emerged with initiation times. In our SCE analyses, we observed that L2 experiences significantly predicted many other mouse-tracking variables alongside RT, and in some cases, additional L2 predictors emerged only in non-RT metrics.
For conflict effects, overall RTs were not significantly predicted by any bilingual experiences on the Flanker or the Stroop task. However, initiation time conflict effects on the Stroop task (the additional time that it takes individuals to initiate a response to incongruent than congruent trials once a decision has been made), were predicted by L1/L2 switching frequency. The more an individual switches between languages, the less likely they are to wait before initiating a response on incongruent trials relative to congruent trials. This finding complements previous work showing that bilinguals have longer initiation times than monolinguals on mouse-tracking Stroop tasks (Incera & McLennan, Reference Incera and McLennan2016). Incera and McLennan (Reference Incera and McLennan2018) then used a single measure of bilingualism, time exposed to L2, to extend these findings within bilinguals. They showed that greater bilingualism led to more time processing the stimulus before initiating a response. We break this down even further by including specific bilingual experiences that may contribute to this general pattern. We showed that switching between L1 and L2 is particularly indicative, beyond other L2 experiences, in predicting the duration individuals wait before initiating a response. This can be explained by a lifetime of flexibility in choosing which language needs to be spoken to any given interlocutor – environments in which switching between two languages is frequent, known as dense code-switching contexts (Green & Abutalebi, Reference Green and Abutalebi2013), does not require suppressing the first word that comes to mind, given that all individuals know both languages.
The present study also explored SCEs in both Flanker and Stroop tasks and demonstrated that L2 AoA and language switching frequency consistently predicted Flanker and Stroop SCEs on several mouse-tracking variables. However, L2 AoA was the only predictor associated with overall RT SCEs during the Flanker task (see Figure 4), once again demonstrating the sensitivity of mouse-tracking metrics compared to overall RTs.
In the Flanker task, we observed that both the L2 AoA and language switching frequency predicted initiation time, movement time and time to maximum deviation SCEs, whereas no association between switching frequency and RT SCEs was observed. The positive association between the L2 AoA and SCE for the Flanker task was strongest for movement times, and in the opposite (negative) direction for initiation times. This suggests that the relation observed between the overall RT SCE and AoA is driven mainly by movement times and is weakened by initiation times given that the overall RT is the sum of initiation and movement times. For movement times and time to maximum deviation, early AoA and less switching frequency predicted smaller SCEs.
In addition to the finding that some mouse-tracking metrics are more sensitive than overall RTs, SCEs captured more relations between bilingual experiences and performance than simple conflict effects, in line with previous work (Grundy et al., Reference Grundy, Chung-Fat-Yim, Friesen, Mak and Bialystok2017b). These findings are important for debates on whether bilinguals display faster disengagement of attention than monolinguals, as several have suggested (Antoniou, Reference Antoniou2023; Chung-Fat-Yim et al., Reference Chung-Fat-Yim, Calvo and Grundy2022; deMeurisse & Kaan, Reference deMeurisse and Kaan2023; Grundy & Bialystok, Reference Grundy and Bialystok2018; Grundy & Keyvani-Chahi, 2017; Grundy et al., Reference Grundy, Pavlenko and Bialystok2020). Grundy et al. (Reference Grundy, Chung-Fat-Yim, Friesen, Mak and Bialystok2017b) first provided evidence for this position across three experiments by demonstrating that bilinguals had smaller SCEs than monolinguals. They argued that one of the reasons for failed replications in studies that examine simple conflict (e.g., Flanker and Stroop) effects is that bilinguals are faster at disengaging attention from previously irrelevant information than monolinguals. Rapid disengagement is sometimes beneficial (when the previous trial is the same as the current trial), and sometimes detrimental (when the previous trial is different from the current trial) to performance. Some studies have claimed failed replications in showing smaller SCEs for bilinguals than monolinguals (Goldsmith et al., Reference Goldsmith, El-Baba, He, Lewis, Dirani, Liu and Morton2023; Goldsmith & Morton, Reference Goldsmith and Morton2018; Paap et al., Reference Paap, Myuz, Anders-Jefferson, Mason and Zimiga2019), but the present study suggests that this may be due to collapsing L2 AoA and switching frequency variables in previous samples, effectively masking real effects that are observable at the level of continuous analyses.
4.2. Task demands influence the effects of bilingualism on EF
For both conflict effects and SCEs, the Stroop task reversed the relation seen between certain bilingual experiences and outcomes on the Flanker task, and these changes may be due to attentional demands of the tasks. Past studies have shown that the Stroop task generally requires more attentional processing than the Flanker task (Heitz & Engle, Reference Heitz and Engle2007; Lu & Proctor, Reference Lu and Proctor1995). We confirmed this pattern in the present experiment by directly examining RTs: Stroop RTs (M = 1383 ms, SD = 373) were significantly longer than Flanker RTs (M = 1196 ms, SD = 351), t(97) = −4.92, p < 0.001, Cohen’s d = 0.497. This is important because work in the field demonstrates that EF effects between monolinguals and bilinguals are more likely to appear on more attentionally demanding than less attentionally demanding tasks (e.g., Costa et al., Reference Costa, Hernández, Costa-Faidella and Sebastián-Gallés2009; Comishen & Bialystok, Reference Comishen and Bialystok2021).
More L2 switching frequency led to larger RT conflict effects (r p = 0.22) on the Flanker task but led to smaller conflict effects on the Stroop (r p = −0.24) task. A comparison of the coefficients using a Fisher’s r to Z transformation (Fisher, Reference Fisher1915) reveals that they are statistically different from each other and in the opposite direction (Z-score = 2.51, p = 0.006). This pattern might be explained by the idea that rapidly switching between languages leads to adaptations to the underlying attentional system required for demanding, but not simple, tasks. The adaptation that results from switching between languages might not be efficient for simpler EF tasks, in which case, adaptations from avoiding intrusions from the unwanted language (i.e., conditions where less switching is preferred) could prove beneficial.
For movement times and RTs on the Flanker task, greater L2 AoA and L2 switching frequency led to larger SCEs, whereas the opposite was true for Stroop SCEs. Like the conflict effects, these findings highlight the importance of considering the attentional demands of the task. Not considering this task characteristic could lead to “failed” conceptual replications for the effects of bilingualism on EFs. Among bilinguals, Mishra et al. (Reference Mishra, Hilchey, Singh and Klein2012) demonstrated that high L2 proficiency bilinguals disengaged attention more rapidly than low L2 proficiency bilinguals on an inhibition of return paradigm, but later did not replicate this effect with a different sample (Saint-Aubin et al., Reference Saint-Aubin, Hilchey, Mishra, Singh, Savoie, Guitard and Klein2018). Their failed replication could reflect the possibility that L2 AoA and L2 switching frequency are better predictors of disengagement of attention than L2 proficiency, and that their second study did not have equivalent levels of L2 AoA and L2 switching frequency, masking the effects of L2 proficiency on this EF task.
Disengagement of attention is also heavily implicated in task switching. Bilinguals who switch more often between languages show better performance on nonlinguistic task switching (Prior & Gollan, Reference Prior and Gollan2011; Sanchez-Azanza et al., Reference Sanchez-Azanza, López-Penadés, Aguilar-Mediavilla and Adrover-Roig2020; Verreyt et al., Reference Verreyt, Woumans, Vandelanotte, Szmalec and Duyck2015) than those who switch less. Some researchers have argued that the Flanker task exercises more reactive control than the Stroop task, which, in turn, exercises more proactive control (Gonthier et al., Reference Gonthier, Braver and Bugg2016; Kalanthroff et al., Reference Kalanthroff, Davelaar, Henik, Goldfarb and Usher2017). The latter is deemed similar to the nature of language switching in which bilinguals engage. This difference in the underlying control modes of the tasks may partially account for the observed reversal in patterns. These findings underscore the significance of considering task demands, along with the timing and nature of language acquisition, in understanding how attentional control is exerted.
4.3. L2 AoA and language switching frequency
The present study delved into the complex relation between bilingual experiences and conflict effects using various mouse-tracking metrics. According to the adaptive control hypothesis, different bilingual experiences place varying demands on the EF system (Green & Abutalebi, Reference Green and Abutalebi2013). Our findings revealed that L2 AoA and language switching frequency consistently predicted Flanker and Stroop SCEs. We provide some explanations for these emerging patterns.
The more consistent relation between earlier L2 AoA and smaller SCEs found in our data suggests that individuals who acquire a second language earlier in life are better able to disengage from past trials. This efficiency in response selection may stem from prolonged exposure and experience in managing two languages (Bialystok, Reference Bialystok2017; Luk et al., Reference Luk, Bialystok, Craik and Grady2011). This idea is further supported by findings that early bilinguals exhibit reduced prepotent responses on a number–letter task-switching paradigm (Yow & Li, Reference Yow and Li2015) and reduced mixing costs (Soveri et al., Reference Soveri, Laine, Hämäläinen and Hugdahl2011a) compared to later bilinguals, who have less experience navigating language conflict.
Regarding language switching frequency, our results varied across tasks and mouse-tracking metrics. For the Stroop task, we observed that higher switching frequency was associated with smaller SCEs. This finding suggests that frequent switchers were less influenced by the context (i.e., trial type). Frequent switching between multiple languages requires rapid attentional disengagement, and these domain-general adaptations may lead to better disengagement of attention over time, resulting in smaller SCEs.
Interestingly, in the Flanker task, the pattern was reversed. Bilinguals with less frequent language switching demonstrated smaller SCEs. This discrepancy might be explained by the different cognitive demands of the two tasks. The Flanker task involved lower attentional demands, and individuals who switch languages less frequently might employ different response strategies. Less frequent switchers may have optimized attentional control for less variable environments (i.e., single-language contexts), which predicts more efficient performance in simpler tasks like the Flanker. The low reported switching frequency (M = 1.49 out of 4) among our participants suggests that they may predominantly engage in single-language contexts (e.g., L2 at school vs. L1 at home). In these environments, selective attentional control may not be exercised as vigorously as in dual-language contexts (Green & Abutalebi, Reference Green and Abutalebi2013). Therefore, the cognitive strategies developed by less frequent switchers could be more effective for tasks with lower demands, such as the Flanker task. These findings are complex, and indicate a need for a more nuanced examination of how specific bilingual experiences influence SCEs. Our study aims to initiate this exploration, and by sharing our data, we encourage further analysis and theoretically driven predictions to unravel these complexities.
4.4. Limitations
It is important to consider that mouse-tracking is a relatively new methodology. We urge future research to undertake theoretical work essential for understanding what mouse-tracking metrics reveal about bilinguals’ cognitive processes and different response strategies, as these mechanisms have yet to be consistently identified. Therefore, inferences about mechanisms and nuances between different metrics beget caution. Furthermore, the design features of the mouse-tracking paradigm have a considerable effect on the cognitive effects observed (Schoemann et al., Reference Schoemann, O’Hora, Dale and Scherbaum2021). There is also much heterogeneity in the design of the paradigms and inconsistent reporting of design choices. For example, the use of click versus hover responses, static versus dynamic starts, or issuing a warning if initiation time is long, allow the researchers to infer different parts of the decision-making process. We have opted for a static start and click response because they yield larger conflict effects (Grage et al., Reference Grage, Schoemann, Kieslich and Scherbaum2019). Therefore, our results might not generalize to other mouse-tracking paradigms.
In the present study, we have described our sample’s bilingualism characteristics in detail. The specificity and complexity of our sample’s experiences warrant consideration in assuming generalizability of our results. However, rather than deem this a limitation, we urge researchers to take on this complexity by measuring and reporting bilingual experiences, as have others (Anderson et al., Reference Anderson, Yurtsever, Fisher-Skau, Cherep, MacPhee, Luk and Grundy2024; Dass et al., Reference Dass, Smirnova-Godoy, McColl, Grundy, Luk and Anderson2024; De Bruin, Reference De Bruin2019; Yurtsever et al., Reference Yurtsever, Anderson and Grundy2023). In addition to individual differences in bilingual experiences, environmental factors like the community and context in which bilinguals use their languages may also influence attentional control. Due to the study location and individual and linguistic diversity in our sample, we were not able to address these factors. Incorporating detailed information regarding bilingual experience can enhance our understanding of cognitive processes revealed by mouse-tracking metrics. In this study, we have also taken an exploratory data-driven approach to observe the effect of bilingualism predictors on EF tasks. Future research should incorporate theory-driven approaches to enhance the robustness and generalizability of our findings.
5. Conclusion
The present study used Flanker and Stroop mouse-tracking paradigms to examine the effects of bilingualism on EFs and found that second-language AoA and first-/second-language switching frequency predicted both conflict and SCEs. These relations were limited when overall RTs were examined rather than the additional metrics that the mouse-tracking paradigms provide, including the time that it takes to initiate a response, complete a response, and maximum deviation from the most efficient path to the correct response. More bilingualism and EF associations were observed for SCEs than for simple conflict effects, and the attentional demands of the task (Stroop: High vs. Flanker: Low) reversed the direction of many of these patterns. These findings provide strong evidence that different bilingual experiences predict different EF outcomes, and that more sensitive measures are needed to capture these dynamics.
Supplementary material
To view supplementary material for this article, please visit http://doi.org/10.1017/S1366728924000786.
Data availability
The data that support the findings of this study are openly available on Figshare at the following link: http://doi.org/10.6084/m9.figshare.25357060.
Competing interest
The authors declare none.


 Open access