


Highlights
-
This study describes for the first time the incidence and prevalence of Rett syndrome in Ontario, Canada.
-
A substantial disease burden was evidenced by the high prevalence of chronic comorbidities and high rates of healthcare resource utilization.
-
The high rates of medication use suggest an urgent need for treatment options.
Introduction
Rett syndrome (RTT) is a rare neurodevelopmental disorder primarily affecting females due to de novo variants in the MECP2 gene located on the X chromosome. Reference May, Kponee-Shovein and Neul1 The estimated global incidence of RTT is 1 in 10,000 to 15,000 live female births, Reference May, Kponee-Shovein and Neul1,Reference Kaufmann, Percy and Neul2 with a prevalence of 1 in 20,000 to 40,000 people. Reference Fu, Armstrong and Marsh3 In Canada, limited epidemiological data are available, but a recent study estimated that approximately 600 to 900 people are affected by RTT in Canada. Reference Bottaro4
Following an apparent normal early development, clinical manifestations of RTT such as the development of unique stereotypical hand movements appear during the first 6 to 18 months of age, with an average age at diagnosis of 2.5 years. Reference Fu, Armstrong and Marsh3 Initially, there is a period of regression in acquired developmental skills – including the gradual decline and loss of spoken language, social communication, and motor skills – and appearance of other multisystem symptoms, such as seizures/epilepsy, sleep disturbances and impairments in musculoskeletal, cardiac, endocrine and/or gastrointestinal functions. Reference Petriti, Dudman, Scosyrev and Lopez-Leon5,Reference May, Kponee-Shovein and Neul1 Following the disorder onset, a stabilization of clinical symptoms occurs to finally progress into motor and function disability. Reference Percy, Benke, Marsh and Neul6 Despite early onset, the estimated survival rate in over 70% of RTT patients is 45 years of age. Reference Tarquinio, Hou and Neul7 Until recently, treatment options for RTT were limited to managing comorbidities and symptoms based on pharmacotherapy (e.g., anti-seizure medications, antibiotics) and rehabilitative therapies (e.g., physical, speech–language, and occupational therapy). Reference May, Kponee-Shovein and Mahendran8 Currently, trofinetide has been approved for the treatment of RTT, showing promise for the management of RTT patients. 9–11
Given that RTT has a progressive nature, patients require lifelong healthcare services, including frequent specialist visits, hospitalizations, home care and long-term care. Reference Kaufmann, Percy and Neul2,Reference May, Kponee-Shovein and Mahendran8 The high healthcare resource utilization (HCRU) incurred by patients with RTT may represent substantial costs to the healthcare system. Reference Kaufmann, Percy and Neul2,Reference May, Kponee-Shovein and Mahendran8 Studies have identified higher HCRU among patients with RTT in specific situations. A survey conducted in Australia identified higher RTT-associated hospitalizations due to respiratory infections, Reference MacKay, Leonard, Wong, Wilson and Downs12,Reference Louise, Fyfe and Bebbington13 whereas retrospective cohort studies identified that surgical correction of scoliosis, seizures/epilepsy, sepsis and gastrointestinal or nutritional problems such as gastrostomy malfunction and constipation were major contributors to hospitalizations and emergency department visits. Reference Hammett, Harris, Boreham and Mehdian14,Reference Rashid, Mahendran, Lefebvre, Davis and Kponee-Shovein15 These observations highlight the frequent lifelong comorbidities and medical complications that patients with RTT often experience. A US real-world study found RTT-associated total costs per pediatric female patient to exceed $40,000 USD per year. Reference May, Kponee-Shovein and Mahendran8 These costs are reportedly higher than costs for other common neurologic diseases, such as cerebral palsy (CP) ($25,844 USD) and fragile X syndrome ($17,878 USD). Reference May, Kponee-Shovein and Mahendran8,Reference Vekeman, Gauthier-Loiselle and Faust16,Reference Whitney, Kamdar, Ng, Hurvitz and Peterson17 Despite the increased care burden of RTT, there exists limited information on the epidemiology and HCRU of RTT in Canada. This study aims to describe the epidemiology of RTT and the HCRU incurred by patients with RTT in Ontario, Canada, thereby assisting in filling the literature gaps and supporting the future research in this area to improve patient outcomes.
Methods
Study design
This retrospective, observational cohort study was designed to identify RTT cases in Ontario, Canada’s largest province by population (approximately 14 million). The study utilized the Institute for Clinical Evaluative Sciences (ICES) administrative datasets, which capture publicly funded healthcare touchpoints and medications for Ontario residents. Encrypted identifier numbers (Ontario Health Insurance Plan [OHIP] numbers) were used by ICES to link patient-level data across multiple healthcare databases to execute longitudinal analyses of cases.
Study population
RTT cases (incident and prevalent) were identified based on the 10th International Classification of Diseases Canadian Version (ICD-10-CA). Cases were included if they had at least one hospitalization record (from the Discharge Abstract Database, DAD) with a diagnosis code of RTT (ICD-10-CA code F84.2). Cases were excluded if (1) they had an invalid OHIP number, (2) were ineligible for OHIP, (3) had missing demographics such as birth date, sex or postal code or (4) died before the index date. The earliest date of diagnosis code record was considered the index date.
Incident cases were identified during the selection period from September 1, 2017, to August 30, 2022. Prevalent cases were identified from April 1, 2002, to August 30, 2022. Prevalent cases identified from April 1, 2002, to August 31, 2017, were accrued and included in the study cohort if they were still alive as of September 1, 2017. For these cases, the index date was assigned as September 1, 2017. The follow-up period was considered from the index date until the first instance of any of the following events: date of death, loss to follow-up in the ICES datasets (including loss of OHIP eligibility), most recent data availability or end of the study period (i.e., August 30, 2023). Study time periods are illustrated in Figure 1.
Study time periods.

Variables
Demographic information was analyzed at index date from different data sources. Sex and age groups were collected from the Registered Persons Database (RPDB). Neighborhood Level Income Quintile, Local Health Integration Network of residence and rurality were estimated based on residential address using the Postal Code Conversion File Plus. 18 Comorbidities of interest, as listed in Table 2 were captured either through ICD-10-CA codes or established ICES cohorts at any time prior to the index and during the follow-up period. All-cause mortality during the study period was estimated from the RPDB.
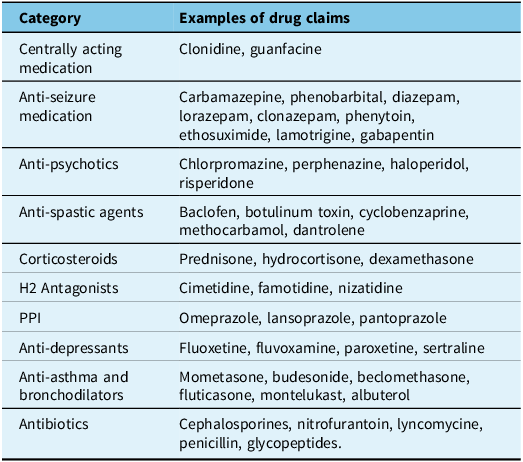
Healthcare resource utilization (HCRU) was captured during the follow-up period from different data sources. Hospital admissions were retrieved from the DAD, and emergency department visits from the National Ambulatory Care Reporting System. Patient claims for physician services, including visits to outpatient specialists such as neurologists, were collected from the OHIP database. Prescription drug claims, including all-cause and disease-specific drugs, dispensed under the Ontario provincial public drug program, came from the Ontario Drug Benefit database. Disease-specific drug categories further included centrally acting medications, anti-seizure medications, anti-psychotics, anti-spasticity medications, corticosteroids, histamine 2-receptor antagonists, proton pump inhibitors, anti-depressants, anti-asthma/bronchodilators and antibiotics. Drug categories are further detailed in Table 1.
Disease-specific drug claims definition

Abbreviations: H2 = Histamine-2 Receptor; PPI = proton pump inhibitors.
Analysis
Demographics, clinical characteristics, prevalence of comorbidities and all-cause mortality were analyzed using numbers and percentages for categorical variables and mean (SD) and median (IQR) for continuous variables.
Incidence and prevalence of RTT in Ontario were analyzed as the annual new number and annual number of RTT cases identified in the study cohort and reported per 10,000 births and people, respectively, using population estimates for each corresponding year from Statistics Canada. 19,20 Incidence and prevalence of RTT were assessed for different 2-year follow-up periods, including 2017–2019, 2019–2021 and 2021–2023.
Healthcare resource utilization (HCRU), including prescription drug claims, was analyzed as the number and proportion of cases with at least one touchpoint per HCRU category, and as the total number of touchpoints observed during the follow-up period. Average visit length was calculated in days and reported as the mean (SD), median (IQR), minimum and maximum.
Results based on less than six cases were masked as ‘‘1–5’’ for privacy reasons based on standard ICES policies. All analyses were conducted using SAS version 9.3 or higher (SAS Institute, Cary, NC). Missing data were reported as their own category. This study was approved by Advarra IRB Services (IRB approval Pro00076448). Analyses were conducted by an ICES analyst using the analysis plan developed by the study authors. Study authors received only aggregate data.
Results
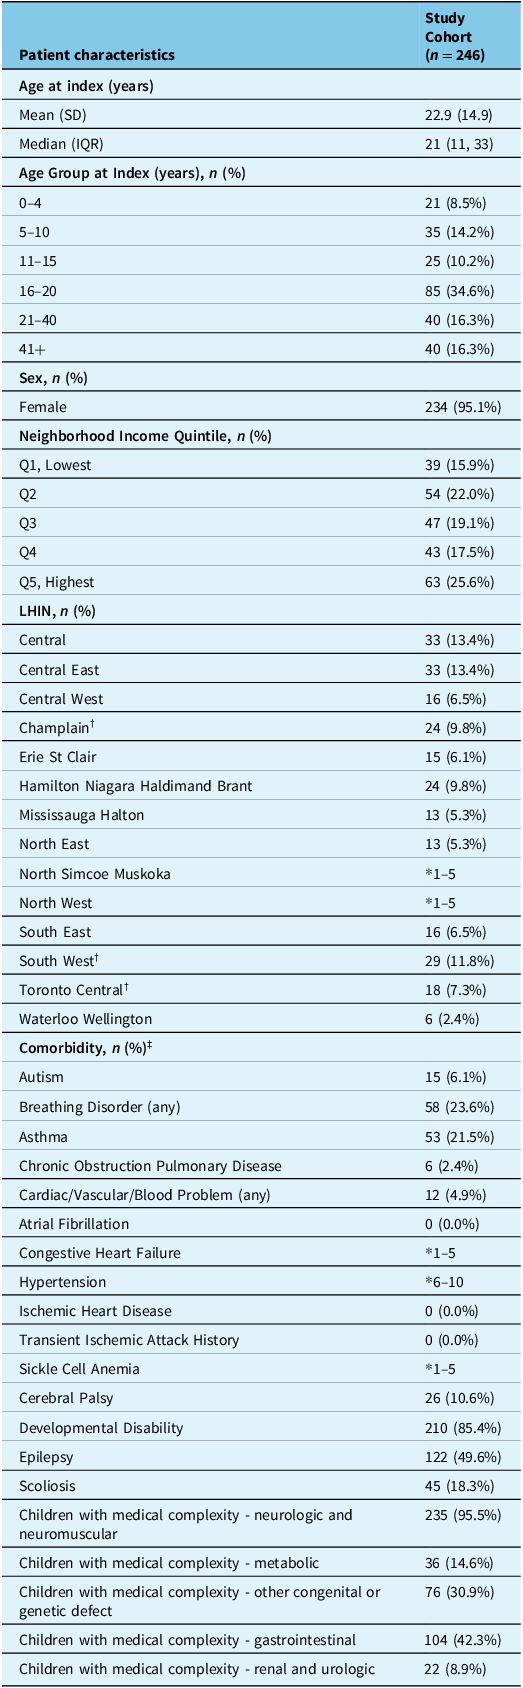
A total of 246 RTT cases met the study inclusion criteria. The included RTT cases were predominantly female (95.1%), had a median (IQR) age of 21 years (11–33) and a majority (40%) resided in central Ontario (which includes Toronto where one of the specialized Rett clinics is located). The most common comorbidities among RTT cases included developmental disabilities (85.4%), epilepsy (49.6%) and gastrointestinal comorbidities (42.3%). Participant characteristics are summarized in Table 2.
RTT cases characteristics

Abbreviations: RTT = Rett syndrome; SD = standard deviation; IQR = Interquartile; LHIN = Local Health Integration Network.
* 1–5: N values < 6 have been masked.
†LHINs were a specialized Rett clinic is located.
‡Comorbidity categories are not mutually exclusive and may not add to 100%.
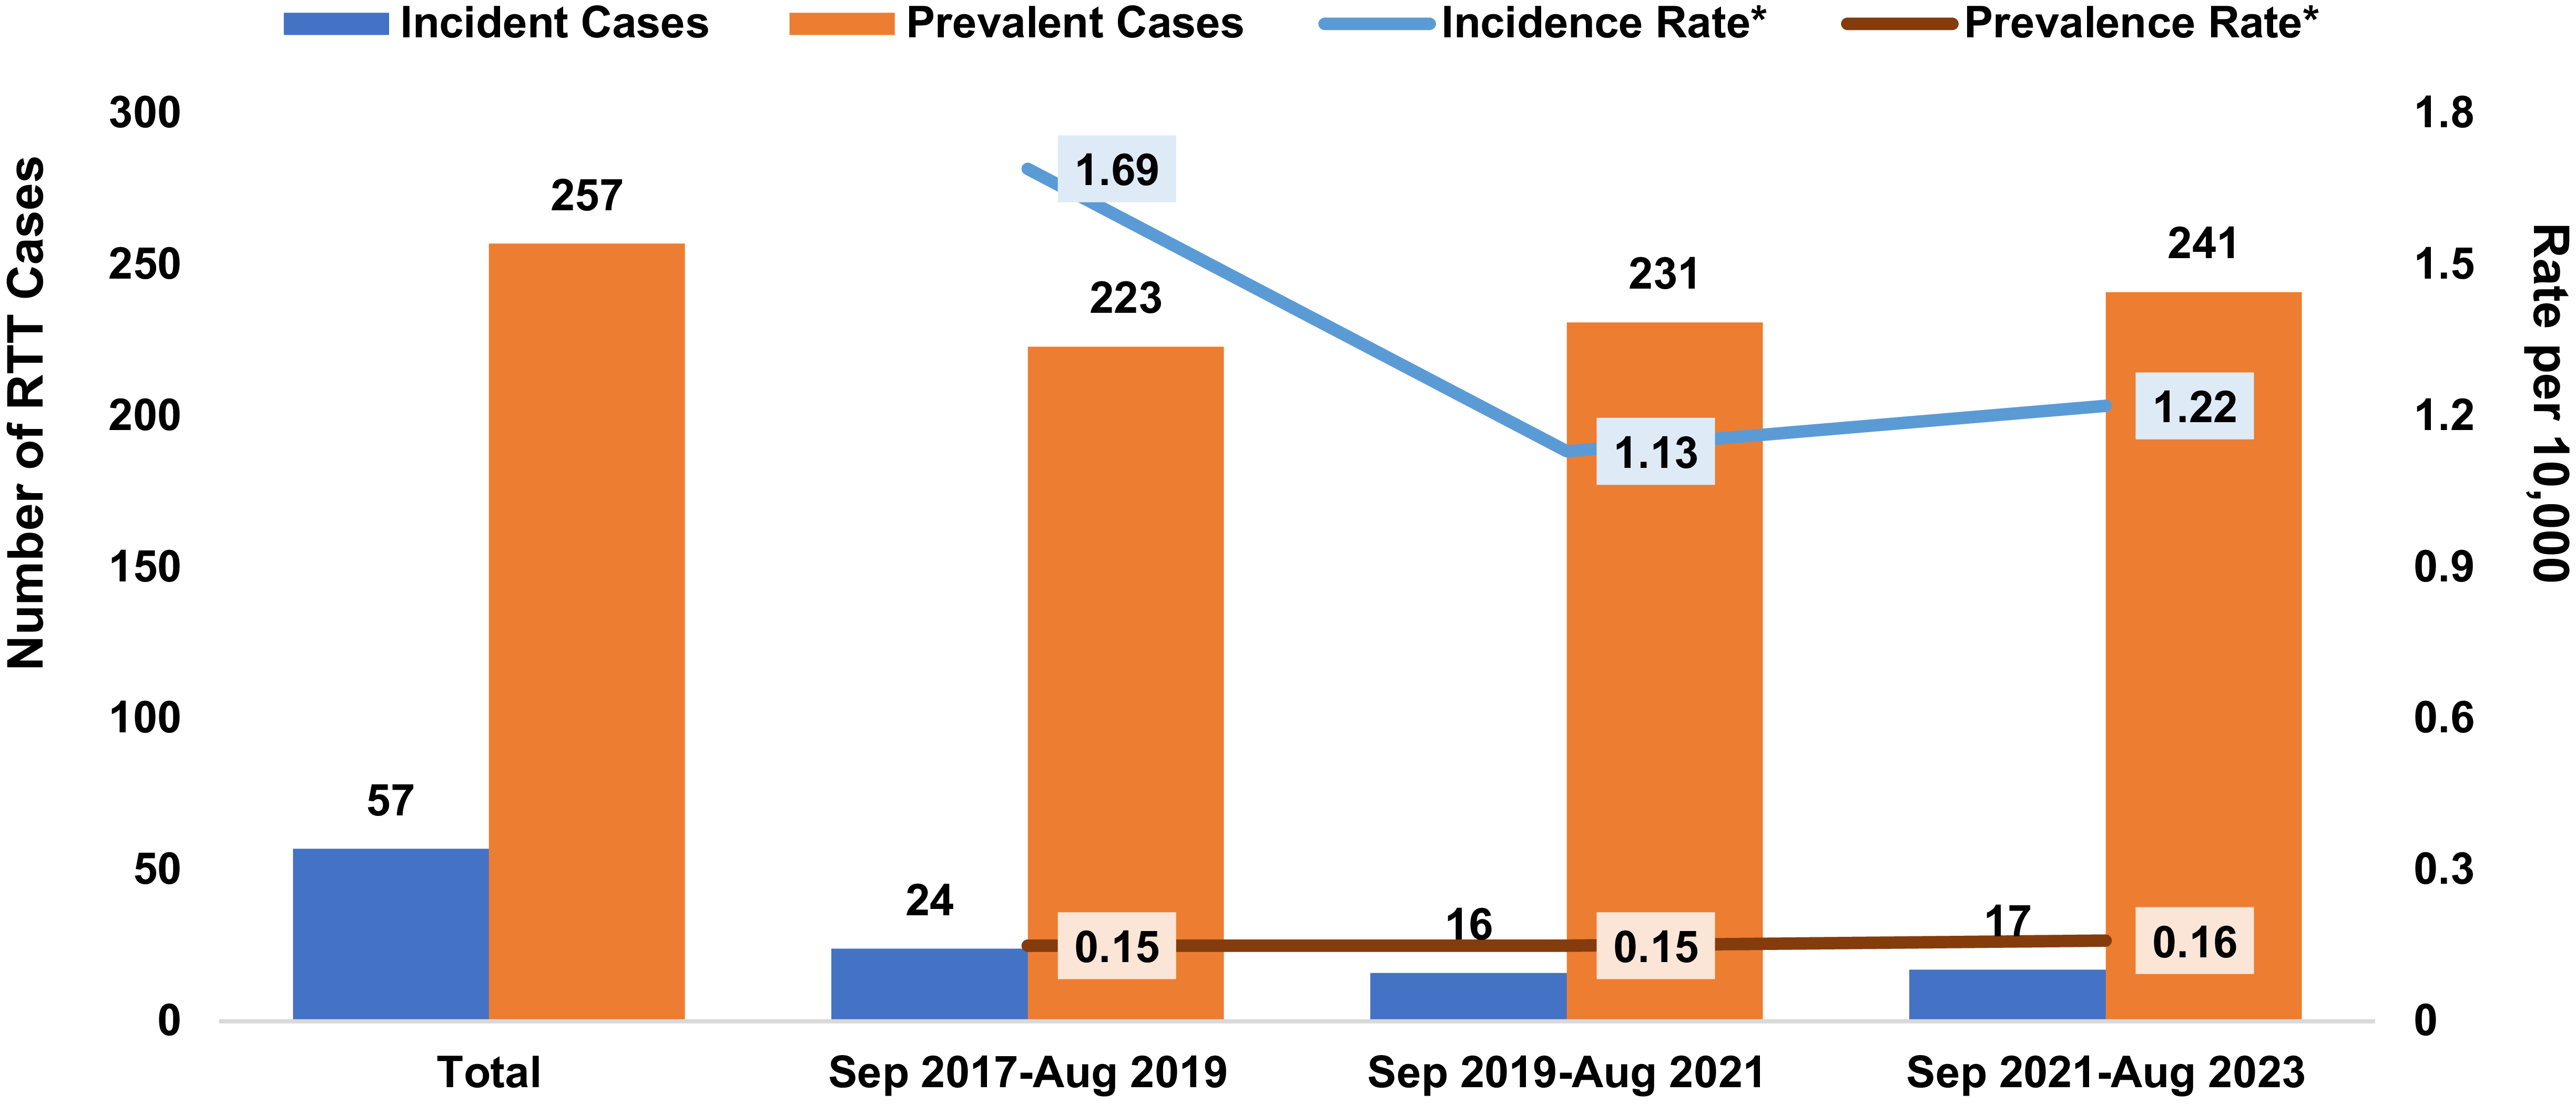
From September 2017 to August 2023, in Ontario there were a total of 57 incident RTT cases with annual rates ranging from 1.13–1.69 cases per 10,000 births (1.69 cases per 10,000 births from September 2017 to August 2019, 1.13 cases per 10,000 births from September 2019 to August 2021 and 1.22 cases per 10,000 births from September 2021 to August 2023). The number of prevalent RTT cases in Ontario, accrued from 2002, was 257 (0.15 cases per 10,000 people from September 2017 to August 2019, 0.15 cases per 10,000 people from September 2019 to August 2021 and 0.16 per 10,000 people from September 2021 to August 2023). Death from all causes during the study period was 11.8% (29 RTT cases). Incident and prevalent cases are summarized in Figure 2.
Incidence and prevalence of RTT in Ontario, Canada. Abbreviations: RTT = Rett syndrome. *Incidence rate per 10,000 births, using Statistics Canada Birth Rates; Prevalence rate per 10,000 people, using Statistics Canada Population Rates.

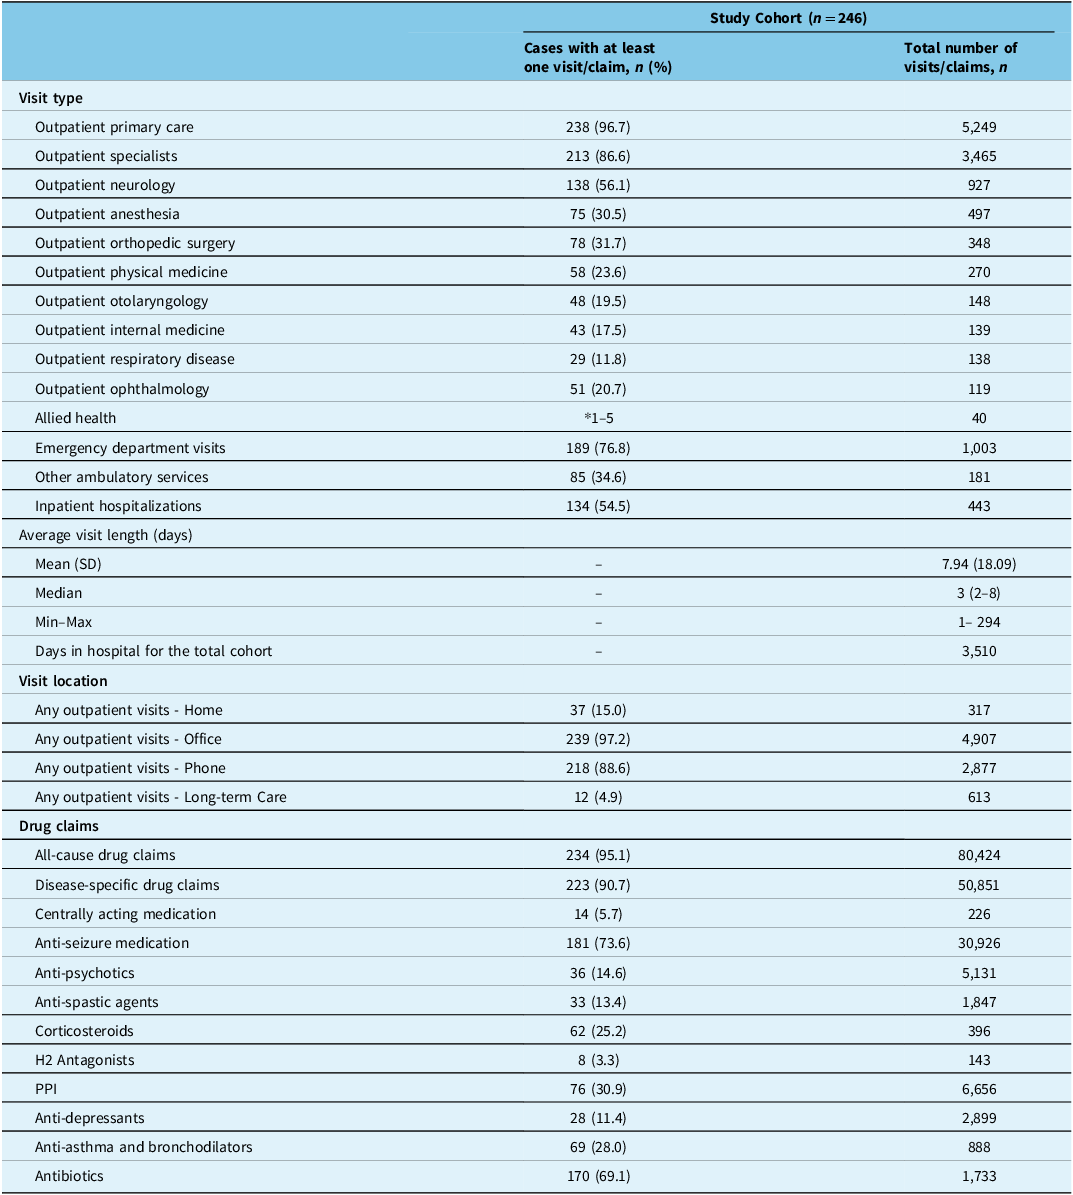
During the 5-year follow-up period, in terms of HCRU, most RTT cases had at least one outpatient primary care visit (96.7%) and outpatient specialist visit (86.6%), which were either in-office (97.2%) or by phone (88.6%). The most frequently visited specialists included neurologists (56.1%), followed by orthopedic surgeons (31.7%) and anesthesiologists (30.5%). Most cases also had at least one emergency department visit (76.8%) and inpatient hospitalization (54.5%). The mean length of stay of inpatient hospitalizations was 7.9 ± 18.09 days, with a maximum stay of 294 days. In the same follow-up period, most cases (95.1%) had at least one public claim for all-cause medication. In the entire cohort, there was a total of 80,424 all-cause drug claims, representing a median of 114 claims per patient (median of 2 claims per patient per day). Similarly, many cases (90.7%) claimed at least one disease-specific medication, with a total of 50,581 disease-specific drug claims. Disease-specific drug claims were predominantly for antibiotics (69.1%) and anti-seizure medications (73.6%). Healthcare resource utilization (HCRU) is summarized in Table 3.
Healthcare resource utilization (HCRU) among RTT cases during the follow-up period

Abbreviations: RTT = Rett syndrome; SD = standard deviation; H2 = Histamine-2 Receptor; PPI = proton pump inhibitors.
* 1–5: N values < 6 have been masked.
Discussion
This retrospective real-world study utilizing administrative claims data is the first study in Canada to provide population-based estimates of RTT and its associated burden of illness. Findings from this study showed that the annual incidence rates of RTT from 2017 to 2023 were relatively low (1.13–1.69 cases per 10,000 births per year). Meanwhile, as expected, the annual prevalence rates (0.15–0.16 cases per 10,000 people) remained stable over time. Additionally, these study findings suggest a substantial disease burden in RTT cases in Ontario, Canada, as evidenced by the high prevalence of chronic serious comorbidities and high rates of HCRU. Most cases claimed at least one outpatient primary care visit (96.7%), specialist visit (86.6%), emergency visit (76.8%) and/or inpatient hospitalization (54.5%). Likewise, this study found high rates of medication claims, with 95.1% of RTT cases claiming at least one medication.
The baseline population demographics and prevalence of comorbidities in the current study are aligned with previously published data from North America. A recent study from the US using similar real-world settings data reported that RTT predominantly affects females with a mean age of 20 years. Incident and prevalent RTT cases found in Ontario were low and are comparable to previous non-Canadian epidemiological estimates. For example, a US study found annual incidence proportion estimates of 0.34 and 0.23 per 10,000 people in 2018 and 2019, respectively, Reference May, Kponee-Shovein and Mahendran8 while prevalence estimates ranged from 0.30 to 0.32 per 10,000 people. Reference May, Kponee-Shovein and Mahendran8 However, a global systematic review showed higher prevalence trends, with a pooled prevalence estimate of 0.71 per 10,000 females. The higher prevalence trends observed in the systematic review were mainly driven by the varying ascertainment methods of each study. Reference Petriti, Dudman, Scosyrev and Lopez-Leon5 Overall, prevalence estimates are influenced by disease incidence and disease chronicity and survival. Studies have found that deaths among RTT cases usually occur before age 45. Reference Tarquinio, Hou and Neul7 Given the known low incidence of RTT, its progressive nature and that most of the RTT cases were identified in the second decade of life, it is expected that prevalence estimates were low and stable over the study period.
Aligned with our findings, RTT has been associated with high rates of comorbid conditions, including epilepsy (52.1%), gastrointestinal and nutritional disorders (41.9%) and orthopedic conditions (34.6%), which are known for being major contributors to HCRU, particularly to hospital admissions, emergency department visits and surgical procedures such as gastrostomies and orthopedic surgeries. Reference Hammett, Harris, Boreham and Mehdian14,Reference Rashid, Mahendran, Lefebvre, Davis and Kponee-Shovein15,Reference MacKay, Leonard, Wong, Wilson and Downs12,Reference May, Kponee-Shovein and Mahendran8 When compared to the general population in Canada, RTT cases lived proportionally with more frequent quality-of-life-impacting comorbidities, such as developmental disability (85.4%) and epilepsy (49.6%). As of 2022, 13% of Canadians aged 1–19 years lived with epilepsy from different causes, 21 and only 1.5% of the total Canadian population (youth aged 15–24 years - 20.1%) lived with a developmental disability. 22 These findings suggest that RTT cases experience more lifelong comorbidities that impact quality of life and result in multiple clinical complications and disabilities (e.g., reduced mobility, poor oromotor control), requiring increased and prolonged HCRU.
Few studies have explored the HCRU incurred by patients with RTT. A US study found an all-cause HCRU of 3.01 visits per person-month, mainly driven by outpatient services (0.7 ± 2.4), Reference May, Kponee-Shovein and Mahendran8 similar to the findings in this study. Moreover, HCRU incurred by patients with other neurological diseases appears similar to our results. A US study on HCRU found that the occurrence of outpatient visits in patients with CP was similarly high (96.7–97.2% RTT; 97.5% CP). Reference Whitney, Kamdar, Ng, Hurvitz and Peterson17 However, when compared to CP HCRU, emergency department visits (76.8% RTT; 38.4% CP) and inpatient visits (54.5% RTT; 23.7% CP) were descriptively higher in patients with RTT. Reference Whitney, Kamdar, Ng, Hurvitz and Peterson17 Although the differences between diseases and study designs make comparisons challenging, these findings may suggest a high disease burden among RTT cases. RTT is associated with multisystem symptoms and comorbidities such as seizures/epilepsy and gastrointestinal affections that often require acute HCRU due to common medical complications (e.g., infections, aspiration). Nonetheless, multisystemic comorbidities often require long-term supportive therapy such as feeding assistance or orthopedic surgery for scoliosis correction. Reference May, Kponee-Shovein and Mahendran8 Moreover, a Canadian study showed that the mean per capita total costs of CP patients were higher when compared with their counterparts who do not live with the condition, with the greater differences in costs observed in those cases < 15 years old. 23 The high rates of medication claims found in this study may correspond to an increased frequency of dispensing medications due to regional or institutional practicing and dispensing requirements for certain medications. Examples of these include weekly dispensing policies in long-term and group care homes, or daily drug dispensing under government programs for specific categories of medications (e.g., anti-seizure medication, anti-depressants) often used in patients with neurological conditions, including RTT. Reference May, Kponee-Shovein and Neul1,Reference May, Kponee-Shovein and Mahendran8 The high rates of antibiotics and anti-seizure medication used in this study align with the high clinical burden of illness observed in RTT cases as reflected by the increased comorbidity prevalence. Given that the current treatment options for RTT are limited to the management of symptoms or associated complications (e.g., infections, seizures, gastrointestinal symptoms), findings from this study suggest an urgent need for treatment options for RTT. Reference May, Kponee-Shovein and Mahendran8
Some limitations should be considered when interpreting the results of this study. First, the administrative claims data used for this study were generated from financial transactions for services and drugs received by patients. As such, only cases accessing healthcare services were captured and incidence and prevalence estimates may potentially be underestimated. This may be especially true among pediatric and adolescent populations (in early disease stages), as illustrated by the low number of cases in these age groups. Second, the use of claims data may lead to measurement errors common to administrative databases, such as possible inaccuracy of diagnostic and procedural codes. As such, the measured comorbidities are not medically confirmed diagnoses. However, given the rare nature of RTT, it is unlikely that any claim with diagnosis codes of interest was inaccurately used. Third, the presence of a record for prescribed or dispensed medication does not indicate that the medication was taken as prescribed. Finally, the data presented in this study are specific to Ontario, and although they may be extrapolated to reflect RTT epidemiology in other Canadian provinces and territories, the significant differences across these populations limit these analyses. Therefore, the generalizability of these results poses a limitation. Future research into exploring the epidemiology of RTT in other provinces of Canada will further facilitate the understanding of this complex neurodevelopmental disease within the country. Moreover, future longitudinal studies may assess treatment patterns, specifically the short- and long-term impact of novel pharmacological treatments, in terms of their impact on clinical burden, HCRU and costs, alongside survival.
Conclusion
In conclusion, this study describes for the first time the incidence and prevalence of RTT, comorbidity burden and HCRU incurred by RTT cases in Ontario, Canada. By leveraging a comprehensive set of administrative claims data from the country’s most populous province, we provide a robust overview of the RTT disease journey. Although administrative claims data have different considerations, their inclusion of all individuals covered by public health insurance enables a population-based perspective—addressing a key knowledge gap in Canadian literature. Findings from this study highlight the high burden of illness of RTT, particularly in terms of comorbidity prevalence and HCRU, including the reliance on medications for the short-term management of symptoms, when descriptively compared with the general population and other neurological conditions. Together, our findings underscore the urgent need for treatment options that improve clinical management of the multiple multisystem symptoms and comorbidities that affect patients with RTT. Further longitudinal research should explore epidemiological trends, treatment patterns – including the use of novel therapies – and the broader impact of RTT on HCRU and healthcare costs to identify opportunities to improve healthcare outcomes in this population.
Acknowledgements
This study made use of de-identified data from the ICES Data Repository, which is managed by the ICES with support from its funders and partners: Canada’s Strategy for Patient-Oriented Research (SPOR), the Ontario SPOR Support Unit, the Canadian Institutes of Health Research and the Government of Ontario. The opinions, results and conclusions reported are those of the authors. No endorsement by ICES or any of its funders or partners is intended or should be inferred.
Author contributions
All authors contributed to the study design and participated in the interpretation of results. JM, LNLS and CSN drafted the manuscript, and all authors revised it critically for important intellectual content. All the authors approved the final version of the manuscript to be published and agreed to be accountable for all aspects of the work.
Funding statement
This study was funded by Acadia Pharmaceuticals Inc.
Competing interests
The author(s) declared the following potential conflicts of interest with respect to the research, authorship, and/or publication of this article: Sunita Bond is an employee of Acadia Pharmaceuticals Inc. Anita N. Datta, Mubeen F. Rafay, Laura McAdam, and Elsa Rossignol have served as advisors/consultants to Acadia Pharmaceuticals Inc. Jillian Murray, Lorelai N. Loreto Sanchez and Calum S. Neish are employees of IQVIA Solutions Canada Inc. IQVIA is a contract research organization that received consulting fees from Acadia Pharmaceuticals Inc.


 Open access