As of 2015, among 1885 million overweight and obese adults worldwide, 1427 million (76 %) were found in low- and middle-income countries( 1 ). While interest in obesity in these countries is increasing, one limitation of many such studies is that they relied on data from the Demographic and Health Surveys, which have routinely measured women and children, but not men, since they are often the only source of population-representative data( Reference Popkin, Adair and Ng 2 ). However, obesity distribution patterns are known to differ by sex and age due to biological and sociocultural differences( Reference Kanter and Caballero 3 ), and therefore patterns observed among women of reproductive age do not necessarily reflect those of the entire population( Reference Popkin, Adair and Ng 2 ).
A second limitation of previous studies is that they relied on mean BMI and prevalence of overweight and obesity to describe historical and future trends of obesity. Whereas these indicators provide a convenient way to capture overall features of the obesity situation, a single parameter may not explain the complex movement of BMI distributions. Disproportional change in BMI distributions, with the higher end of BMI distributions increasing more rapidly, has been reported from the USA and the UK( Reference Hill, Wyatt and Reed 4 – Reference Krishna, Razak and Lebel 9 ) and low- and middle-income countries( Reference Razak, Corsi and Subramanian 10 ). In order to handle skewed distributions of BMI and their disproportional changes more appropriately and explicitly, use of the log-normal distribution( Reference Penman and Johnson 11 , Reference Barendregt and Veerman 12 ) and the Box–Cox power exponential (BCPE) distribution( Reference Majer, Mackenbach and van Baal 13 ) was suggested. The BCPE distribution had better fit to the BMI distributions( Reference Majer, Mackenbach and van Baal 13 , Reference Rigby and Stasinopoulos 14 ) and it was also used to construct international child growth standard curves for weight, length/height and BMI( 15 ).
In this context, our study attempted to describe patterns and trends of BMI distributions using nationally representative surveys including both men and women. We modelled the entire BMI distributions to capture a more accurate picture and trends of the obesity situations. Some Latin American countries implement national health surveys targeting their entire populations beyond the issues of maternal and child health, and we selected three countries for the present study.
Methods
Data sources
Data at two time points from nationally representative health and nutritional household surveys conducted between 2005 and 2013 in Mexico, Colombia and Peru were used. They were: National Health and Nutritional Survey (ENSANUT in Spanish acronym) 2006( Reference Olaiz-Fernández, Rivera-Dommarco and Shamah-Levy 16 – 18 ) and 2012( Reference Gutiérrez, Rivera-Dommarco and Shamah-Levy 19 , 20 ) in Mexico; Demographic and Health Survey/Nutritional Situation National Household Surveys (ENDS/ENSIN) 2005( 21 , 22 ) and 2010( 23 , 24 ) in Colombia; and National Household Survey, Module for Monitoring of Nutritional Indicators (ENAHO-MONIN) 2007–08( 25 – 28 ) and Nutritional Indicator Surveillance (VIN) 2012–13( 29 – 31 ) in Peru.
All adults aged 20–69 years were included, but women who were pregnant or whose records did not have information on pregnancy status were excluded. BMI was used as an indicator to measure overweight and obesity.
BMI was assumed to follow a BCPE distribution, which consists of four parameters, μ, σ, ν and τ, that can be interpreted as relating to location, scale, skewness and kurtosis, respectively( Reference Rigby and Stasinopoulos 14 ). To verify its goodness-of-fit, the BCPE distribution, as well as the log-normal and normal distributions, were fitted and compared with the actual BMI distributions. Then, to estimate the year- and age-specific BMI distributions, each of these parameters of the BCPE distribution was modelled as a function of age, calendar time and their interaction terms using a regression model called the generalized additive model for location, scale and shape (GAMLSS)( Reference Rigby and Stasinopoulos 32 ). The model was applied separately for each country and sex using the following equations:
 $$BMI\,\sim\,BCPE(\mu ,\sigma ,\nu ,\tau ),$$
 $$\mu {\equals}\mathop{\sum}\limits_k {\left[ {{}^{\mu }\beta _{{1k}} age_{k} {\plus}{}^{\mu }\beta _{{2k}} \left( {age_{k} {\times}time} \right)} \right]} ,$$
 $$\log \sigma {\equals}\mathop{\sum}\limits_k {\left[ {{}^{\sigma }\beta _{{1k}} age_{k} {\plus}{}^{\sigma }\beta _{{2k}} \left( {age_{k} {\times}time} \right)} \right]} ,$$
 $$\nu {\equals}\mathop{\sum}\limits_k {\left[ {{}^{\nu }\beta _{{1k}} age_{k} {\plus}{}^{\nu }\beta _{{2k}} \left( {age_{k} {\times}time} \right)} \right]} $$
and
 $$\log \tau {\equals}\mathop{\sum}\limits_k {\left[ {{}^{\tau }\beta _{{1k}} age_{k} {\plus}{}^{\tau }\beta _{{2k}} \left( {age_{k} {\times}time} \right)} \right]} ,$$
where:
age k is the indicator variable for the age group k (20–24, 25–29, …, or 65–69 years);
time is the continuous variable for calendar time centred at 1 July 2010; ${}^{\theta}\beta _{{1k}} $
is the coefficient for the age group k for the parameter
${}^{\theta}\beta _{{1k}} $
is the coefficient for the age group k for the parameter $\theta{\equals}\mu ,\sigma ,\nu \,{\rm or}\,\tau $
; and
$\theta{\equals}\mu ,\sigma ,\nu \,{\rm or}\,\tau $
; and ${}^{\theta}\beta _{{2k}} $
is the coefficient for the interaction between the age group k and calendar time for the parameter θ.
${}^{\theta}\beta _{{2k}} $
is the coefficient for the interaction between the age group k and calendar time for the parameter θ.
After fitting the model, the values of four BCPE parameters were estimated for each combination of year (2005 or 2010) and age group, and then estimated BMI distribution curves (i.e. density functions of BCPE distribution) were constructed. To quantify the estimated BMI distributions, the prevalence of four BMI categories was calculated from the estimated cumulative density function( Reference Majer, Mackenbach and van Baal 13 ).
Sampling weights and clustering within primary sampling units were incorporated in all analyses. To estimate variances accounting for clustering at the sampling unit level, 2000 bootstrap samples were generated and used. A bootstrap sample was obtained by sampling $\left( {n_{h} {\minus}1} \right)$
primary sampling units with replacement per stratum for all strata, where n
h
is the number of primary sampling units in the stratum h
(
Reference Kolenikov
33
). R version 3.2.2 was used to implement GAMLSS regression and the statistical software package Stata version 14.1 was used for the rest of the analyses. See the online supplementary material, Supplemental File 1 for a detailed explanation of data sources and estimation methods.
$\left( {n_{h} {\minus}1} \right)$
primary sampling units with replacement per stratum for all strata, where n
h
is the number of primary sampling units in the stratum h
(
Reference Kolenikov
33
). R version 3.2.2 was used to implement GAMLSS regression and the statistical software package Stata version 14.1 was used for the rest of the analyses. See the online supplementary material, Supplemental File 1 for a detailed explanation of data sources and estimation methods.
Results
Final sample sizes were 64 413 for Mexico, 144 628 for Colombia and 36 082 for Peru (see online supplementary material, Supplemental Table 1). The BCPE distribution fitted the BMI data better than the normal and log-normal distributions, especially at the higher end of the distributions (Fig. 1).
An example from Mexican men aged 20–24 and 30–34 years in the 2012 survey: (a) histograms of observed BMI distributions and estimated BMI density curves with the Box–Cox power exponential (BCPE), log-normal and normal distributions; (b) quantile–quantile plots from the BCPE, log-normal and normal distributions. Vertical and horizontal dashed lines show the cut-offs for BMI categories of underweight, normal, overweight and obesity

Estimated BMI distributions for year 2010
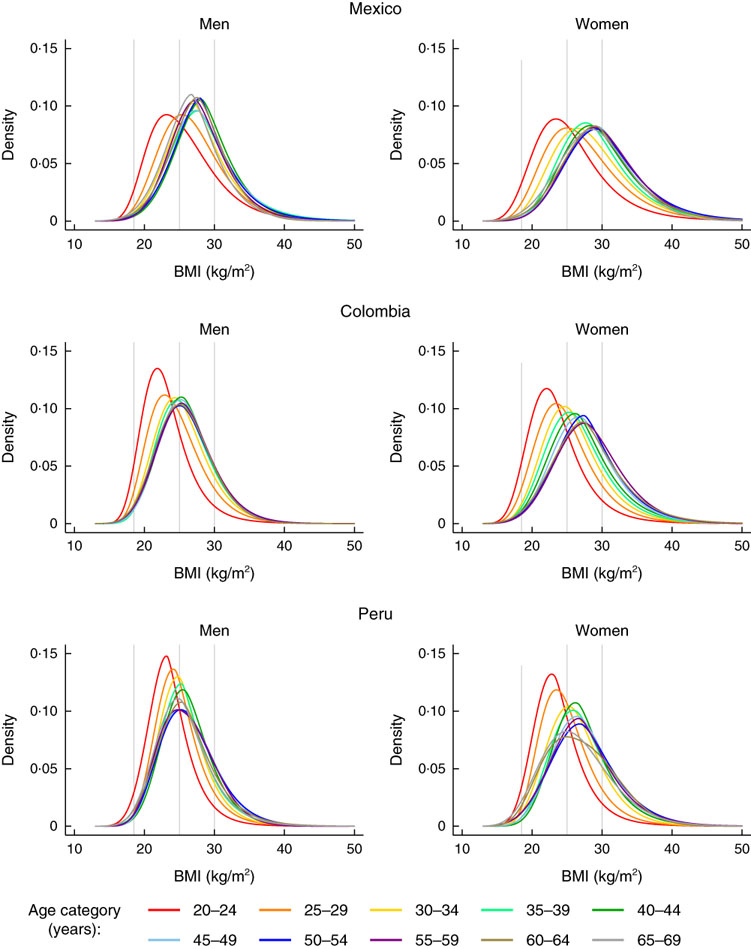
Across the three countries in 2010, BMI was distributed wider and located at higher levels at all ages in women as compared with men (Fig. 2). BMI distributions shifted upward and became wider by increasing age; this trend continued until age about mid-to-late 30s in men and about mid-to-late 40s in women. BMI was distributed similarly in men and women aged 20–24 years in Mexico, whereas women’s BMI was higher in Colombia and Peru. Overweight and obesity prevalence was at the highest about age 40s in men and about age 50s in women (see online supplementary material, Supplemental Fig. 1).
Estimated BMI distributions by age for year 2010. Vertical lines show the cut-offs for BMI categories of underweight, normal, overweight and obesity

As an example of interpretation: in Mexico, in men, the lower end of the BMI distribution curve moved upward with age until the early 30s whereas the upper end did not move much (Fig. 2, top left). By contrast, in women, the entire distribution shifted upward by age until the early 40s (Fig. 2, top right). In other words, for adult men with normal or lower BMI, moving up one age category was associated with a larger increase in BMI relative to the analogous change for men with higher BMI until the early 30s, whereas older (v. younger) women at all places in the BMI distribution tended to have higher BMI until the 40s.
Estimated differences in BMI distributions between 2005 and 2010
The most notable age and sex differences in BMI distribution were observed in Peru (Fig. 3; results for Mexico and Colombia are shown in the online supplementary material, Supplemental Figs 2 and 3). In men, the distributions shifted upward in almost all age groups; in other words, men generally increased their BMI between 2005 and 2010. In women, increases in the higher end of the BMI distribution were observed below age 30 years, and shifts of the entire distributions were observed about age 30 years and over.
Estimated BMI distributions by age for years 2005 and 2010, Peru. Vertical lines show the cut-offs for BMI categories of underweight, normal, overweight and obesity. P values (from 4-df Wald tests) indicate difference in distributions between years 2005 and 2010. The null hypothesis is ${}^{\mu }\beta _{{2k}} {\equals}0,{\rm }{}^{\sigma }\beta _{{2k}} {\equals}0,{\rm }{}^{\nu }\beta _{{2k}} {\equals}0,{\rm }{}^{\tau }\beta _{{2k}} {\equals}0,$
where
${}^{\mu }\beta _{{2k}} {\equals}0,{\rm }{}^{\sigma }\beta _{{2k}} {\equals}0,{\rm }{}^{\nu }\beta _{{2k}} {\equals}0,{\rm }{}^{\tau }\beta _{{2k}} {\equals}0,$
where ${}^{\theta}\beta _{{2k}} $
is the coefficient for the interaction term between age group k and time for the parameter
${}^{\theta}\beta _{{2k}} $
is the coefficient for the interaction term between age group k and time for the parameter $\theta{\equals}\left {\mu ,\sigma,{\nu } \,{\rm or}\,\, \tau } \right$

Across the three countries, overweight and obesity prevalence increased between year 2005 and 2010 in young- to middle-aged adults aged 25–49 years, with differences in size by country and sex (see online supplementary material, Supplemental Fig. 4). Men generally had faster increases in overweight and obesity prevalence than women, notably in Peru, but not in Colombia. The highest increase in overweight and obesity prevalence was observed among Peruvian men of 35–39 years, with a 5-year increase of 21 (95 % CI 12, 30) percentage points as compared with 12 (95 % CI 7, 17) percentage points in women of the same age group.
Discussion
We examined trends in the distributions of BMI for men and women in three Latin American countries. We found that BMI distributions were wider among women than men and that women were generally with higher BMI at almost all ages, more notably in middle age or above. By contrast, the rate of increase in overweight and obesity was higher in men than women, notably in Peru.
While WHO set a global target ‘halt the rise in obesity’ in its action plan for non-communicable diseases( 34 ), obesity continued to increase in the assessed countries and time period. Increases in BMI among young and middle-aged adults and high values of BMI among middle-aged populations create challenges to health-care systems. Increases of overweight and obesity imply increases of obesity-related diseases, which will be accentuated by prolonged life expectancy. Financial burdens for individuals and health systems could increase enormously due to the continuous health-care services that will be required. Since chronic diseases cannot be cured instantly, early mitigation of overweight and obesity problems and forward-thinking preparation are necessary to attempt to prevent further increases in overweight and obesity prevalence.
Obesity-related policies and programmes have been developed and implemented actively in various Latin American countries( Reference Pratt, Charvel Orozco and Hernandez-Avila 35 – Reference Kline, Jones-Smith and Jaime Miranda 38 ), and differences in BMI distribution and its changes by sex and age could be considered in tailoring such policies and programmes if and where appropriate. Assessments of BMI distributions at a specific time identify sub-populations that are currently affected, who would need curative or secondary prevention against the development of obesity-associated diseases. Assessments of rates of change in BMI distributions identify those who are becoming more affected, who would need preventive strategies to minimize the increase of overweight and obesity.
The BCPE distribution provided a better fit for the BMI data of the three countries than the normal and log-normal distributions at the higher ends of BMI distribution. This result was similar to those reported with Dutch adult data( Reference Majer, Mackenbach and van Baal 13 ). Thus the flexible model using the BCPE–GAMLSS method has the benefit of not only incorporating the location and the scale of the distribution but also its shape (skewness and kurtosis)( Reference Majer, Mackenbach and van Baal 13 ). To the best of our knowledge, our study is the first attempt to apply the BCPE–GAMLSS method for survey data considering both sampling weights and clustering. Our approach should be applicable to other countries that have population survey data with anthropometric measurements.
Whether this advanced methodology for modelling BMI distributions is necessary should depend on the purpose of analysis. For policy makers attempting to know the status of or trends in obesity in their jurisdictions, comparison of histograms over years and simple statistics will likely suffice. On the other hand, regression analysis provides several advantages that include provision of uncertainty around the estimates, statistical comparison across sub-populations and estimation for time points when data are not available. For health planners and researchers planning or evaluating interventions, or assessing the causes of obesity, the benefits of this advanced methodology and its precise fit to the data could warrant its use.
As compared with other statistical methods, such as linear and logistic regression for mean BMI and overweight/obesity prevalence, or quartile regression for BMI percentiles, one major advantage of the BCPE–GAMLSS method is that we can assess obesity in a detailed manner visually. Another advantage is that only one model is necessary to estimate both BMI distributions and BMI-related indicators. Use of multiple models sometimes provides inconsistent results. However, use of the BCPE–GAMLSS method could require additional statistical knowledge. Computational time may be another issue for bootstrapping-based variance estimation.
Study limitations are as follows. First, the findings are based on cross-sectional studies, and the association patterns we observed between age and BMI distributions consist of age, cohort and period effects. Second, the 5-year interval is a relatively short period of time for observing population trends in BMI. Third, the interpretation should be handled with caution, especially for men, since their response rates were low in some surveys (e.g. 61 % among men in the 2005 Colombian survey). Further analyses are necessary at the country level to identify determinants of observed differences as well as whether trends differ by geographical areas and socio-economic status.
Conclusion
The BCPE–GAMLSS method is an alternative to analyse measurements with time-varying distributions visually, in addition to conventional indicators such as means and prevalences. Whereas women had more right-shifted and wider BMI distributions than men across the three assessed countries in 2010, men generally experienced more rapid increases in BMI between 2005 and 2010. Consideration of differences in BMI distributions across age groups and sex would provide vital information to reach target populations effectively. Increases in BMI portend increases of obesity-associated diseases, for which preventive and preparative actions are urgent.
Acknowledgements
Acknowledgements: The authors would like to thank Dr Teresa Shamah-Levy and her colleagues at National Institute of Public Health, Mexico, and Dr Jaime Miranda and Dr Rodrigo Carrillo-Larco at Universidad Peruana Cayetano Heredia, Peru, for providing information about survey methods used in conducting national health and nutritional surveys. Financial support: This research received no specific grant from any funding agency in the public, commercial or not-for-profit sectors. Conflict of interest: None. Authorship: G.Y. formulated the research question, designed the study, carried out data analysis and prepared the first draft of the manuscript. C.C.-S. and J.C.J.-S. provided intellectual guidance and inputs in formulating the research question, designing the study, interpreting results and writing the manuscript. L.H.M. supervised the entire procedure and provided intellectual inputs at each step of the study. Ethics of human subject participation: This study was reviewed by the Johns Hopkins Bloomberg School of Public Health Institutional Review Board. The study was secondary analyses of existing, de-identified data and de-linked databases, and was determined to be exempt. Thus, continuing review of this study as human subjects research was unnecessary.
Supplementary material
To view supplementary material for this article, please visit https://doi.org/10.1017/S1368980018002343