- IDF criteria
International Diabetes Federation (2005)
- LC
long-chain
- MetS
metabolic syndrome
- NCEP criteria
National Cholesterol Education Program Adult Treatment Panel III (NCEP ATPIII) (2001)
- T2D
type 2 diabetes
- WHO criteria
World Health Organization (1999)
Disease risk in ethnic minorities
In the UK CVD is the principal cause of mortality in the general population, accounting for >110 000 deaths in England each year. Annually >1 400 000 individuals suffer from angina and 275 000 individuals have heart attacks (Department of Health, 2007). Nevertheless, the prevalence of CVD is not uniform within subpopulation groups. Evidence suggests that following migration to Western societies South Asians have a higher rate of CVD compared with the indigenous Caucasian population and, although CVD mortality is falling in the general population, the rate of reduction is greater in the Caucasian population compared with the South Asian population (Yeolekar, Reference Yeolekar1998). Current CVD rates among South Asian males and females are higher than those for the general population (Fig. 1(a); Department of Health, 2005). These data indicate that the prevalence of CVD varies among South Asians, with important differences between Pakistanis, Bangladeshis and Indians. The distribution of CVD risk factors between subpopulations has also been investigated. For most risk factors Bangladeshis, notably men, fare the worst, with the highest levels of smoking, plasma TAG and glucose, and the lowest HDL-cholesterol, but also the lowest rate of hypertension (Bhopal & Sengupta-Wiebe, Reference Bhopal and Sengupta-Wiebe2000). These differences between ethnic subgroups may lead to the inaccurate assessment of CVD risk and prevalence in Asians compared with the general population.
Prevalence (%) of (a) IHD or stroke and (b) doctor-diagnosed type 2 diabetes within ethnic group and gender (age 55+ years). ( ), Men; (□), women. (Data from Health Survey for England, 2004: Health of ethnic minorities; Department of Health, 2005.)

Risk factors in ethnic minorities in relation to CVD
Traditional risk factors for CVD, such as hypertension, hypercholesterolaemia and cigarette smoking, cannot account for the increased mortality rates observed for South Asians, since these factors are no higher than those for Caucasians (Miller et al. Reference Miller, Beckles, Maude, Carson, Alexis, Price and Byam1989; Bhopal & Sengupta-Wiebe, Reference Bhopal and Sengupta-Wiebe2000; Raji et al. Reference Raji, Seely, Arky and Simonson2001; Lovegrove et al. Reference Lovegrove, Brady, Lesauvage, Lovegrove, Minihane and Williams2003, Reference Lovegrove, Lovegrove, Lesauvage, Brady, Saini, Minihane and Williams2004). The Health Survey for England 2004: Health of Ethnic Minorities (Department of Health, 2005) has identified that South Asian men and women are three times more likely to develop type 2 diabetes (T2D) than the general population (Fig. 1(b)). T2D increases the risk of death from heart disease and also magnifies the effects of other risk factors, such as smoking, blood pressure, elevated cholesterol concentrations and obesity. T2D increases the risk of CVD by 2–4-fold in men but by 3–5-fold in women. Approximately 3% of men and women in the UK have diagnosed T2D, equating to approximately 1·4 million individuals (Department of Health, 2005). Although the prevalence of generalised obesity is lower in most South Asians than in the general population, higher levels of central obesity have been observed in this ethnic group, with 36% of Indian men, 37% of Pakinstani men and 32% of Bangladeshi men considered centrally obese compared with 33% of men in the general population. This finding is even more apparent in Asian women with 30% of Indian women, 39% of Pakinstani women and 50% of Bangladeshi women considered centrally obese compared with only 30% of women from the general population (Department of Health, 2005).
In addition to anthropometric differences between ethnic groups, numerous studies (Bhopal & Sengupta-Wiebe, Reference Bhopal and Sengupta-Wiebe2000; Zoratti et al. Reference Zoratti, Godsland, Chaturvedi, Crook, Stevenson and McKeigue2000; Raji et al. Reference Raji, Seely, Arky and Simonson2001; Lear et al. Reference Lear, Toma, Birmingham and Frohlich2003; Lovegrove et al. Reference Lovegrove, Brady, Lesauvage, Lovegrove, Minihane and Williams2003, Reference Lovegrove, Lovegrove, Lesauvage, Brady, Saini, Minihane and Williams2004; Brady et al. Reference Brady, Gower, Lovegrove, Williams and Lovegrove2004; Carr et al. Reference Carr, Utzschneider, Hull, Kodama, Retzlaff, Brunzell, Shofer, Fish, Knopp and Kahn2004) have reported higher levels of plasma TAG, insulin resistance, C-reactive protein, plasminogen activator inhibitor-1 and lipoprotein (a) and lower levels of HDL-cholesterol for ethnic groups living in the UK who originate from the Indian subcontinent when compared with white Caucasians. These measures are all characteristics of the metabolic syndrome (MetS) that may contribute to increased CVD mortality rates observed among South Asians.
The term MetS refers to a clustering of specific CVD risk factors, the underlying metabolic origin of which is believed to be insulin resistance as a consequence of central obesity (Carr et al. Reference Carr, Utzschneider, Hull, Kodama, Retzlaff, Brunzell, Shofer, Fish, Knopp and Kahn2004; Reaven, Reference Reaven2004), which confers increased risk of T2D and CVD (Lakka et al. Reference Lakka, Laaksonen, Lakka, Niskanen, Kumpusalo, Tuomilehto and Salonen2002; Ninomiya et al. Reference Ninomiya, L'Italien, Criqui, Whyte, Gamst and Chen2004; Grundy et al. Reference Grundy, Cleeman, Daniels, Donato, Eckel and Franklin2005). The concept of an insulin resistance syndrome was first introduced by Reaven (Reference Reaven1988) and, although contentious, is still used in clinical practice. There is no single universally-accepted definition of the MetS. The four major accepted definitions of the MetS (detailed in Table 1) are: World Health Organization (1999; WHO criteria); European Group for the Study of Insulin Resistance (Balkau & Charles, Reference Balkau and Charles1999); National Cholesterol Education Program Adult Treatment Panel III (NCEP ATPIII) (2001; NCEP criteria); International Diabetes Federation (2005; IDF criteria). While these definitions have five key features in common, three or more of which must be present to be classified as having MetS, i.e. impaired glucose homeostasis, adiposity, dyslipidaemia (elevated plasma TAG, low plasma HDL-cholesterol) and hypertension, the defining cut-off values differ between definitions. This variation confounds attempts to make comparisons between studies. Moreover, there is debate as to whether the MetS exists as a true ‘syndrome’ and uncertainty as to its clinical utility in assessing CVD risk (Kahn et al. Reference Kahn, Buse, Ferrannini and Stern2005). However, despite this controversy the MetS is recognised routinely in both clinical and research settings, and specific treatments for its cardio-metabolic risk are actively being sought.
Definitions of the metabolic syndrome

WHO, World Health Organization (1999); EGIR, European Group for the Study of Insulin Resistance (Balkau & Charles, Reference Balkau and Charles1999); NCEP, National Cholesterol Education Program Adult Treatment Panel III (NCEP ATPIII) (2001); IDF, International Diabetic Federation (2005); WHR, waist:hip ratio.
* The recent American Diabetes Association impaired fasting glucose criteria (Genuth et al. Reference Genuth, Alberti, Bennett, Buse, Defronzo and Kahn2003).
Prevalence of the metabolic syndrome in ethnic groups
Published definitions of the MetS are based on risk factors that contribute to the development and progression of CVD. Studies that have compared the prevalence of the MetS using the various definitions have found differences within populations (Anand et al. Reference Anand, Yi, Gerstein, Lonn, Jacobs, Vuksan, Teo, Davis, Montague and Yusuf2003; Ford & Giles, Reference Ford and Giles2003; Tillin et al. Reference Tillin, Forouhi, Johnston, McKeigue, Chaturvedi and Godsland2005; The DECODA Study Group, 2006). Less variation has been found within European groups as compared with ethnic groups. This finding is perhaps not surprising, given that the individual components within the various criteria were originally based on findings from predominantly white Caucasian populations. Tillin et al. (Reference Tillin, Forouhi, Johnston, McKeigue, Chaturvedi and Godsland2005) have reported relatively consistent estimations of the prevalence of the MetS defined by the NCEP criteria and WHO criteria in European populations, with men being more consistently defined by each definition than women (Fig. 2(a,b)). However, the NCEP criteria were found to identify a lower prevalence of the MetS in South Asians and African-Caribbean men than the WHO criteria, while both definitions produce similar values for the prevalence of MetS in women from these two ethic groups (Tillin et al. Reference Tillin, Forouhi, Johnston, McKeigue, Chaturvedi and Godsland2005). A possible explanation for these observed differences between ethnic groups compared with Caucasians lies in the greater influence of central adiposity and impaired glucose homeostasis in the WHO criteria. The latter includes the identification of impaired glucose homeostasis on the basis of insulin resistance, impaired fasting glucose, impaired glucose tolerance and T2D. In the NCEP criteria only impaired fasting glucose is required, and those individuals with T2D or glucose intolerance who have normal glucose levels can be overlooked. When the newly-published IDF criteria were compared with the NCEP criteria in Asian populations it was found that the IDF criteria detect a consistently higher prevalence of MetS in all ethnic groups (The DECODA Study Group, 2006).
Prevalence of metabolic syndrome within ethnic group and gender using (a) National Cholesterol Education Program Adult Treatment Panel III (NCEP ATPIII) (2001) criteria and (b) World Health Organization (1999) criteria. (), Men; (□), women. (Adapted from Tillin et al. Reference Tillin, Forouhi, Johnston, McKeigue, Chaturvedi and Godsland2005.)

In addition to a clear lack of consistency in the performance of the published definitions for MetS, another serious concern is the relative contribution of the specific components of the MetS to CVD risk in different ethnic populations. Results from the US National Health and Nutrition Study (Ford & Giles, Reference Ford and Giles2003) show that that there is a greater discordance between the WHO and NCEP criteria in non-European populations. This finding is supported by those of Tillin et al. (Reference Tillin, Forouhi, Johnston, McKeigue, Chaturvedi and Godsland2005), who have shown stronger associations between MetS and the prevalence of CVD in European and South Asian men, but not women and for the NCEP criteria only in European women. There has been extensive validation of the MetS definitions in European populations with reference to prediction of incident CVD and T2D (Lakka et al. Reference Lakka, Laaksonen, Lakka, Niskanen, Kumpusalo, Tuomilehto and Salonen2002; Bonora et al. Reference Bonora, Kiechl, Willeit, Oberhollenzer, Egger, Bonadonna and Muggeo2003; Sattar et al. Reference Sattar, Gaw, Scherbakova, Ford, O'Reilly, Haffner, Isles, Macfarlane, Packard, Cobbe and Shepherd2003; Hu et al. Reference Hu, Qiao, Tuomilehto, Balkau, Borch-Johnsen and Pyorala2004; Hunt et al. Reference Hunt, Resendez, Williams, Haffner and Stern2004). In contrast, little attention has been paid to the validation of the components and their cut-off values in other ethnic groups. If appropriate treatment strategies are to be developed and effective, differences in both the prevalence of MetS and its relative contribution to CVD risk in ethnic populations must be further addressed.
Definitions of adiposity and MetS for the identification of ‘at risk’ populations in ethnic groups
In common with the definitions for MetS much of the information relating to the relationship between obesity, and more specifically central adiposity, and risk of MetS has been derived from investigations of populations of primarily European descent. Specific anthropometric targets such as BMI or cut-offs for waist circumference have been employed to identify those at risk and initiate intervention strategies (Lean et al. Reference Lean, Han and Morrison1995; Calle et al. Reference Calle, Thun, Petrelli, Rodriguez and Heath1999). However, there is growing evidence that these targets may not apply to those of non-European descent (Deurenberg-Yap et al. Reference Deurenberg-Yap, Schmidt, van Staveren and Deurenberg2000; Dudeja et al. Reference Dudeja, Misra, Pandey, Devina, Kumar and Vikram2001). There has also been a suggestion that the metabolic consequences of excess body fat in South Asians carries with it a greater risk as compared with those of European descent (Misra et al. Reference Misra, Wasir and Vikram2005). This factor could explain why the relationship between MetS and CVD risk factors is inconsistent between different ethnic groups. The Centers for Disease Control and Prevention Workshop (Seidell et al. Reference Seidell, Kahn, Williamson, Lissner and Valdez2001) has suggested that because of the heterogeneity in the mean levels of measurements of obesity in different populations, the currently recommended cut-off points might not apply to all populations. This panel recommended that BMI and cut-off for waist circumference should be modified for Asian populations and for individuals of Asian ancestry living in Western countries. This approach has been investigated by a number of research groups.
Asian-specific definitions for obesity and adiposity
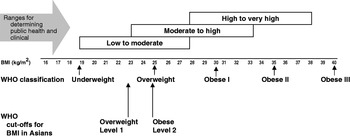
The debate about recommendations for the definition of BMI for determining overweight and obesity in Asian populations and population-specific cut-offs has been addressed by World Health Organization Expert Consultation (2004). The use of BMI cut-off points for classifying overweight and obesity has many uses, all of which are applicable in Asian countries. Examples of usage include: (1) for policy purposes, to inform and trigger policy action; (2) for epidemiological purposes to help ascertain the causes of diseases; (3) clinically to identify high-risk individuals for screening, for absolute risk assessment, to determine type and intensity of treatment and to determine institutional policies for individuals (World Health Organization, 2000). However, it has been recognised for some time that the associations between BMI and its co-morbidities vary between populations, and yet the resistance to the use of modified ethnic-specific cut-offs for BMI in Europe is generally upheld. The reason given for this resistance is that it may increase confusion in health promotion, disease prevention and managing the increasingly multi-cultural societies in Europe (Conroy et al. Reference Conroy, Pyorala, Fitzgerald, Sans, Menotti and De Backer2003). In spite of this resistance there is growing evidence that the use of ethnic-specific cut-off values will be essential for the correct identification of CVD risk in these groups.
There is now consistent evidence that Asian populations, including South Asians, have a higher percentage body fat at a low BMI as compared with Caucasian populations (Deurenberg-Yap et al. Reference Deurenberg-Yap, Schmidt, van Staveren and Deurenberg2000, Reference Deurenberg-Yap, Schmidt, van Staveren, Hautvast and Deurenberg2001b; Deurenberg et al. Reference Deurenberg, Deurenberg-Yap and Guricci2002). This finding has major implications for interpreting the relationship between obesity and CVD risk. Increased insulin resistance and CVD risk have been observed in South Asians when compared with age- and gender-matched Caucasians of a similar BMI (Deurenberg-Yap et al. Reference Deurenberg-Yap, Chew, Lin, Tan, van Staveren and Deurenberg2001a; Yajnik, Reference Yajnik2002). As a consequence, the World Health Organization Expert Consultation (2004) has proposed additional BMI ‘trigger points’ for public health action for many Asian populations, which include ≥23 kg/m2 to represent increased risk and ≥25 kg/m2 to represent high risk (Fig. 3). These values should increase the diagnostic power for identifying ‘at risk’ groups, so that suitable treatments can be implemented at an earlier stage.

The accumulation of visceral (intra-abdominal or centrally distributed) adipose tissue has been shown to be more detrimental, in relation to the metabolic abnormalities found in MetS, than total body fat (Pouliot et al. Reference Pouliot, Despres, Nadeau, Moorjani, Prud'Homme, Lupien, Tremblay and Bouchard1992; Despres et al. Reference Despres, Lemieux, Lamarche, Tremblay and Prud'homme1995; Despres, Reference Despres1997). At the same extent of body fatness, elevated visceral adiposity is associated with increased insulin resistance, elevated plasma TAG, glucose, insulin and lower HDL-cholesterol (Pouliot et al. Reference Pouliot, Despres, Nadeau, Moorjani, Prud'Homme, Lupien, Tremblay and Bouchard1992; Chandalia et al. Reference Chandalia, Abate, Garg, Stray-Gundersen and Grundy1999; Raji et al. Reference Raji, Seely, Arky and Simonson2001; Vikram et al. Reference Vikram, Misra, Dwivedi, Sharma, Pandey, Luthra, Chatterjee, Dhingra, Jailkhani, Talwar and Guleria2003). The fact that these abnormalities are key components of the MetS adds weight to the evidence that MetS arises as a consequence of increased central adiposity. For this reason, the International Diabetes Federation (2005) stipulates that central adiposity should be a core characteristic of the MetS. Comparison of IDF and NCEP criteria has revealed the unadjusted prevalence of MetS to be 39·0 (se 1·1) % and 34·5 (se 0·9) % in all participants respectively (Ford, Reference Ford2005). The IDF criteria, which are based on ethnic-specific thresholds for waist circumference (>94 cm in men and >80 cm in women), have been shown to produce higher estimates of prevalence in all demographic groups, especially Mexican-American men (Ford, Reference Ford2005); unfortunately, Indian-Asians were not identified as a specific group in this study. The DECODA Study Group (2006) has confirmed that the IDF criteria produce a higher prevalence of MetS than the NCEP criteria in all ethnic groups, which included Chinese, Japanese, Mauritian Indians and Native Indians, but not Japanese women, amongst a group of 14 222 subjects without diabetes and 1516 subjects with diabetes. It was also found that lean subjects with hypertension and/or dyslipidaemia are not detected by the IDF criteria, suggesting the need for revised criteria for central adiposity in Japanese populations. Although the prevalence of the MetS as determined by the IDF has not been extensively studied in Indian Asians, it is reasonable to speculate that this definition would identify a higher prevalence in South Asians, purely on the strength of their predisposition to central adiposity.
Asian-specific waist circumference
In addition to ethnic-specific cut-offs for BMI, threshold values for waist circumference in ethnic groups have also been proposed for diagnosing central obesity in Asian groups (Tan et al. Reference Tan, Ma, Wai, Chew and Tai2004). By decreasing the waist circumference cut-off values set in the NCEP criteria from >88 cm to >80 cm in women and from >102 cm to >90 cm in men the crude prevalence of the MetS is increased from 12·2% to 17·9%, with the highest prevalence being found in the South Asians (28·8% in Indian-Asians, 24·2% in Malays and 14·8% in Chinese). It was concluded that the unmodified NCEP criteria would underestimate risk in the Asian population. These observations were extended by modification of the NCEP criteria to include not only the Asian-specific cut-off for waist circumference, but also a BMI cut-off of >23 kg/m2 and a measure of truncal subcutaneous fat (subscapular skinfold thickness >18 mm). The highest prevalence of MetS (29·9%) was observed with the inclusion of all these modifications. The modified NCEP criteria also provide the best set of predictive criteria for MetS in subjects with impaired fasting glucose and T2D (Misra et al. Reference Misra, Wasir and Vikram2005).
Lean et al. (Reference Lean, Han and Morrison1995) have defined two action levels of waist circumferences for the diagnosis of abdominal obesity: action level 1 men>94 cm, women>80 cm; action level 2 men>102 cm, women>88 cm. These action levels have been used as targets for the recommendation to avoid weight gain or lose weight and to maintain increased physical activity (action level 1), or to seek advice from physicians for medically-supervised weight management (action level 2). However, since these cut-off values are based on data derived from white Caucasians, their applicability to other ethnic groups is questionable. Alternative ethnic-specific waist-circumference action levels for the identification of risk in South Asians have been proposed (Misra et al. Reference Misra, Vikram, Gupta, Pandey, Wasir and Gupta2006): action level 1 for men>78 cm, for women>72 cm; action level 2 for men>90 cm, for women>80 cm. Action level 1 identifies those individuals with at least one CVD risk factor and BMI levels of 21–23 kg/m2, whilst action level 2 identifies a high OR for CVD risk factors and BMI levels of 25 kg/m2. This study was the first in South Asians to provide a detailed analysis of waist-circumference cut-off points in relation to multiple cardiovascular risk factors and BMI.
In view of the low applicability of cut-off points for BMI and waist circumference derived from Caucasian populations, it would seem prudent to revise the diagnostic criteria for obesity, abdominal adiposity and MetS in South Asians and other Asian ethnic groups. From the evidence presented herein, it is clear that implementation of the proposed ethnic-specific cut-offs for waist circumference and BMI must be a priority in diagnosing MetS-related CVD risk in future studies on South Asians.
Dietary PUFA and CVD risk
The MetS is a heterogeneous condition, consisting of a cluster of risk factors, some of which are more highly expressed in ethnic groups such as South Asians as compared with age- and gender-matched white Caucasians. While there is irrefutable evidence that weight loss and physical activity, even without a corresponding weight loss, reduce insulin resistance and correct lipid abnormalities (Bays et al. Reference Bays, Blonde and Rosenson2006; Ford & Li, Reference Ford and Li2006), their positive impact in reducing risk from MetS lies beyond the scope of the present review. The remainder of the present article will focus on the influence of dietary fat on risk reduction for MetS and CVD, with specific reference to the role of PUFA.
The type of fat in the diet influences a range of pathophysiological processes involved in CVD, including lipoprotein metabolism, endothelial dysfunction, plaque structure, vascular reactivity, blood pressure, insulin sensitivity and adipose tissue metabolism and topography. In the 40 years since Keys and Hegsted (Hegsted et al. Reference Hegsted, McGandy, Myers and Stare1965; Keys, Reference Keys1965) established a link between SFA and elevated LDL-cholesterol there have been major advances in the understanding of how dietary fats influence CVD.
The principal lipid abnormality in MetS, elevated plasma TAG, is an independent risk factor for CVD (Patsch et al. Reference Patsch, Miesenbock, Hopferwieser, Muhlberger, Knapp, Dunn, Gotto and Patsch1992; Steinberg et al. Reference Steinberg, Chaker, Leaming, Johnson, Brechtel and Baron1996; Alberti & Zimmet, Reference Alberti and Zimmet1998; Austin et al. Reference Austin, Hokanson and Edwards1998). In addition to the direct and potentially adverse effects of TAG-rich lipoproteins on the artery wall, raised plasma TAG also increases the atherogenicity of other lipoproteins, reducing levels of the cardioprotective HDL and increasing the proportion of small, dense LDL, all of which are associated with CVD risk and MetS (Griffin, Reference Griffin1999). These lipid abnormalities can be corrected by a dietary-induced reduction of plasma TAG and most notably by long-chain (LC) n-3 PUFA.
There is increasing evidence that high intakes of LC n-3 PUFA in fish oil confer protection against the risk of CVD and sudden cardiac death (Dyerberg & Bang, Reference Dyerberg and Bang1982; Kromhout et al. Reference Kromhout, Bosschieter and de Lezenne Coulander1985; Burr et al. Reference Burr, Fehily, Gilbert, Rogers, Holliday, Sweetnam, Elwood and Deadman1989; Dolecek, Reference Dolecek1992; GISSI Study Group, 1999; Hu & Willet, Reference Hu and Willet2002). Dietary LC n-3 PUFA have a potent hypotriacylglycerolaemic action at intakes that are achievable from the diet (Schmidt et al. Reference Schmidt, Nielsen, Pedersen, Kornerup and Dyerberg1990; Harris et al. Reference Harris, Windsor and Dujovne1991; Minihane et al. Reference Minihane, Khan, Leigh-Firbank, Talmud, Wright, Murphy, Griffin and Williams2000; Roche & Gibney, Reference Roche and Gibney2000; Brady et al. Reference Brady, Gower, Lovegrove, Williams and Lovegrove2004; Lovegrove et al. Reference Lovegrove, Lovegrove, Lesauvage, Brady, Saini, Minihane and Williams2004), and many other cardioprotective effects, including alteration of the eicosanoid profile, enabling production of less-potent eicosanoids with anti-inflammatory and anti-thrombotic effects and small but significant reductions in blood pressure, platelet aggregation and cardiac arrthymias (Ernst et al. Reference Ernst, Saradeth and Achhammer1991; Connor & Connor, Reference Connor and Connor1997; O'Keefe & Harris, Reference O'Keefe and Harris2000). There is also evidence to suggest that LC n-3 PUFA can affect insulin resistance, although findings in human subjects have been inconclusive. While feeding studies with LC n-3 PUFA in animals have resulted in improvements in insulin sensitivity (Storlien et al. Reference Storlien, Kraegen, Chisholm, Ford, Bruce and Pascoe1987; Somova et al. Reference Somova, Moodley, Channa and Nadar1999), human studies have either shown benefit (Popp-Snijders et al. Reference Popp-Snijders, Schouten, Heine, van der Meer and van der Veen1987; Fasching et al. Reference Fasching, Ratheiser, Waldhausl, Rohac, Osterrode, Nowotny and Vierhapper1991; Feskens et al. Reference Feskens, Bowles and Kromhout1991, Reference Feskens, Virtanen, Rasanen, Tuomilehto, Stengard, Pekkanen, Nissinen and Kromhout1995) or no effect on insulin sensitivity (Toft et al. Reference Toft, Bonaa, Ingebretsen, Nordoy and Jenssen1995; Gustafsson et al. Reference Gustafsson, Ohrvall, Ekstrand and Vessby1998). These data indicate that clarification of the effects of LC n-3 PUFA on insulin sensitivity in human subjects is required.
Dietary LC n-3 PUFA are found predominantly in fatty fish as EPA and DHA. These fatty acids can be synthesised endogenously from the essential fatty acid α-linolenic acid (Fig. 4). The synthesis of LC n-3 and n-6 PUFA from their shorter-chain precursors (α-linolenic acid and linoleic acid respectively) requires the action of elongation and desaturation enzymes that are shared by both the n-6 and n-3 pathways. This effectively means that α-linolenic acid must compete for its conversion to EPA and DHA and has focused considerable attention on the influence of the dietary n-6 PUFA:n-3 PUFA on CVD risk factors (Sprecher, Reference Sprecher2000). In the climate of increasing n-6 PUFA consumption over the past 40 years this relationship could be of importance. Yet the benefit of an n-6 PUFA:n-3 PUFA is contentious and is presently under debate.
Metabolic pathways of n-6 and n-3 essential PUFA metabolism via chain elongation and desaturation. LA, linoleic acid; AA, arachidonic acid; ALNA, α-linolenic acid; , reactions localised in the endoplasmic reticulum; , partial degradative reactions taking place in the peroxisomes. (Adapted from Sprecher, Reference Sprecher2000.)

Over time, LC n-3 PUFA become incorporated into cell membranes (Lovegrove et al. Reference Lovegrove, Brooks, Murphy, Gould and Williams1997, Reference Lovegrove, Lovegrove, Lesauvage, Brady, Saini, Minihane and Williams2004; Minihane et al. Reference Minihane, Brady, Lovegrove, Lesauvage, Williams and Lovegrove2005; Griffin et al. Reference Griffin, Sanders, Davies, Morgan, Millward, Lewis, Slaughter, Cooper, Miller and Griffin2006). The measurement of PUFA within tissues and circulating cells thus provides a very useful measure of dietary status and especially dietary compliance in intervention studies. More recently, the relative proportion of LC n-3 PUFA has been used as a marker of cardiovascular health. The ‘n-3 index’ is a measure of LC n-3 PUFA status in tissues, as determined by the proportion of erythrocyte EPA and DHA relative to total fatty acids, and has been shown to correlate with protection against CVD (Harris & Von Schacky, Reference Harris and Von Schacky2004). Other indices have been proposed, including the n-6 or n-3 highly-unsaturated fatty acids as a percentage of total highly-unsaturated fatty acids (Lands, Reference Lands2003) or α-linolenic acid:EPA+DHA in cells or tissues (Hibbeln et al. Reference Hibbeln, Nieminen, Blasbalg, Riggs and Lands2006). Both these measures have been shown to be correlated with CHD mortality and could prove useful tools for discriminating CVD risk (Lands, Reference Lands2003; Hibbeln et al. Reference Hibbeln, Nieminen, Blasbalg, Riggs and Lands2006).
Long-chain n-3 PUFA status and dietary intake in UK Indian Asian groups
The growing evidence that a low LC n-3 PUFA status is linked to an increased risk of MetS and CVD has sparked considerable interest in the role of these fatty acids in South Asians (Table 2). All studies published to date are supportive of the hypothesis that South Asians have lower LC n-3 PUFA levels (EPA and DHA) and higher n-6 PUFA levels (linoleic acid and arachidonic acid) compared with matched Caucasians (Reddy et al. Reference Reddy, Sanders and Obeid1994; Das, Reference Das1995; Miller et al. Reference Miller, Kotecha, Wilkinson, Wilkes, Stirling, Sanders, Broadhurst, Allison and Meade1988; Lovegrove et al. Reference Lovegrove, Lovegrove, Lesauvage, Brady, Saini, Minihane and Williams2004). Platelet-membrane n-3 PUFA levels were measured as an index of n-3 PUFA status in a group of seventy-two UK Sikhs (Lovegrove et al. Reference Lands2004). 80% of the Sikh subjects were found to have an ‘n-3 index’ of <4·0% as compared with only 48% of age- and gender-matched Caucasians (an ‘n-3 index’ of ≥4% is associated with a reduced risk of CVD; Harris & Von Schacky, Reference Harris and Von Schacky2004). This finding places the Indian Asian group at considerably higher risk of CVD and highlights the need to develop strategies for improving the LC n-3 PUFA status in this group.
Summary of previous studies that have measured fatty acid composition (mg/100 mg total fatty acids) of plasma and membrane phospholipids and compared Caucasians and Indian Asians
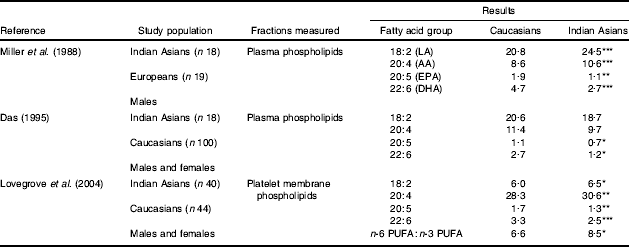
LA, linoleic acid; AA, arachidonic acid.
Mean values were significantly different from those for Caucasians:
*P<0·05
**P<0·01
***P<0·001.
An important question is whether this low LC n-3 PUFA status in South Asians is a result of a lower dietary intake or metabolic incapacity to incorporate, utilise and/or synthesise LC n-3 PUFA. In accord with the ‘n-3 index’ studies differences have been reported in dietary intake of PUFA between South Asians and Caucasians, mainly as increased n-6 PUFA from vegetable oils (McKeigue et al. Reference McKeigue, Marmot, Adelstein, Hunt, Shipley, Butler, Riemersma and Turner1985; Miller et al. Reference Miller, Kotecha, Wilkinson, Wilkes, Stirling, Sanders, Broadhurst, Allison and Meade1988; Lovegrove et al. Reference Lovegrove, Lovegrove, Lesauvage, Brady, Saini, Minihane and Williams2004) in combination with a lower intake of the cardioprotective LC n-3 PUFA in South Asians (Sevak et al. Reference Sevak, McKeigue and Marmot1994; Lovegrove et al. Reference Lovegrove, Lovegrove, Lesauvage, Brady, Saini, Minihane and Williams2004). The lower dietary intake of LC n-3 PUFA alone, or in combination with the high n-6 PUFA intake, could be a viable explanation for the low LC n-3 PUFA status reported in Indian Asian groups, which could be easily addressed. Detailed metabolic studies to examine differences in the handling of LC n-3 PUFA in South Asians have not been performed, and would be required in order to reveal a metabolic deficiency as a possible cause of low LC n-3 PUFA status, although it is now beyond any doubt that low dietary intakes of LC n-3 PUFA are a major contributing factor.
Intervention studies with dietary LC n-3 PUFA in Indian Asian groups
Irrespective of the uncertainty of the cause of a low tissue LC n-3 status in South Asian groups, a dietary increase in EPA and DHA is a simple strategy that could in theory improve the lipid abnormalities associated with this group. As described earlier, dietary LC n-3 PUFA in Caucasian populations have potent hypotriacylglycerolaemic effects (Schmidt et al. Reference Schmidt, Nielsen, Pedersen, Kornerup and Dyerberg1990; Harris et al. Reference Harris, Windsor and Dujovne1991; Minihane et al. Reference Minihane, Khan, Leigh-Firbank, Talmud, Wright, Murphy, Griffin and Williams2000; Roche & Gibney, Reference Roche and Gibney2000). However, investigations into the effects of increased dietary n-3 PUFA in South Asian populations are limited. Table 3 summarises the major studies that have been published to date. Dietary intakes of 1·4 g EPA+DHA/d were found to decrease plasma TAG in a study of 3 weeks duration in a metabolic ward (Indu & Ghafoorunissa, Reference Indu1992). These data are supported by a study (Lovegrove et al. Reference Lovegrove, Lovegrove, Lesauvage, Brady, Saini, Minihane and Williams2004) that has shown reductions in plasma TAG and apo B48 (the lipoprotein associated exclusively with dietary-derived lipids, chylomicrons and their remnants) for free-living UK Sikhs in response to a moderate dose (2·5 g/d) of EPA+DHA over a 12-week period. The plasma TAG concentrations for the UK Sikhs, although higher than those for the matched UK Caucasians at baseline, were found to reach similar concentrations after EPA+DHA supplementation. All subjects studied were found to have an n-3 index of >4% post intervention, which compares with only 20% of UK Sikhs and 52% of UK Caucasians at baseline. In contrast, a study that has investigated two doses of DHA (0·75 and 1·5 g/d) has observed no effects on plasma lipids (Conquer & Holub, Reference Conquer and Holub1998).
Studies that have investigated the effects of long-chain n-3 PUFA supplementation on fasting TAG in Caucasians and South Asian volunteers

MaxEPA, Seven Seas Ltd, Hull, UK.
Despite efforts to resolve the n-6 PUFA:n-3 PUFA issue, debate continues on its relevance to CVD, especially in ethnic groups. To investigate the importance of dietary n-6 PUFA:n-3 PUFA in South Asians, dietary n-6 PUFA:n-3 PUFA of 8 and 18 were compared in a study of UK Sikh men (Minihane et al. Reference Minihane, Brady, Lovegrove, Lesauvage, Williams and Lovegrove2005). The ratio was manipulated by the use of oils and spreads and all other fatty acid and nutrient intakes were maintained. The reduced n-6 PUFA:n-3 PUFA was found to result in only a minimal increase in tissue EPA and DHA levels. These changes were found to be not associated with any significant alterations in lipid or insulin and glucose metabolism and it was concluded that, within the context of a Western diet, it is unlikely that the dietary n-6 PUFA:n-3 PUFA has a major impact on insulin sensitivity or the development of T2D (Minihane et al. Reference Minihane, Brady, Lovegrove, Lesauvage, Williams and Lovegrove2005). In another study (Brady et al. Reference Brady, Gower, Lovegrove, Williams and Lovegrove2004), in which background dietary n-6 PUFA:n-3 PUFA of 9 and 16 were compared in Sikh men, supplementation with moderate LC n-3 PUFA (2·5 g EPA and DHA/d) was found to result in similar lipid-lowering effects. However, there was an unexpected observation that the higher dietary n-6:n-3 PUFA produces greater reductions in plasma TAG and LDL-3 levels. These studies are in accord with the body of literature that suggests that it is the absolute amount of LC n-3 PUFA rather than the n-6 PUFA:n-3 PUFA that is important in CVD risk reduction. The possibility that the dietary n-6 PUFA:n-3 PUFA influences insulin sensitivity and its related metabolic abnormalities has received little support from studies in Caucasians and Asians (Ghafoorunissa, Reference Ghafoorunissa1998; Minihane et al. Reference Minihane, Brady, Lovegrove, Lesauvage, Williams and Lovegrove2005; Griffin et al. Reference Griffin, Sanders, Davies, Morgan, Millward, Lewis, Slaughter, Cooper, Miller and Griffin2006; Sanders et al. Reference Sanders, Lewis, Slaughter, Griffin, Griffin, Davies, Millward, Cooper and Miller2006). To further resolve this issue, a recent workshop held by the Food Standards Agency (Stanley et al. Reference Elsom, Calder, Griffin, Harris, Jebbs, Lovegrove, Moore, Reinersma and Sanders2007) has concluded that the body of scientific evidence is insufficient to support any benefit of the n-6 PUFA:n-3 PUFA over absolute amounts of LC n-3 PUFA in all populations studied.
Conclusions
Many ethnic minorities, including South Asians, have a high prevalence of the MetS, CVD and T2D, which impacts greatly on the morbidity and mortality of these populations. The identification of ‘at risk’ individuals is essential to initiate preventative treatment. However, this process is greatly hindered by the lack of appropriate cut-off values for anthropometric measures. CVD risk has been shown to be higher at a lower BMI in many Asian groups compared with Caucasians and adiposity (particularly central deposition) is higher at similar BMI levels. The definition of adiposity in Asians needs to be firmly established and appropriate lower BMI and waist circumference cut-offs implemented in ethnic subpopulations. Amongst other factors, a low LC n-3 PUFA status has been associated with increased CVD risk, and suitable dietary strategies to increase n-3 PUFA status are required. The value of the n-6 PUFA:n-3 PUFA as a dietary diagnostic tool is questionable, and absolute dietary fatty acid intake is now believed to be of greater importance. South Asians have a low intake of dietary LC n-3 PUFA and poor LC n-3 PUFA tissue status, which can be suitably addressed by increased dietary LC n-3 PUFA intake.
Acknowledgements
Thanks to Louise Brady, who was instrumental in the success of the Sikh intervention studies and Bruce Griffin for his editing of the typescript.