


Optimal nutritional intake is essential in reducing the risk of disease development. As such, the role of diets, specifically foods and nutrients that contribute to CVD and all-cause mortality, has been extensively investigated(Reference Budreviciute, Damiati and Sabir1–Reference Mente, Dehghan and Rangarajan3). CVD is currently the leading cause of death worldwide(4,5) , accounting for approximately 17·9 million deaths annually(5). Poor lifestyle factors and an unhealthy diet are modifiable risk factors that can increase mortality rates(Reference English, Ard and Bailey2,Reference Lichtenstein, Appel and Vadiveloo6–Reference Afshin, Sur and Fay8) . Adopting a healthy diet rich in whole foods while limiting consumption of added sugars, salt and alcohol can decrease CVD(Reference Mente, Dehghan and Rangarajan3,Reference Lichtenstein, Appel and Vadiveloo6,Reference Nestel and Mori9) and all-cause mortality(Reference English, Ard and Bailey2,Reference Aune, Giovannucci and Boffetta10,Reference Schwingshackl, Schwedhelm and Hoffmann11) . Apart from evidence for the role of foods and dietary patterns in CVD and all-cause mortality, it is also necessary to consider the nutrients comprising these diets. Various research studies have found that the distribution and quality of macronutrients play a crucial role in the diet–disease relationship, especially in CVD mortality risk(Reference Santiago, Zazpe and Fernandez-Lazaro12–Reference Ma, Zheng and Zhuang17).
The association of macronutrient type and quality with CVD and all-cause mortality can be investigated in various ways, of which substitution analysis is one such method. This statistical technique ‘mimics’ interventional nutritional studies seeking to investigate optimal macronutrient distribution concerning disease risk. For example, studies using substitution analysis found that a diet high in high-quality carbohydrates (CHO) (i.e. complex CHO) was associated with lower all-cause mortality risk(Reference Zhao, Li and Wang18,Reference Hou, Han and Sun19) . Similar results were found in isoenergetic substitution models when CHO replaced SFA; it was associated with reduced all-cause and CVD mortality(Reference Zhao, Li and Wang18). On the other hand, CHO replaced by plant-based fat was also associated with lower all-cause and CVD mortality(Reference Dehghan, Mente and Zhang16,Reference Zeng, Li and Zhang20) . When replacing different types of fats with various kinds of proteins, research has found that replacing SFA with any protein (total, plant or animal) was associated with a reduced CVD and all-cause mortality rate(Reference Zhao, Li and Wang18,Reference Zheng, Zhu and Yang21,Reference Ho, Gray and Welsh22) . The replacement of SFA with unsaturated fatty acids such as MUFA(Reference Ho, Gray and Welsh22,Reference Ricci, Baumgartner and Zec23) and PUFA(Reference Ricci, Baumgartner and Zec23,Reference Guasch-Ferré, Sanjulian and Babio24) was also associated with reduced CVD and all-cause mortality. Substituting animal proteins with plant proteins was generally found to prolong life expectancy(Reference Zheng, Zhu and Yang21,Reference Budhathoki, Sawada and Iwasaki25,Reference Song, Fung and Hu26) . Collectively, these findings support the consumption of diets high in complex CHO, plant protein and unsaturated fats to mitigate CVD and all-cause mortality. Therefore, the quality and the quantity of macronutrients are particularly relevant to health and mortality outcomes.
However, most of the above-mentioned studies report results based on a Western diet in high-income countries, yet no findings exist on the dietary intakes of populations residing in middle-income countries, such as South Africa (SA). According to Jonah and May(Reference Jonah and May27), the indigenous African population has the highest prevalence of food insecurity in SA. Therefore, they are dependent on staple foods such as cooked maize porridge and starchy grains(Reference Wentzel-Viljoen, Laubscher and Vorster28). Traditional African diets are typically characterised by low-energy, high-fibre, plant-based, Indigenous and whole foods with a lower processed food content(Reference Vorster, Kruger and Margetts29–Reference Popkin32). On the other hand, the Western diet is known for refined CHO, large amounts of added sugars, high fat (SFA, trans fats and PUFA), significant amounts of protein and low fibre intake(Reference Rakhra, Galappaththy and Bulchandani33–Reference Clemente-Suárez, Beltrán-Velasco and Redondo-Flórez35). In the SA context, traditional intakes are more frequently observed in rural communities, whereas urban communities tend to follow more Western diet patterns as a result of the ongoing health transition associated with urbanisation(Reference Wentzel-Viljoen, Lee and Laubscher36). The association between macronutrient distribution and CVD and all-cause mortality in African population groups, in the context of food insecurity, dependency on staple foods and African dietary patterns have yet to be investigated.
Methods
Study design, setting and population
This cohort investigation of 2010 Black adults represents the North-West Province (NWP), SA arm of the international Prospective Urban and Rural Epidemiology (PURE) study(Reference Teo, Chow and Vaz37). The recruitment and baseline data collection of the PURE-NWP-SA study participants (n 2010; 1006 rural and 1004 urban participants, aged between 30 and 70 years) in 2005 have been published previously(Reference Rautenbach, Nienaber-Rousseau and de Lange-Loots38,Reference Vorster, Kruger and Wentzel-Viljoen39) . All data were collected on the same day for each participant. Any self-reported prior cardiovascular event, acute illness, pregnancy or lactation were exclusion criteria. In addition, mortality data, obtained from the participants’ official death records provided by Statistics South Africa (StatsSA), were collected over 13 years (2005–2018)(Reference Ricci, Kruger and Kruger40). The North-West University Health Research Ethics Committee granted ethics approval (04M10 and NWU-00016-10-A1). All participants provided written informed consent before data collection, and the study complied with the guidelines of the Declaration of Helsinki.
Questionnaire data
The interview-led questionnaires were validated for use in the PURE-NWP-SA population. Data collected included physical activity (adapted BAECKE questionnaire) and personal lifestyle and living conditions (including general demographics, sex, age, smoking habits, alcohol consumption, occupation and education). Food consumption and dietary habits were captured using a validated, country-specific, culture-specific quantitative FFQ with 145 food items. The quantitative FFQ has been developed and validated in this population using 7-d weighted records and biomarkers(Reference MacIntyre, Venter and Vorster41). Portion sizes estimation was done using a food photograph book, food models and household utensils. Sizes were recorded in household measures and converted to gram using standardised tables(Reference Langenhoven, Conradie and Wolmarans42). The foods were coded according to the Medical Research Council (MRC) Food Composition Tables(Reference Wolmarans, Danster and Dalton43), the most comprehensive database for foods consumed in SA to date. The food intake assessment and nutrient analysis procedure has previously been published in more detail(Reference Ferreira, Cronjé and van Zyl44).
Anthropometrical measurements
Anthropometric assessments including weight to the nearest 0·01 kg (Electronic scale, Precision Health Scale, A&D Company), height to the nearest 0·1 cm (Invicta Stadiometer, IP 1465, Invicta, Stadiometer) and hip and waist circumference (Holtain non-stretchable metal tape) were measured following the International Society for the Advancement of Kinanthropometry guidelines(Reference Lohman, Roche and Martorell45).
Blood samples
Fasting blood samples were collected and centrifuged at 2000 × g for 15 min within 30 min after collection and stored at −80°C until analyses. Inflammatory markers (high-sensitivity C-reactive protein (CRP) and gamma-glutamyl transferase (GGT)), serum albumin and blood lipids (TAG, HDL-cholesterol and total cholesterol) were quantified using the Konelab20i™ auto-analyser (Thermo Fischer Scientific). LDL-cholesterol was calculated using the Friedewald–Levy–Fredrickson formula(Reference Friedewald, Levy and Fredrickson46). HbA1c was measured using the D-10 Haemoglobin testing system (Bio-Rad) and fasting glucose with the Vitros DT6011 Chemistry analyser (Ortho-Clinical Diagnostics). The CV for the above-mentioned assays was < 10 %. Blood pressure was measured using the Omron HEM-757 (Omron Healthcare).
Mortality data
Mortality status and cause of death data, as indicated on the participants’ death certificates, were obtained from StatsSA after approval from the North-West Department of Health. A medically qualified general practitioner adjudicated the causes of death according to international classification for diseases 10th revision (ICD-10) codes (WHO, 2004). CVD-related ICD-10 codes (I00–I99) were included when considering CVD mortality.
Statistical analysis
Continuous variables are reported as median and 5th to 95th percentile range and categories as counts and percentages. All statistical analyses were performed using the Cox model, having age as the underlying time variable and 10-year age classes, sex and location (rural or urban) as strata factors. This parametrisation was chosen according to previous results showing the best adherence to the Cox model assumptions(Reference Pieters, Kruger and Kruger47). In addition, Schoenfeld’s analysis of residuals was applied to assess the proportionality of hazards.
A hierarchical adjustment strategy was implemented to investigate potential residual confounding, with results from three different models reported. Following the initial model, a multivariate-adjusted model was performed, having medication use (cholesterol, hypertension, inflammation and type 2 diabetes mellitus medication), baseline human immunodeficiency virus (HIV) status, tuberculosis, hypertension, ever (current and previous) smoking, alcohol use and socio-economic status as covariates. Energy intake was included when analysing tertiles of macronutrient intake. Next, results from a model additionally adjusted for GGT, CRP, total cholesterol, TAG and albumin are reported. Finally, a trend analysis, estimating risks by a 1 sd increase of a given covariate, following Blom’s transformation(Reference Blom48), is presented.
A compositional data approach was implemented using the isoenergetic partition, as well as the substitution model applied to the Cox regression(Reference Ricci, Baumgartner and Zec23,Reference Willett, Howe and Kushi49) . Briefly, the substitution model is based on a re-coding of the variables so that the energy intake by component is computed and rescaled to percentage of total energy (TE). This allows the estimation of the theoretical outcome risk given by the substitution of a certain percentage energy intake of one macronutrient with another, using a 10 % TE substitution for different macronutrients (CHO, protein and fat). A 5 % TE substitution was made when the analysis was done on different types of fat (MUFA, PUFA and SFA), CHO (complex CHO (total CHO – total sugar) v added sugar (granulated sugar, soft drinks, confectionery)) and protein (animal v plant protein). The partition model, on the other hand, estimates the theoretical outcome risk given by the increase of a certain macronutrient intake when the intake of all other macronutrients remains constant. In this model, the macronutrients (CHO, protein and fat) were increased by 200 kcal, respectively, while fat (MUFA, PUFA and SFA), CHO (complex CHO and added sugar) and protein (animal and plant protein) were increased by 100 kcal respectively.
All statistical tests were two-tailed, and the type I error was set to 5 % (α = 0·05). The statistical analyses were performed using SAS (version 9.4).
Results
Participant characteristics
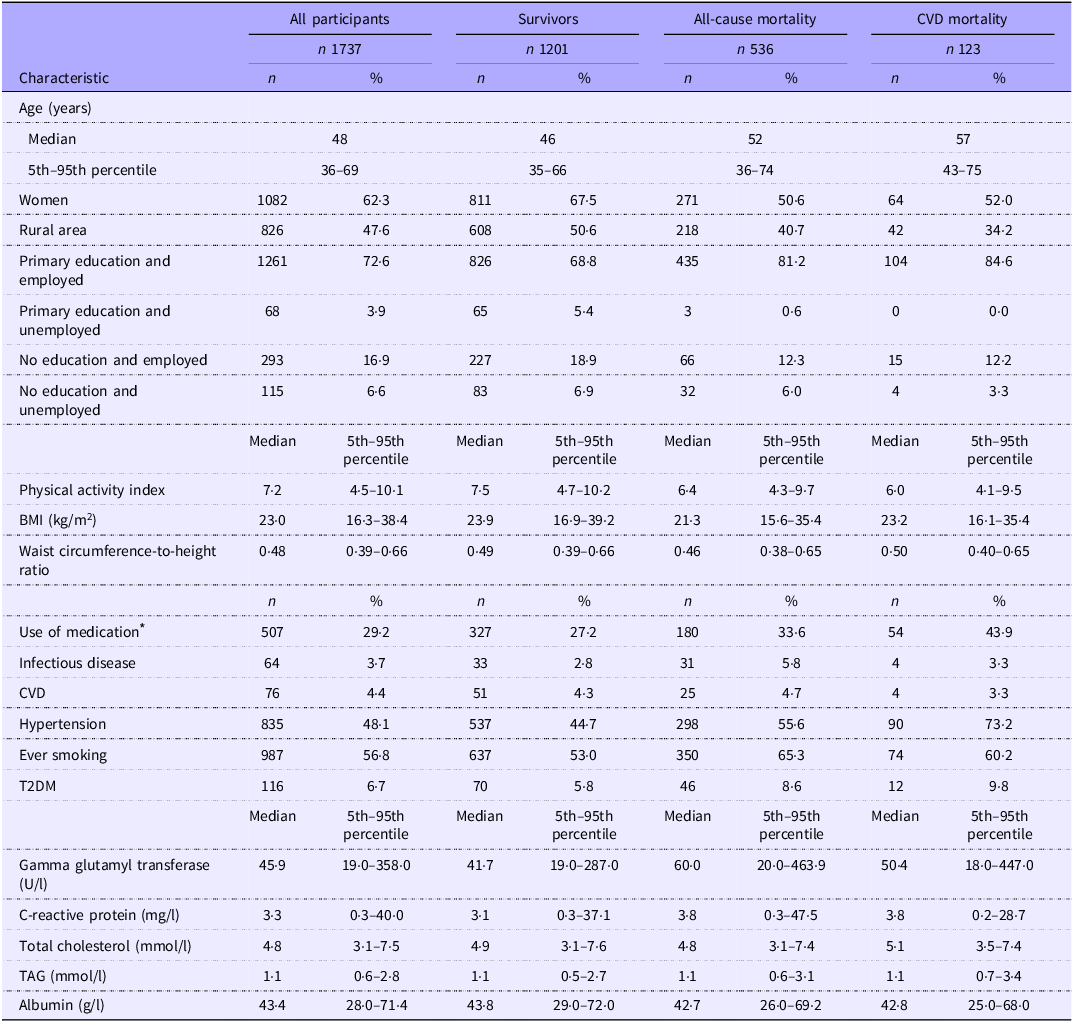
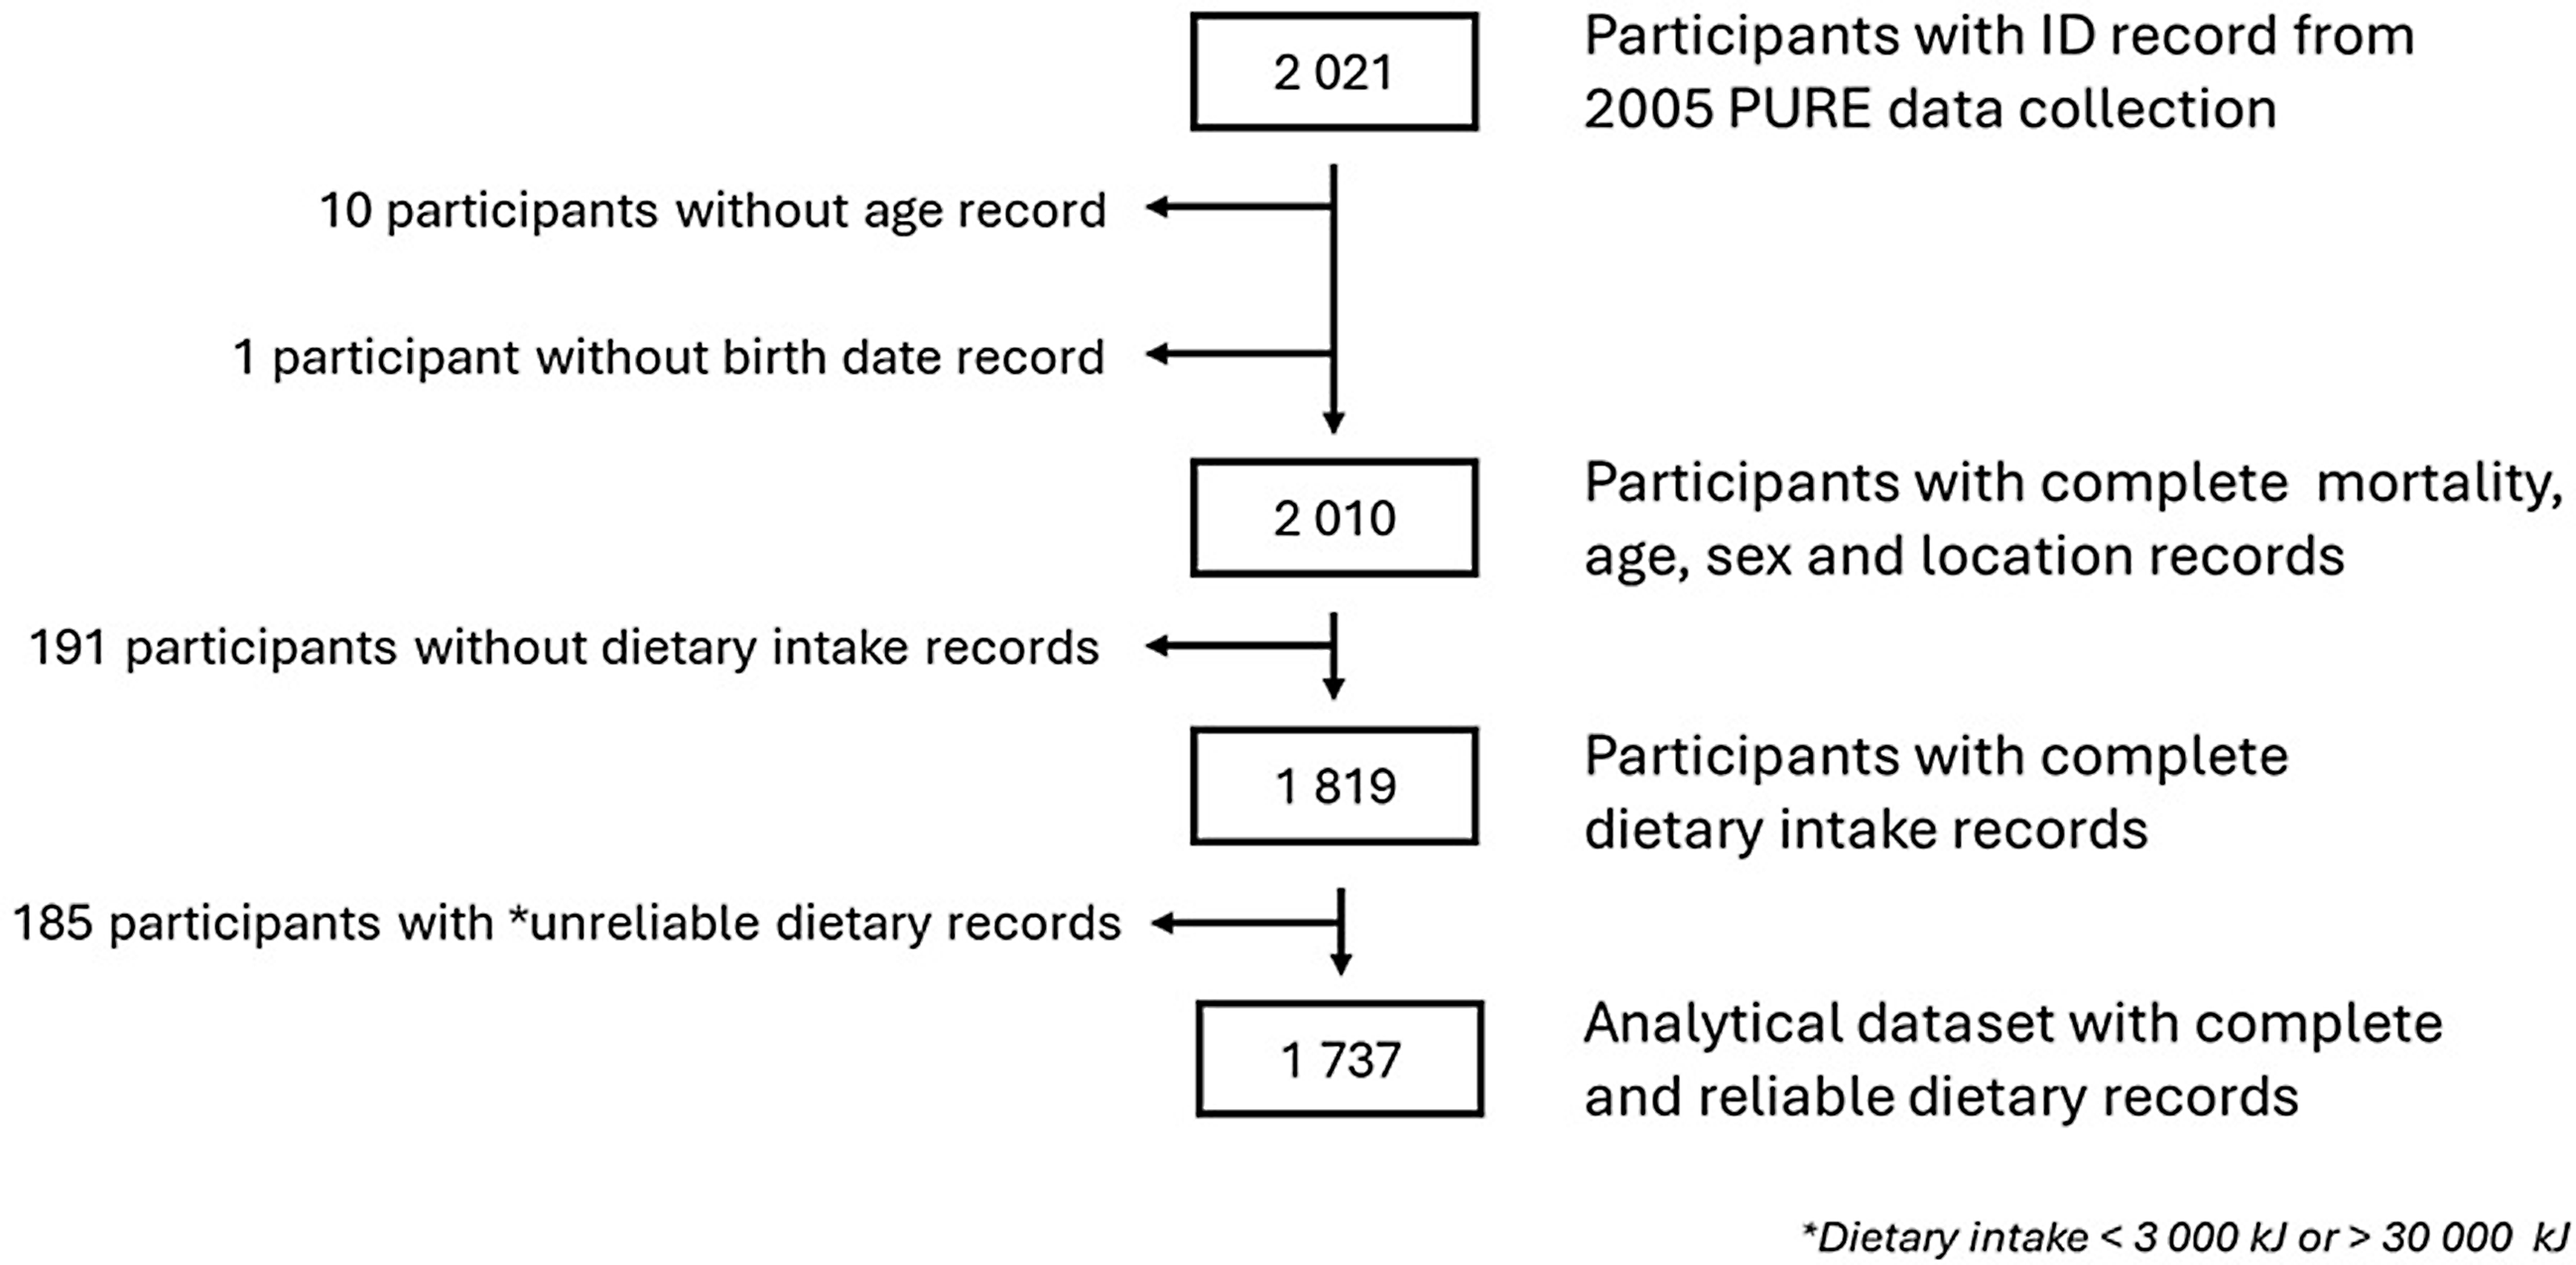
The characteristics of the participants are detailed in Table 1. Among the 2010 participants of the 2005 PURE study, 191 participants were excluded due to missing dietary data; and another 185 participants with self-reported energy intake of less than 3000 kJ (under-reporters) or more than 30 000 kJ (over-reporters) were further excluded. The flow chart of participants’ selection is reported in Figure 1. Participants excluded based on missing or unreliable dietary data did not have a statistically different median age (47 years; 5th to 95th range = 35–69) or sex distribution (women 68·3 %) compared with the analytical sample. However, a statistically significant higher proportion of rural participants was observed (82·9 %). In the present study, 1737 participants had sufficient information to be included in the analytical data frame. Of these, there were 1201 survivors, 536 total deaths and 123 participants who died from CVD. Participants who survived at the end of the observational time were younger, mainly women who lived in rural areas, and had a higher median physical activity level than the participants who passed away. The participants who died from all causes were mostly from urban areas and had the highest percentage of infectious diseases, type 2 diabetes mellitus and ever-smoking prevalence. Participants who died from CVD-related causes were older compared with the other groups, lived mainly in the urban setting, had a lower physical activity level and had borderline central obesity.
Baseline characteristics of participants

T2DM, type 2 diabetes mellitus.
* Cholesterol-lowering, anti-inflammatory, anti-hypertensive and hypoglycaemic medication.
Flow chart of participant selection. PURE, Prospective Urban and Rural Epidemiology.

Nutrient intake at baseline
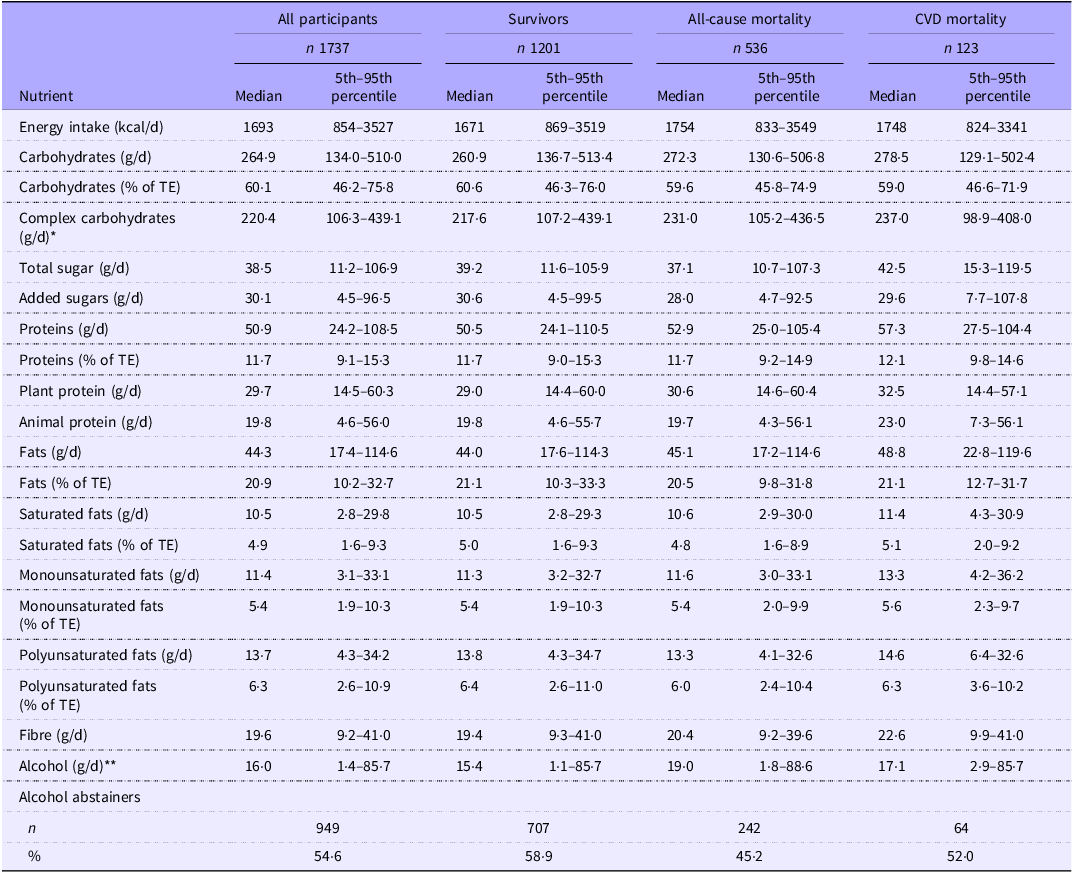
The nutrient intake at baseline is shown in Table 2. The median TE intake of all participants was 1693 kcal/d. The survivors had a lower median TE intake of 1671 kcal/d than those who died from all causes (1754 kcal/d) or CVD (1748 kcal/d). Macronutrient distribution was similar between the survivors as well as the all-cause and CVD mortality groups. All groups followed a relatively low-fat (20·5–21·1 % of TE) and high-CHO diet (59·0–60·6 % of TE). Alcohol consumption (19·0 g/d) was the highest among the participants who died of all causes. Total sugar intake (42·5 g/d) was the highest among the CVD mortality group.
Baseline nutrient intakes

TE, total energy.
*Total carbohydrates – total sugar.
**Mean intake of alcohol consumers only.
Nutrient intakes and partition and substitution model analysis in relation to all-cause mortality
Overall, the participants were followed up for a median observational time of 13 years resulting in 19 456·6 person-years. First, the different macronutrient intakes (g/d) were divided into tertiles and related to all-cause mortality (online Supplementary Table 1). In general, all-cause mortality risk tended to decrease across increasing tertiles of complex CHO, animal protein, total fat and MUFA intakes, with associations becoming less significant as the number of covariates in the models increases. For sugar (total and added) intake, moderate intakes (Q2) demonstrated a decreased all-cause mortality risk, but with higher intakes (Q3), the protective effect was lost.
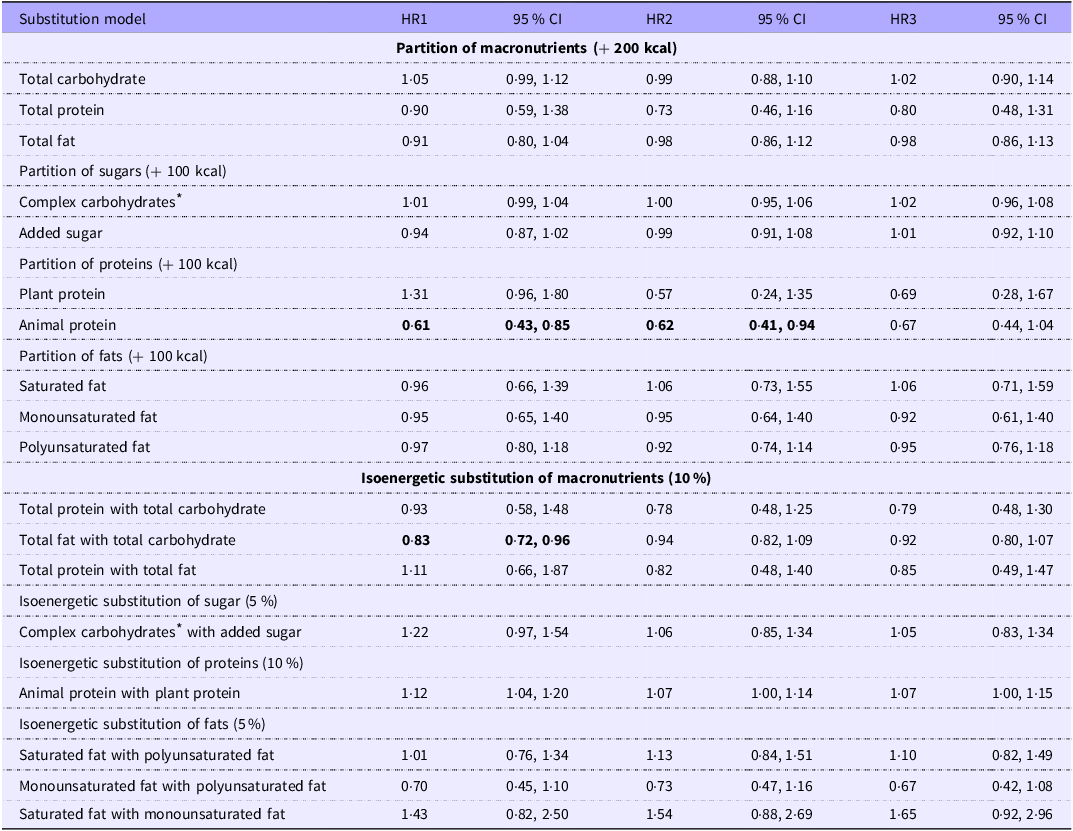
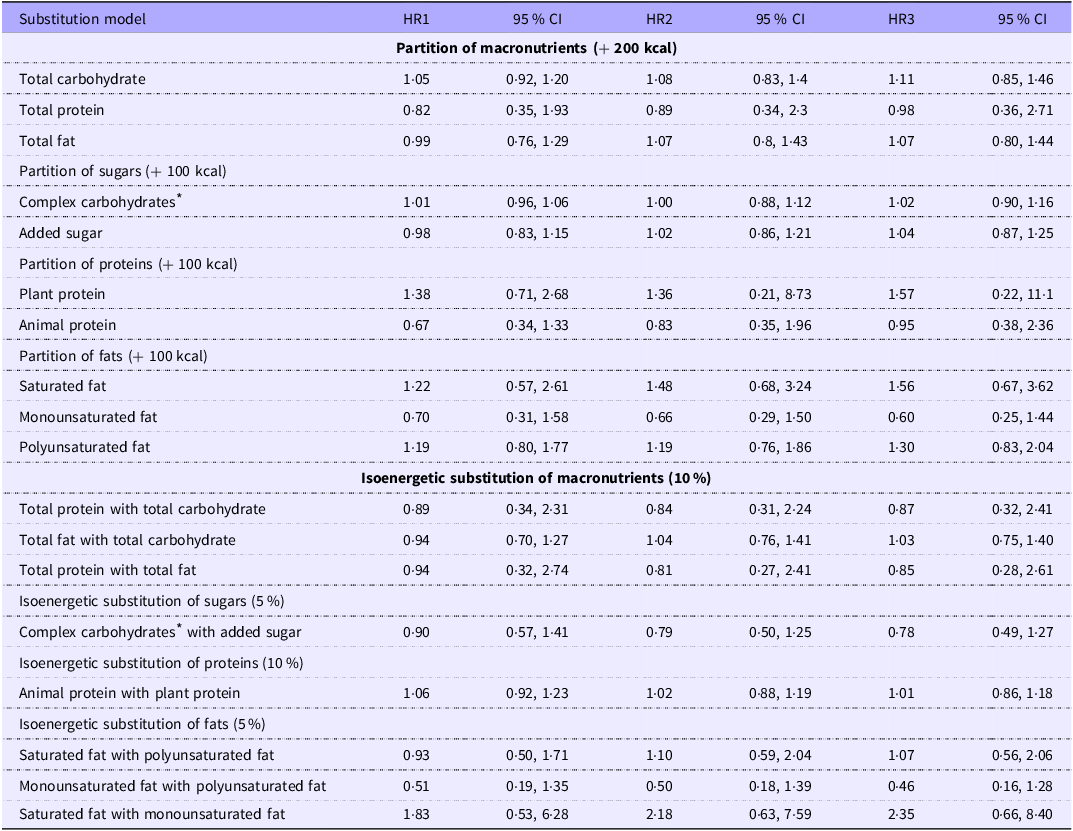
According to the partition model analysis (Table 3), the substitution of 200 kcal energy of plant protein with animal protein (while keeping CHO and fat intake constant) was associated with a significant all-cause mortality risk reduction of 39 % (model 1), 38 % (model 2) and 33 % (model 3, no longer significant). Isoenergetic substitution of 10 % TE of total fat with total CHO was associated with a significant all-cause mortality risk reduction of 17 % in model 1 (hazard ratio (HR) 0·83; 95 % CI 0·72, 0·96), 6 % in model 2 and 8 % in model 3; however, it was no longer significant. No significant results were observed for any of the other macronutrients with either the partition or the isoenergetic substitution model analyses.
Partition and substitution models for all-cause mortality

HIV, human immunodeficiency virus; T2DM, type 2 diabetes mellitus; GGT, gamma-glutamyl transferase; CRP, C-reactive protein.
HR1: model 1 was an unadjusted COX model with age as underlying time to event and baseline risk defined by 10-year age classes, sex and location (rural/urban); HR2: model 1 additionally adjusted for medication usage for cholesterol, hypertension, inflammation and T2DM, baseline HIV or tuberculosis, hypertension, T2DM, ever smoking, alcohol use and socio-economic status; HR3: model 2 additionally adjusted for GGT, CRP, total cholesterol, TAG and albumin.
Statistically significant values are in bold.
* Total carbohydrate – total sugar.
Nutrient intakes and partition and substitution model analysis in relation to CVD mortality
The different macronutrient intakes were also divided into tertiles and related to CVD mortality (online Supplementary Table 2). There was no association with CVD mortality risk across the tertiles of intakes of any of the macronutrients. In addition, no significant associations with CVD mortality were observed for any of the macronutrients in either the partition or isoenergetic substitution analyses (Table 4).
Partition and substitution models for CVD mortality

HIV, human immunodeficiency virus; T2DM, type 2 diabetes mellitus; GGT, gamma-glutamyl transferase; CRP, C-reactive protein.
HR1: model 1 was an unadjusted COX model with age as underlying time to event and baseline risk defined by 10-year age classes, sex and location (rural/urban); HR2: model 1 additionally adjusted for medication usage for cholesterol, hypertension, inflammation and T2DM, baseline HIV or tuberculosis, hypertension, T2DM, ever smoking, alcohol use and socio-economic status; HR3: model 2 additionally adjusted for GGT, CRP, total cholesterol, TAG and albumin.
* Total carbohydrate – total sugar.
Top five macronutrient foods consumed
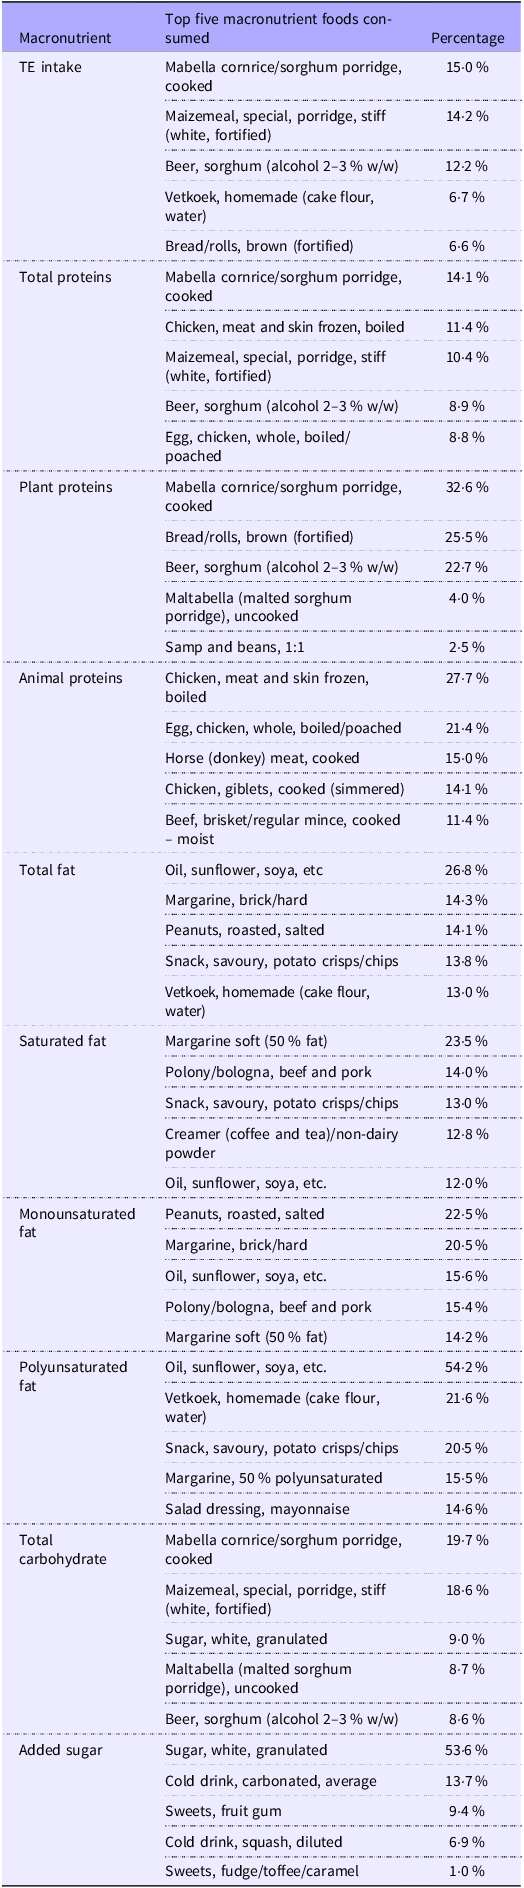
To explain the findings relating the macronutrient intakes to all-cause and CVD mortality, we also identified the five foods contributing the most to each of the macronutrients investigated (Table 5). The top foods contributing the most to TE intake were CHO-based foods, including mabella (sorghum porridge) (15·0 %), maizemeal porridge (14·2 %) and homemade sorghum beer (12·2 %). The foods contributing the most to total protein were mostly plant-based foods: mabella (sorghum porridge) (14·1 %), followed by chicken meat (11·4 %) and homemade sorghum beer (8·9 %). The foods contributing the most to plant proteins were low-quality plant protein foods such as mabella (sorghum porridge) (32·6 %), bread (25·5 %) and homemade sorghum beer (22·7 %). High-quality plant protein food (i.e. samp and beans) comprised only 2·5 % of total plant proteins consumed. The most consumed animal protein foods were chicken meat (27·7 %) and eggs (21·4 %), which are lean meat products, with red meat products contributing proportionally less to animal protein intake. The foods contributing the most to total fat intake were all plant-based: oil, margarine, peanuts, savoury snacks and fried cake flour-based dough balls (vetkoek). The foods contributing the most to saturated fat intake were soft margarine, processed meat, savoury snacks, non-dairy coffee creamer and oil. PUFA food sources were mostly oil or oil-based products such as fried savoury snacks, fried cake flour-based dough balls, margarine or salad dressing. MUFA food sources were also oil or oil-based products as well as peanuts and processed meat. The most consumed food sources of total sugar were mabella (sorghum porridge) and maizemeal porridge, with granulated sugar contributing only 9·0 %.
Top five macronutrient foods consumed

TE, total energy.
Discussion
This study presents the first findings concerning the association of macronutrient distribution with CVD and all-cause mortality in an African study population in the context of food insecurity, dependency on staple foods, and African dietary patterns. Our results revealed that higher intakes of complex CHO, animal protein, total fat and MUFA were associated with decreased all-cause mortality risk, with no association with CVD mortality observed. In addition, substituting 100 kcal plant protein with animal protein and total fat with total CHO (10 % TE) also decreased all-cause mortality risk. These findings partially agree with but also partially oppose previous substitution analysis studies done in high-income populations following a Western diet(Reference Guasch-Ferré, Sanjulian and Babio24,Reference Aune, Keum and Giovannucci50–Reference Kim, Je and Giovannucci52) .
Our findings regarding complex CHO and total fat intake are in agreement with existing evidence suggesting that a diet consisting of intakes of high complex CHO(Reference Morimoto, Urayama and Tanaka14,Reference Aune, Keum and Giovannucci50,Reference Miyazawa, Miura and Miyagawa53) and total fat(Reference Dehghan, Mente and Zhang16,Reference Ma, Zheng and Zhuang17,Reference Guasch-Ferré, Sanjulian and Babio24,Reference Kim, Je and Giovannucci52,Reference Mazidi, Mikhailidis and Sattar54) decreases the risk of all-cause mortality. Complex CHO are rich in dietary fibre, which exerts immune-modulating effects by influencing the composition of intestinal microbiota leading to reduced levels of circulating inflammatory markers(Reference Veronese, Solmi and Caruso55). High-fibre diets are also associated with lower blood pressure, body weight, LDL-cholesterol and total cholesterol levels – all of which are considered cardioprotective(Reference Reynolds, Mann and Cummings56). Furthermore, higher fibre intake is typically associated with higher consumption of vitamins and minerals(Reference Veronese, Solmi and Caruso55). The top five foods contributing most to total fat intake were also rich in MUFA and PUFA. Both PUFA and MUFA are associated with decreased CVD mortality by, in part, decreasing LDL-cholesterol and TAG and increasing HDL-cholesterol(Reference Mensink57).
Our finding that substituting total fat (10 % of TE) with total CHO was associated with a lower risk of all-cause mortality could neither be substantiated nor refuted by the literature as no comparable studies, to our knowledge, have examined the substitution of total fat with CHO. However, the finding that substituting 100 kcal of plant protein with animal protein led to a risk reduction in all-cause mortality contradicts the existing evidence, which emphasises the risk-reducing effect of a high-plant protein diet(Reference Ma, Zheng and Zhuang17,Reference Das, Cumming and Naganathan51,Reference Qi and Shen58–Reference Chen, Glisic and Song60) . To understand these findings, the participants’ dietary intakes in relation to TE consumption, macronutrient distribution and the foods that contributed the most to each of the macronutrients should be considered.
The recommendation for TE intake for moderately active adults (18–60 years) is between 1800 and 2800 kcal, and the acceptable macronutrient distribution range for CHO is 45–65 %, fat is 20–35 % and protein is 10–35 % of TE(61). Compared with these guidelines, the TE intake of the participants was relatively low (1693 kcal), and the macronutrient distribution (CHO: 60·1 %, fat: 20·9 %, protein: 11·7 %) suggests a relatively high-CHO, low-fat and low-protein diet. Hence, the data indicate that the participants followed a prudent diet. Therefore, substituting macronutrients within the kcal (100–200 kcal) and %TE (5–10 %) ranges typically performed in substitution analyses would result in the diets remaining within the prudent dietary guidelines range. This might preclude the substitution from significantly affecting health outcomes such as CVD and all-cause mortality.
Regarding the plant and animal protein intake in this study population, the foods that contributed most to plant proteins were low-quality plant protein-based foods such as sorghum porridge, bread and homemade sorghum beer. Protein quality is based on the Digestible Indispensable Amino Acid Score (DIAAS) according to the three categories defined by the FAO of America(62). However, the score assigned to each protein (plant- and animal-derived) is not immutable because various factors (cooking/heat treatment, raw/cooked state and protein combinations) influence the final score(Reference Herreman, Nommensen and Pennings63). The quality of protein, according to DIAAS, differs between animal and plant proteins and also varies among different sources of plant proteins. While most animal-based proteins are more likely to have excellent protein quality scores, whey and soya also fall into the higher-quality score category, whereas the plant-based proteins consumed in this population, like corn, wheat, oats and rice, fall into a low-quality score category(Reference Herreman, Nommensen and Pennings63). Low-quality plant-based diets have been associated with higher systemic inflammation, which, in turn, is associated with increased all-cause mortality(Reference Wang, Page and Gill64). In addition, most plant-based protein foods consumed by this population are also considered processed foods, which have been associated with an increased risk of CVD(Reference Juul, Vaidean and Parekh65,Reference Srour, Fezeu and Kesse-Guyot66) and all-cause mortality(Reference Rico-Campà, Martínez-González and Alvarez-Alvarez67,Reference Elizabeth, Machado and Zinöcker68) . Conversely, the foods contributing most to animal protein intake in this population can be classified as lean meat products (chicken, chicken eggs and horse/donkey), representing higher-quality protein sources lower in saturated fat. Furthermore, research suggests that the protein in eggs might help protect against infections(Reference Li, Yao and Wang69,Reference Kovacs-Nolan, Phillips and Mine70) , serve as a hypotensive agent(Reference Barona and Fernandez71) and potentially enhance skeletal muscle health(Reference Puglisi and Fernandez72–Reference Kato, Sawada and Numao74). Therefore, the apparent protective effect observed with higher animal protein intake and substituting plant protein with animal protein is likely related to the food sources consumed in this low-income population consuming more traditional African foods. These findings highlight the importance of obtaining population-specific data as data obtained in high-income countries, in individuals (predominantly) of European descent, evidently cannot be directly applied to the SA context with its different racial and demographic landscapes.
The protective effect of total fat on all-cause mortality might also have been related to the food sources that contributed most to total fat, which were all plant-based (vegetable oil, margarine, peanuts, savoury snacks and fried cake flour-based dough balls). In agreement, the total amounts of MUFA and PUFA in the diet were higher than that of SFA (Table 2). These findings further agree with the literature indicating that MUFA(Reference Ma, Zheng and Zhuang17,Reference Guasch-Ferré, Sanjulian and Babio24) and PUFA(Reference Ma, Zheng and Zhuang17,Reference Guasch-Ferré, Sanjulian and Babio24,Reference Kim, Je and Giovannucci52) decrease the risk of CVD and all-cause mortality.
The lack of any associations between macronutrient distribution and CVD mortality in our study could be related to the small number of CVD deaths; hence, the current study might not have had sufficient power to detect significant associations. It may, however, also be related to the fact that in low- and middle-income countries still in the early stages of development (including SA), the predominant CVD are infection-based, for example, rheumatic heart disease and hypertensive heart diseases, more so than atherosclerotic CVD(Reference Yusuf, Reddy and ⓞunpuu75). Furthermore, while hypertension is considered the leading cause of CVD and CVD-related mortality worldwide, it is even more prevalent in individuals of African than European descent(Reference Keavney, McKenzie and Parish76–Reference Menotti, Keys and Kromhout78) and was also the most prevalent CVD type in this study sample (unpublished results). Of these different types of CVD, macronutrient distribution is more strongly linked to atherosclerotic CVD than infectious or hypertensive CVD(Reference Yusuf, Reddy and ⓞunpuu75). Thus, the type of CVD prevalent in a population should be considered when investigating the role of specific dietary components, such as macronutrient distribution, in disease prevalence and progression.
Strengths and limitations
This study is the first to examine the association between macronutrient distribution and CVD and all-cause mortality in Black South Africans. Importantly, the study relies on the SA arm of the PURE study, which is regarded as one of the most dependable datasets on the continent. However, the researchers recognise the limitations of the study. We cannot rule out the possibility that the small number of CVD deaths might have affected our results, potentially leading to false-negative outcomes. It further did not allow us to investigate different types of CVD aetiologies. Another potential limitation could be the lack of precision caused by measurement errors (including use of single baseline dietary assessment), misreporting or logistical and methodological issues impacting all population-based research conducted on the African continent (partly due to inaccurate reporting of dietary intakes in a population with a relatively low median educational level). Ultimately, because it is a well-phenotypic study, it enabled the identification and control of various covariates; however, residual confounding cannot be ruled out. Finally, we observed that a high percentage of missing or unreliable dietary data were from participants of the rural area. We cannot exclude that this could have influenced the robustness of the inference and thus the generalisability of our results with respect to the participants’ location.
Conclusion
This research demonstrates that higher intakes of complex CHO, animal protein, total fat and MUFA, and substituting plant protein with animal protein and total fat with total CHO, were associated with decreased all-cause mortality risk but not CVD mortality in this African study population. The findings highlight the importance of obtaining population-specific data, as data obtained from individuals of European descent in high-income countries are not always generalisable to Africans. Factors such as food insecurity, dependency on staple foods, African dietary patterns and CVD aetiology might influence results and should be considered when developing dietary advice strategies.
Supplementary material
For supplementary material/s referred to in this article, please visit https://doi.org/10.1017/S000711452610717X
Acknowledgements
The authors thank all participants, fieldworkers, the PURE-SA research team and the office staff of the Africa Unit for Transdisciplinary Health Research of the Faculty of Health Sciences, NWU South Africa. In addition, the authors thank the PURE-International research team and the PURE-study office staff at the PHRI, Hamilton Health Sciences and McMaster University, Ontario, Canada.
The PURE-SA-NW study was funded by the North-West University, South African National Research Foundation (SANRF), Population Health Research Institute, South African Medical Research Council (MP, SAMRC-RFA-EMU-1-0-2020), the North-West Province Health Department and the South Africa-Netherlands Research Program on Alternatives in Development. None of the funding bodies were involved in the design of the study, collection, analysis or interpretation of the data or in writing of this manuscript. Opinions expressed and conclusions arrived at are those of the authors and are not to be attributed to the funding sources.
Conceptualisation: M. P., C. R., M. L. and C. v. d. M.; methodology: M. P., C. R., M. L. and C. v. d. M.; formal analysis: C. R.; investigation: M. P., C. R., M. L. and C. v. d. M.; data curation: C. R.; writing – original draft preparation: M. P., C. R., M. L. and C. v. d. M.; writing – review and editing: M. P., M. L. and C. v. d. M.; supervision: M. P., C. R. and C. v. d. M.; funding acquisition: M.P. All authors have read and agreed to the published version of the manuscript.
None of the authors have any conflict of interest to declare.


 Open access