


Introduction
Empathy is a commonly reported mechanism to improve intergroup relations and to reduce affective polarizationFootnote 1 (Pettigrew and Tropp Reference Pettigrew and Tropp2008; Batson and Ahmad Reference Batson and Ahmad2009; Iyengar, Sood, and Lelkes Reference Iyengar, Sood and Lelkes2012; Gidron, Adams, and Horne Reference Gidron, Adams and Horne2019). For example, former US president Barack Obama suggested polarization resulted from an “empathy deficit”. More empathic concern and more often taking the perspective of political opponents should lead to a reduction in affective polarization. Recent research in the US by Simas, Clifford and Kirkland (Reference Simas, Clifford and Kirkland2020, henceforth SCK) surprisingly showed that empathy does not reduce affective polarization. In this article, we replicate and extend SCK’s claims to see if they can be generalized to the contrasting political context of the Netherlands.
Empathy can be conceived of as consisting of the emotional recognition of and response to others’ emotional experiences (empathic concern, henceforth EC) and the cognitive understanding of others’ perspectives (perspective-taking, henceforth PT). While empathy can reduce prejudice, it is also psychologically costly (Hein et al. Reference Hein, Silani, Preuschoff, Batson and Singer2010) and can lead to an inclination to be empathic toward members of the ingroup only (Cikara, Bruneau, and Saxe Reference Cikara, Bruneau and Saxe2011). It is easier to understand and share experiences with similar, as opposed to dissimilar, others (Gutsell and Inzlicht Reference Gutsell and Inzlicht2012). Moreover, when concern for the ingroup is high, external threats could cause more instead of less negativity toward outgroups (Kunstman and Plant Reference Kunstman and Plant2008). As such, empathy’s potential to reduce conflict is complex and can go unrealized (Simas, Clifford, and Kirkland Reference Simas, Clifford and Kirkland2020). Indeed, SCK report that EC strengthens inparty liking and outparty disliking, whereas PT has no effect. Thereby it strengthens, rather than reduces, affective polarization.
Our preregistered replication and extension of SCK is set in the contrasting political context of the Netherlands. SCK’s study focused on the US political context that differs from other systems, making it difficult to generalize their findings. The Netherlands differs notably from the US because it has a highly fragmented multi-party (opposed to two-party), proportionally representative (opposed to majoritarian), parliamentary (opposed to presidential) democratic system. Additionally, the Netherlands have relatively low levels of affective polarization compared to most countries (Gidron, Adams, and Horne Reference Gidron, Adams and Horne2019; Wagner Reference Wagner2021), though it is by no means absent (Harteveld Reference Harteveld2021). By using a Dutch sample, we analyze if the relationship between empathy and affective polarization extends beyond US politics.
We replicate both the cross-sectional and experimental studies reported in SCK. Our studies are designed to be close to SCK, but are also adapted to the Dutch context. In the first study, we use a nationally representative sample to test whether EC positively relates to inparty liking (H1) and negatively to outparty liking (H2). We use both the original affective polarization measures in order to more directly replicate the original findings, as well as measures adapted to the specific Dutch context, accounting for multiple parties with varying sizes.
In the second study, we use a modified version of SCK’s experiment to investigate mechanisms of empathic ingroup bias. The experimental prompt describes a student protest against a speaker that is identified as either left-wing or right-wing. We contrast this with participants’ self-reported ideology to identify whether the participant was in the ingroup speaker condition or the outgroup speaker condition. We test four hypotheses, all based on the findings by SCK. We expect that higher levels of EC are positively associated with the desire to censor public expressions of outparty speakers compared to inparty speakers (H3a) and stronger feelings of “schadenfreude” for an outparty bystander hit by a protest board (H3b). Moreover, we also preregistered that ingroup bias is stable across the different levels of PT – the other-oriented cognitive component of empathy – in terms of censorship (H4a) and schadenfreude (H4b). Our hypotheses, sampling, and analysis plan were preregistered on OSF (Study 1 here and Study 2 here). The studies received ethical approval from our institute’s ethics committee (see Appendix A1 and B1).
Overall, we replicate the general effect for the cross-sectional study that EC positively relates to inparty liking and negatively to outparty liking. Surprisingly, however, we find that PT is negatively related to affective polarization. Regarding the experiment, our findings differ from SCK. In line with SCK, we find that high EC participants report a greater desire to censor outgroup speakers. Yet, we find no differences between conditions for schadenfreude. Also in contrast to SCK, we find that PT reduces ingroup bias. People high on PT report similar attitudes and feelings toward members of the ingroup and outgroup.
These findings indicate that two of the main components of empathy – EC and PT – exert opposing effects on affective polarization in the Netherlands, even though the correlation between these two empathy variables is relatively high. This shows how important it is to distinguish the more affective from the more cognitive components of empathy and to examine how their effects can differ within various political contexts.
Study 1: empathy and party liking
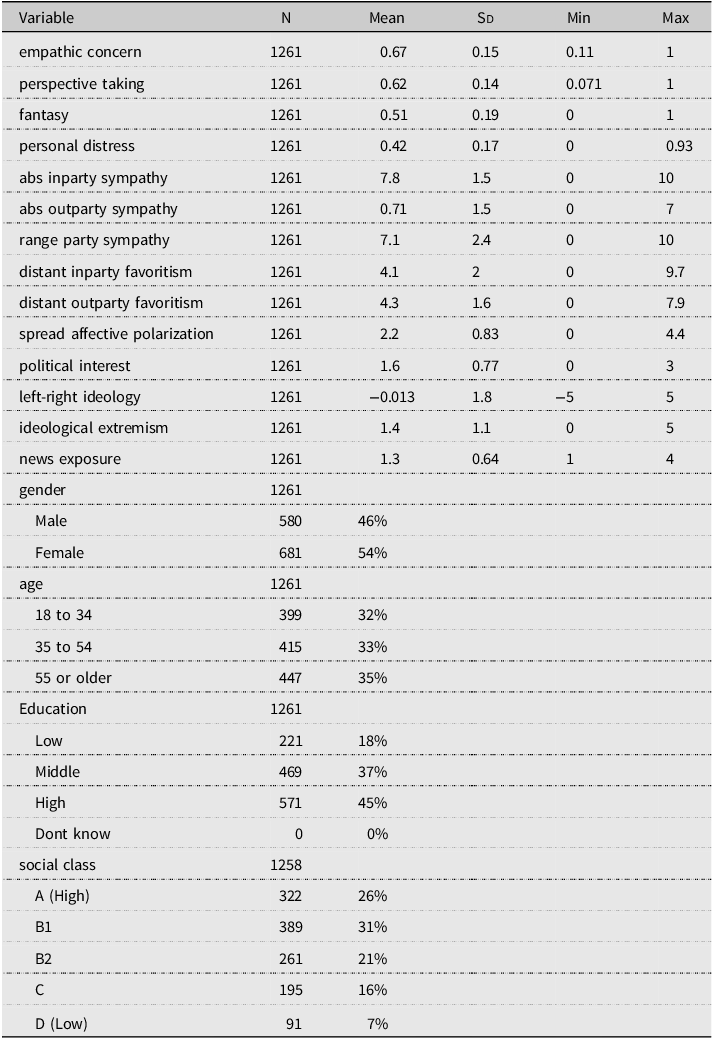
To test whether EC positively relates to inparty liking (H1) and negatively to outparty liking (H2), we use a cross-sectional sample of 1,258 participants recruited by Kantar. Participants received a standard remuneration for this. Table 1 in the appendix shows the socio-demographics and party preferences of this sample. The sample is representative in terms of age, gender, and education.
Dependent variables
To measure inparty and outparty liking, we use standard items that ask respondents to indicate, on an eleven-point scale from 0 (very unsympathetic) to 10 (very sympathetic), the extent to which they find each of the 19 political parties in Dutch parliament (un)sympathetic. To replicate SCK directly, we measure per participant inparty liking: the score of the party considered most sympathetic subtracted from the score of the party that is considered least sympathetic. If a participant scores a 10 on inparty liking, it reflects strong sympathy for one party (10) and strong antipathy for another party (0). We measure outparty liking by taking the score of the party a participant considers least sympathetic. If a participant scores a 0 here, this participant has strong antipathy for one out of the 19 parties. These are the direct replication measures.
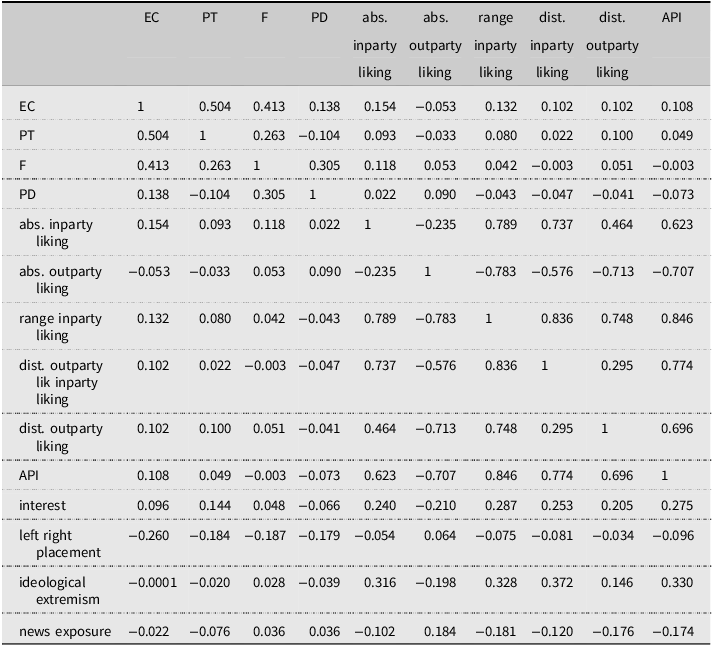
In multiparty systems, affective polarization has a different structure than in the bipolar American system (Wagner Reference Wagner2021). To account for this, we use the “weighted mean distance from the most-liked party” and the “weighted mean distance from the least-liked party” measures as conceptual replication of respectively inparty and outparty liking (Wagner Reference Wagner2021). To calculate the first, we take the squared distance between sympathy for the most-liked party and all other parties. To give larger parties more weight, each squared distance is multiplied by the proportion of parliamentary seats of each party. The measure is the square root of the sum of weighted squared distances (Wagner Reference Wagner2021). A respondent receives the maximum score (9.747 in our sample) if they have strong sympathy for one party and strong antipathy for all other parties. By contrast, if one has the same feeling toward all parties they receive a 0. If a person likes half of the parties, and dislikes the other half, they score on the middle of the scale. By weighing the parties, people who only dislike small fringe parties score higher on this scale than people who dislike large parties. The “weighted mean distance from the least-liked party” works similarly. But now we compare all parties to the least-liked party. Here a low score refers to the case in which participants dislike is concentrated on one party. These are our conceptual measures, and we label them as such to distinguish them from the direct replication measures (see Appendix Table A2 for the correlations between these measures). There are alternatives to these conceptual measures. Appendix section A5 shows that our findings are robust to these alternatives.
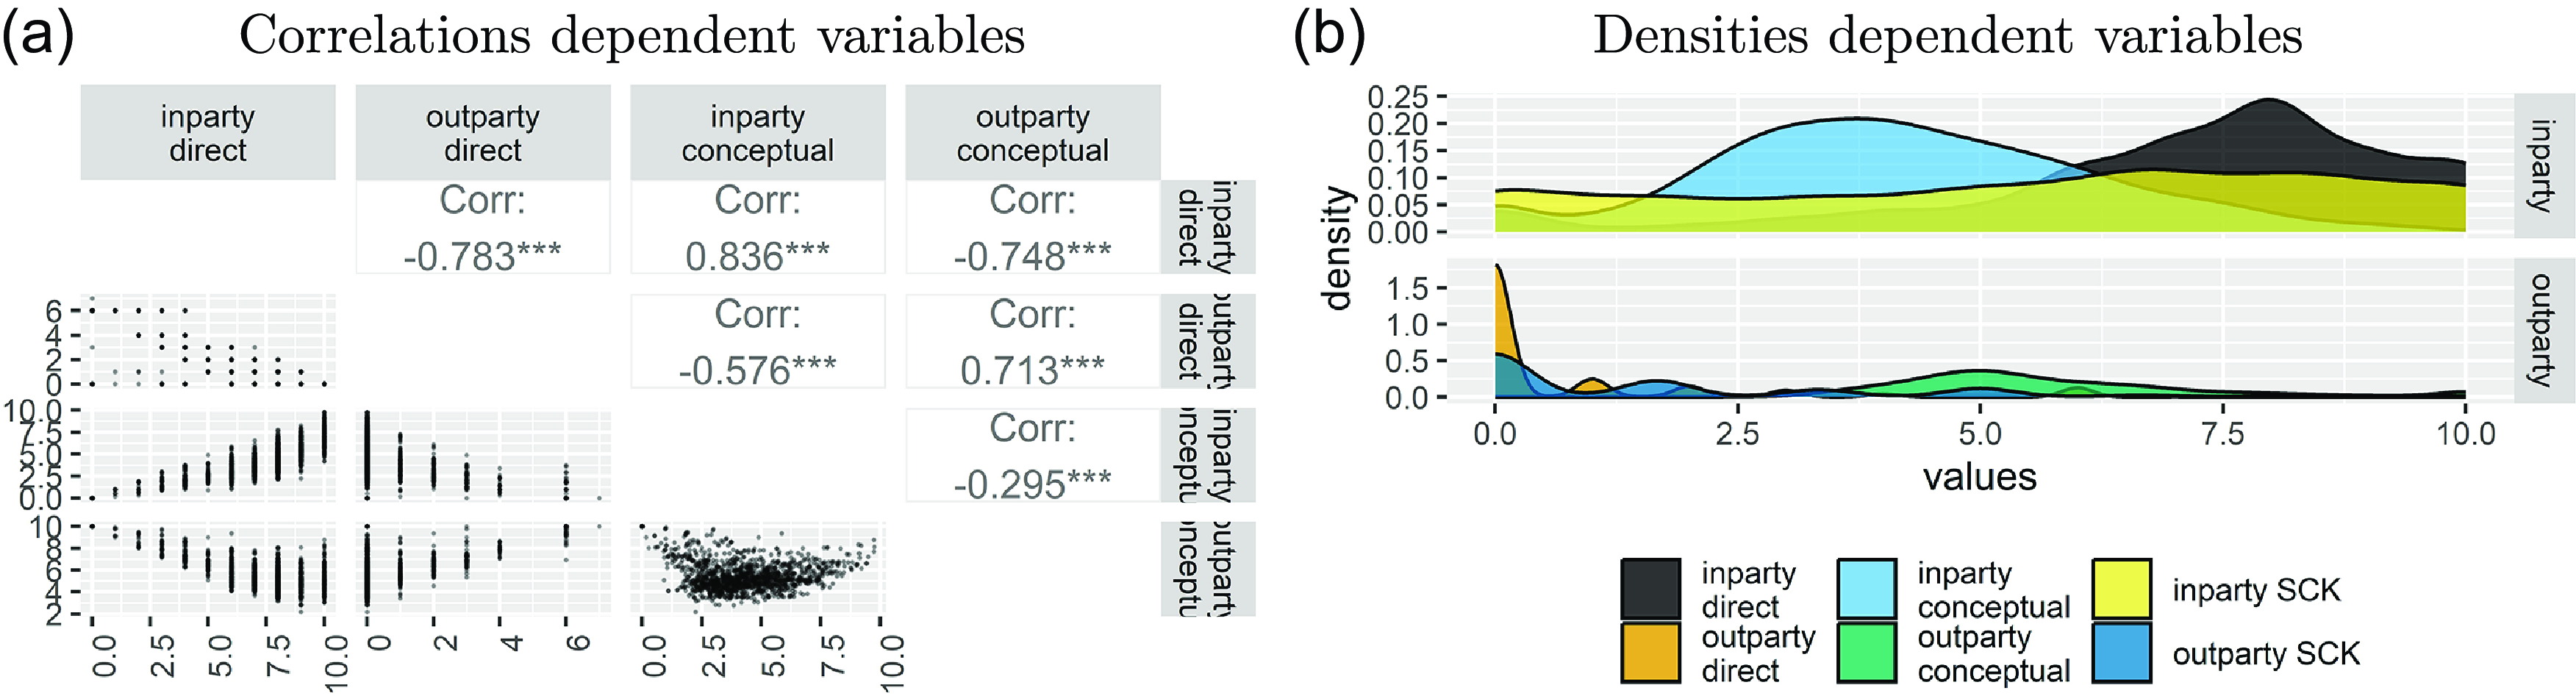
Figure 1a shows the correlations between the direct and conceptual replication measures of inparty liking and outparty liking. In particular, the correlations between the two inparty measures and the two outparty measures are high (around r = 0.75 and higher). Figure 1b shows the density plots of the four variables we introduced and the two original variables from SCK. Regarding the inparty measures, the conceptual measures are more normally distributed than those in SCK. Regarding the outparty measures, there is much more outparty dislike in our sample than in the SCK sample. This is because the Netherlands has more extreme parties than the US, for which the participants show extreme dislike (also see Fig. A1). Here, the conceptual measure is much more balanced. We also examined inparty and outparty liking using an alternative measure, taking into account the spread of like and dislikes for parties taking into account party size (Wagner Reference Wagner2021). This leads to similar results (see Table A4).
Comparisons between dependent variables in this study and in SCK.
Note: Panel “a” compares the four dependent variables in our study, by showing scatterplots and the correlations between the variables. The “direct” label refers to the measures using the same operationalization as SCK. “Conceptual” refers to the measures adapted to the multiparty context. Panel b shows density plots of our dependent variables, including the two original variables in the SCK study. These have been rescaled to our 0–10 scale.
Independent variables
Following SCK, we use the interpersonal reactivity index (IRI) (Davis Reference Davis1983) to measure the components of empathy: EC and PT.Footnote 2 Following SCK, we rescale all items to range from 0 to 1 and utilize the average of the items per component.Footnote 3 Following SCK, we include the control variables news exposure, political interest, left-right self-placement, education, ideological extremism, class, gender, and age. In contrast to SCK, we did not include ethnicity as a control variable. Moreover, SCK included news interest while we included news exposure and political interest. Last, opposed to including partisan strength and dummy variables for which party a respondent voted for, we included left-right placement given the amount and diversity of parties in the Netherlands.
Results
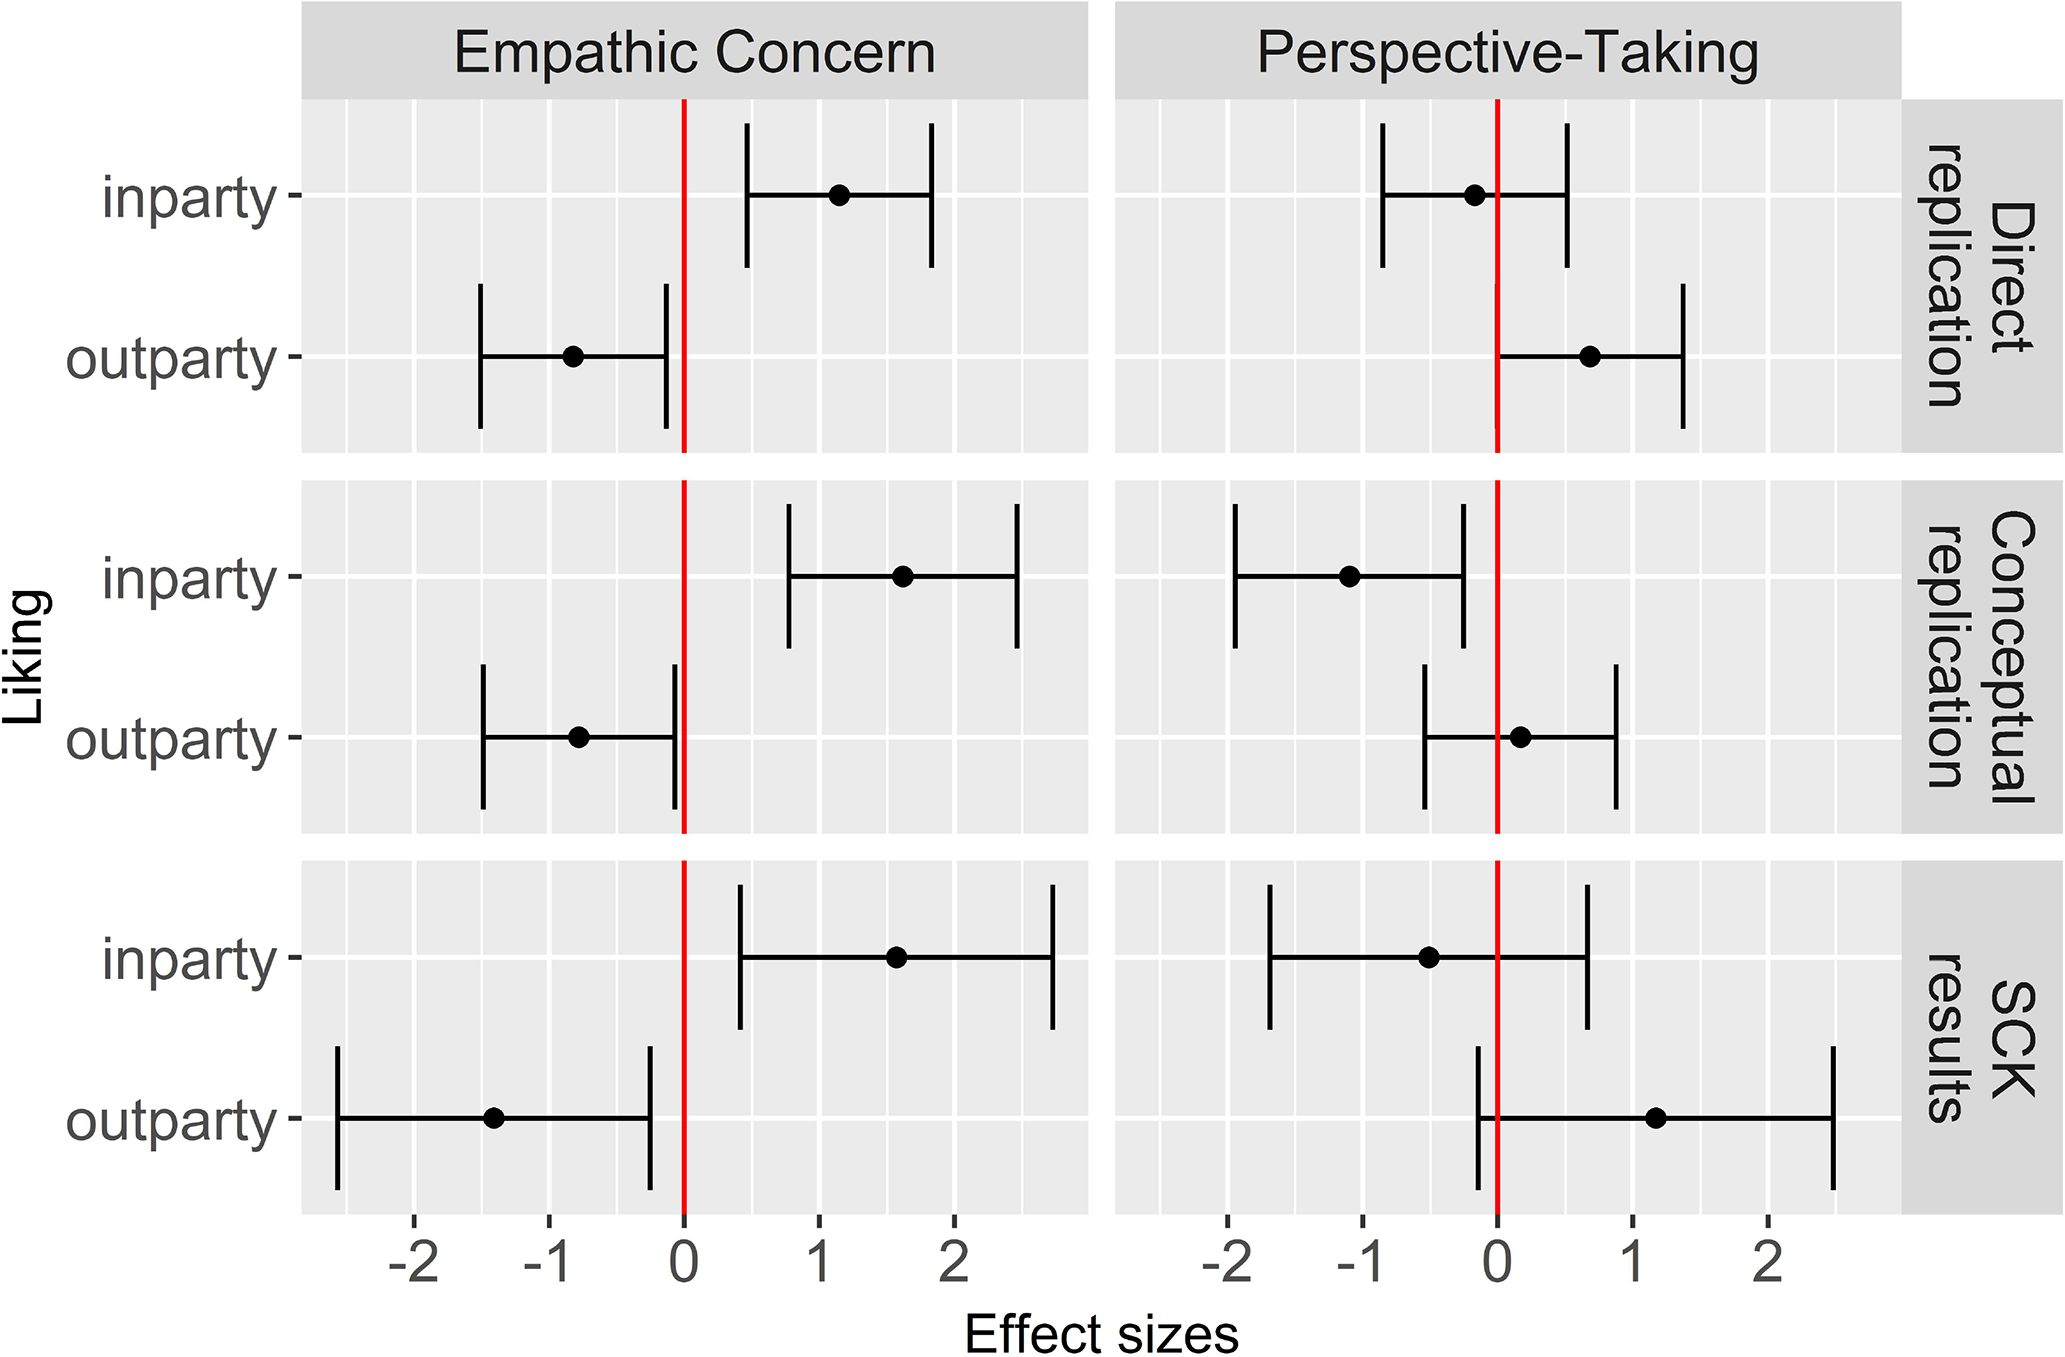
Figure 2 demonstrates that we replicate the positive effect of EC on inparty liking and the negative effect of EC on outparty liking. In our direct replication (top panel, left), EC is positively associated with absolute inparty liking and negatively associated with outparty liking. In our conceptual replication (middle panel, left), we obtain the same result: EC is positively associated with relative inparty liking and negatively with relative outparty liking. If we compare the effects of EC in our study with those reported by SCK, all our effects are in the same direction, and of comparable magnitude (bottom panel, left). We also find that PT is positively associated with outparty liking in our direct replication (top panel, right) and negatively with inparty liking in our conceptual replication (middle panel, right). Figure 2 displays that our PT findings are in the same direction as in SCK (bottom panel, right). Appendix Tables A3 and A4 provide full regression results.Footnote 4
Effects of EC on inparty and outparty (dis)liking per study.
Note: The dots are the regression estimates and the lines the 95% confidence intervals.
With EC fueling polarization, SCK also conclude that “perspective-taking does not come to the rescue”. We, however, believe that this conclusion should be more nuanced for three reasons. First, in their analysis of outparty favorability, SCK report an estimated effect of 1.17 of PT with a standard error of 0.67. This produces a t-statistic of 1.74. If SCK had hypothesized that PT increases outparty favorability, a one-tailed test would have led to the rejection of the null-hypothesis. Second, SCK do report that they find a significant, negative relationship between PT and a third variable they test: social distance. Third, SCK’s null finding is not robust to alternative specifications. Using a standard OLS instead of the ordered logistic model of SCK produces a statistically significant finding for PT (b = 0.724, se = 0.336).
Study 2: empathy, censorship, and schadenfreude
To test the remainder of the hypotheses, we replicated SCK’s survey experiment that randomly exposed participants to an outparty or inparty prompt, adapted with slight alterations to the Dutch context. We used a convenience sample of 438 Dutch students who participated on a volunteer basis. We chose this sampling strategy because SCK also used a convenience sample of students and because the experimental prompts were written for students. In both experimental prompts, participants were asked to read an article in which the following situation is described: (i) The police had to shut down a group of protesters ahead of a speaking event. The protesters were protesting a speaker for making inflammatory comments. (ii) A bystander, attempting to hear the speech of the speaker, was struck by a protester’s board. (iii) The protesters succeed in censoring the speaker as the event is cancelled. (iv) A group makes an online petition for the protesters to be punished afterwards. In the SCK experiment, the speaker is identified as Republican and the protestors as Democratic or the speaker is Democratic and the protestors are Republicans. Whether this is an inparty or an outparty treatment for the participant is determined on the basis of the partisan identification of the participant earlier in the study.
We adjusted the prompt to the Dutch context by changing the partisanship of the speaker and protestors to either GroenLinks (a green cosmopolitan left party) or PVV (an established radical-right party). We chose these parties as they hold opposing stances on cultural issues, and affective distances are largest among cultural opposites (Harteveld Reference Harteveld2021).Footnote 5 We also manipulated the name of the student organization organizing the protest to be either the Association of Left or Right Students. Appendix B2 contains the experimental prompts.
Following SCK, whether participants were exposed to the outparty or inparty prompt is based on their self-identification. Earlier in the study, participants placed themselves on a 0 (left) to 10 (right) scale. Participants to the left (right) of the middle point of the scale were placed in the outparty condition if the speaker was right-wing (left-wing) and otherwise they were placed in the inparty condition. As SCK excluded independents, we excluded participants in the center of the scale. Participants were more likely to agree than disagree with two statements about the realism of the experiment (mean = .65 on a 0–1 scale from unrealistic to realistic). Appendix B5 shows Robustness models show that including perceived realism of prompt, closeness to protesters, and left-right placement do not change substantial interpretations.
We preregistered this experiment (add link after acceptance). There is one major deviation from our preanalysis plan: we collected data from fewer participants than preregistered due to unexpected difficulties in finding participants. We are still sufficiently powered to asses H3a (effect censorship) but not to asses H3b (effect schadenfreude). Appendix B3 provides more details about this.
Dependent variables
After exposure to the article, respondents were asked about their opinion regarding the events of the prompt. To capture the desire to censor the speaker, respondents were asked on a 7-point scale, whether they agreed or disagreed that (1) the speaker should not have been invited to begin with, (2) the event should have taken place despite the protest, and (3) more should have been done to protect the speaker. To capture feelings of schadenfreude, we asked, on a 5-point scale, how (1) amusing, and (2) funny respondents thought it was that the bystander was struck. We additionally asked respondents to what extent they agreed or disagreed that the protesters should be punished (3 items) and how much sympathy (2 items) they had for the struck bystander.
Independent variables
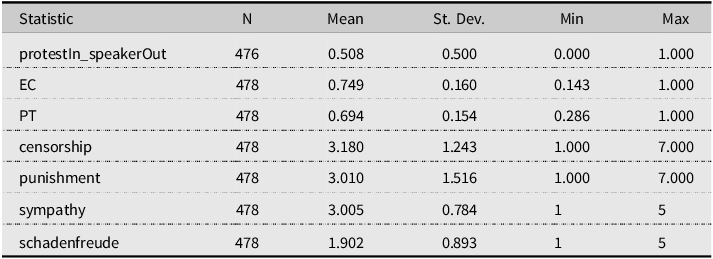
Before exposure to the treatment, respondents completed the parts of the IRI (Davis Reference Davis1983) to measure EC and PT. Table B1 in Appendix B reports the descriptive statistics for the discussed variables.
Results
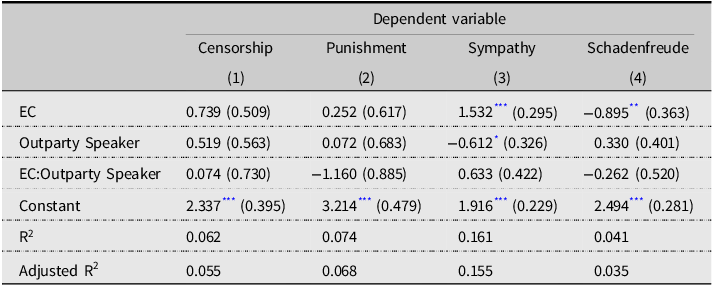
Do participants high on EC show more bias toward ingroup speakers than participants low on EC (H3a and H3b)? Figure 3 shows the differences between the ingroup and outgroup conditions for different levels of EC, for our analysis (black) and SCK’s analysis (in color: orange; in black-and-white: light grey) (for full regression tables see Appendix Table B2). Starting with the censorship dependent variable (top left plot), SCK report an increasing slope (orange or light gray line). This means that the higher participants score on EC, the more likely it is that these people wish to censor the outparty speaker compared to the inparty speaker. We label this difference between the two experimental conditions ingroup bias.
Ingroup bias at different levels of EC and PT for 2 dependent variables.
Note: Facet labels refer to the dependent variable. For each dependent variable, we ran two OLS regressions, one with EC*experimental condition as interaction effect the other with PT*experimental condition. The plots show the difference between the outgroup and ingroup conditions (e.g. ingroup bias) for each value of EC and PT. The lines are the estimates, the ribbons are the 95% confidence intervals.
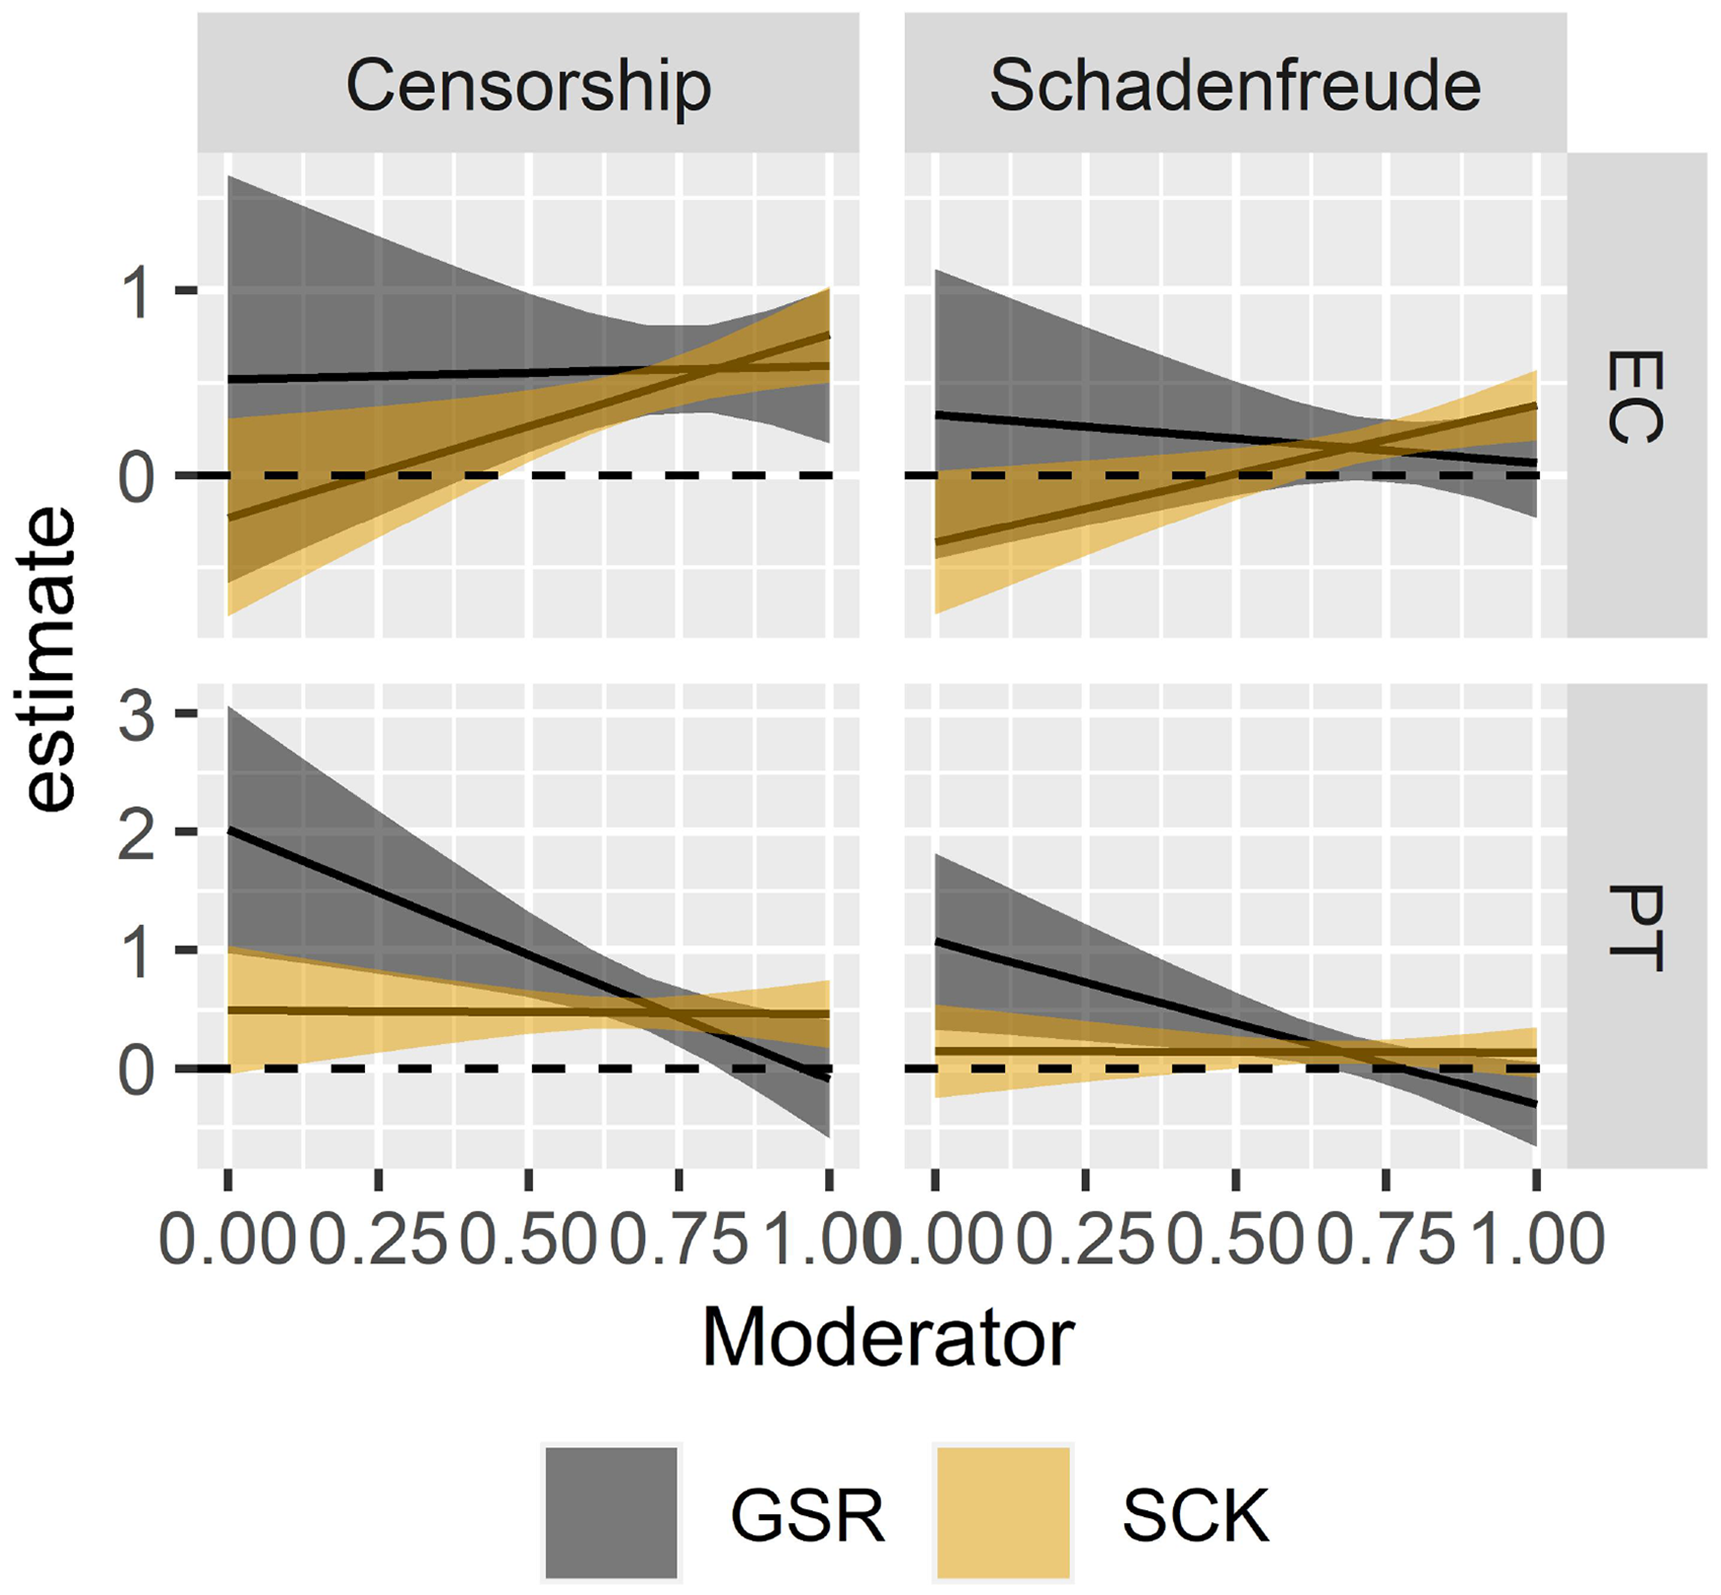
Yet our results regarding censorship show a flat line: ingroup bias does not significantly increase for higher levels of EC. We do find, however, that the 95% confidence intervals of the estimate of the ingroup bias – displayed as the area around the slope – become smaller for higher values of EC. Indeed, for values higher than .5 on the EC scale, there is a statistically significant ingroup bias. In sum, while we replicate the difference between high and low EC participants, we do not replicate the more fine-grained differences that SCK report. This difference is not due to differences in the distributions of empathic concern in the two samples, as these are almost identical. Also, we were sufficiently powered to find the censorship effect reported by SCK. SCK also report that participants with higher EC report feeling more schadenfreude for the bystander. Yet in our experiment, there is an insignificant difference between the two conditions. Do note that we were not sufficiently powered to replicate the schadenfreude effect reported by SCK. In sum, we reject H3a, and we have insufficient data to assess H3b.
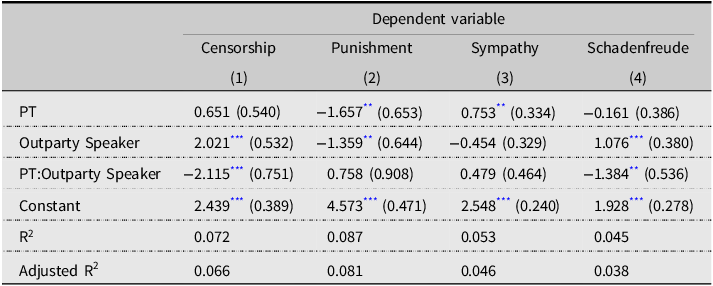
Now we move to testing whether participants high on PT have the same levels of ingroup bias compared to participants low on PT (H4a and H4b), as reported by SCK (see Appendix Table B3 for regression tables). The bottom part of Fig. 3 plots the interaction effects. We find a statistically significant difference between the two conditions for the censorship variable. Specifically, this means that the higher a participant scores on PT, the weaker the bias toward the ingroup. For those with the highest score on PT, there is no bias at all. We find a similar effect for schadenfreude. The higher a participant scores on PT, the weaker the bias toward the ingroup in reported schadenfreude. These findings are in contrast with SCK. We therefore reject H4a and H4b.
Discussion
With the problem of increasing affective polarization (Iyengar, Sood, and Lelkes Reference Iyengar, Sood and Lelkes2012; Gidron, Adams, and Horne Reference Gidron, Adams and Horne2019), some argue we need more empathy. Yet, SCK demonstrated that one facet of empathy – empathic concern – increases ingroup liking, outgroup disliking, and partisan bias. We replicate part of these findings, but also suggest that PT – another facet of empathy – has the opposite effect. PT reduces partisan bias in study 2 and inparty liking (in a conceptual replication) and outparty disliking (in a direct replication) in study 1. Hereby, our paper identifies the complexity of empathy’s potential to reduce conflict (Simas, Clifford, and Kirkland Reference Simas, Clifford and Kirkland2020).
By replicating SCK’s study in the context of the Netherlands, we have extended the generalizability of the claim that empathic concern increases affective polarization. Our conclusions about PT do notably deviate from SCK. A potential reason for this is the difference in political context. In contrast to the zero-sum competition between US Republicans and Democrats, Dutch political culture is more oriented toward inter-party collaboration and compromise. In such a context, PT might have greater potential to decrease polarization. Yet, there are two arguments against this view: (1) in a political culture of compromise and collaboration one would not expect that empathic concern fuels polarization and (2) as discussed in study 1, the PT results reported in SCK do not clearly signal a null finding. We suggest rather that there is some weak evidence for a positive effect of PT in the US as well. In sum, we conclude that the direction of the effects of EC and PT is not different across contexts. There exists, however, some variation in the effects of each facet of empathy.
Without a doubt, we require more evidence to further clarify the relationship between empathy, affective polarization, and context differences. Future studies might want to increase sample sizes, especially because effect sizes differ across context. Replication studies in other countries would further extend generalizability. Moreover, experimental manipulation of the context – to the extent that is possible – could help explaining potential cross-national differences.
To reduce affective polarization, we suggest designing interventions that uniquely target the perspective-taking trait, while leaving the empathic concern trait untouched. This is a challenge because both concepts are part of the same latent trait of empathy.
Data availability statement
The data, code, and any additional materials required to replicate all analyses in this article are available at the Journal of Experimental Political Science Dataverse within the Harvard Dataverse Network, at https://doi.org/10.7910/DVN/ZKUVSA
A Appendix Study 1
A1 Ethics
Study 1 has been approved by the ethical review board at the University of Amsterdam (2021-AISSR-14250). The survey company Kantar recruited our participants using a link to our survey. After clicking on this link participants were informed about the study protocol and particularly about their anonymity in the process. After that we asked them to give consent to participate in our study. This study only contained batteries of standard survey questions, and no deception was used. Participants at Kantar are paid through a point system.
A2 Representativeness of sample
Our categorization of class is based on the work of Louwen and Van Meurs specific to the Dutch context, which can be found here.
Descriptive statistics tables
A3 Relations between model variables
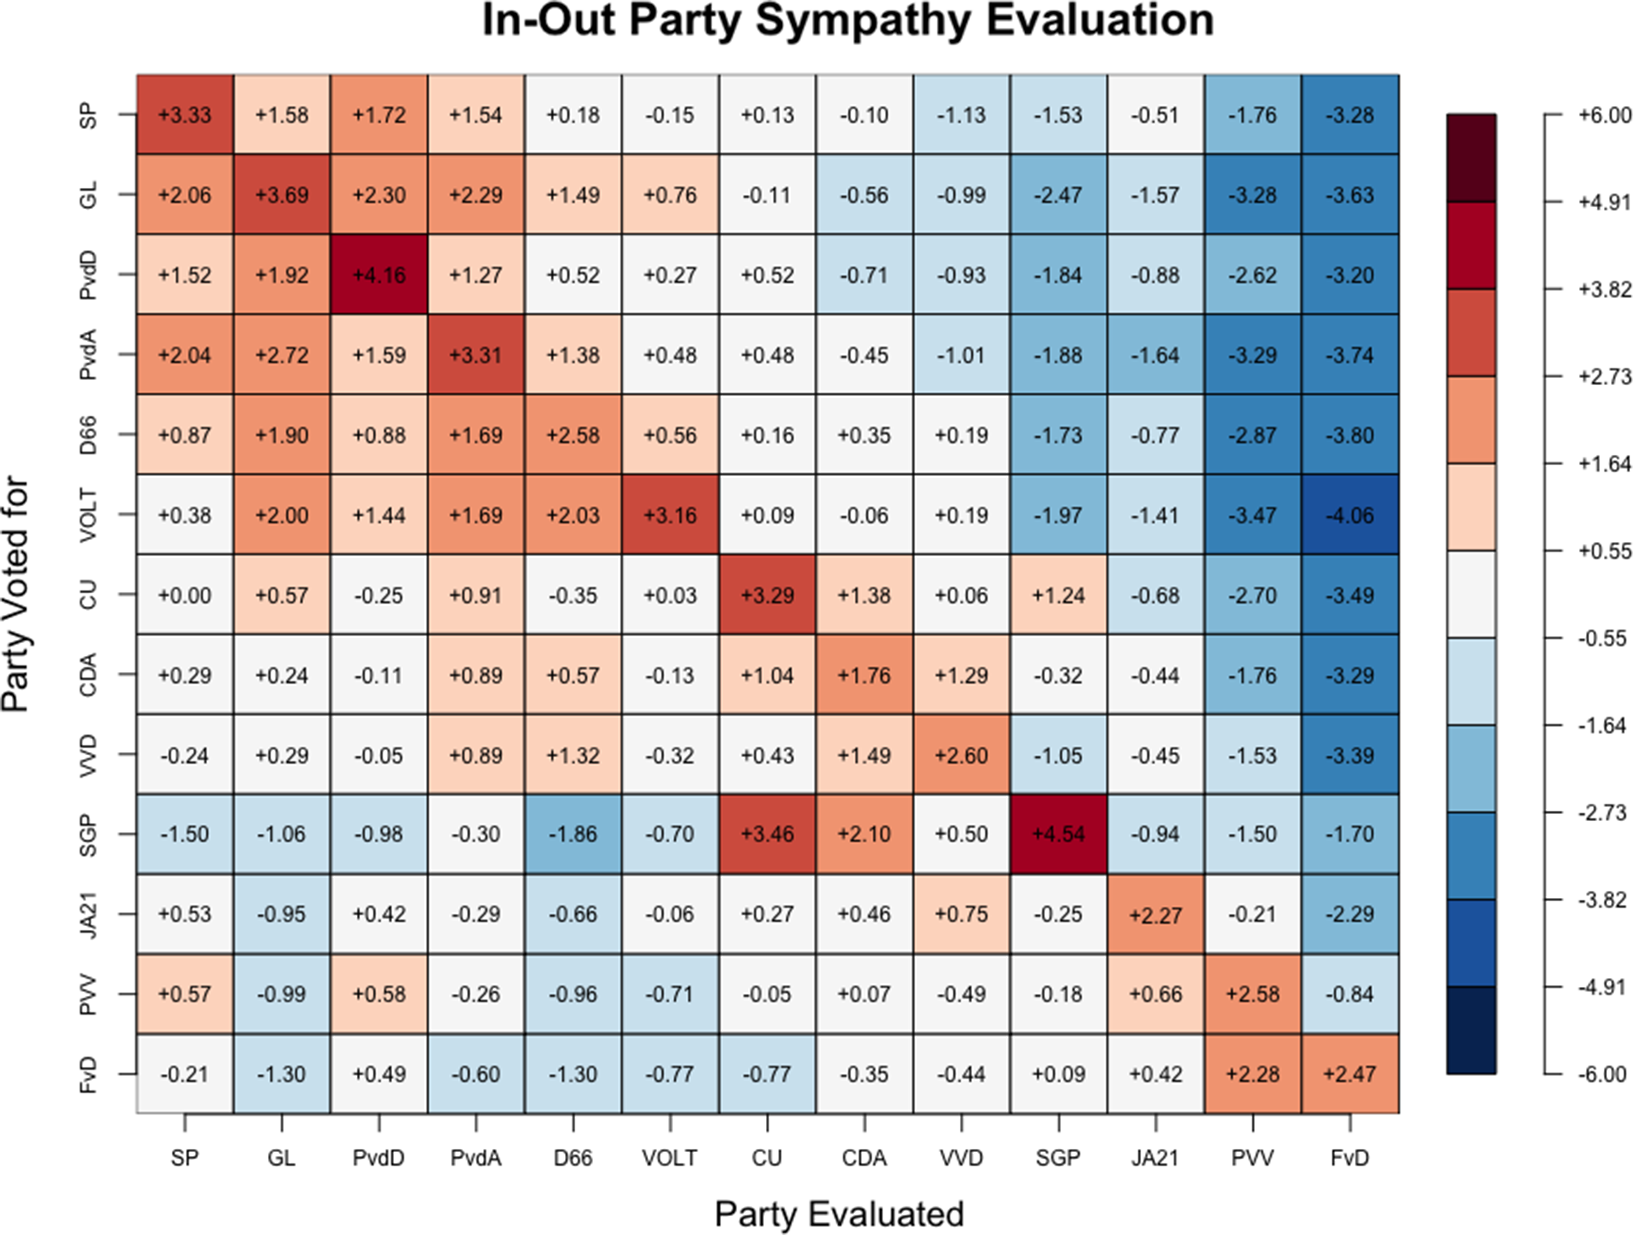
Figure A1 shows the mean relative party sympathy scores per party voted for.Footnote 6 Most strikingly, Fig. 1 shows that AP, the extent to which a positive and negative camp of parties is observed, is likely stronger, on an aggregate level, for left (SP, GL, PvdD, and PvdA) and center-left (D66 and VOLT) leaning voters due to a strong liking towards left-leaning parties and a strong dislike of radical-right parties (JA21, PVV, and FvD) as well as the reformist christian party (SGP), and the governing conservative-liberal party (VVD) to a somewhat lesser extent. Surprisingly, radical-right voters have relatively warmer feelings toward the socialist (SP) and animal-rights (PvdD) party and mainly dislike the green (GL) and center-left parties. In short, it seems the radical right is more polarizing than polarized (Harteveld, Mendoza, and Rooduijn Reference Harteveld, Mendoza and Rooduijn2022).
Correlation matrix
A4 Full regression tables main analyses
Affective polarization using measurements of SCK
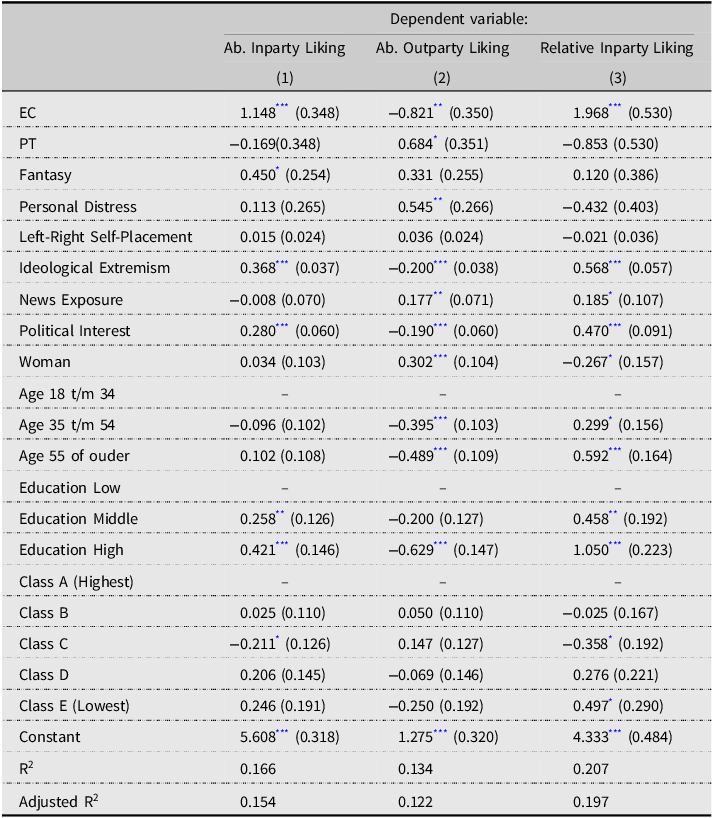
Note: n = 1,258.
EC and AP using measurements for multi-party systems
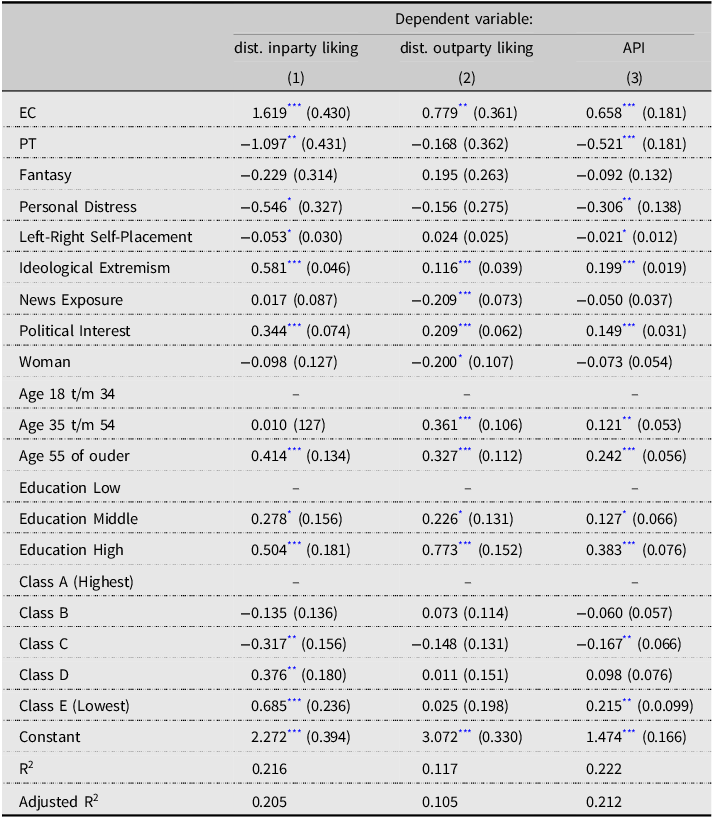
Note: n = 1,258.
A5 Regression results using measures adapted to multiparty systems
Weighted regression results using measurements of SCK
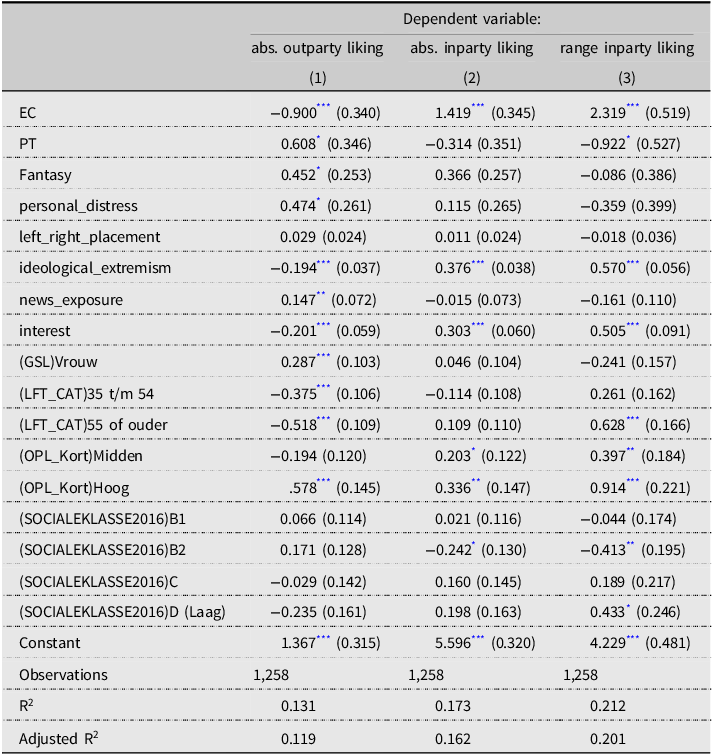
Note:
Weighted results using measurements for multiparty systems

Note:
A6 Full interaction models study 2
Like SCK, we also analyze punishment for the protesting students and sympathy for the struck bystander. Regarding punishment (top right plot), SCK find no significant interaction, and so do we. Yet, both slopes show the same pattern of decreasing confidence intervals at the end. This means that at higher values of EC, our findings and those of SCK indicate that participants support punishing students of the outparty more than students of the inparty (inparty bias). This difference is significantly different from zero, but not significant compared to people scoring lower on EC. Regarding sympathy for the struck bystander, we find that people that score low on EC have more sympathy for the bystander in the outgroup condition than in the ingroup condition (b = 0.423, se = 0.204). This finding is in the opposite direction of our censorship finding. But since SCK report no significant interaction effect, we also have no hypothesis about sympathy.
Mean relative party sympathy evaluation per party voted for.
Note: A score of 0 indicates that, on average for a given voter base, a party is evaluated equivalent to the average evaluation of all parties for that voter base. Parties are ordered from left to right.
We had no hypotheses about the effects on punishment and sympathy. For punishment and sympathy, we find that the ingroup bias decreases for higher values of PT. Yet, because the confidence intervals are relatively wide, the slopes are not statistically significant.
B Appendix Study 2
B1 Ethics
Study 2 has been approved by the ethical review board at the University of Amsterdam (2021-AISSR-14250). To obtain a student sample, we did our own recruitment, asking teachers at two universities to share the link to our research with their students. After clicking on this link, participants were informed about the study protocol and particularly about their anonymity in the process. After that we asked them to give consent to participate in our study. This study contained batteries of standard survey questions and one of the two experimental prompts show in the next section. The experimental prompts use deception as they describe that did not happen. As our goal was to replicate an existing study, we had to use this experimental prompt. In our context, the deception is very mild, as it describes a series of events that do take place at university campuses in our context. At the end of the experiment, participants were debriefed by mentioning that the event did not happen, that the organizations were not real, and we explained the reason why we used deception. Participants were not paid to participate. This was a very short experiment (5 min), and payment would have meant we also had to collect personal data.
B2 Experimental prompts
Below we display an English translation of the experimental prompts we used. The text between the brackets indicates the two different versions.
Association of [Left/Right] Students stops invited [right-wing/left-wing] speaker Protests lead to cancellation of controversial speaker’s lecture.
On Monday, police struggled to break up a large group of students who gathered to protest a lecture scheduled for Tuesday evening. The invited speaker is a social media celebrity known for making inflammatory statements about left-leaning individuals. His social media posts often mock the intelligence of left-leaning individuals and in a recent post said that “there is perhaps nothing more despicable or disgusting than [GroenLinks/PVV] supporters”.
Although the protest, which was organized by the Association of [Left/Right] Students, was mostly peaceful, it became chaotic when bystanders tried to pass through the protesters. Roos, a Bachelor’s student, said she was struck with a sign carried by one of the protesters. “I don’t know if they did it on purpose,” Roos said, “but I was quite annoyed. I also wanted to hear what the speaker has to say.”
Ultimately, the protesters achieved their goal: the event was cancelled. But not everyone is happy with this outcome. A petition on social media is calling for those involved to be punished and to suspend the Association of Left Students, at least for the rest of the year.”
B3 Power analysis
We preregistered to have 900 participants. This was based on a power test based on a simulation we wrote using the Declare Design package in R (Blair et al. Reference Blair, Cooper, Coppock and Humphreys2019). At this stage – to our knowledge – there was no standardized way of identifying power for interaction effects. As such, our power analysis did not follow a validated procedure. Due to various organizational reasons, we initially failed to recruit a sample of 900. At the same time, several procedures to calculate power for interaction effects were validated and published. Therefore, we reassessed our power using the InteractionPoweR package in R, based on the tutorial paper by Baranger et al. (Reference Baranger, Finsaas, Goldstein, Vize, Lynam and Olino2023).
We now assume just 440 participants, but still using the original effect size estimates from the SCK study. Using this we found that our power to replicate the censorship and punishment interaction effects is both 0.99. However, for sympathy and schadenfreude power is insufficient, respectively, at 0.22 and 0.24. This means that in retrospect we are sufficiently powered to assess H3a concerning the effect of censorship, but insufficiently powered to asses H3b concerning the effect of schadenfreude. We did not have hypotheses concerning sympathy and punishment, following SCK.
We have uploaded these power calculations to the paper’s OSF site.
B4 Descriptive statistics
Descriptive statistics for full sample
B5 Regression tables main results
EC, censorship, and schadenfreude
Note: n = 438.
PT, censorship, and schadenfreude
Note: n = 438.


 Open access

