


1. Introduction
The X-ray emission from neutron stars during the first hundreds of years is believed to be powered by magnetic dissipation within their outer crusts (Gourgouliatos, Hollerbach & Archibald Reference Gourgouliatos, Hollerbach and Archibald2018). Since the ions are immobile in neutron star crusts, electric currents are transported by electrons alone (Cho & Lazarian Reference Cho and Lazarian2009). Their velocity is $\boldsymbol {u}=-\boldsymbol {J}/en_e$ , where $\boldsymbol {J}={\boldsymbol {\nabla }}\times \boldsymbol {B}/\mu _0$
 is the current density, $\boldsymbol {B}$
 is the magnetic field, $e$
 is the elementary charge, $n_e$
 is the electron density and $\mu _0$
 is the permeability. The evolution of $\boldsymbol {B}$
 is then governed by the induction equation where the electromotive force $\boldsymbol {u}\times \boldsymbol {B}$
 is given by $-\boldsymbol {J}\times \boldsymbol {B}/en_e$
 . The induction equation therefore takes the form (Goldreich & Reisenegger Reference Goldreich and Reisenegger1992)

where $\eta$ is the magnetic diffusivity. The $\boldsymbol {J}\times \boldsymbol {B}$
 nonlinearity in this equation leads to a cascade toward smaller scales – similar to the turbulent cascade in hydrodynamic turbulence (Goldreich & Reisenegger Reference Goldreich and Reisenegger1992). This model is therefore referred to what is called the Hall cascade. There has been extensive work trying to quantify the amount of dissipation that occurs (Gourgouliatos, Wood & Hollerbach Reference Gourgouliatos, Wood and Hollerbach2016; Gourgouliatos & Hollerbach Reference Gourgouliatos and Hollerbach2018; Gourgouliatos, Hollerbach & Igoshev Reference Gourgouliatos, Hollerbach and Igoshev2020; Igoshev, Popov & Hollerbach Reference Igoshev, Popov and Hollerbach2021; Anzuini et al. Reference Anzuini, Melatos, Dehman, Viganò and Pons2022). Idealized simulations in a Cartesian geometry resulted in power law scaling for the resistive Joule dissipation (Brandenburg Reference Brandenburg2020, hereafter B20). It depends on the typical length scale of the turbulence, the electron density, the magnetic field strength and the presence or absence of magnetic helicity. Denoting volume averages by angle brackets, the decay of the magnetic energy density $\mathcal {E}=\langle \boldsymbol {B}^2\rangle /2\mu _0$
 with time $t$
 tends to follow power law behaviour, $\mathcal {E}\propto t^{-p}$
 , where the exponent $p$
 is smaller than in magnetohydrodynamic (MHD) turbulence. Here, $\langle \cdots \rangle$
 denotes volume averaging over the spatial coordinates $\boldsymbol {x}$
 . In the helical case, it was found that $p=2/5$
 , while for the non-helical case, B20 reported $p\approx 0.9$
 . The correlation length of the turbulence, $\xi$
 , increases with time like $\xi \propto t^q$
 , where $q=2/5$
 in the helical case, i.e. $q=p$
 , and $q\approx 0.3$
 in the non-helical case. In the helical case, the exponent $2/5$
 was possible to explain on dimensional grounds by noting that the magnetic field does not correspond to a speed (the Alfvén speed, as in MHD) with dimensions ${\rm m}\ {\rm s}^{-1}$
 in SI units, but to a diffusivity with dimensions ${\rm m}^2\ {\rm s}^{-1}$
 .
.
The decay properties of the non-helical Hall cascade were not yet theoretically understood at the time. In the last one to two years, however, significant progress has been made in describing the decay of magnetically dominated turbulence, where a new conserved quantity has been identified, which is now called the Hosking integral (see Zhou, Sharma & Brandenburg (Reference Zhou, Sharma and Brandenburg2022), for details regarding the naming). The purpose of the present paper is to propose the scaling of the Hall cascade under the assumption that it is governed by the constancy of the Hosking integral, which now has different dimensions than in MHD.
2. Hosking integral and scaling for the Hall cascade
The Hosking integral $I_{H}$ is defined as the asymptotic limit of the magnetic helicity density correlation integral ${\mathcal {I}}_{H}(R)$
 for scales $R$
 large compared with the correlation length of the turbulence, $\xi$
 , but small compared with the system size $L$
 . The original work on this integral is that by Hosking & Schekochihin (Reference Hosking and Schekochihin2021), who subsequently applied it to the magnetic field decay in the early universe (Hosking & Schekochihin Reference Hosking and Schekochihin2022); see also Brandenburg, Kahniashvili & Tevzadze (Reference Brandenburg, Kahniashvili and Tevzadze2015) and Brandenburg & Kahniashvili (Reference Brandenburg and Kahniashvili2017) for earlier work where inverse cascading of magnetically dominated non-helical turbulence was first reported. The function ${\mathcal {I}}_{H}(R)$
 is given by

where $V_R$ is the volume of a ball of radius $R$
 and $h=\boldsymbol {A}\boldsymbol {\cdot }\boldsymbol {B}$
 is the magnetic helicity density with $\boldsymbol {A}$
 being the magnetic vector potential, so $\boldsymbol {B}={\boldsymbol {\nabla }}\times \boldsymbol {A}$
 . We recall that $\langle \cdots\kern0.7pt \rangle$
 denotes averaging over $\boldsymbol {x}$
 . The function ${\mathcal {I}}_{H}(R)$
 is thus the integral over the volume $V_R=4{\rm \pi} R^3/3$
 . For small $R$
 , it increases proportional to $R^3$
 , but for large $R$
 , it levels off. This is the value of $R$
 which determines the Hosking integral $I_{H}\equiv {\mathcal {I}}_{H}(R)$
 . In practice, it is chosen empirically and must still be small compared with the size of the domain; see Hosking & Schekochihin (Reference Hosking and Schekochihin2021) for various examples and Zhou et al. (Reference Zhou, Sharma and Brandenburg2022) for a comparison of different computational techniques for obtaining ${\mathcal {I}}_{H}(R)$
 .
.
What matters for the Hall cascade is the fact that the dimensions of $h$ are $[h]=[B]^2[x]$
 , and therefore the dimensions of ${\mathcal {I}}_{H}$
 and $I_{H}$
 are
are

However, as already noted in B20, using $e=1.6\times 10^{-19}\ {\rm A} {\rm s}$ , $\mu _0=4{\rm \pi} \times 10^{-7}\ {\rm T}\ {\rm m}\ {\rm A}^{-1}$
 and $n_e\approx 2.5\times 10^{40}\ {\rm m}^{-3}$
 for neutron star crusts, we have $en_e\mu _0\approx 5\times 10^{15}\ {\rm T}\ {\rm s}\ {\rm m}^{-2}$
 , and therefore

which is why we say $B$ has dimensions of ${\rm m}^2\ {\rm s}^{-1}$
 .Footnote 1 Therefore, the dimensions of $I_{H}$
 are
are

Thus, given that $I_{H}={\rm const.}$ in the limit of small magnetic diffusivity, a self-similar evolution must imply that all relevant length scales, and in particular the magnetic correlation length $\xi (t)$
 , must increase with time like $\xi \sim t^{4/13}$
 . Since $4/13\approx 0.31$
 , this is indeed close to the behaviour $\xi \sim t^q$
 with $q\approx 0.3$
 found in § 3.2 of B20 (their Run B), as already highlighted in the introduction of the present paper.
To demonstrate that the energy spectra $E(k,t)$ at different times are indeed self-similar, we collapse them on top of each other by plotting them versus $k\xi (t)$
 . Here, $\xi (t)=\mathcal {E}^{-1}\int k^{-1} E(k,t)\,{\rm d} k$
 is the weighted integral of $k^{-1}$
 , where the spectra are normalized such that $\int E(k,t)\,{\rm d} k=\mathcal {E}(t)$
 is the magnetic energy density. This ensures that the maxima of $E(k\xi )$
 are always approximately near $k\xi (t)=1$
 . In addition, we must also compensate for the decay in amplitude by multiplying the spectra by a time-dependent function, e.g. $\xi (t)^\beta$
 , where $\beta$
 is a suitable exponent, so that the compensated spectra all have the same height. In this way, we find a universal spectral function by plotting

As an example, we show in figure 1 the compensated spectra for Run B of B20, which we discuss in more detail below. At this point, we just note that these were solutions to (1.1), where the initial condition consists of a non-helical magnetic field with a spectrum $E(k)\propto k^4$ for $k\ll k_0$
 , with $k_0$
 being the initial peak wavenumber. For $k\gg k_0$
 , we assume a decaying spectrum, here with $E(k)\propto k^{-5/3}$
 , although this particular choice of the exponent was not important. After some time, the spectral slopes of both subranges change: at small $k$
 , the spectrum steepens from $k^4$
 to $k^5$
 . Beyond the peak, it falls off with a $k^{-7/3}$
 inertial range, as was already found by Biskamp, Schwarz & Drake (Reference Biskamp, Schwarz and Drake1996).
Compensated spectra for Run B of B20, which corresponds to Run B1 in the present paper. Here, $\beta =1.7$ has been used as the best empirical fit parameter.

To determine the theoretically expected value of $\beta$ , we invoke the condition that the compensated spectra be invariant under rescaling, $t\to \tau t'$
 , $\boldsymbol {x}\to \tau ^q\boldsymbol {x}'$
 , where $\tau$
 is an arbitrary scaling factor. We recall that the dimensions of $E(k,t)$
 are $[x]^5[t]^{-2}$
 , so rescaling yields a factor $\tau ^{5q-2}$
 . In addition, expressing $E'$
 in terms of its universal spectral function $\phi (k\xi )$
 , the factor $\xi ^\beta$
 on the left-hand side of (2.5) produces a factor $\xi ^{-\beta }$
 on the right-hand side of (2.5), and therefore, after rescaling, a $\tau ^{-\beta q}$
 factor, i.e.

Therefore, $5q-2=-\beta q$ must be satisfied in order that the compensated spectra remain invariant under rescaling. Thus, $\beta =2/q-5$
 , as already found in B20. Inserting now $q=4/13$
 yields $\beta =3/2$
 . The total magnetic energy density is therefore

and since $\mathcal {E}\propto t^{-p}$ , we haveFootnote 2 $p=(\beta +1) q$
 . Using $\beta =2/q-5$
 , we have $p=2 (1-2q)$
 ; see (28) of B20. For $q=4/13\approx 0.31$
 , we have $p=2 (1-8/13)=10/13\approx 0.78$
 , which is not quite as close to the value reported in B20 as that of $q$
 , but this could be ascribed to the lack of scale separation and also the magnetic field no longer being strong enough so that the Lundquist number,Footnote 3

is no longer in the asymptotic regime. This also resulted in the empirical value of $\beta$ being slightly larger than the theoretical one, as we will see next.
3. Comparison with simulations for different diffusivities
In B20, various simulations of the Hall cascade have been presented, including forced and decaying simulations, helical and non-helical ones, with constant and time-varying magnetic diffusivities, with and without stratification, etc. The main purpose of that work was to understand the dissipative losses that would lead to resistive heating in the crust of a neutron star. One of those simulations is particularly relevant for the present paper: his Run B, which had a relatively strong initial magnetic field, no helicity, large scale separation and a magnetic diffusivity that decreased with time in a power law fashion, allowing the simulation to retain a higher Lundquist number as the magnetic field decreases.
In the present paper, we analyse his Run B, which is here called Run B1. It is actually a new run, because we now have calculated the Hosking integral during run time. We also compare with another run (Run B2), where we decreased the magnetic diffusivity by a factor of two. As in B20, $\eta$ is assumed to decrease with time proportional to $t^{-3/7}$
 . We kept, however, the same resolution of $1024^3$
 mesh points for both runs, but we must keep in mind that this can lead to artefacts resulting from a poorly resolved diffusive subrange for Run B2.
In table 1, we compare several characteristic parameters: the start and end times, $t_1$ and $t_2$
 , respectively, of the interval for which averaged data have been accumulated, non-dimensional measures of the magnetic diffusivity, the magnetic field strength and the dissipation, $\tilde {\eta }$
 , $\tilde {B}_{\rm rms}$
 and $\tilde {\epsilon }$
 , respectively, and the instantaneous scaling exponents $p$
 , $q$
, $q$ and $\beta$
 . For $\tilde {\eta }$
 , $\tilde {B}_{\rm rms}$
 and $\tilde {\epsilon }$
 , we compute the following time-averaged ratios:

where $\xi (t)={\mathcal {E}}^{-1}\int k^{-1} E(k,t)\,{\rm d} k$ is the correlation length and $\epsilon =\eta \mu _0\langle \boldsymbol {J}^2\rangle$
 is the magnetic dissipation with $\eta =\eta (t)$
 , as noted above. These were also computed in B20. Time is given in diffusive units, $[t]=(\eta k_0^2)^{-1}$
 . In the runs of series B of B20, the value of $k_0$
 is 180 times larger than the lowest wavenumber $k_1\equiv 2{\rm \pi} /L$
 of our cubic domain of size $L^3$
 .
.
Summary of runs discussed in this paper.

It turns out that a lower resistivity is important for obtaining the expected scaling. We therefore now consider Run B2, where ${\rm Lu}\approx 1300$ . The result is shown in figure 2, where we used $\beta =1.6$
 as the best fit, which is still slightly larger than the expected value of 3/2, but it goes in the right direction. Therefore, we show in figure 2 the resulting compensated spectra for Run B2, where the magnetic diffusivity is half that of Run B1 and ${\rm Lu}$
 is now twice as large a before; see table 1. We use the Pencil Code (Pencil Code Collaboration et al. 2021) and, in both cases, we use a resolution of $1024^3$
 mesh points.
Compensated spectra for Run B2.

Another comparison between Runs B1 and B2 is shown in figure 3, where we compare their evolution in the $pq$ diagram. While Run B1 clearly evolves along the $\beta \approx 1.7$
 line, Run B2 tends to be closer to the $\beta \approx 3/2$
 line. Note also that both runs settle near the $p=2(1-2q)$
 self-similarity line (B20), although we begin to see departures near the end of the run, which is due to the finite size of the domain.
The $pq$ diagrams for Runs B1 (open red symbols) and B2 (closed blue symbols). Larger symbols denote later times.

Finally, we show in figure 4 the scalings of $I_{H}(t)$ , where we see that the decay exponent $p_{H}\equiv -{\rm d}\ln I_{H}/{\rm d}\ln t$
 is approximately $p_{H}\approx 0.16$
 for Run B1 and approximately $0.11$
 for Run B2. Earlier work by Zhou et al. (Reference Zhou, Sharma and Brandenburg2022) showed that $p_{H}$
 decreases as the Lundquist number increases, and is, in MHD, approximately 0.2 for ${\rm Lu}\approx 10^3$
 , and decreases to $p_{H}\approx 0.01$
 for ${\rm Lu}\approx 4\times 10^7$
 . Such large values can currently only be obtained with magnetic hyper-diffusivity (Hosking & Schekochihin Reference Hosking and Schekochihin2021; Zhou et al. Reference Zhou, Sharma and Brandenburg2022), but this has not been attempted in the present work.
Evolution of $I_{H}(t)$ , showing first a slight increase and then a decline proportional to $t^{-0.16}$
 for Run B1 and proportional to $t^{-0.11}$
 for Run B2. The inset shows the evolution of ${\mathcal {I}}_{H}(R;t)$
 as a function of $R$
 for increasing values of $t$
 (indicated by the arrow) for Run B2. The abscissae of the main plot and the inset are normalized by $\eta k_0^2$
 and $k_0$
 , respectively.

As already noted by Zhou et al. (Reference Zhou, Sharma and Brandenburg2022), there is an initial increase in $I_{H}(t)$ . This is explained by the fact that the magnetic field obeys Gaussian statistics initially, but not during the later evolution. The inset shows the $R$
 dependence of ${\mathcal {I}}_{H}(R;t)$
 for different $t$
 . The relevant value of $R$
 is deemed to be at the location where the local slope of ${\mathcal {I}}_{H}(R)$
 is minimum at late times.
4. Conclusion
The present work has highlighted the power of dimensional arguments, which were here applied to the case of the Hall cascade without helicity, where the magnetic field is naturally represented as a quantity with units of a magnetic diffusivity. The magnetic helicity density has units of ${\rm m}^5\ {\rm s}^{-2}$ and the Hosking integral has units of ${\rm m}^{13} {\rm s}^{-4}$
 , which yields $q=4/13$
 , $\beta =3/2$
 and $p=10/13$
 . Comparing with standard MHD, where the magnetic field has units of ${\rm m}\ {\rm s}^{-1}$
 , our exponents $p$
 and $q$
 are now smaller, but $\beta$
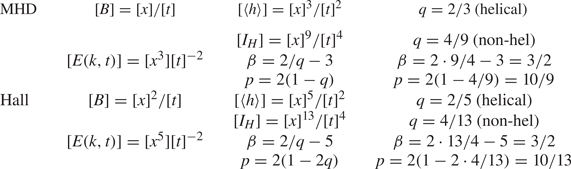
 is still the same in both cases; see table 2 for a comparison between Hall cascade and MHD. The empirically determined value of $\beta$
 is somewhat larger, but this can be explained by finite scale separation and small Lundquist numbers.
Comparison of the scalings for MHD and the Hall cascade.
The decay properties of the Hall cascade are important in understanding resistive heating in neutron stars while producing at the same time larger scale magnetic fields at a certain speed through inverse cascading (B20). Such simulations have already been done in a spherical geometry (Gourgouliatos et al. Reference Gourgouliatos, Hollerbach and Igoshev2020), but the magnetic field in those simulations did not yet exhibit clear forward or inverse cascading. This is presumably due to their initial magnetic field being strongly localized at intermediate length scales. Using an initial broken power law, as done here, would help producing the expected forward or inverse cascadings, but this may also require much larger resolution than what is currently possible. Similarly, of course, the values of $n_e$ and $\eta$
 are depth dependent in real neutron stars, but the work of B20 showed that this did not affect the scaling behaviour of the magnetic decay. Therefore, the importance of the Hosking integral may well carry over to real neutron stars.
The possible role of reconnection in the Hall cascade remains an open question. In the case of MHD, reconnection has been discussed extensively by Hosking & Schekochihin (Reference Hosking and Schekochihin2021), making reference to earlier work by Zhou et al. (Reference Zhou, Bhat, Loureiro and Uzdensky2019), Zhou, Loureiro & Uzdensky (Reference Zhou, Loureiro and Uzdensky2020) and Bhat, Zhou & Loureiro (Reference Bhat, Zhou and Loureiro2021). Also, in the Hall cascade there is the possibility that the decay of $\mathcal {E}$ could be slowed down in an intermediate range of values of the Lundquist number. As shown in Zhou et al. (Reference Zhou, Sharma and Brandenburg2022), this could lead to a termination line in the $pq$
 diagrams that is different from the $p=2(1-2q)$
 self-similarity line discussed here. At the moment, however, there is no compelling evidence for deviations of the solutions from the self-similarity line.
Acknowledgements
I would like to thank the Isaac Newton Institute for Mathematical Sciences, Cambridge, for support and hospitality during the programme ‘Frontiers in dynamo theory: from the Earth to the stars’ where the work on this paper was undertaken. I am also grateful to Andrei Igoshev for encouraging discussions and the two referees for their comments, which have led to improvements in the presentation.
Editor Alex Schekochihin thanks the referees for their advice in evaluating this article.
Declaration of interests
The authors declare no conflict of interest.
Funding
This work was supported by EPSRC grant no EP/R014604/1 and the Swedish Research Council (Vetenskapsrådet, 2019-04234). Nordita is sponsored by Nordforsk. We acknowledge the allocation of computing resources provided by the Swedish National Allocations Committee at the Center for Parallel Computers at the Royal Institute of Technology in Stockholm and Linköping.
Data availability statement
The data that support the findings of this study are openly available on Zenodo at doi:10.5281/zenodo.7357799 (v2022.11.24). All calculations have been performed with the Pencil Code (Pencil Code Collaboration et al. 2021); doi:10.5281/zenodo.3961647.


 Open access