





Globally, excessive salt intake is recognised as a public health issue(Reference Santos, Li and Huang1). In 2013, the WHO recommended for a 30 % reduction in daily salt intake, aiming for a population salt reduction target of less than 5 g per day per individual by 2025, as a global salt reduction initiative(2). To achieve this goal, a series of salt reduction strategies have been promoted in China(Reference Jin, Xie and Wu3). Regularly monitoring population salt (Na) intake(Reference Hu, Zhang and Ma4) is a common approach to assess the effectiveness of salt reduction strategies(Reference Mann and Gerber5). While 24-h urine collection is esteemed as the gold standard for assessing population Na intake, its practicality in extensive epidemiological research(Reference Kamińska, Dymicka-Piekarska and Tomaszewska6) is curtailed by inherent challenges such as the significant burden of collection, elevated costs and the prevalence of incomplete collections(Reference Kamińska, Dymicka-Piekarska and Tomaszewska6). The measurement of Na in a spot urine has the potential to estimate the 24-h urinary Na (24hUNa)(Reference Tan, Wang and Song7), when assessing Na intake at the population level(Reference Huang, Trieu and Yoshimura8). Currently, there are three widely used formulas estimating 24hUNa from spot urine samples among Chinese population including the Kawasaki formula(Reference Kawasaki, Itoh and Uezono9), the Tanaka formula(Reference Tanaka, Okamura and Miura10) and the INTERSALT formula(Reference Brown, Dyer and Chan11). The appropriateness of the three formulas has not been systematically evaluated due to their diverse predictive results in different studies(Reference Han, Sun and Chen12–Reference Sun, Wang and Liang19). The aim of this meta-analysis is to identify which formula could produce a more accurate estimate in the Chinese population.
Methods
Databases and search terms
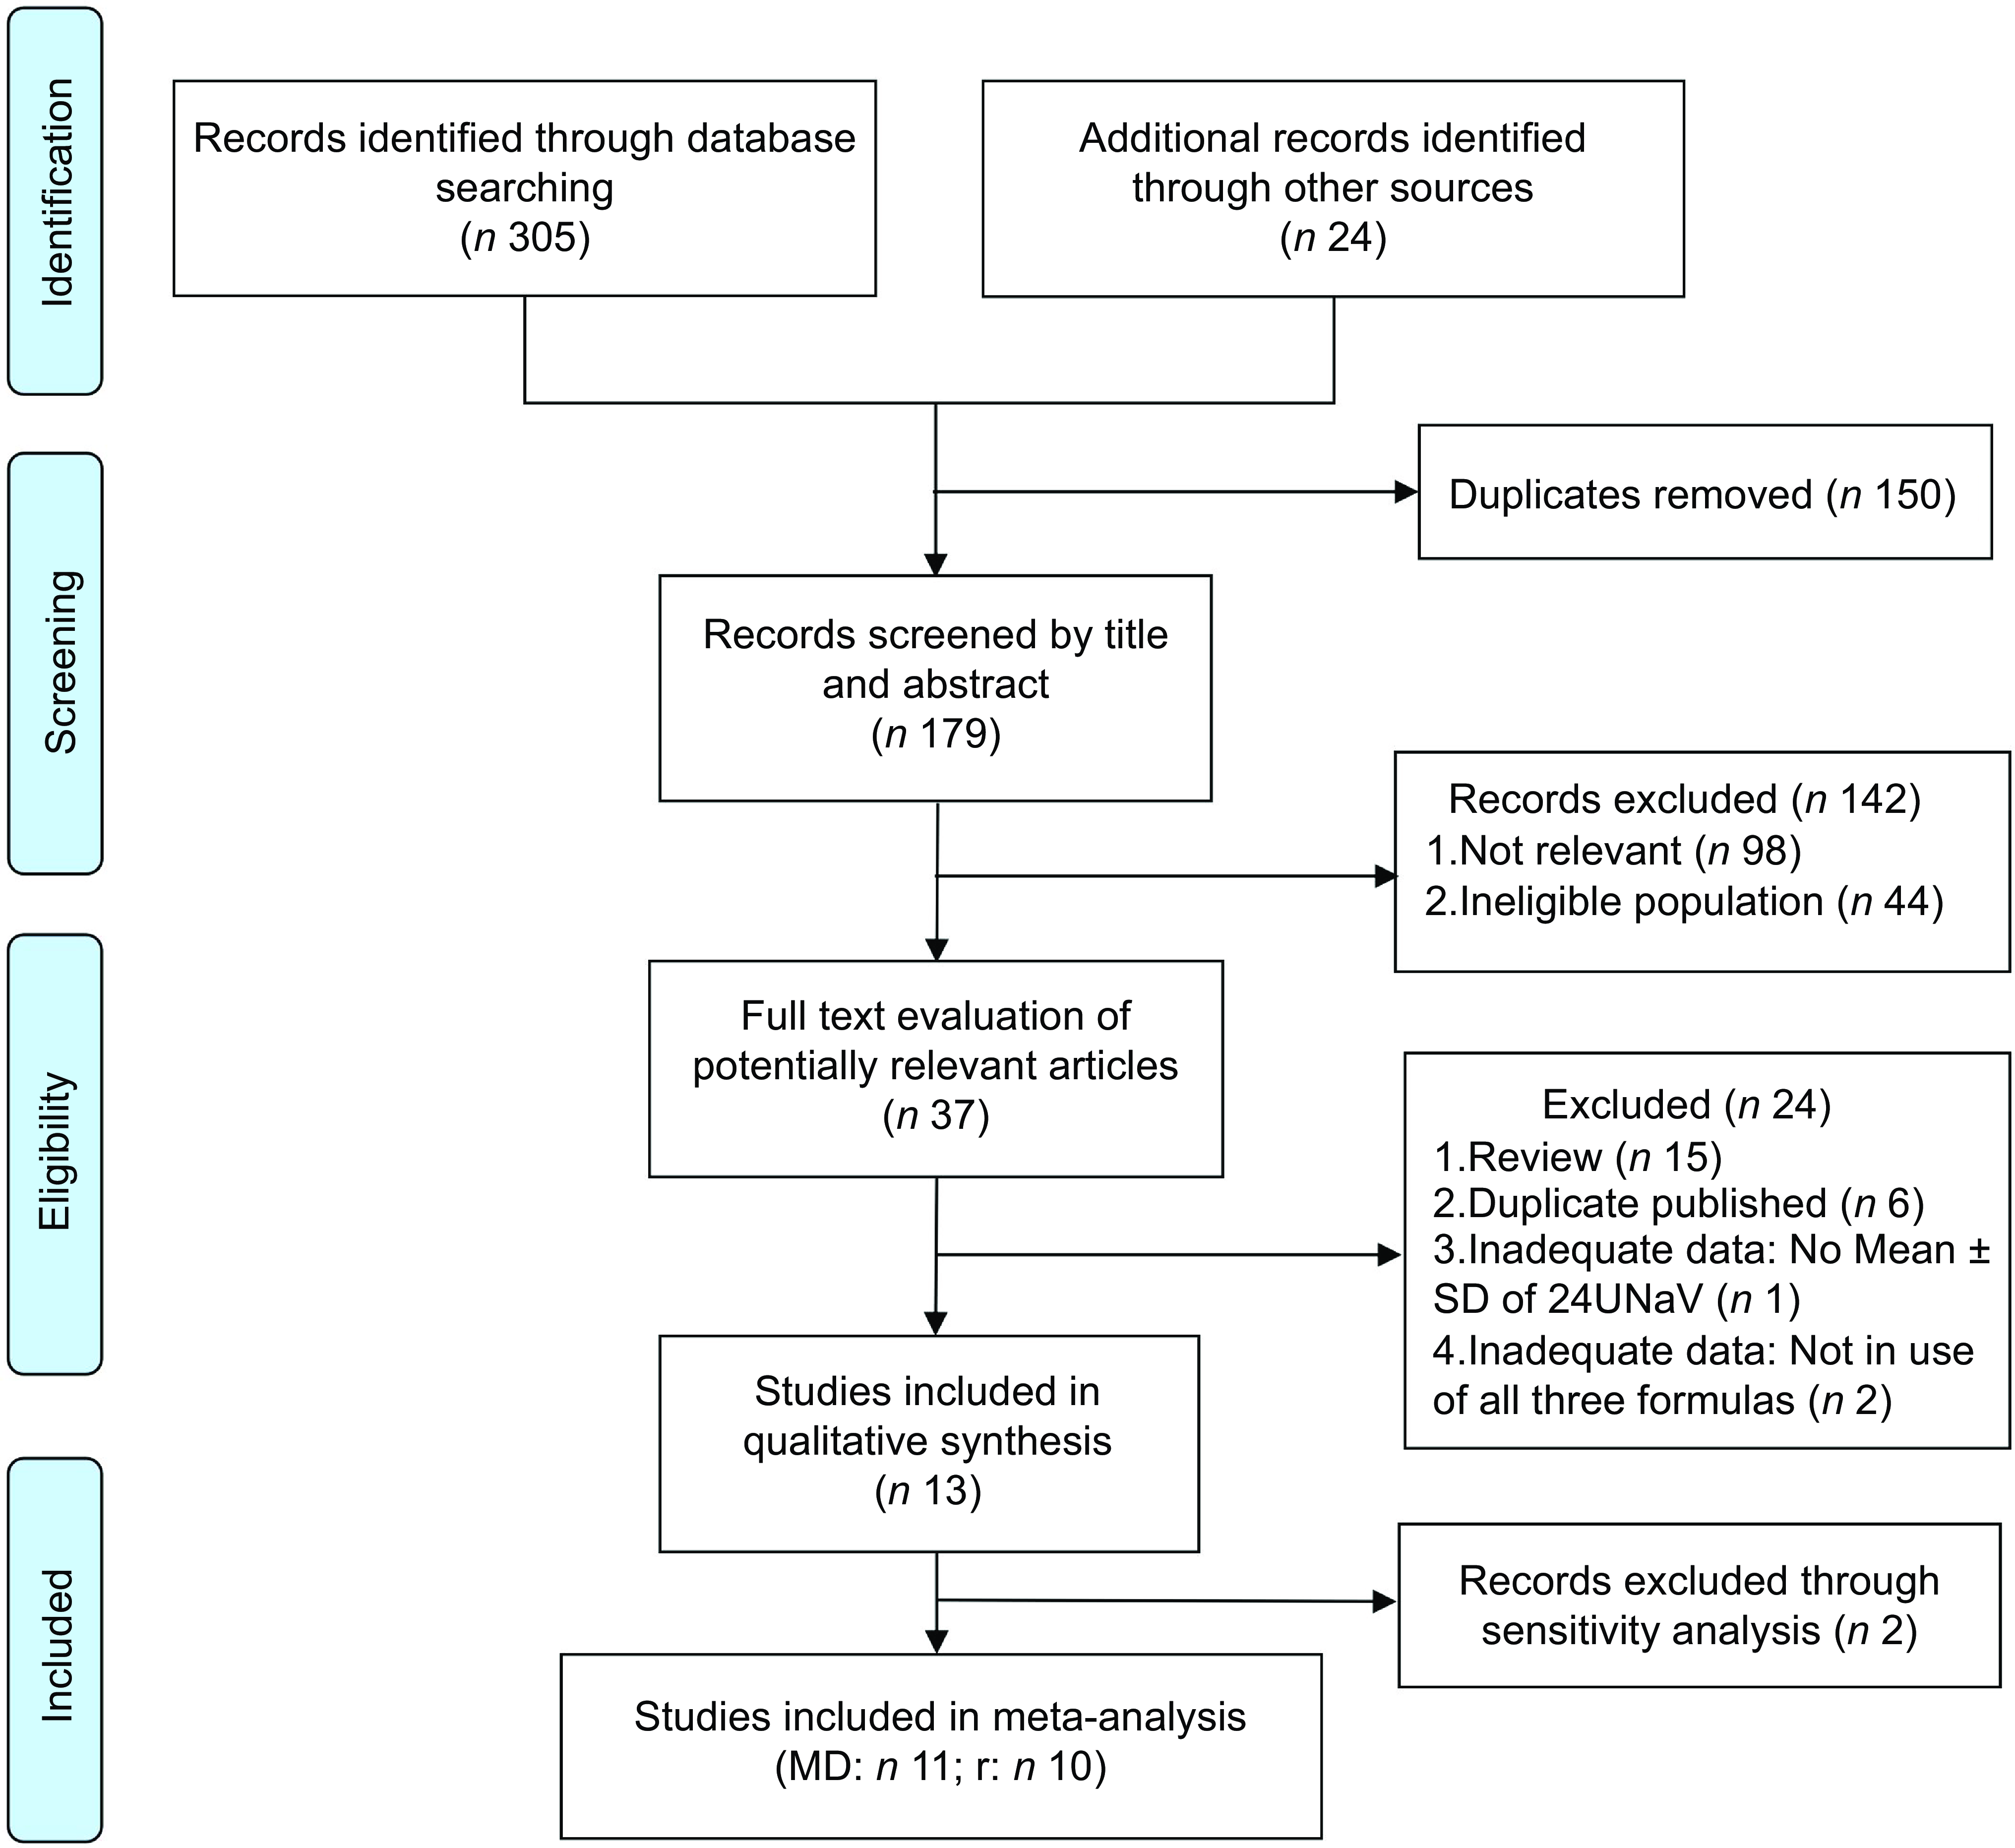
The systematic review was guided by the Preferred Reporting Items for Systematic Reviews and Meta-Analyses checklist(Reference Page, McKenzie and Bossuyt20). A combination of terms was used to search the titles and abstracts of publications in PubMed, Embase and the Cochrane library, including ‘spot urine’ AND ‘sodium’ AND ‘China’ (Chinese residents). Search results were imported to EndNote X9 (Clarivate Analytics, 2019) for screening and extraction. The literature screening process is illustrated in Fig. 1.
PRISMA flow diagram of the screening procedure followed to identify eligible studies. PRISMA, Preferred Reporting Items for Systematic Reviews and Meta-Analyses; MD, mean difference; r, correlation coefficient
Inclusion and exclusion criteria
All eligible studies need to meet the criteria below:
-
(1) Type of participants. Participants included healthy or high-risk people of any age from any region of China; and
-
(2) Type of outcome measures. Studies reported mean Na intake by estimation of spot urine and 24-h urine collection specimens at the same time; and
-
(3) Method of validation. The Kawasaki, Tanaka and the INTERSALT formulas were used to report the estimates and measures (mean ± sd) at the same time; and
-
(4) Language. All studies were published in English; and
-
(5) Studies were eligible if published before November 2022.
Studies were excluded if they did not provide the measure of 24hUNa and estimates from spot urine using the three formulas simultaneously.
Study screening and data extraction
All titles and abstracts of included studies were initially screened by two reviewers (ZQ, ST), and the full text of potentially relevant articles was further reviewed. Then, the two reviewers independently extracted relevant data as follows: the first author, publication year, area studied, study population, sample size, female proportion, mean age (age range), fasting or not, type of spot urine sample, measured 24hUNa (mean ± sd), the formula used, estimated 24hUNa (mean ± sd) and correlation coefficients (r). Reviewers resolved disagreements through consulting senior researchers (ZL) if necessary, during the study screening, review and data extraction. Details of the included thirteen studies are summarised in Table 1.
Characteristics of included studies
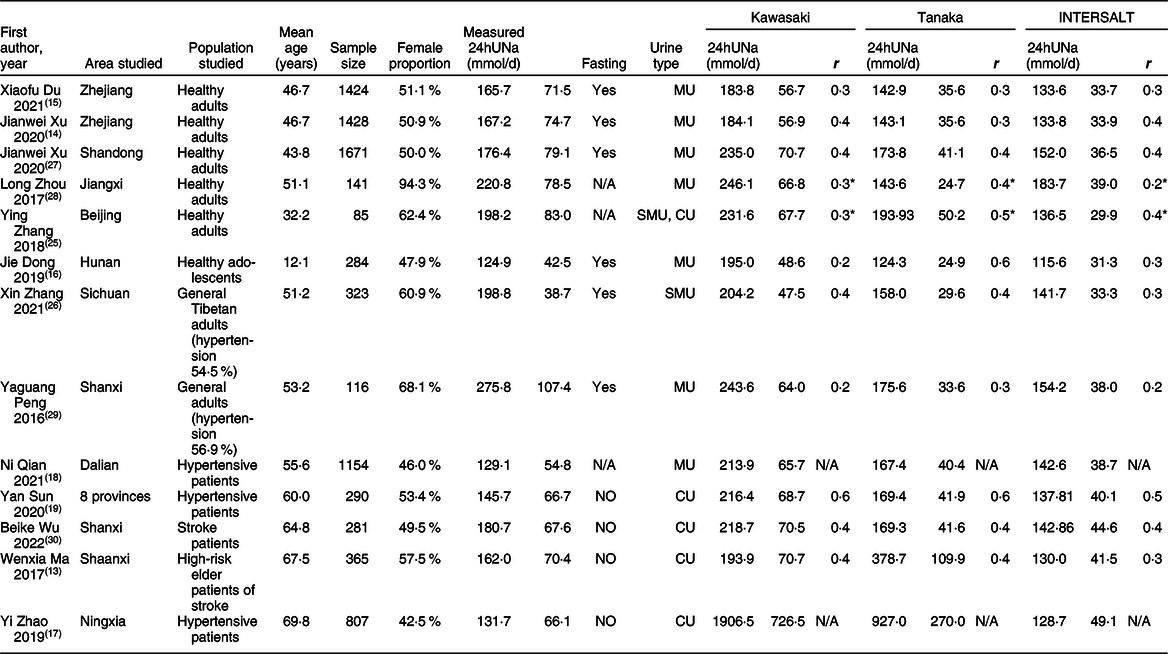
24hUNa, 24-h urinary Na; MU, morning urine; SMU, second morning urine; CU, casual spot urine; r, Pearson correlation coefficient between measured and formula-based estimated 24hUNa excretion, except for Spearman correlation efficient with *; N/A, no statistic.
Statistical analysis
Pooled mean difference (MD) and pooled r-Fisher’s Z of the three formulas were calculated using the Sidik–Jonkman method(Reference Sidik and Jonkman21) for random-effect models. Sensitivity analyses were carried out by the ‘leave-one-out’ method, which removed one study at a time to check the robustness of the result. If the pooled results showed relatively large biases when a study was excluded, it suggests that the study had a significant impact on the overall results of meta-analysis, leading to its exclusion. Heterogeneity between studies was reflected by I 2 tests. Subgroup analyses were also implemented to detect potential sources of heterogeneity: (1) population subgroup (healthy or high-risk population), (2) Na intake subgroup (more than 10 g/d group or no more than 10 g/d group) and (3) urine sample type subgroup (casual spot urine, morning urine or fasting morning urine). The meta-analysis was conducted at the population level using software RevMan 5.3 (Computer program, version 5.3. Copenhagen: The Nordic Cochrane Centre, The Cochrane Collaboration, 2014) and Prism 9.3.1 (GraphPad Software).
Na excretions were converted into mmol/d for consistency, using the following equations: 1 mmol Na = 23 mg Na and 1 mg Na = 2·54 mg salt(Reference Santos, Li and Huang1). Spearman correlation coefficients were converted to Pearson correlation coefficients for consistency using the following equations: r = 2×sin(rs × π/6)(Reference Rupinski and Dunlap22). Correlation coefficients (r) reported in each study were converted into Fisher’s Z using the following specific formula(Reference Cheung and Vijayakumar23). The conversion formula between the correlation coefficient and Fisher’s Z is as follows: Z = 0·5×[ln(1 + r)–ln(1–r)]. The variance of Z is: Vz = 1/ (n–3). The standard error of Z is: SEz = √ Vz.
Quality assessment
Study quality was independently assessed by two reviewers (ZQ, ST) using a modified tool for evaluating dietary intake validation studies(Reference Serra-Majem, Frost Andersen and Henríque-Sánchez24). The tool rates the studies through five domains on a scale from 0 (poorest quality) to 7 (highest quality), with the following interpretations: excellent if the score ≥5·0; good if ≥3·5 and <5·0; acceptable or reasonable if ≥2·5 and <3·0; and poor if <2·5.
The quality assessment domain was modified to facilitate the estimated 24hUNa by spot urine(Reference Santos, Li and Huang1), through the consideration of variables as below: (1) sample, with a maximum of 1 point: 0·5 point when the sample size was of more than 100 individuals; and 0·5 point allocated when the sample was homogeneous for sex, age and population; otherwise, sample was considered non-homogeneous and given a score of 0; (2) statistics. A maximum of 3 points was allocated; 1 for MD between estimated and measured values; 0·5–1 point according to the correlation used (r, ICC); 0·5–1 according to the agreement used Bland–Altman plots or rate of misclassification. (3) Data collection with a maximum of 1 point: 0·5 point if verbal or written instructions were conducted to collect urine to the participants; plus 0·5 when spillage or missed voids were assessed post-collection. (4) Seasonality. Addition of 0·5 point only when considered in the validation design. (5) Supplements. Addition of 1·5 points when the validation study considered supplements. The results of quality assessment are shown in Table 2.
Quality assessment of the included studies
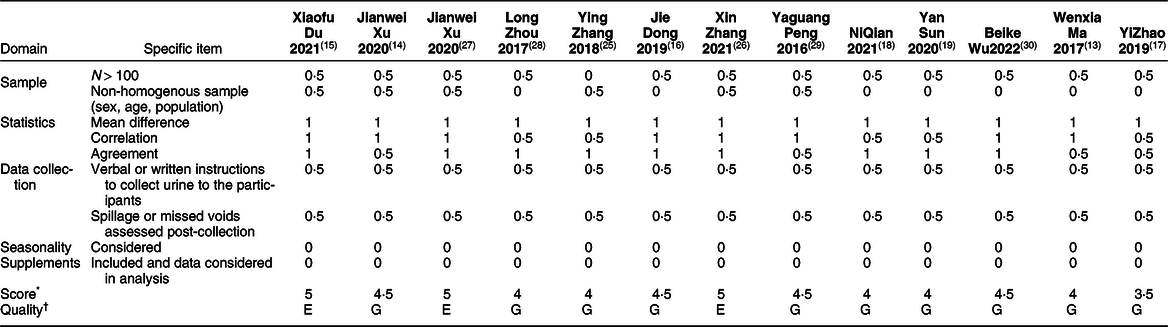
* Score interpretations: ≥5·0, excellent quality; ≥3·5 and < 5·0, good quality; ≥2·5 and < 3·5, acceptable quality; < 2·5, poor quality.
† E, excellent; G, good.
Results
Literature selection
One hundred seventy-nine articles were retrieved initially, of which 142 articles were excluded, leaving thirty-seven studies for full-text review. Finally, thirteen studies were included in this review, and eleven studies were conducted in the meta-analysis. The study selection process is presented in Fig. 1.
Study characteristics
Through literature selection, thirteen studies involving 8369 participants from fifteen provinces of China (Beijing(Reference Sun, Wang and Liang19,Reference Zhang, Peng and Li25) , Shanghai(Reference Sun, Wang and Liang19), Tianjin(Reference Sun, Wang and Liang19), Sichuan(Reference Sun, Wang and Liang19,Reference Zhang, Liao and Ye26) , Shandong(Reference Sun, Wang and Liang19,Reference Xu, Zhang and Liu27) , Henan(Reference Sun, Wang and Liang19), Xinjiang(Reference Sun, Wang and Liang19), Gansu(Reference Sun, Wang and Liang19), Zhejiang(Reference Xu, Du and Bai14,Reference Du, Fang and Guo15) , Jiangxi(Reference Zhou, Tian and Fu28), Hunan(Reference Dong, Yan and Fan16), Shanxi(Reference Peng, Li and Wang29,Reference Wu, Yang and Ren30) , Dalian(Reference Qian, Jiang and Wang18), Ningxia(Reference Zhao, Liu and Liu17), Shaanxi(Reference Ma, Yin and Zhang13)) were initially included. Among all included studies, six (46·15 %) were conducted in the healthy population(Reference Xu, Du and Bai14–Reference Dong, Yan and Fan16,Reference Zhang, Liao and Ye26–Reference Zhou, Tian and Fu28) , seven (53·85 %) included the high-risk population, five (38·46 %) were associated with the hypertensive patients(Reference Han, Sun and Chen12,Reference Zhao, Liu and Liu17,Reference Qian, Jiang and Wang18,Reference Zhang, Liao and Ye26,Reference Peng, Li and Wang29) and two (15·38 %) involved the stroke high-risk population(Reference Ma, Yin and Zhang13,Reference Wu, Yang and Ren30) . Twelve studies (92·31 %) recruited adults, while one focused on adolescents(Reference Dong, Yan and Fan16). The detailed characteristics of included thirteen studies are presented in Table 1.
Quality assessment
All included studies were of good quality, with three studies rated as excellent and the others as good. The details are presented in Table 2.
Sensitivity analyses
As shown in Fig. 2, sensitivity analysis using the ‘leave-one-out’ approach excluded Yi Zhao et al.’s study(Reference Zhao, Liu and Liu17)and Wenxia Ma et al.’s study(Reference Ma, Yin and Zhang13) which had great impact on the robustness of the overall results. Table 3 shows the impact of the two excluded studies on the meta-analysis.
Sensitivity analyses in use of the ‘leave-one-out’ method: pooled estimates were from random-effects models with removing one study at a time
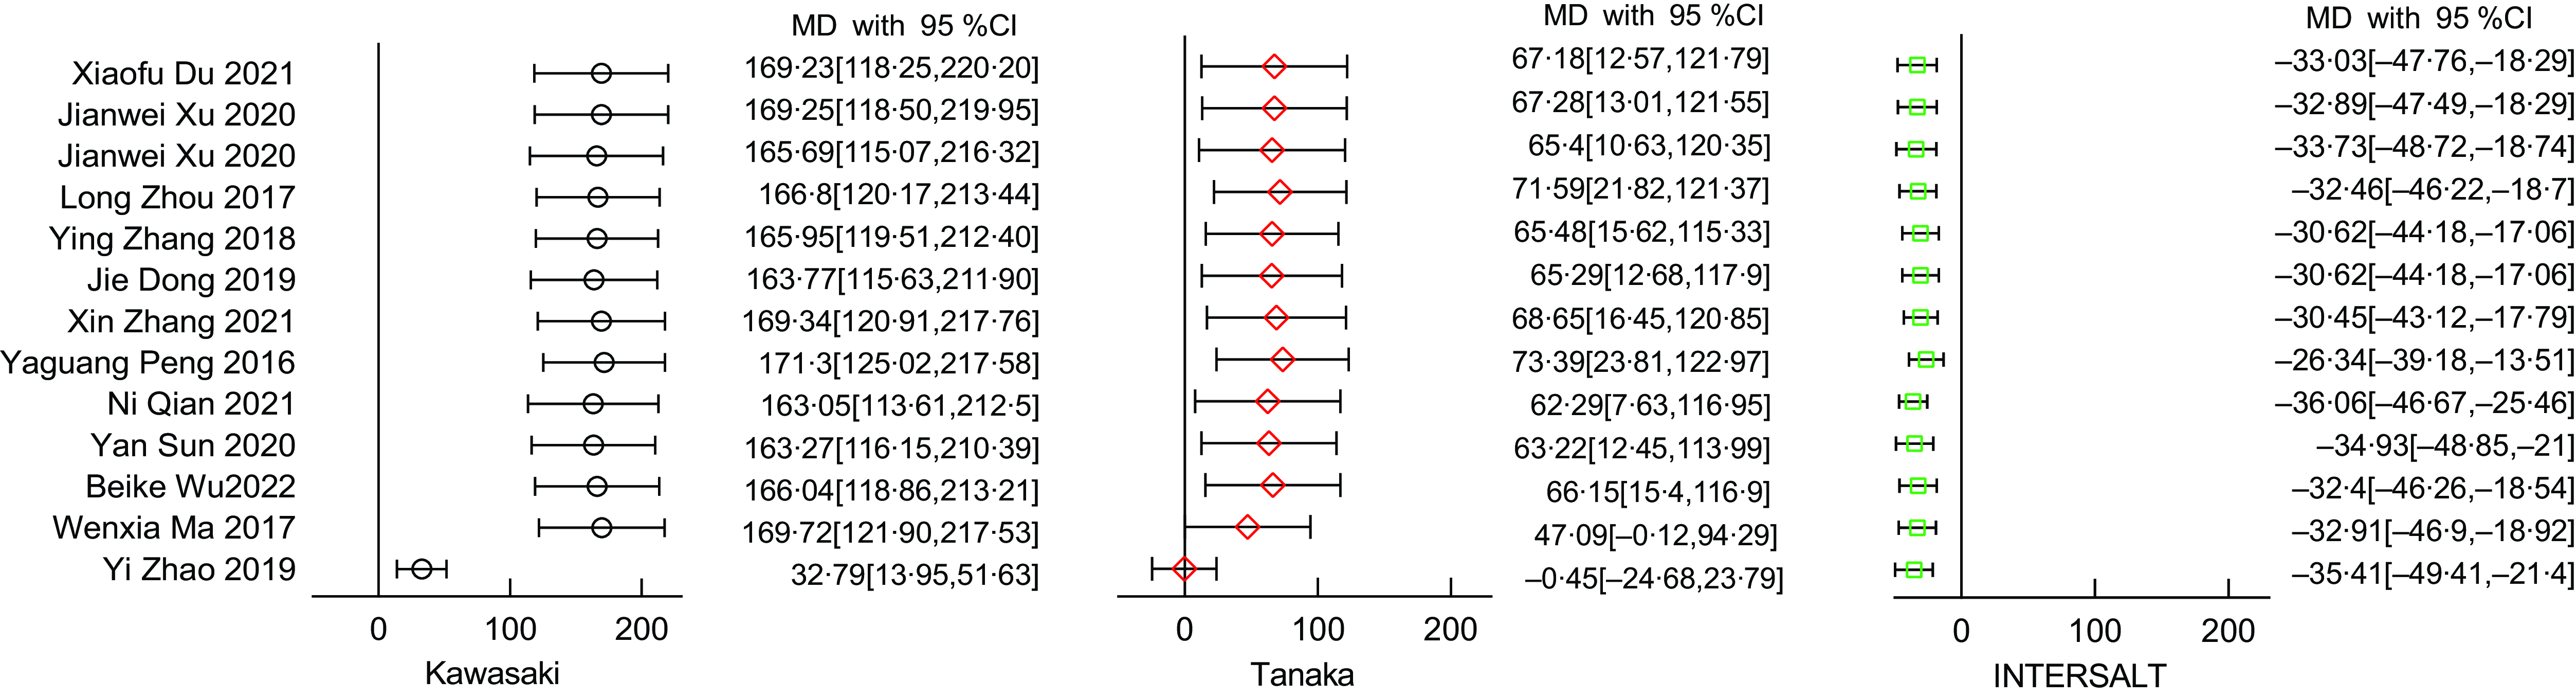
Sensitivity analyses of mean difference (MD) in different formulas
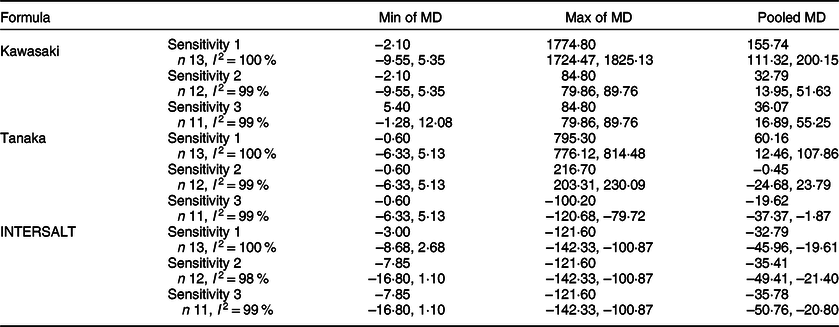
Sensitivity 1, including all available thirteen studies; Sensitivity 2, excluded one study(Reference Zhao, Liu and Liu17) that had a large impact on the overall results from thirteen studies; Sensitivity 3, excluded two studies(Reference Ma, Yin and Zhang13,Reference Zhao, Liu and Liu17) that had large impacts on the overall results from thirteen studies.
Overall result


The final meta-analysis as shown in Fig. 3, which included eleven studies and 7197 participants, observed a MD of 36·07 mmol/d (95 %CI: 16·89, 55·25) in the Kawasaki formula, –19·62 mmol/d (95 %CI –37·37, –1·87) in the Tanaka formula, and –35·78 mmol/d (95 %CI −50·76, –20·80) in the INTERSALT formula. Of the eleven included studies, ten (90·90 %) provided correlation coefficients between the estimates and the measures. The meta-analysis (Fig. 4) showed a pooled r-Fisher’s Z of 0·43 (95 %CI 0·37, 0·49) in the Tanaka formula, 0·39 (95 %CI 0·32, 0·45) in the Kawasaki formula and 0·36 (95 %CI 0·31, 0·42) in the INTERSALT formula. According to the interpretation of the correlation coefficients from Psychology(Reference Akoglu31), the correlation coefficient converted from r-Fisher’s Z showed that the Tanaka formula (0·41) performed a moderate correlation, while the Kawasaki formula (0·37) and the INTERSALT formula (0·35) performed a weak correlation. Through the comparison of the statistical significance of the difference between two independent correlation coefficients, the Tanaka formula had a higher correlation than the Kawasaki formula (0·41 v. 0·37, P = 0·01) and the INTERSALT formula (0·41 v. 0·35, P < 0·01).
Forest plot of mean difference (MD) between measures and estimates from different formulas
Forest plot of correlation (r) between measures and estimates from different formulas
Subgroup analysis
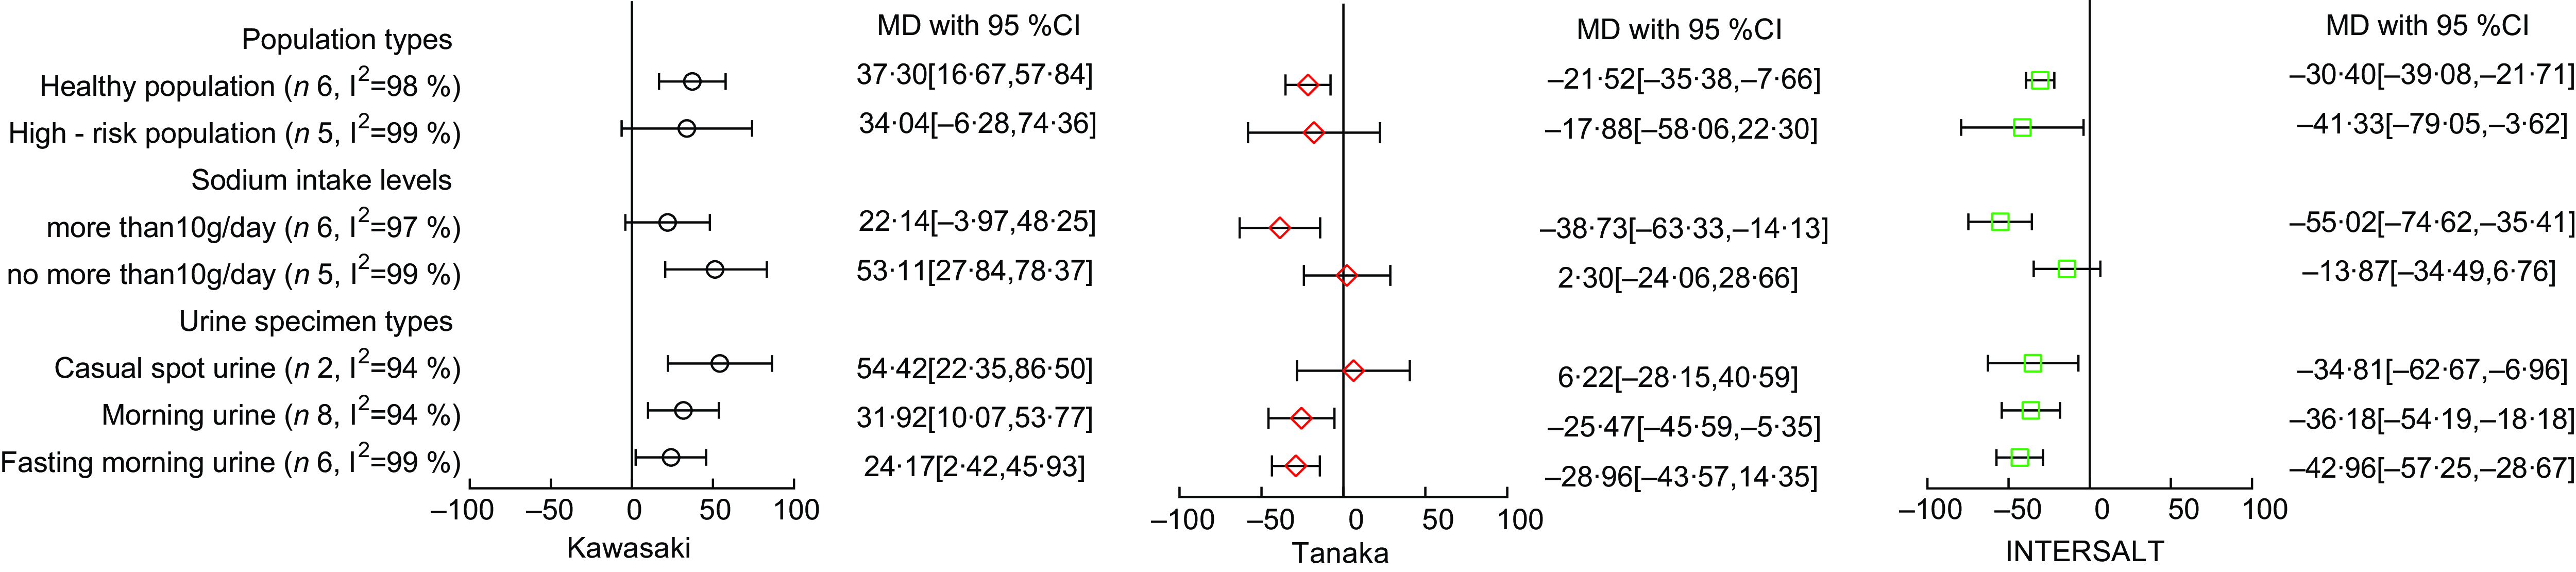
For those consuming over 10 g/d, the Kawasaki formula indicated a MD of 22·14 mmol/d (95 % CI –3·97, 48·25), while the Tanaka and INTERSALT formulas showed –38·73 mmol/d (95 % CI –63·33, –14·13) and –55·02 mmol/d (95 % CI –74·62, –35·41), respectively. In contrast, among participants with an intake of 10 g/d or less, the Kawasaki formula revealed a MD of 53·11 mmol/d (95 % CI 27·84, 78·37); for the same group, the Tanaka and INTERSALT formulas reported 2·30 mmol/d (95 % CI -24·06, 28·66) and –13·87 mmol/d (95 % CI –34·49, 6·76), respectively. Examining the casual spot urine group, MD of 54·42 mmol/d (95 % CI 22·35, 86·50) was observed for the Kawasaki formula, 6·22 mmol/d (95 % CI –28·15, 40·59) for the Tanaka formula and –34·81 mmol/d (95 % CI –62·67, –6·96) for the INTERSALT formula. Meanwhile, in the fasting morning urine group, the observed MD were 24·17 mmol/d (95 % CI 2·42, 45·93) using the Kawasaki formula, –28·96 mmol/d (95 % CI –43·57, 14·35) with the Tanaka formula and –42·96 mmol/d (95 % CI –57·25, –28·67) with the INTERSALT formula.
The detailed results are summarised in Fig. 5.
Forest plot of mean difference (MD) from different formulas in different subgroups
Discussion
Using spot urine samples could be a convenient alternative to 24-h urine collections for monitoring Na intake at the population level(Reference Zhang, Liao and Ye26,Reference Peng, Feng and Zhang32) . The three formulas in the meta-analyses all showed moderate correlations (0·36–0·43) between the estimated and measured 24hUNa, slightly lower than those observed in the Italian population (0·62–0·70)(Reference Hariri, Ramezani and Shamshirgaran33) and slightly higher than the Portuguese population (0·25–0·36)(Reference Polonia, Lobo and Martins34). In a diverse population from eleven countries(Reference Mente, O’Donnell and Dagenais35), the Kawasaki formula was considered a reliable alternative for estimating 24hUNa while the INTERSALT formula was seen as an acceptable alternative for monitoring Na intake/excretion in the French population(Reference Emeville, Lassale and Castetbon36). Several foreign validation studies(Reference Petersen, Johnson and Mohan37,Reference Cogswell, Wang and Chen38) also identified that the INTERSALT formula which derived from data across fifty-two centres in thirty-two countries perform better under complex ethnic compositions. This meta-analysis in the Chinese population suggested the Tanaka formula showed a less bias (–19·62 mmol/d) compared with the Kawasaki formula (36·07 mmol/d) and the INTERSALT formula (–35·78 mmol/d).
Subgroup analysis identified two key factors that might influence the accuracy of formula estimates. First, Na excretion exhibited a diurnal variation(Reference Huang, Crino and Wu39), implying that the time of urine sample collection could impact the overestimation or underestimation of 24-hour urinary sodium excretion (24hUNa)(Reference Rhee, Kim and Shin40,Reference Kawamura, Ohmoto and Hashimoto41) . The Kawasaki formula initially was established based on fasting second morning urine specimens(Reference Kawasaki, Itoh and Uezono9), which had a lower Na concentration(Reference Xu, Zhang and Liu27,Reference Gong, Ma and Zhang42) , while the Tanaka formula and the INTERSALT formula were established based on casual spot urine specimens which took the daily change of urine Na into account. Therefore, the Kawasaki formula produced higher estimates when collecting casual spot urine specimens, and the Tanaka and the INTERSALT formula produced lower estimates when fasting morning urine was collected. Second the level of Na intake appears to play a role in estimation accuracy. Numerous studies(Reference Han, Sun and Chen12,Reference Qian, Jiang and Wang18,Reference Sun, Wang and Liang19,Reference Peng, Li and Wang29,Reference Huang, Crino and Wu39,Reference Gong, Ma and Zhang42) have demonstrated that prediction formulas are more likely to overestimate in populations with lower salt intake and underestimate in those with higher intake. This was consistent with the trends presented in the subgroups of urinary Na intake levels.
The 24hUNa estimates by the Kawasaki formula tended to be overestimated, while those by the Tanaka and INTERSALT formulas were inclined to be underestimated, consistent with trends identified in Brazilian(Reference Mill, Rodrigues and Baldo43), Iranian(Reference Hariri, Ramezani and Shamshirgaran33) and Indian populations(Reference Petersen, Johnson and Mohan37). More accurate estimation results might be achieved by closely approximating the conditions under which the formula was established. Therefore, the estimates derived from the Kawasaki formula in fasting morning urine group (24·17 mmol/d) and in the group with salt intake group over 10 g/d (22·14 mmol/d) are more accurate compared with those obtained by the other two formulas.
Among the studies excluded from the sensitivity analysis, one focused on the elderly high-risk stroke population in rural area of Shaanxi province, and the other on elderly hypertensive patients in a rural area of the Ningxia Hui Autonomous Region. Both studies involved high-risk elderly populations with lower urine volumes and higher urine Na concentrations, resulting in significantly higher estimates compared with the measures. Although these two studies were not included in the final meta-analysis, there is a need to validate more accurate formulas in more diverse populations or in larger epidemiological studies within China.
There were two limitations in this study. First, the meta-analysis mainly evaluated the validity of the Kawasaki formula, the Tanaka formula and the INTERSALT formula, involving only 8369 participants from thirteen studies in fifteen provinces of China, which might limit its extrapolation. Second, correlation might not be the best measure to assess the validity in the current context of monitoring and evaluating public health programmes for population salt reduction(Reference Ji, Sykes and Paul44). A more comprehensive and in-depth evaluation of different formulas should be implemented in the future.
Conclusion
The meta-analysis suggested that the Tanaka formula estimates exhibited less bias and higher correlation in the Chinese population. The time of collecting spot urine specimens and Na intake level of the sample population might be the main factors affecting the accuracy of the formula estimation.
Acknowledgements
Not applicable.
Financial support
None.
Conflict of interest
There are no conflicts of interest.
Authorship
ZQ, BW and ZL conceived the study. ZQ, ST and HY conducted the screening of studies and quality assessment. ZQ analysed the data, with support from ST, YL, HY and KW. ST, BW, YL, KW, HY and ZL reviewed and provided comments on the subsequent versions of the paper. All authors approved the final version of the manuscript.
Ethics of human subject participation
Not applicable.


 Open access

