




Non-technical Summary
Increased dietary specialization has been considered a significant predictor for risk of extinction within the fossil record. However, these interpretations typically come from physical traits of species aggregated into board dietary categories. Using the exceptional fossil record of the John Day Formation, we reconstructed dietary breadth for the regional community of canids via dental microwear textures, scratches and pits that get etched into tooth enamel while the individual eats differently textured foods. When aggregated for a species or population, these models can capture more nuanced signals of intraspecific variation (i.e., dietary plasticity) that defines the dietary niche space. We then assessed the degree to which measures of dietary niche space from dental microwear textures and morphological traits correlate with species durations. We found that signals of dietary behavior, as inferred from dietary niche breadth estimated via dental microwear textures, showed a stronger relationship with lineage durations than did morphological tooth traits. Specifically, dietary niche breadth was negatively associated with increased species durations. These results suggest the relationship between overall dental morphology and dietary behaviors is more nuanced than previously expected and that the contribution of dietary flexibility irrespective of tooth morphology to extinction risk deserves further attention.
Introduction
While the ultimate drivers of species extinction in the fossil record are often complex and nuanced, many studies have sought to identify factors that influence extinction risk and thus correlate with lineage durations (Pimm et al., Reference Pimm, Jones and Diamond1988; McKinney, Reference McKinney1997; Chichorro et al., Reference Chichorro, Juslén and Cardoso2019). For many clades, the temporal duration of lineages is often associated with macroevolutionary ratchets, in which directional selection and adaptive reduction of traits lead to increased extinction rates (Gould, Reference Gould1970; Alicea and Gordon, Reference Alicea and Gordon2014). Within carnivorans (class Mammalia; order, Carnivora) macroevolutionary ratcheting patterns are hypothesized to frequently correspond with dietary specialization. For example, the fossil history of the dog family Canidae captures repeated macroevolutionary patterns in which convergent morphological adaptations for decreasing use of non-meat food resources (i.e., increased hypercarnivory) precedes extinction and replacement by sister clades of radiating generalist mesocarnivores (Van Valkenburgh, Reference Van Valkenburgh1991, Reference Van Valkenburgh2007; Van Valkenburgh et al., Reference Van Valkenburgh, Wang and Damuth2004). As such, the ultimate limit on the temporal duration of canid lineages has been hypothesized to correlate with dietary overspecialization as reliance on a limited set of prey increases susceptibility of predators to extirpation during high-intensity perturbations, extreme fluctuations in prey availability, or increased pressure from competition (Blamford, Reference Blamford1996; Boyles and Storm, Reference Boyles and Storm2007; Tinker et al., Reference Tinker, Bentall and Estes2008; Colles et al., Reference Colles, Liow and Prinzing2009; Rosenblatt et al., Reference Rosenblatt, Nifong, Heithaus, Mazzotti and Cherkiss2015).
Within canids, the link between specialized diet and increased extinction risk has been identified from numerous studies inferring diet from morphological traits (Van Valkenburgh et al., Reference Van Valkenburgh, Wang and Damuth2004; Van Valkenburgh, Reference Van Valkenburgh2007; Balisi et al., Reference Balisi, Casey and Van Valkenburgh2018). Specifically, dietary categorization of canids via quantifiable traits has focused largely on tooth morphology, such as grinding surface area and carnassial blade length (Van Valkenburgh, Reference Van Valkenburgh and Gittleman1989, Reference Van Valkenburgh2007; Stefen, Reference Stefen1999; Van Valkenburgh et al., Reference Van Valkenburgh, Sacco and Wang2003; Tedford et al., Reference Tedford, Wang and Taylor2009; Tseng and Wang, Reference Tseng and Wang2011; Meloro et al., Reference Meloro, Hudson and Rook2015). It has been well established that these traits correspond with differential mastication efficiencies for ranges of food types and serve as robust ecomorphological indicators in the fossil record (Van Valkenburgh, Reference Van Valkenburgh and Gittleman1989; Anderson and LaBarbera, Reference Anderson and LaBarbera2008; Stynder, Reference Stynder2009; Tseng and Wang, Reference Tseng and Wang2011; Asahara, Reference Asahara2013; Meloro et al., Reference Meloro, Hudson and Rook2015; Tseng and Flynn, Reference Tseng and Flynn2015). While these morphological traits provide insight into the overall physical capabilities of species, inferences can differ depending on the traits analyzed (Matheus, Reference Matheus1995; Donohue et al., Reference Donohue, DeSantis, Shubert and Ungar2013; Meloro, Reference Meloro2011; Jones and DeSantis, Reference Jones and DeSantis2016). In addition, broad categorization of specialized foragers by tooth morphology alone fails to record dietary plasticity. It is this dietary plasticity of individuals and their populations that truly defines the boundaries of a multidimensional dietary niche space. Despite modern canids being renowned for their high degree of dietary plasticity, which has been shown to enable survival during stochastic or seasonal perturbations (Van Valkenburgh, Reference Van Valkenburgh and Gittleman1989; Sanabria et al., Reference Sanabria, Arguelles-Mendez and Ortega-Rubio1996; Quinn, Reference Quinn1997; Rose and Polis, Reference Rose and Polis1998; Urton and Hobson, Reference Urton and Hobson2005; Asahara, Reference Asahara2013; Benson et al., Reference Benson, Loveless, Rutledge and Patterson2017), no studies to date have reconstructed dietary niche breadth of fossil canids or tested how dietary plasticity corresponds with the ultimate duration of canid lineages.
One method for reconstructing dietary niche breadth of fossil taxa is through measures of dental microwear textures, microscopic wear patterns created on tooth enamel as food is masticated that reflect the textural types of foods consumed, via dental microwear texture analysis (DMTA) (Calandra and Merceron, Reference Calandra and Merceron2016; DeSantis, Reference DeSantis2016). When signals of microwear from individuals are aggregated within a population or species, the range of variation (i.e., individual foraging activities) represents a comprehensive picture of diet that can be used to make comparisons between species and among populations within a species separated in space and/or time (Schubert et al., Reference Schubert, Ungar and DeSantis2010; DeSantis et al., Reference DeSantis, Schubert, Scott and Ungar2012; Stynder et al., Reference Stynder, Ungar, Scott and Schubert2012; DeSantis and Haupt, Reference DeSantis and Haupt2014). While DMTA parameters cannot be correlated with the taxonomic identity of prey items (to measure specialization in prey diversity), they have been shown to correlate strongly with textural types of foods. Thus, in addition to capturing individual-level variation, they also capture more functional and perhaps nuanced signals of resource consumption within species (e.g., durophagy, carnivory, frugivory, browsing, grazing, etc.) and thus reflect textural as opposed to purely taxonomic axes of resource-use specialization and plasticity. Previous work has demonstrated that dietary reconstruction via DMTA can yield measures of dietary variation useful for testing ecological patterns (Calandra and Merceron, Reference Calandra and Merceron2016; DeSantis, Reference DeSantis2016; Tanis et al., Reference Tanis, DeSantis and Terry2018). For example, signals of dietary variation have been used to make inferences between foraging behaviors across different populations of extant canids (Tanis, Reference Tanis2019; Schulz-Kornas et al., Reference Schulz-Kornas, Skiba and Kaiser2024). DMTA parameters have also been used to discriminate between intra-population differences between sex within roe deer (Merceron et al., Reference Merceron, Escarguel, Angibault and Verheyden-Tixier2010) and seasonal shifts within arvicoline voles (Calandra et al., Reference Calandra, Labonne, Schulz-Kornas, Kaiser and Montuire2016). Intraspecific variation in DMTA signals have also been used to better discriminate between diets of extinct and extant macropodids (Arman et al., Reference Arman, Prowse, Couzens, Ungar and Prideaux2019). As such, dietary variation quantified via DMTA is constrained enough to test correlation between dietary plasticity and the duration of canid lineages within the macroevolutionary ratchet .
Here we used the exceptional canid assemblage from the John Day Formation as a case study for investigating whether reconstructions of fossil canid dietary niche breadth align with macroevolutionary trends inferred from species-level tooth morphologies, and the degree to which dietary niche breadth is predictive of species duration. The John Day Formation represents an ideal system in which to ask these questions as repeated volcanic activity in the Pacific Northwest through the Cenozoic created an exceptionally well-preserved and temporally complete fossil record. This sequence contains preservation of entire vertebrate communities, particularly of horses and canids. During the period spanning the Oligocene and Miocene (39.7 to 18 Ma), the John Day Formation contains at least 10 co-occurring species within Canidae, including both the Hesperocyoniane and Borophaginae subfamilies. More recent assemblages also include specimens from the Caninae subfamily (Tedford et al., Reference Tedford, Wang and Taylor2009), thus making the John Day fossil beds a unique and powerful resource for comparing the evolutionary history of the entire Canidae family. These species capture the full spectrum of morphologically classified dietary specialization within Canids corresponding with evolutionary position within the macroevolutionary ratchet.
We quantified dietary specialization within the canid community from the John Day region, spanning a time window from 30.8 to 10.3 Ma via dietary niche breadth from dental microwear textures and from morphological categorizations of teeth. We then compared both metrics with estimated species durations to assess the potential of dietary plasticity as a predictor of extinction risk. The well-preserved sequence through time at the John Day Formation enables exploration of the degree to which the diet of species shifts through time, assessing the assumption that species functional roles are relatively static. Thus, we also assessed intraspecific temporal dynamics in one well-represented species, Phlaocyon latidens (Cope, Reference Cope1881), a small, hypocarnivorous borophagine, as a case study.
We hypothesized that dental microwear texture signals would reflect differences in dietary flexibility not captured by tooth morphology alone. In addition, we hypothesized that signals of dietary niche breadth would show a stronger relationship with lineage durations than would morphological tooth traits, offering greater insight into the contribution of dietary behavior and specialization to extinction risk. Finally, we expected Phlaocyon latidens to show consistent dietary signals over time, suggesting that species plasticity and functional roles do not shift over their temporal extent.
Materials and methods
Inferences on dietary specialization for this study were derived from molars of canid species collected within the John Day Formation. In total, we sampled 62 specimens representing five species distributed across the extinct subfamilies Hesperocyoninae and Borophaginae (Table 1). Sample sizes for each species (Table 1) were restricted to specimens with intact occlusal surfaces for DMTA analysis (i.e., an undamaged lower second molar or talonid basin of the lower first molar). Our sample sizes for each species represent most viable specimens collected from the John Day Formation that were available for study at the time of sampling. Other species with very low samples sizes (n ≤ 3) were sampled but not included in this study due to power limitations. Specimen ages span 23.6 million years (North American land-mammal ages Whitneyan through Clarendonian), with the majority occurring within the 32.2–26.6 Ma Turtle Cove Formation (Supplemental Material Table 1).
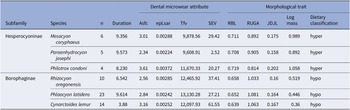
Summary of mean sampled Canidae dietary reconstructions quantified via DMTA compared with morphological traits and classifications from the literature (Tedford et al., Reference Tedford, Wang and Taylor2009; Silvestro et al., Reference Silvestro, Antonelli, Salamin and Quental2015; Balisi et al., Reference Balisi, Casey and Van Valkenburgh2018). n = number of specimens sampled for DMTA; duration = estimated length of species duration in millions of years; Asfc = area-scale fractal complexity; epLsar = anisotropy; Tfv = textural fill volume; SEV = standard ellipsoid volume–three-dimensional breadth; RBL = relative blade length; RUGA = relative upper grinding area; JDJL = jaw depth to jaw length ratio

Table 1. Long description
The table is organized with columns for subfamily, species, sample size n, species duration in millions of years, four dental microwear attributes—Asfc (area-scale fractal complexity), epLsar (anisotropy), Tfv (textural fill volume), SEV (standard ellipsoid volume)—and five morphological traits—RBL (relative blade length), RUGA (relative upper grinding area), JDJL (jaw depth to jaw length ratio), log mass, and dietary classification. Rows are grouped by subfamily: Hesperocyoninae and Borophaginae. Under Hesperocyoninae, Mesocyon coryphaeus (n 6, duration 9.356, Asfc 3.01, epLsar 0.00288, Tfv 9,878.56, SEV 29.42, RBL 0.711, RUGA 0.892, JDJL 0.175, log mass 0.989, dietary classification hyper), Paraenhydrocyon josephi (n 5, duration 9.573, Asfc 2.34, epLsar 0.00224, Tfv 9,608.91, SEV 2.52, RBL 0.708, RUGA 0.905, JDJL 0.158, log mass 0.892, dietary classification hyper), and Philotrox condoni (n 4, duration 8.230, Asfc 3.61, epLsar 0.00372, Tfv 11,670.33, SEV 20.27, RBL 0.719, RUGA 0.814, JDJL 0.202, log mass 1.058, dietary classification hyper) are listed. Under Borophaginae, Rhizocyon oregonensis (n 10, duration 6.542, Asfc 2.56, epLsar 0.00285, Tfv 12,465.92, SEV 37.41, RBL 0.658, RUGA 1.033, JDJL 0.16, log mass 0.519, dietary classification hypo), Phlaocyon latidens (n 23, duration 9.614, Asfc 2.84, epLsar 0.00242, Tfv 13,130.28, SEV 27.21, RBL 0.652, RUGA 1.081, JDJL 0.164, log mass 0.446, dietary classification hypo), and Cynarctoides lemur (n 14, duration 3.88, Asfc 3.16, epLsar 0.00252, Tfv 12,097.93, SEV 61.55, RBL 0.639, RUGA 1.063, JDJL 0.167, log mass 0.36, dietary classification hypo) are listed. Dietary classification alternates between hyper and hypo across subfamilies. All values are presented as means for each species.
DMTA analysis was conducted by creating high-resolution molds of either the lower second molar or talonid basin of the lower first molar (following Tanis et al., Reference Tanis, DeSantis and Terry2018) using polyvinylsiloxane impression material (President Jet regular body, Coltène/Whaledent Inc.). DMTA parameters vary depending on the occlusal facets sampled (Schubert et al., Reference Schubert, Ungar and DeSantis2010; DeSantis, Reference DeSantis2016). Previous studies within caniform carnivorans have shown that dental microwear signals from wear facets other than the hypoconid facet of the lower second molar and talonid of the lower first molar, including the carnassial shearing facet of the lower first molar, do not discriminate known diets (Ungar et al., Reference Ungar, Scott, Schubert and Stynder2010; Donohue et al., Reference Donohue, DeSantis, Shubert and Ungar2013). Tanis et al. (Reference Tanis, DeSantis and Terry2018), however, reported that the hypoconid facet on the talonid basin of the lower first molar in canids yields DMTA signals that are indistinguishable from those obtained from the lower second molar, enabling increased sample sizes for fossil taxa. Thus, our study followed Tanis et al. (Reference Tanis, DeSantis and Terry2018) and utilized the lower second molar or talonid basin of the first molar for quantification of dental microwear textures.
Molds were filled with a clear epoxy resin (EPO-TEK301, Epoxy Technology Inc.) and the resulting casts scanned via a Sensofar PLu neox optical profiler at Vanderbilt University. Each scan comprised four adjacent quadrants totaling 206 × 276 μm2, which were analyzed via scale-sensitive fractal analysis software (Sfrax and Toothfrax, Surfract Corp.) to compile microwear parameters. Median values of DMTA parameters from the four scans were used to represent a given specimen (per Scott et al., Reference Scott, Ungar, Bergstrom, Brown, Childs, Teaford and Walker2006). Our analysis of dietary specialization focused on three DMTA parameters with known dietary correlations within carnivorans: anisotropy (epLsar), complexity (Asfc), and textural fill volume (tfv). Anisotropy represents wear feature alignment as caused by mastication of tough dietary items such as high flesh consumption (Schubert et al., Reference Schubert, Ungar and DeSantis2010; Ungar et al., Reference Ungar, Scott, Schubert and Stynder2010; DeSantis, Reference DeSantis2016). Complexity is an index of scale-corrected wear feature relief, which increases with hard and brittle foods and thus has been used to identify bone consumption within scavengers and omnivores (Schubert et al., Reference Schubert, Ungar and DeSantis2010; Ungar et al., Reference Ungar, Scott, Schubert and Stynder2010; DeSantis, Reference DeSantis2016). Textural fill volume is used to discriminate relative depth of wear features and increases with highly durophagous diets in carnivores (Schubert et al., Reference Schubert, Ungar and DeSantis2010; Ungar et al., Reference Ungar, Scott, Schubert and Stynder2010; DeSantis, Reference DeSantis2016). See Supplementary Materials Figure 1 for a visual depiction of DMTA parameters and examples. Additional microwear parameters, such as scale of heterogeneity, have shown conflicting correlations with aspects of extant carnivoran diets and thus were not included in this study (Schubert et al., Reference Schubert, Ungar and DeSantis2010; DeSantis, Reference DeSantis2016).
For this study, we were interested primarily in the aggregate signal of dietary niche breadth and thus focused on the overall measure of dietary specialization via DMTA rather than attempting to make inferences into specific dietary classifications of species or identify potential dietary items. Quantification of dietary specialization was performed for each species by aggregating DMTA parameters from individual specimens. Each DMTA parameter was then adjusted with z-score standardization to account for differences in scale without altering distributions (Gotelli and Ellison, Reference Gotelli and Ellison2013). We then used a Bayesian framework to reconstruct 95% probability ellipsoids reflecting a multi-dimensional dietary texture space for each species (Layman et al., Reference Layman, Arrington, Montana and Post2007; Jackson et al., Reference Jackson, Inger, Parnell and Bearhop2011; Swanson et al., Reference Swanson, Lysy, Power, Stasko, Johnson and Reist2015). Bayesian ellipse models are commonly used in stable isotopic assessments of niche breadth and have been shown to be both insensitive to differences in sample sizes and robust even with small sample sizes (Layman et al., Reference Layman, Arrington, Montana and Post2007; Jackson et al., Reference Jackson, Inger, Parnell and Bearhop2011; Swanson et al., Reference Swanson, Lysy, Power, Stasko, Johnson and Reist2015). Bayesian models were run via the nicheROVER package in program R (R Core Team, 2014; Lysy et al., Reference Lysy, Stasko and Swanson2023), modifying the default parameters to sample from 25,000 posterior distributions to calculate mean SEV for each species, which was used as a relative measure of dietary specialization.
Dietary specialization was also assessed via morphological categorization of four anatomical features commonly derived from skeletal and dental elements to identify dietary roles in canids. Specifically, we explored relative blade length of the lower carnassial (RBL), relative surface area for grinding on the upper tooth row (RUGA), the ratio of dentary depth to length (JDJL), and log body mass (Van Valkenburgh, Reference Van Valkenburgh and Gittleman1989, Reference Van Valkenburgh2007; Stefen, Reference Stefen1999; Van Valkenburgh et al., Reference Van Valkenburgh, Sacco and Wang2003; Tedford et al., Reference Tedford, Wang and Taylor2009; Tseng and Wang, Reference Tseng and Wang2011; Meloro et al., Reference Meloro, Hudson and Rook2015; Balisi et al., Reference Balisi, Casey and Van Valkenburgh2018). We compiled these parameters for each species from the literature, representing aggregates from throughout their geographic and temporal ranges, not just within the John Day community; they are summarized in Table 1. These values were compared with each DMTA parameter via Pearson correlation to assess the degree to which dietary reconstructions of species aligns with the standard morphological traits associated with dietary category. We also compared species aggregated DMTA parameters with broad dietary categories (i.e., hypercarnivore, omnivore, hypocarnivore) as determined in the literature (Tedford et al., Reference Tedford, Wang and Taylor2009; Silvestro et al., Reference Silvestro, Antonelli, Salamin and Quental2015; Slater, Reference Slater2015; Balisi et al., Reference Balisi, Casey and Van Valkenburgh2018) via one-way MANOVA followed by a post hoc one-way ANOVA and Tukey’s HSD test.
In addition, we explored the possibility that intraspecific diet changed over time within one species, Phlaocyon latidens, by comparing its DMTA parameters aggregated within broad temporal bins. This analysis was restricted to this one species due to statistical power constraints; it had large enough sample sizes within sufficiently detailed (i.e., narrow) temporal bins. Temporal bins were established according to several a priori clustering groups to account for uncertainty with fossil ages and differing sample sizes (Supplemental Material Table 2). Temporal bin groups included minimum and maximum age estimates modeled from U–Pb zircon dates of stratigraphic units, stratigraphic elevation bins, and sections within fossil collection units within the John Day Formation (Fremd et al., Reference Fremd, Bestland and Retallack1994; Mohr et al., Reference Mohr, Famoso, Samuels, Laib and Schmitz2025).
To test the proposed relationship between reconstructed dietary specialization and extinction likelihood, we quantified species durations for each canid. As any single fossil specimen is unlikely to represent the extremes of a species stratigraphic range, first and last appearance dates were estimated from known occurrences to calculate species duration (Foote and Raup, Reference Foote and Raup1996; Alroy, Reference Alroy2000). Species occurrence data were downloaded from the Paleobiology Database and Miomap Database (last accessed 8 February 2019, using the parameters Taxon Name: ‘Borophagus,’ ‘Cynarctoides,’ ‘Mesocyon,’ ‘Paraenhydrocyon,’ ‘Paratomarctus,’ ‘Philotrox,’ ‘Phlaocyon,’ and ‘Rhizocyon’) combined and cleaned of duplicate records and largely imprecise age brackets (e.g., recorded occurrences for the entire Miocene). First and last appearance dates were calculated following established birth–death Markov chain Monte Carlo procedures via the PyRate package of program Python (Silvestro et al., Reference Silvestro, Salamin and Schitzler2014). Specifically, we ran 10 million iterations with the first 200,000 as burn in, thinning by 1,000. Median first and last appearance times were used from the resulting posterior distributions to calculate species duration times.
Species duration was compared with each DMTA parameter and morphological trait via Pearson correlation as a broad indicator of relationships between metrics and lineage duration. Species durations were also used to create a series of generalized linear models to assess a relationship between extinction risk, standard ellipsoids (i.e., dietary breadth), and morphological traits. Models were weighted by sample size from the DMTA analysis and were conducted via generalized linear regression. We compared model performance using Akaike’s information criterion adjusted for small sample sizes (AICc), using ∆AICc < 2 as our cutoff for model equivalence (Burnham and Anderson, Reference Burnham and Anderson2004). AICc weights of candidate models were treated as a sign of likelihood for leading factors contributing to lineage duration and extinction risk.
To increase the number of species within our study and to account for taxonomic and functional groups absent from our initial sampling, we repeated the preceding analyses while including two additional species (Paratomarctus temerarius (Leidy, Reference Leidy1858) and Borophagous littoralis VanderHoof, Reference VanderHoof1931). In the case of P. temerarius, specimens have been found just outside of the John Day Formation yet are represented solely from post-cranial and partial-cranial fossil material lacking the requisite molars for DMTA analysis (Tedford et al., Reference Tedford, Albright, Barnosky, Ferrusquia-Villafranca, Hunt, Storer, Swisher, Voorhies, Webb and Whistler2004; McLaughlin et al., Reference McLaughlin, Hopkins and Schmitz2016; Tanis et al., Reference Tanis, DeSantis and Terry2018). As such, all specimens for P. temerarius and B. littoralis were sampled from the Green Valley and Barstow Formations in California. Overall, we found minimal qualitative impact on the results; thus, for simplicity, we focus on the suite of John Day-exclusive taxa, but results that include the specimens from California are reported in the Supplementary Materials.
Repositories and institutional abbreviations
Specimens examined in this study are reposited in the following institutions: the John Day Fossil Beds National Monument (JODA), Kimberly, Oregon, USA, the University of California Museum of Paleontology (UCMP), Berkeley, California, USA, and the University of Washington Burke Museum (UWBM), Seattle, Washington, USA. See Supplementary Table 1 for a complete list of specimens included in this study.
Results
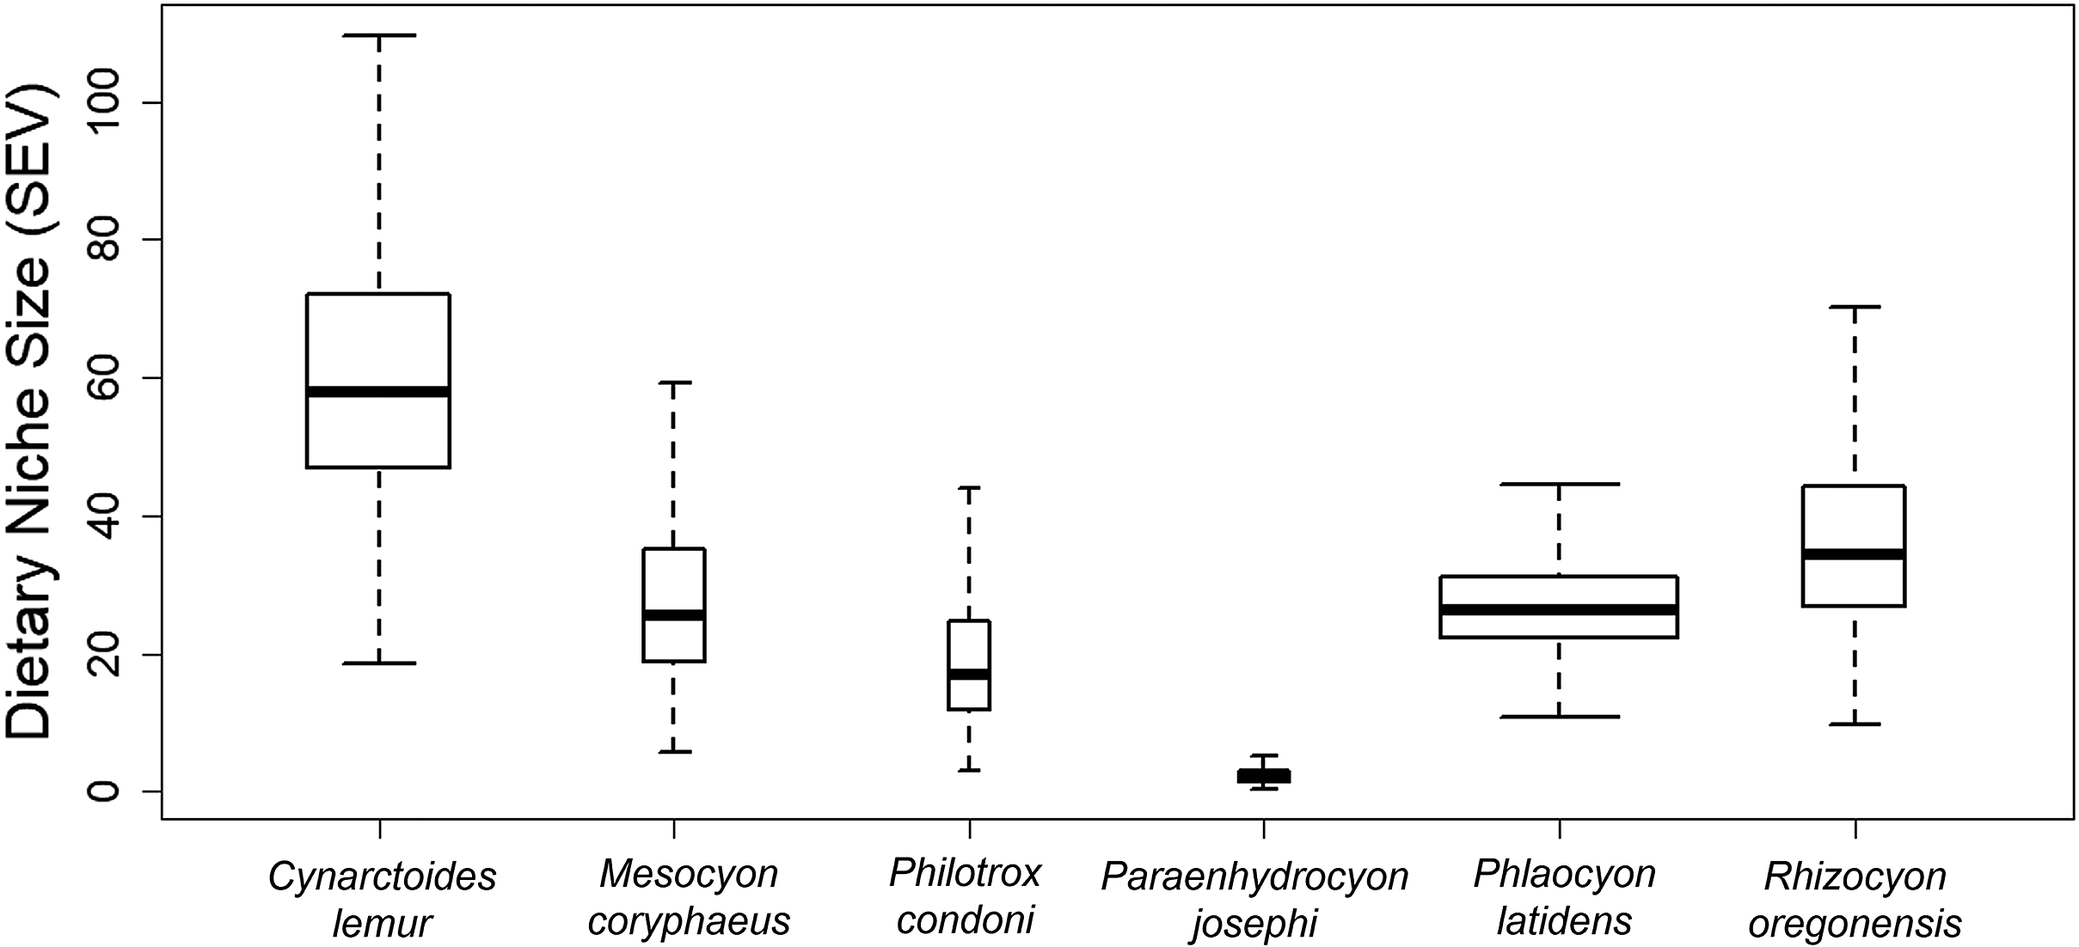
Mean calculated DMTA parameters and morphological traits aggregated from the literature for our focal species are summarized in Table 1. Mean DMTA parameters typically fell within the range of those observed for other modern canids (Schubert et al., Reference Schubert, Ungar and DeSantis2010; DeSantis, Reference DeSantis2016; Tanis et al., Reference Tanis, DeSantis and Terry2018; Schulz-Kornas et al., Reference Schulz-Kornas, Skiba and Kaiser2024). There was no clear difference between the means of any of the distributions of DMTA parameters across species (Fig. 1) assessed via one-way MANOVA (F ≥ 1.44, p ≥ 0.133 for all). We did, however, find interspecific differences in SEV (Fig. 2). While ellipse volumes differed, there was still a large degree of overlap of ellipses in the niche breadth space (Fig. 1).
Pairwise bivariate plots of DMTA indices of anisotropy (epLsar), complexity (Asfc), and textural fill volume (Tfv) representing the dietary niche axes for each canid species. The plots arrayed along the diagonal depict density distributions for each species for each DMTA parameter. The lower left corner plots show raw datapoints for each species group, and the upper right corner plots show standard ellipses that surround the 95% confidence region for each species and represents the boundaries of the multi-dimensional dietary niche space. Species data are similar in dietary niche position, with no distinct offsets in dietary niche space, suggesting little difference in the mean textural properties of foods consumed. However, there are differences in the variability of species data as well as the sizes and shapes of the standard ellipses, which correspond to differences in dietary resource use among John Day canids.

Figure 1. Long description
Starting from the top-left, the diagonal panels display density curves for each species and D M T A parameter: ep Lsar, Asfc, Tfv. Each curve is color-coded: yellow for Cynarctoides lemur, black for Mesocyon coryphaeus, blue for Philotrox condoni, orange for Paraenhydrocyon josephi, purple for Phlaocyon latidens, green for Rhizocyon oregonensis. The lower left panels show scatterplots of raw data points for each species, mapped by color, across pairwise combinations of parameters. The upper right panels contain standard ellipses outlining the 95 percent confidence regions for each species, illustrating the multidimensional dietary niche space. The legend on the right lists species names and their corresponding colors. Axes are labeled ep Lsar, Asfc, Tfv, and D M T A parameter. Ellipse sizes and orientations vary, indicating differences in variability and niche breadth among species.
Comparison of reconstructed dietary niche size as calculated from 95% probability SEVs using dental microwear textures aggregated by species. Boxplots represent median and quartile ranges of 25,000 samples from posterior distributions. Boxplot width is directly proportional to the number of specimens sampled. There is evidence that many species have distinctly different niche sizes as determined from minimal overlap of the posterior distributions.

Figure 2. Long description
The chart displays six boxplots aligned horizontally, each representing a species: Cynarctoides lemur, Mesocyon coryphaeus, Philotrox condoni, Paraenhydrocyon josephi, Phlaocyon latidens, and Rhizocyon oregonensis. The y-axis is labeled Dietary Niche Size S E V, ranging from 0 to 100 in increments of 20. Boxplot widths vary, indicating sample size. From left to right: Cynarctoides lemur shows the largest niche size with a median near 60 and a wide interquartile range, extending from about 20 to 100. Mesocyon coryphaeus has a median near 40, with a range from about 10 to 60. Philotrox condoni has a median near 20, with a range from about 5 to 40. Paraenhydrocyon josephi displays the smallest niche size, with a median near 5 and a very narrow range. Phlaocyon latidens has a median near 30, with a range from about 10 to 50. Rhizocyon oregonensis has a median near 40, with a range from about 10 to 80. Minimal overlap is visible between the posterior distributions of most species, indicating distinct dietary niche sizes.
For Phlaocyon latidens, the species we used as a case study to assess change in DMTA parameters over time, we found relative consistency in each dental microwear parameter across temporal bins, regardless of how temporal bins were delineated (e.g., for minimum and maximum dates within stratigraphic units (p ≥ 0.16 for all), broad stratigraphic elevation bins (p ≥ 0.28 for all), and sections within fossil collection units (p ≥ 0.57 for all) (Supplemental Material Fig. 2).
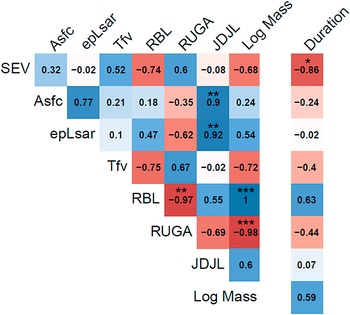
We found a clear correlation between some DMTA parameters and the morphological features used to categorize diet in fossil canids (Fig. 3). Specifically, both complexity and anisotropy showed strong correlation to the ratio of dentary depth to length (complexity: r = 0.90, p = 0.02; anisotropy: r = 0.92, p = 0.01). Textural fill volume (tfv) showed only a marginal, negative correlation with relative upper grinding area (r = –0.74, p = 0.08). There was a weak negative correlation between SEV and RBL (r = 0.74, p = 0.09) but not for any other morphological feature (r ≥ 0.68, p ≥ 0.13 for all). There was also no clear difference in DMTA parameters when taxa were sorted into broad literature-based dietary classifications of hypocarnivore, mesocarnivore, or hypercarnivore (F = 6.62, p = 0.13). Finally, there was no correlation between SEV and individual DMTA parameters (r ≤ 0.52, p ≥ 0.80 for all).
Correlation matrix showing Pearson’s correlation coefficients between all DMTA parameters, including the calculated SEV and each morphological feature compiled from the literature. Blue colors indicate positive correlations while red colors represent negative correlations, with color strength indicating correlation strength (Pearson’s r value). Significant correlations are noted by * (p = 0.05), ** (p = 0.01), and *** (p = 0.001).

Figure 3. Long description
The matrix displays S E V, Asfc, ep Lsar, Tfv, R B L, R U G A, J D J L, Log Mass, and Duration as both row and column labels. Each cell contains a Pearson’s r value, colored blue for positive and red for negative correlations. Strongest negative correlations are between R B L and R U G A (r equals negative 0.97, two asterisks), and R U G A and Log Mass (r equals negative 0.98, three asterisks). S E V shows a strong negative correlation with R B L (r equals negative 0.74), and Log Mass (r equals negative 0.68). Duration is negatively correlated with S E V (r equals negative 0.86, one asterisk). Significant correlations are marked with one, two, or three asterisks, corresponding to p equals 0.05, 0.01, and 0.001, respectively. The diagonal is not shown, as each parameter would correlate perfectly with itself.
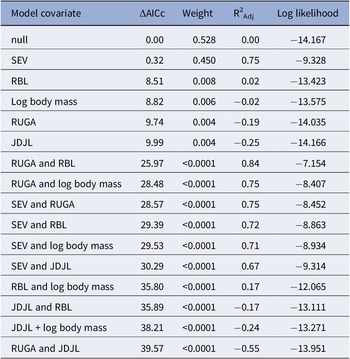
Counter to expectation, we recovered a strong inverse relationship between SEVs and species duration (i.e., larger dietary breadths were related to shorter durations; p = 0.02; R2adj = 0.80; Fig. 4). Furthermore, ranking of models in which species duration is predicted by DMTA-derived SEV versus morphological traits from the literature indicates higher support (ΔAICc < 8.5) for a predictive relationship between DMTA-derived dietary niche breadth and species durations than between any combination of morphological traits and species durations (Table 2). While the null model, in which species duration is a function of the mean, is the top model of the model set, it is important to note that it is indistinguishable from the model in which species duration is a function of SEV (ΔAICc = 0.32). Furthermore, there is clear support for much greater predictive power of SEV relative to the next most predictive variable (RBL, difference in AICc between SEV and RBL = 8.19).
Negative relationship between species duration (millions of years) and dietary niche breadth (SEV) for Canidae of the John Day community (p = 0.02, r2adj = 0.80). Colors of points correspond with subfamily designation, orange for Hesperocyoninae and blue for Borophaginae. Gray dashed lines depict 10,000 bootstrapped regressions.

Figure 4. Long description
The x axis is labeled Dietary Breadth S E V, ranging from 0 to 70. The y axis is labeled Species Duration M a, ranging from 4 to 9. Data points are colored orange for Hesperocyoninae and blue for Borophaginae. From left to right, orange points represent P. josephi at low dietary breadth and high species duration, P. condoni at moderate dietary breadth and high duration, and M. coryphaeus near P. latidens at high duration and moderate breadth. Blue points represent P. latidens at high duration and moderate breadth, R. oregonensis at moderate duration and higher breadth, and C. lemur at high dietary breadth and low duration. A solid black regression line slopes downward from upper left to lower right, indicating a negative relationship. Two gray dashed lines curve around the regression line, depicting 10,000 bootstrapped regressions.
Results of linear models testing the relationship between species duration and combinations of parameters related to dietary niche breadth reconstruction. Model performance was assessed via differences in Akaike’s information criterion corrected for small sample sizes (ΔAICc), model weight, and adjusted R2 (R2Adj). SEV = standard ellipsoid volume; RBL = relative blade length; RUGA = relative upper grinding area; JDJL = jaw depth to jaw length ratio
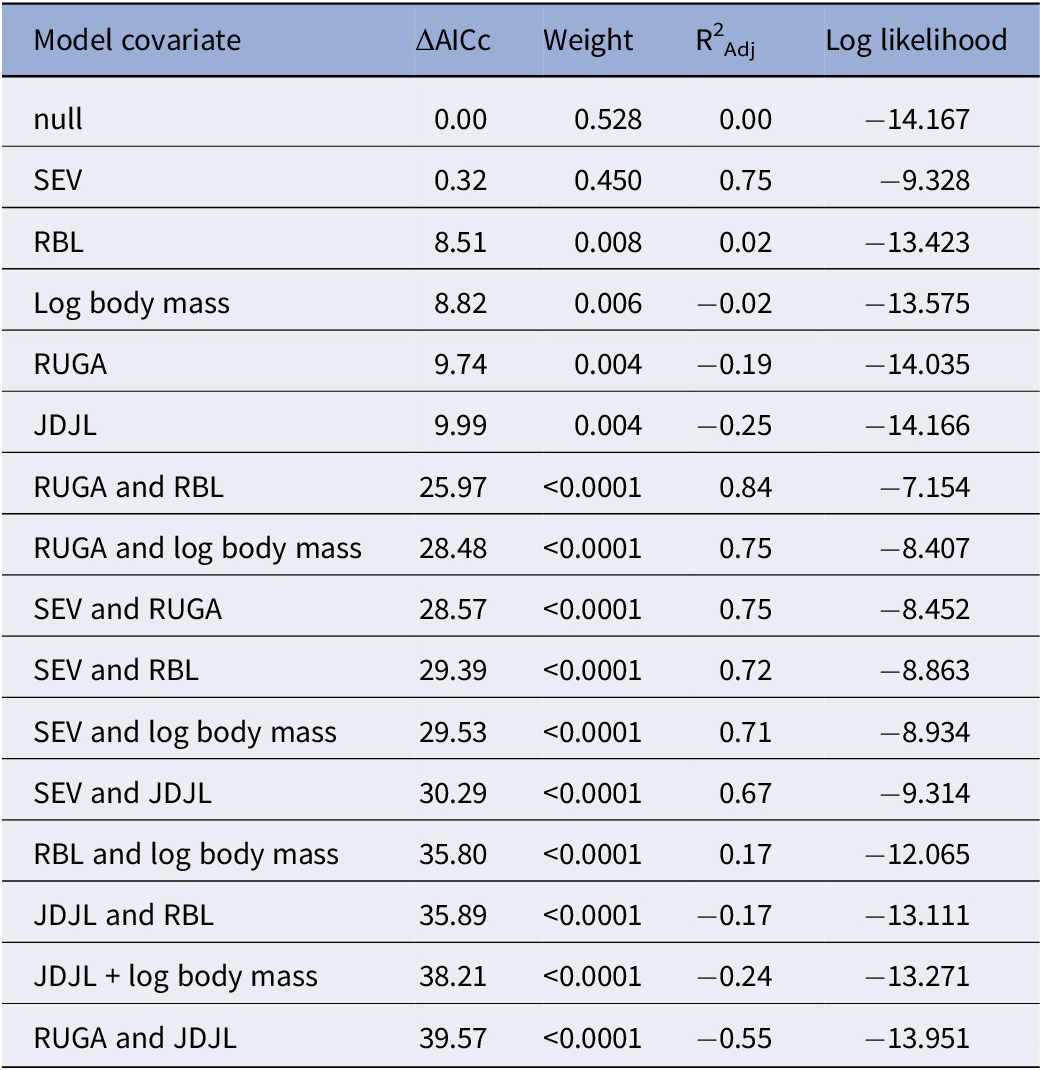
Table 2. Long description
The table has five columns: Model covariate, delta A I C c, weight, adjusted R squared, and log likelihood. From top to bottom, the covariates and their values are: null, delta A I C c 0.00, weight 0.528, adjusted R squared 0.00, log likelihood minus 14.167; S E V, 0.32, 0.450, 0.75, minus 9.328; R B L, 8.51, 0.008, 0.02, minus 13.423; log body mass, 8.82, 0.006, minus 0.02, minus 13.575; R U G A, 9.74, 0.004, minus 0.19, minus 14.035; J D J L, 9.99, 0.004, minus 0.25, minus 14.166; R U G A and R B L, 25.97, less than 0.0001, 0.84, minus 7.154; R U G A and log body mass, 28.48, less than 0.0001, 0.75, minus 8.407; S E V and R U G A, 28.57, less than 0.0001, 0.75, minus 8.452; S E V and R B L, 29.39, less than 0.0001, 0.72, minus 8.863; S E V and log body mass, 29.53, less than 0.0001, 0.71, minus 8.934; S E V and J D J L, 30.29, less than 0.0001, 0.67, minus 9.314; R B L and log body mass, 35.80, less than 0.0001, 0.17, minus 12.065; J D J L and R B L, 35.89, less than 0.0001, minus 0.17, minus 13.111; J D J L plus log body mass, 38.21, less than 0.0001, minus 0.24, minus 13.271; R U G A and J D J L, 39.57, less than 0.0001, minus 0.55, minus 13.951. S E V is standard ellipsoid volume, R B L is relative blade length, R U G A is relative upper grinding area, J D J L is jaw depth to jaw length ratio.
Discussion
Macroevolutionary ratchet models have traditionally been built on classification of dietary specialization based on dental and skeletal morphological features at the species level. However, such approaches cannot capture the full range of intraspecific dietary plasticity, leaving the role of such plasticity in driving macroevolutionary trends unknown. Given the high degree of dietary plasticity recognized in modern canids, and the importance of this plasticity in enabling their persistence through periods of stress, we set out to reconstruct dietary niche breadth within the exceptionally rich canid assemblage from the John Day Formation to assess how dietary plasticity corresponds with the ultimate duration of canid lineages. We hypothesized that dental microwear texture signals would be more predictive of lineage durations than would species-level morphological traits, given microwear’s ability to capture inter- and intraspecific differences in dietary flexibility (i.e., plasticity) due to its closer association with what individuals were actually consuming dietarily during their lives at times in the past.
Our results align with this hypothesis; we observed greater support for the predictive relationship between canid species durations and dietary niche breadth as estimated by SEV from dental microwear parameters than broad categorization of diet inferred from aggregated morphological traits. Given that DMTA parameters represent the cumulative foraging choices of individuals within populations, rather than representing an adaptive optimum of a species, it is likely that microwear is more capable of reflecting the actual variation that exists within populations and communities at any given time. While optimal foraging theory suggests that dietary choices typically follow energy- or time-maximization strategies when faced with decisions of immediate resource selection, particularly in a stochastic environment, what an individual can do will supersede what they are optimized for (Weeks et al., Reference Weeks, Naeem, Winger and Cracraft2020). The shapes of the Bayesian ellipses for each species reflect differences among species in the types of textural foods consumed. For example, species (or populations) with niche space that is expanded along the upper regions of the anisotropy axis indicate that species (or populations) are more reliant on tough, chewy foods, while those species with niche space that is expanded along larger complexity or textural fill volume axes indicate individuals are processing more hard, brittle foods and more varied textural foods, respectively (Fig. 1).
Counter to our expectations, we detected strong correlations between only some of the individual DMTA parameters and morphological features included in our analysis, specifically the ratio of dentary depth to length. Interestingly, this morphological feature is often cited as corresponding to bite force, which could directly influence dental microwear due to the depth of enamel scratches and pits being partially force dependent (Scott et al., Reference Scott, Ungar, Bergstrom, Brown, Childs, Teaford and Walker2006). Many microwear studies have explored variation across the toothrow with implied differences in signals partially due to changes in bite force (Teaford, Reference Teaford1988; Ungar et al., Reference Ungar, Scott, Schubert and Stynder2010; DeSantis et al., Reference DeSantis, Schubert, Scott and Ungar2012; Jiang and DeSantis, Reference Jiang and DeSantis2014; MacAfee and Green, Reference MacAfee and Green2015; Calandra et al., Reference Calandra, Labonne, Schulz-Kornas, Kaiser and Montuire2016). Other studies have used bite-force data to reinforce parallels between DMTA signals and diet in extinct and extant species (DeSantis et al., Reference DeSantis, Tseng, Liu, Hurst, Schubert and Jiangzuo2017, Reference DeSantis, Sharp, Schubert, Colbert, Wallace and Grine2020). However, only a few studies to date have experimentally tested direct correlations between bite force and DMTA, including in two extant canids Canis lupus Linnaeus, Reference Linnaeus1758 and Canis latrans Say in James, Reference James1823 (Tanis et al., Reference Tanis, DeSantis and Terry2018), lab-raised rats (Winkler et al., Reference Winkler, Bernetière and Böhmer2024), and 13 species of extant crocodilians and monitor lizards (Bestwick et al., Reference Bestwick, Unwin and Purnell2021). These studies show conflicting results on the degree of correlation between bite force and DMTA parameters, and authors primarily reinforce the need for careful consideration of tooth surfaces sampled when comparing within and across taxa. The lack of correlation between other morphological features and microwear parameters may be driven by functional differentiation along the toothrow. Several studies have shown that DMTA wear patterns are facet dependent, with different crushing and shearing surfaces yielding different results (Schubert et al., Reference Schubert, Ungar and DeSantis2010; DeSantis, Reference DeSantis2016). Thus, it is perhaps unsurprising that DMTA parameters focused on the crushing facets of the lower molars would yield different dietary signals than reflected from aspects of morphology that focus on the length of the shearing carnassial blade.
Despite the mix of correlations between DMTA parameters and morphological traits within fossil canids of the John Day, we did not detect correlation between DMTA parameters and the broad dietary classifications of species obtained from the literature. This might appear contradictory at first given dietary classifications are derived from the same morphological features we tested; however, the dietary bins have been identified in several studies through principal component analyses (Raia, Reference Raia2004; Van Valkenburgh et al., Reference Van Valkenburgh, Wang and Damuth2004; Silvestro et al., Reference Silvestro, Antonelli, Salamin and Quental2015; Balisi et al., Reference Balisi, Casey and Van Valkenburgh2018) and thus represent the amalgamation of morphological traits. This further suggests that while both DMTA parameters and morphology classify dietary behaviors, they represent alternative axes of a species dietary niche space. Given that principal component analysis-amalgamated morphological traits and DMTA parameters amalgamated via standard ellipse volumes both show stronger correlations with species durations than their individual components further suggests that dietary behaviors are best represented by a broad suite of proxies. Relying on fewer individual morphological or behavioral metrics yields less complete inference than when combining several metrics into a multi-dimensional space.
Another likely reason why DMTA-based dietary niche breadth appears independent of morphological traits in canids is that, as a clade, Canidae do not stray from the middle ground of morphological extremes seen within Carnivora. Canids have retained dental occlusal surfaces that enable both shearing and grinding, thus promoting the ability to engage in highly opportunistic foraging strategies (Asahara, Reference Asahara2013). Nearly all canid lineages possess a talonid basin at the anterior of the lower carnassial (m1) as well as at least one additional rear molar (m2-3) that enables grinding mastication. By contrast, most Feliform carnivorans have lost the ancestral array of rear molars capable of grinding in favor of increasing force upon highly derived shearing carnassials. This derived dentition is adapted for extreme hypercarnivory at the expense of the ability to process a range of prey with textural properties differing from meat (i.e., durophagy). In the other direction, extreme hypocarnivores and omnivores (e.g., ursids) have reduced shearing facets and increased surface area for grinding compared with canids. Even among the most morphologically unique canids, the large bone-cracking borophagine dogs, there persist surfaces capable of mastication of an array of textural properties (Van Valkenburgh et al., Reference Van Valkenburgh, Sacco and Wang2003; Tseng and Wang, Reference Tseng and Wang2011; Evans and Pineda-Munoz, Reference Evans, Pineda-Munoz, Croft, Su and Simpson2018). As such, we would expect that canids have among the most generalized diets of carnivoran lineages, and plastic foraging behavior is unlikely to show a clear signal within dental morphology alone.
Given the well-established allometric relationship between size and caloric intake needs, greater dietary specialization would be expected in taxa falling further along the tails of the body mass distribution (Gittleman and Harvey, Reference Gittleman and Harvey1982; Van Valkenburgh, Reference Van Valkenburgh and Gittleman1989; Alroy, Reference Alroy1998; Palmqvist et al., Reference Palmqvist, Mendoza, Arribas and Gröcke2002; Van Valkenburgh et al., Reference Van Valkenburgh, Wang and Damuth2004). Thus, the morphological feature we predicted would have the greatest correlation with dietary plasticity was body mass. While body mass did show a strong negative correlation with SEV, indicating larger-bodied species tend to have a more constrained dietary niche breadth, the correlation was not significant (albeit likely due to sample size constraints). The degree to which body size is a driving factor of extinction risk, however, has been called into question. Recent work has shown that increased body mass has not been associated with greater extinction risk among mammals throughout the past 65 million years of mammalian evolutionary history before the Pleistocene, when mammalian extinction became distinctly size-selective (Tomiya, Reference Tomiya2013; Smith et al., Reference Smith, Elliott Smith, Lyons, Payne and Vilasenor2019). Large body mass tends to lower metabolic costs associated with maintaining homeostasis (Gittleman and Harvey, Reference Gittleman and Harvey1982; Alroy, Reference Alroy1998; Hatton et al., Reference Hatton, McCann, Fryxell, Davies, Smerlak, Sinclair and Loreau2015). While large predators receive diminishing returns hunting smaller-bodied prey (Carbone et al., Reference Carbone, Mace, Roberts and Macdonald1999, Reference Carbone, Teacher and Rowcliffe2007), bigger bodies can also buoy fat reserves, allowing for increased time between meals (Millar and Hickling, Reference Millar and Hickling1990). Recent paleoecological studies have calculated that higher rates of diversity coupled with larger mean body mass of herbivores throughout the Tertiary would create higher rates of carrion as a resource subsidy to ancient carnivores (Blumenschine, Reference Blumenschine1989; Wilson and Wolkovich, Reference Wilson and Wolkovich2011; McHorse et al., Reference McHorse, Orcutt and Davis2012), thus further reducing the metabolic demands of larger body mass. Finally, body mass in modern canids is also correlated with social group hunting behavior. Pack dynamics enable canids to successfully hunt substantially larger prey and result in an overall net increase in energy gain (Kleiman and Eisenberg, Reference Kleiman and Eisenberg1973; Courchamp et al., Reference Courchamp, Rasmussen and Macdonald2002). Despite numerous hypotheses, social systems in extinct canid species have not been rigorously identified (Van Valkenburgh, Reference Van Valkenburgh1999; Van Valkenburgh et al., Reference Van Valkenburgh, Sacco and Wang2003; Andersson, Reference Andersson2005; Martín-Serra et al., Reference Martín-Serra, Figueirido and Palmqvist2016). However, given that pack hunting has evolved independently multiple times across the vertebrates (Packer and Ruttan, Reference Packer and Ruttan1988), it is highly likely that some large-bodied extinct canids were social hunters and thereby able to readily offset the metabolic costs of large size.
Underlying all analyses of the potential influence of dietary plasticity on species duration is the assumption that dietary behaviors remained relatively constant over time. While we cannot test this assumption explicitly for all species in our dataset due to sample-size constraints, we were able to evaluate intraspecific temporal trends in dental microwear parameters for Phlaocyon latidens. In doing so, we did not find any significant shifts across aggregated temporal bins for this species (Supplemental Material Fig. 2). Phlaocyon was a genus of small hypocarnivorous Borophaginae that had a broad distribution across North America with regional differences used to denote species (Wang et al., Reference Wang, Tedford and Taylor2009). P. latidens has been recovered only from within the John Day community, and specimens there are abundant and span an estimated 9.6 Myr of the Big Basin and Turtle Cove Units of the John Day Formation. P. latidens is believed to fill a similar ecological role to Cynarctoides lemur (Cope, Reference Cope1879a; Reference Copeb), a small omnivorous carnivore with dietary tendencies similar to modern-day procyonids and mephitids (Wang et al., Reference Wang, Tedford and Taylor2009). The microwear patterns we quantified are consistent with these functional roles, characterized by relatively high complexity and textural fill volumes consistently across time. This consistency suggests that dietary behaviors within this species remained relatively unchanged despite the decline and ultimate extinction of the species, and regardless of what caused the loss (e.g., climatic shift, competition, resource loss, etc.). This is an important assumption when aggregating species, especially when assessing the potential influence of dietary plasticity on species durations. Dental microwear is limited in terms of making direct correlations to types and numbers of prey items consumed; however, it does provide ecological context for species. Specifically, dental microwear is shown to correlate strongly with textural types of foods consumed, which can be used to discriminate dietary position and feeding roles in an ecosystem (e.g., carnivory, frugivory, durophagy, browsing, grazing, etc.). In this way, DMTA is similar to dietary inference from stable isotope analysis. It should be noted, however, that dental microwear captures a different window of an organism’s dietary activity, reflecting the last several meals of an individual’s life as opposed to a more extended period of tissue deposition that is integrated by stable isotope analysis (Calandra and Merceron, Reference Calandra and Merceron2016).
In this study, we do not postulate on the specific dietary items that were consumed by John Day canids as that is beyond the resolution of what is currently possible with DMTA. There is, however, a still-growing baseline of DMTA parameters for living carnivorans to which we can begin to draw comparisons. For example, we see Philotrox condoni Merriam, Reference Merriam1906, a species thought to be heavily carnivorous (Holliday and Steppan, Reference Holliday and Steppan2004; Balisi et al., Reference Balisi, Casey and Van Valkenburgh2018), falling within a DMTA region that is indicative of meat consumption in modern canids, with increased anisotropy due to consumption of tough, chewy foods. At the other extreme, previous work has suggested that Cynarctoides lemur consumed nuts, seeds, and other hard foods found within forest habitats. However, we did not find support in the DMTA data for this type of diet for C. lemur; the specimens we valuated did not show higher complexity and textural fill volumes that would be associated with processing a diet high in nuts or seeds (Table 1). Specific dietary classifications of extinct species, however, need further studies of extant species to be able to clarify more detailed dietary ecologies. Many of the smaller hypocarnivorous canids within the John Day are thought to be more ecologically analogous to procyonids and mephitids, which thus far are relatively understudied in terms of DMTA (DeSantis, Reference DeSantis2016).
Environmentally derived grit, in addition to textures from food material, can also abrade enamel (Karme et al., Reference Karme, Rannikko, Kallonen, Clauss and Fortelius2016), and there has been a large amount of discourse on the degree to which exogenous grit influences DMTA signals. This includes consideration of the properties of grit (e.g., size, shape, material, and amount) (Ackermans et al., Reference Ackermans, Winkler, Martin, Kaiser, Clauss and Hatt2020; Schulz-Kornas et al., Reference Schulz-Kornas, Winkler, Clauss, Carlsson, Ackermans, Martin, Hummel, Muller, Hatt and Kaiser2020; Winkler et al., Reference Winkler, Tütken, Schulz-Kornas, Kaiser, Müller, Leichliter, Weber, Hatt and Clauss2020), environmental factors (Hedberg and DeSantis, Reference Hedberg and DeSantis2016; Merceron et al., Reference Merceron, Ramdarshan, Blondel, Boisserie, Brunetiere, Francisco, Gautier, Milhet, Novello and Pret2016; Fannin et al., Reference Fannin, Singles, Esler and Dominy2021), microwear parameters of interest and statistical approach (Schulz-Kornas et al., Reference Schulz-Kornas, Winkler, Clauss, Carlsson, Ackermans, Martin, Hummel, Muller, Hatt and Kaiser2020), and focal species and food material properties (Adams et al., Reference Adams, Gray and Purnell2020; Hua et al., Reference Hua, Jianbin and Ungar2020; Mihlbachler et al., Reference Mihlbachler, Rusnack and Beatty2022). If any consensus can currently be made, it is that the influence of grit is highly contextually dependent. Given the volcanic history of central Oregon (Robinson et al., Reference Robinson, Brem and McKee1984; Getahun and Retallack, Reference Getahun and Retallack1991) coupled with a drying climate throughout the Miocene (Bestland et al., Reference Bestland, Retallack and Swisher1997; Retallack and Samuels, Reference Retallack and Samuels2020), there is a high likelihood of exogenous grit contributing to dental wear patterns within John Day canids. While the composition of volcanic ash of the John Day community has been well studied (Fisher, Reference Fisher1966; Robinson et al., Reference Robinson, Brem and McKee1984; Mohr et al., Reference Mohr, Famoso, Samuels, Laib and Schmitz2025), no study has attempted to identify the influence of ash grit on microwear, and that is beyond the scope of this study. Instead, we are assuming that environmental grit in the form of ash would apply equally to all sympatric canids from the John Day community and thus be contributing to noise, but not to any species-specific unidirectional skew in the data. While it is possible that nuances between microhabitats and behaviors (e.g., burrow denning, arboreality, cursorial or ambush hunting, etc.) could subject some canid species to differential grit loads, the absence of such detailed life history data for fossil canids limits modeling of these specific traits alongside DMTA parameters (Arman et al., Reference Arman, Prowse, Couzens, Ungar and Prideaux2019), and it is more conservative to assume a consistent level of grit exposure for all individuals across all species. While grit might obfuscate dietary details by shifting the distribution of data points or reducing variability of some microwear parameters over others, we still observed underlying variation across species in dietary niche breadth, indicating that any grit signal is not enough to eliminate biologically meaningful insights into dietary texture. Future studies focusing on microwear signals in other non-canid taxa from the John Day Formation and across fossil microhabitats in the region would help to clarify these assumptions and enable more complex models of dietary plasticity.
The result that species with more specialized (i.e., narrow) dietary breath appear to have greater longevity in the fossil record is counterintuitive as resource specialization is often considered a direct correlate to extinction risk (McKinney, Reference McKinney1997; Ferrer and Negro, Reference Ferrer and Negro2004; Boyles and Storm, Reference Boyles and Storm2007). This is due to evidence that reliance on limited prey diversity increases susceptibility of species to extirpation during high-intensity perturbations or extreme fluctuations in prey availability (McKinney, Reference McKinney1997; Terraube et al., Reference Terraube, Arroyo, Madders and Mougeot2011). Environmental conditions in the John Day community were relatively stable during the early Oligocene between volcanic events (Getahun and Retallack, Reference Getahun and Retallack1991; Bestland et al., Reference Bestland, Retallack and Swisher1997; Mohr et al., Reference Mohr, Famoso, Samuels, Laib and Schmitz2025), which could permit dietary specialization to convey fitness benefits such as decreased searching and handling times (Futuyma and Moreno, Reference Futuyma and Moreno1988; Egan and Funk, Reference Egan and Funk2006). Other evidence suggests that despite biological communities and climatic regimes undergoing pronounced shifts across the late Oligocene through mid-Miocene, environmental change does not correspond with extinction rates in Canidae (Silvestro et al., Reference Silvestro, Antonelli, Salamin and Quental2015; Balisi and Van Valkenburgh, Reference Balisi and Van Valkenburgh2020). Dietary specialization could also potentially enable niche compartmentalization, reducing competition pressure against radiating generalist species (i.e., intra-clade competition) and permitting survival amid a diverse mesopredator community/assemblage. However, the high degree of similarity between DMTA parameters between species from the John Day community does not necessarily support this hypothesis (Supplementary Materials Fig. 2).
It is important to reiterate, however, that while dental microwear can be used to quantify the textural diversity of diet and yield key insights into resource use, it cannot differentiate between specific prey items. It is thus possible that species with a narrow breadth in dental microwear parameters could be utilizing a wide variety of texturally similar foods. The opposite could also be true, that a species with a broad breadth in dental microwear parameters could be restricted to one prey item that is consumed differently depending on context, such as eating more flesh versus bone depending on position within a social hierarchy (Atwood and Gese, Reference Atwood and Gese2008) or primarily hunting versus scavenging. However, these situations are still describing differences in a species’ foraging behavior that tracks with the concepts of broad versus narrow dietary plasticity. A species that eats solely a wide diversity of foods that share highly similar textural properties is still exhibiting specialized foraging behaviors to find prey items of restrictive textural profiles, which could impact its ultimate lineage duration. A species that processes a greater variety of textural food items, regardless of the suite of prey represented, underlines a greater proclivity for facultatively altering dietary behaviors and thus increased dietary plasticity (Shipley et al., Reference Shipley, Forbey and Moore2009). The question of whether a species or population with broad dietary breadth is made up of differently specialized individuals carefully partitioning resources is commonly asked in modern studies on dietary ecology (Bolnick et al., Reference Bolnick, Svanback, Fordyce, Yang, Davis, Hulsey and Forister2003; Matthews and Mazumder, Reference Matthews and Mazumder2024). Ultimately however, these questions and available insights are scale dependent (Reddin et al., Reference Reddin, Bothwell, O’Connor and Harrod2018; Huang et al., Reference Huang, Tucker, Hertel, Eyres and Albrecht2021; McAulay et al., Reference McAulay, Monks, Wilson and Seddon2021), and we cannot track the dietary behaviors of individuals through time with fossils. Our inferences are thus constrained to the level of the John Day populations of restricted to geographically widespread co-occurring species. And while we are unable to associate the breadth of dental microwear parameters with any specific measures of prey item diversity, we can still shed light on the correlation between dietary plasticity and the duration of canid lineages.
Conclusions
This study demonstrates that, for the fossil canid community of the John Day Formation, signals of dietary behavior inferred from dental microwear do not align with broad morphological features commonly correlated with dietary categorization. While these differences might be specific to this community alone, it suggests that canids in the past, like canids today, were likely capable of extreme behavioral plasticity regardless of their overall morphologies. In addition, we find robust evidence that signals of dietary behavior show a stronger relationship with lineage durations than morphological tooth traits, with decreased dietary niche breadth as inferred from dental microwear textures associated with increased species durations. Thus, we caution that aggregated morphological traits might not accurately reflect the range of dietary plasticity we can infer for distinct paleontological communities, which could lead to differing interpretations of drivers of extinction risk.
Acknowledgments
This project was supported by the American Society of Mammalogists Grants-In-Aid of Research (2015), Oregon State University Zoological Research Funds (2015, 2016), the Paul and Mary Roberts Evolutionary Biology Fellowship from the Integrative Biology Department at Oregon State University (2017), Society for the Study of Evolution Graduate Research Excellence Grant (2018), Society for Vertebrate Paleontology Albert E. Wood Award (2018), Vanderbilt University (including equipment funded via NSF [EAR1053839] to DeSantis), and the Integrative Biology Department at Oregon State University. We thank the following curators for their valuable cooperation and assistance with sampling from their respective collections: C. Schierup and N. Famoso (John Day Fossil Beds National Monument Collection), C. Stinson (University of British Columbia Beaty Museum of Biodiversity), and P. Holroyd (University of California Museum of Paleontology). We also thank N. Famoso and three anonymous reviewers for their helpful comments on previous drafts of this manuscript.
Competing interests
The authors declare none.
Data availability statement
All data associated with this analysis can be found in the supplemental materials on Dryad (https://doi.org/10.5061/dryad.4mw6m90rm) and Zenodo (https://doi.org/10.5281/zenodo.19072928).



 Open access

