

Selenomethionine (SeMet) is an important organic nutritional source of Se( Reference Rayman 1 , Reference Papp, Lu and Holmgren 2 ). Absorption of various Se compounds occurs via different routes and mechanisms. Membrane transport of selenoamino acids, including SeMet, involves a specific suite of amino acid transporters( Reference Nickel, Kottra and Schmidt 3 ). The subsequent incorporation of dietary Se into selenoproteins occurs through a series of interconversions, of which many details remain unknown. Se metabolites are excreted in the urine and faeces and in exhaled air, mainly as selenosugars and methylated compounds( Reference Fairweather-Tait, Bao and Broadley 4 ).
The initial metabolism of Se in humans is poorly characterised. Estimates of Se absorption, whole-body retention and excretion have been made predominantly on whole-body counting( Reference Ben-Porath, Case and Kaplan 5 ) or the recovery of ingested tracers in the blood, urine and faeces( Reference Griffiths, Stewart and Robinson 6 ). Compartmental analyses of kinetic data from tracer studies have also been used to create a more integrated picture of whole-body Se utilisation in humans( Reference Swanson, Patterson and Levander 7 , Reference Wastney, Combs and Canfield 8 ). These studies characterised the long-term kinetics by the investigation of urine and faecal data collected over 12 d and blood samples drawn over 4 months. Through detailed mathematical modelling including several plasma pools, they were able to provide new insights into the long-run Se metabolism. However, because the study data only comprised hourly observations after dose administration, the initial Se kinetics could not be investigated and therefore still remained unclear. Our study tries to fill this gap and to provide deeper insight into the initial Se kinetics by focusing on frequent data collection within the first 2 h after administration. However, it should be noticed that the doses used in the previously mentioned studies( Reference Swanson, Patterson and Levander 7 , Reference Wastney, Combs and Canfield 8 ) were considerably larger (150–200 µg) than those administered in the present study (29 µg), which might affect the kinetics and thus hamper the comparability of our study to the previous studies. In an earlier study( Reference Madsen, Sjögreen-Gleisner and Elema 9 ), we had employed gamma camera imaging after oral intake of radio-labelled SeMet to quantify the gastrointestinal absorption capacity for SeMet and followed its postprandial distribution within the body. In the present study, we focused on dynamic gamma camera imaging with high temporal resolution to obtain data on both the intestinal absorption and the initial distribution of SeMet in humans. We developed a compartmental model that was able to capture the behaviour of the high-resolution data and thus shed more light on the initial SeMet kinetics in humans. For the development of a suitable mathematical model, we followed two approaches. The first one used the simplest model, – the model with the fewest compartments and parameters – to explain the observed data by adding components to the model until an acceptable fit was achieved. In a second approach, we investigated the previously reported models( Reference Swanson, Patterson and Levander 7 , Reference Wastney, Combs and Canfield 8 ) focusing solely on those model parts that corresponded to kinetics during the first 2 h after SeMet administration. Here, we subsequently eliminated terms until the parameters could be identified and an acceptable fit was achieved. Both approaches resulted in the same model.
Methods
Eight healthy men (age 24 (sd 3) years, weight 80·2 (sd 9·4) kg, height 1·81 (sd 0·05) m, BMI 24·6 (sd 3·0) kg/m2 and plasma volume 3·37 (sd 0·23) litres) participated in the study. All participants exhibited normal plasma Se levels before commencement of the study (1·00 (sd 0·10) μmol/l). None of the participants had undergone previous abdominal surgery (other than appendectomy) or was receiving any medication. This study was conducted according to the guidelines laid down by the Declaration of Helsinki, and all procedures involving participants were approved by the scientific ethics committees of the Capital Region of Denmark (Protocol No. H-3-2009-092) and Danish Data Protection Agency (Journal No. 2009-41-3751). Written informed consent was obtained from all participants.
75Se-l-selenomethionine
75Se-l-SeMet (75Se-SeMet) was produced and delivered by Hevesy Laboratory, DTU Nutec, Technical University of Denmark, Roskilde, Denmark, as described previously( Reference Madsen, Sjögreen-Gleisner and Elema 9 ).
Procedure
Each participant arrived at the laboratory after having fasted for at least 10 h. A cannula was inserted into the cubital vein for blood sampling. Lying supine on the gamma camera couch, the participants then ingested 3·6 (sd 0·3) MBq of 75Se-SeMet, comprising 29 μg Se dissolved in 350 ml of water. The solution was ingested in <15 s. The distribution of 75Se-SeMet was investigated for the following 2 h using dynamic gamma camera imaging. Thus, 120 1-min images of the abdominal region were acquired in both anterior and posterior projections. Imaging was performed with a dual-head gamma camera equipped with medium-energy, all-purpose collimators (Infinia VC HawkEye; GE Medical Systems Inc.) and connected to a dedicated image processing system (Xeleris; GE Medical Systems Inc.). The images were acquired in a 128×128 matrix, with each pixel measuring 4·4×4·4 mm and using 136 keV (± 10 %) and 272 keV (± 12·5 %) energy windows.
During gamma camera imaging, 10-ml blood samples were collected at 10-min intervals to monitor the plasma concentration of 75Se.
Processing of gamma camera data
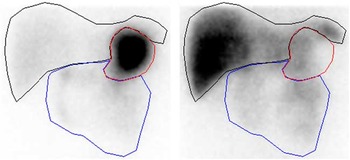
To correct for 75Se gamma ray attenuation caused by the gamma camera couch, a couch transmission factor was determined from an in vitro study with an approximated point source of 0·4 MBq of 75Se placed in the centre of the gamma camera detection field, with one detector above (anterior) and one detector below (posterior) the couch. For both 75Se energy windows, we found that the counts in a small region of interest (ROI) in the posterior-view image were about 90 % of the counts in the anterior-view image. In human studies, therefore, posterior-view counts were scaled up by a factor of 10/9=1·11. To compensate for gamma ray attenuation within participants’ bodies, pixel-by-pixel geometric mean images were generated from conjugate anterior and adjusted posterior images. Finally, the geometric mean images were analysed for activity in the stomach, small intestine and liver using ROI delineated manually by the same observer. Because of the small number of counts in each 1 min image, it was necessary to summarise the images to obtain a resolution that permitted reliable delineation of the ROI. Hence, the images were summarised in periods over 0–30 min for drawing the stomach ROI and over 30–120 min for drawing the small intestine and liver ROI (Fig. 1).
Representative regions of interest for sampling of scintigraphic data (subject A): stomach (red), small intestine (blue) and liver (black). Left image summarised over 0–30 min. Right image summarised over 30–120 min.
Plasma analysis
Blood samples were centrifuged immediately for 10 min at 1000 g , and the plasma was stored at −20°C until further analysis. To measure 75Se activity, 3-ml aliquots of plasma and an appropriate dilution of stock solution of 75Se-SeMet were counted for 30 min in a gamma well counter (Wizard 1480; Wallac Oy). For conversion into counts for total plasma volume, the total plasma volume of each participant was estimated from their height and weight data, according to tabulated references( Reference Hurley 10 ). All counts were corrected for physical decay and expressed as a percentage of the administered activity.
Kinetic modelling
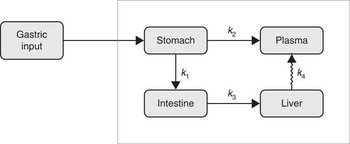
The kinetic model was developed to simultaneously capture the dynamics of data for stomach, liver, small intestine and plasma( Reference Lavielle 11 ). Parameter estimation and simulation of the compartmental models were carried out using Monolix( 12 ). The way in which data were collected gives rise to specific difficulties such as overlapping tissues. In Fig. 1, for instance, it is clearly visible that the stomach ROI covered parts of both liver ROI and small intestine ROI. Moreover, all three organs had underlying blood flow that contributed to the counts. Both phenomena had to be accounted for by the model. Additionally, we incorporated uncertainties in the data collection procedure itself (observation error) into our model. Hence, the final model consists of three parts. The first stage describes the hidden states, assumed to be the actual tissues under study, but not directly observable due to overlapping tissues and measurement uncertainties. The second part consists of the observational states. Here the stomach counts contain additional contributions from the liver, small intestine and plasma, and the liver and small intestine contain – apart from the tissues themselves (except those fractions that were erroneously interpreted as stomach counts) – additional contributions from plasma. Plasma is assumed to be directly observed, as these data were obtained from blood samples. The third stage of the model is given by the observation equations, which model measurement uncertainties. In this last part, both additive and multiplicative errors as well as combinations thereof were considered. Moreover, a random subject-specific component was introduced that allowed model parameters to vary across subjects and, therefore, to account for inter-individual variations in the model. This was achieved by fitting the data from all subjects to one overall model and at the same time assuming that the model parameters were drawn from a population (the population of subjects). That is, across different subjects, the parameters were assumed to vary randomly around their respective median value (the population estimate), and the extent of variation (i.e. their variances) quantifed the variability among subjects. This modelling approach improves population estimates compared with averages of individual estimates. The specific distributions used for the random effects were also part of the model building. Several models were tried to describe the data until a suitable model was found that provided an adequate fit with no systematic deviations. The Akaike information criterion and Bayesian information criterion were used to choose among the models. These are measures of the relative quality of the considered statistical models for a given set of data and can be viewed as measures that combine the goodness of fit and the complexity of a model. Finally, models developed in previous studies( Reference Swanson, Patterson and Levander 7 , Reference Wastney, Combs and Canfield 8 ) also were tried, even though they were developed for a different timescale and for other SeMet doses. However, neither these models nor similar versions thereof were able to describe the data. This might be attributed to the fact that those models were, on the one hand, initially developed for longer time scales and, on the other hand, were originally fitted to rather different types of data (plasma, urine and faeces) and were without data from the stomach, small intestine and liver. As these previous models seem to be inadequate to account for the present type of data (frequent recordings of initial SeMet distribution in the stomach, small intestine, liver and plasma), we opted for the most parsimonious model that was able to explain the data. The final model consists of four compartments, one for each of the observed tissues, including a delay between the liver and plasma. The dose arrived to the stomach with a short distributed delay, and all flows between the compartments were best modelled with first order kinetics. All random effects were best modelled with log-normal distributions, except for two parameters (a L and k e ), which were better fitted with their square root being normally distributed. Finally, the observation error for all compartments had a multiplicative component, with an additional additive component for liver and stomach data. The model is illustrated in Fig. 2, and model equations can be found in Table 1.
The final kinetic model for the compartmental analysis. Arrows represent pathways of fractional transport between the compartments. Delay is indicated with a jagged arrow.
Model definition
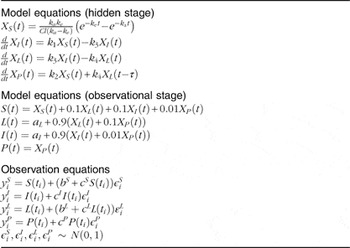
For each participant, the activity in each compartment was normalised by the maximum value over time of the sum of all four compartments. This normalising value corresponds to the initial dose in counts, and numbers can be interpreted as percentage of initial dose.
The disappearance half-life of 75Se-SeMet in the liver (t 1/2) was calculated using t 1/2=ln(2)/k 4 where k 4 is the outflow of 75Se-SeMet from the liver into the plasma.
Results
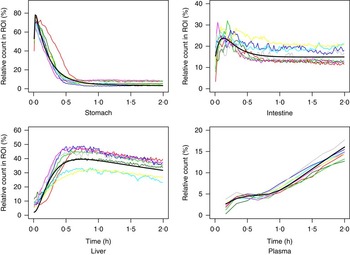
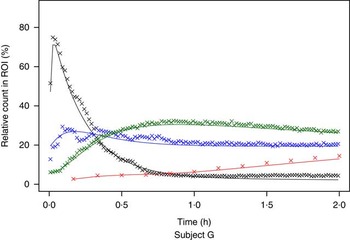
The measured time-activity curves for all participants are shown in Fig. 3. The black thick curve is the population fit of the model to data. An example of measured and fitted data from one individual is shown in Fig. 4.
Measured data for all participating subjects. ![]() , Subject A;
, Subject A; ![]() , Subject B;
, Subject B; ![]() , Subject C;
, Subject C; ![]() , Subject D;
, Subject D; ![]() , Subject E;
, Subject E; ![]() , Subject F;
, Subject F; ![]() , Subject G;
, Subject G; ![]() , Subject H;
, Subject H; ![]() , population fit. ROI, region of interest.
, population fit. ROI, region of interest.
Example of measured and modelled data for one participating subject. ![]() , Stomach;
, Stomach; ![]() , intestine;
, intestine; ![]() , liver;
, liver; ![]() , plasma. ROI, region of interest.
, plasma. ROI, region of interest.
All estimated values are given in Table 2. Thus, Table 2 shows the estimated rate parameters for the transport of 75Se-SeMet between the compartments and further model parameters along with their respective standard errors. Moreover, Table 2 depicts estimates of the measurement error parameters. The parameters indicated with c are proportions, and thus the largest measurement error was estimated to be in plasma, where it was 15·7 %. This is plausible, as the entire plasma count was extracted from a blood sample and prone to error due to estimation of blood volume and a possible heterogeneous distribution of SeMet in blood.
Definition of variables and parameters and estimated parameter values (Estimates with their standard errors)
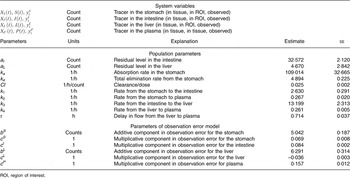
ROI, region of interest.
The mean disappearance half-life of 75Se-SeMet in the liver was estimated to 2·65 (95 % CI 2·56, 2·76) h and the delay in the liver was 0·714 (95 % CI 0·640, 0·790) h.
Discussion
Although Se is recognised as a nutrient essential to human health, initial Se metabolism is poorly characterised. Currently, our understanding of Se absorption, whole-body retention and excretion is based on whole-body counting( Reference Ben-Porath, Case and Kaplan 5 ) or balance and tracer studies( Reference Griffiths, Stewart and Robinson 6 – Reference Wastney, Combs and Canfield 8 ). Data from previous studies( Reference Burk, Norsworthy and Hill 13 – Reference Francesconi and Pannier 15 ) indicate a fundamental complexity of Se metabolism that can be explained by several factors. SeMet, the predominant form of Se in plant foods, is more easily absorbed compared with inorganic Se; however, both forms of Se are incorporated as selenocysteine into a variety of different selenoproteins, and Se is excreted in the urine in several forms.
Through compartmental analysis, it is possible to reduce the complexity of Se metabolism and to obtain an integrated picture of whole-body Se utilisation. On the basis of urine and faecal collection for 12 d and blood sampling for 120 d after oral ingestion of radio-labelled Se compounds, Wastney et al.( Reference Wastney, Combs and Canfield 8 ) used compartmental modelling to provide new insight into human metabolism of Se: specifically, the number of metabolic pools and their sizes, relationships and turnover rates. To attain an acceptable fit of the raw data, they constructed a complex, multi-pool model. This may be consistent with the fact that the human selenoproteome contains at least twenty-five selenoproteins, which can be expected to have different turnover rates( Reference Kryukov, Castellano and Novoselov 14 ).
In this study, we focused on the intestinal absorption of ingested SeMet and its movements between a restricted number of pools over the subsequent 2 h. The overall strength of the study was that the compartmental analysis was based on data sampled with high temporal resolution directly from each tissue of the model: three abdominal pools defined by the imaging technique and a plasma pool. We found that when restricting the investigation of kinetics to the first 2 h after SeMet administration, the dynamics of the data can be captured by a considerably simpler model as compared with the more complex models, which previously have been employed to describe Se metabolism( Reference Swanson, Patterson and Levander 7 , Reference Wastney, Combs and Canfield 8 ). The reason for this may be 2-fold. First, the measurements are taken on different time scales. Although measurements in the present study were taken every minute during the first 2 h after dose administration, the previous studies focused primarily on long-term dynamics, with data collection only at 30, 60 and 120 min during the first 2 h. These models, being designed for long-term behaviour, were therefore not able to describe the initial Se kinetics. Second, the previously applied doses of Se (150–200 µg) were considerably higher than those administered in the present study (29 µg). This difference in administered dose might result in a change of the kinetics.
According to our model, the initial amounts of radioactivity in the small intestine and liver compartments were on average 14·7 and 2·1 %, respectively, of the total dose of 75Se-SeMet. These findings indicate the rapid flow of the first part of the tracer from the stomach to the small intestine and from the small intestine to the liver, which is additionally implied by the rate parameter estimates of k 1 and k 3. The parameter a I was introduced to account for the final level of radioactivity remaining in the small intestine. This level was reached after about 60 min in all participants and comprised on average 14·7 % of the dose of 75Se-SeMet and might reflect use of SeMet in the protein synthesis of the enterocytes. Lathrop et al. ( Reference Lathrop, Johnston and Blau 16 ) determined the concentration of 75Se-SeMet in the liver 2·4 h after ingestion to be about 13 % of the dose/kg, corresponding to a total of about 24 %. In agreement with this, our model predicted that, on average, 33 % of the total dose of 75Se-SeMet was located in the liver 2 h after oral intake.
Consistent with previous observations( Reference Swanson, Patterson and Levander 7 ), our raw data showed an almost monotone increase in the plasma concentration of 75Se for the first 2 h after oral intake of 75Se-SeMet in all participants. Between 20 and 40 min after ingestion, however, the concentration of 75Se in the plasma reached a temporary plateau. This phenomenon, which has not been reported previously and most likely was exposed by the high temporal resolution of our data sampling, could actually be explained by our model. The model indicated that the first rise of Se level in plasma was due to inflow from the stomach, whereas the second rise was caused by inflow from the liver. The plateau originates from a delay in the flow from liver to plasma. Most likely, this delay could be explained by metabolic processes involving SeMet within the liver.
Note that the model proposed in the present analysis did not include any outflow from plasma. This assumption is certainly not in line with the true kinetics as the tracer will leave the body after a while. However, for the observed 2 h of study, this is in agreement with the findings of Swanson et al.( Reference Swanson, Patterson and Levander 7 ) and Wastney et al.( Reference Wastney, Combs and Canfield 8 ). In their studies, the level of the tracer in plasma was consistently rising during the first couple of hours, and it did not start to decrease before approximately 3 h after administration.
The purpose of our study was to model a natural state in the kinetics of the underlying system. If the rates at which 75Se-SeMet moves through the system are not constant, the findings reflect not only the rate at which 75Se-SeMet itself moves from one compartment to another but also the changes in rate. To meet the requirements of a natural state, the dose of 75Se-SeMet should be small relative to the amount of SeMet in the diet, so as not to change the natural metabolism in the system during the study. In the present study, all participating volunteers had normal plasma Se levels, and, apart from a short fast before data sampling, the study did not interfere with their usual diet regimen. Given that the normal daily dietary intake of Se in men is 60–120 μg( Reference Flynn, Hirvonen and Mensink 17 ), it is unlikely that our test dose of SeMet, which contained about 30 μg of Se, had a significant influence on the absorption and metabolism of SeMet per se. Consequently, it is reasonable to assume that all participants were in a natural state of SeMet turnover during data sampling.
In this study, fast dynamic imaging captured a relatively low count in each image. Inevitably, therefore, our procedure for defining the ROI was not perfect. Thus, a normal overlapping of parts of various organs in the anterior–posterior projections or movements of the participants during image acquisition could have caused some of the registered counts to be allocated to the incorrect ROI. However, we accounted for these deficiencies by explicitly including them in our final model.
The gamma camera technique is capable of tracing small quantities of γ ray emitting substances in vivo. Thus, the present dynamic approach provides an opportunity to explore the effects of food composition, gastrointestinal motility and gastrointestinal resection or bypass on the gastrointestinal absorption and initial turnover of physiological amounts of SeMet or other radio-labelled nutrients or food elements non-invasively. Thus, radio-labelled SeMet as a component of normal dietary protein could have yielded temporal information about the gastric emptying and the gastrointestinal breakdown of the dietary selenoproteins. Such data could have been incorporated into a kinetic model of the absorption and initial metabolism of dietary SeMet. However, the rate constants k 1 and k 3 derived using our imaging technique and modelling procedure may prove useful in clinical settings specifically focusing on the small intestine absorption capacity or aspects of the liver function.
Acknowledgements
The authors thank Ingelise Siegumfeldt and Bente Pedersen for their assistance in plasma analysis and all the subjects for their participation in the study. The mathematical processing was a part of the Dynamic Systems Interdisciplinary Network, University of Copenhagen.
The study was funded by grants from The Aase and Ejnar Danielsen Foundation (10-000243), The Hartmann Brothers Foundation (A7572), The P. A. Messerschmidt and Wife Foundation (028077-0002) and The Beckett Foundation (178PV/LS). None of the funders had any role in the design, analysis or writing of this article.
J. L. M. and M. D. designed the research; M. D., J. L. M., L. R. S. and S. F. conducted the research; M. G. R., S. D., L. R. S., S. F., J. T. O. and J. L. M. analysed the data; J. L. M., S. D. and M. G. R. wrote the paper; and J. L. M. had primary responsibility for the final content. All authors read and approved the final manuscript.
None of the authors declare any conflicts of interest.


