


Introduction
Subsurface environments of a planetary body have their own geomorphological and astrobiological significance as they are partially or fully shielded from the atmosphere and radiations (Dartnell et al., Reference Dartnell, Desorgher, Ward and Coates2007). In particular, in the case of Mars, caves have been proposed as Special Regions which require planetary protection measurements because of their potential to sustain terrestrial life. They also are of interest as a shelter for the future human exploration of Mars (Rummel et al., Reference Rummel, Beaty, Jones, Bakermans, Barlow, Boston, Chevrier, Clark, de Vera, Gough, Hallsworth, Head, Hipkin, Kieft, McEwen, Mellon, Mikucki, Nicholson, Omelon, Peterson, Roden, Sherwood Lollar, Tanaka, Viola and Wray2014; Martín-Torres et al., Reference Martín-Torres, Olsson, Zorzano, Bhardwaj, Sam and Singh2020). Subsurface environments influence the surface environment directly and indirectly. For example, on Earth, subsurface ground aquifers contribute to the Earth's hydrology and the interaction with the surface is one of the main processes of water exchange in the planet. Subsurface aquifers have also been reported to support plate tectonics (Oliver, Reference Oliver1986, Bethke, Reference Bethke1990) on Earth. Moreover, there is a diverse microbial ecology in the extreme subsurface environments on Earth, highlighting the astrobiological importance of such studies (Wang et al., Reference Wang, Xue and Ma2010a; Reference Wang, Xue and Ma2010b).
Until the commissioning of the Mars Advanced Radar for Subsurface and Ionosphere Sounding (MARSIS) instrument aboard the European Space Agency (ESA) Mars Express mission (Picardi et al., Reference Picardi, Plaut, Biccari, Bombaci, Calabrese, Cartacci, Cicchetti, Clifford, Edenhofer, Farrell, Federico, Frigeri, Gurnett, Hagfors, Heggy, Herique, Huff, Ivanov, Johnson and Zampolini2005), there was no direct observation of the unexposed Martian crust except for the study of exposed features such as crater and valley walls through high-resolution photography obtained through the Mars Orbiter Camera (Malin and Edgett, Reference Malin and Edgett2001) and the High-Resolution Imaging Experiment (HiRISE) onboard the Mars Reconnaissance Orbiter (MRO) (Grant et al., Reference Grant, Irwin, Grotzinger, Milliken, Tornabene, McEwen, Weitz, Squyres, Glotch and Thomson2008). Since the Mariner 9 mission to Mars, outflow channels have been detected in the Elysium region of Mars, indicating the presence of subsurface volatile reservoirs (Christiansen and Hopler, Reference Christiansen and Hopler1986). The recent Martian breakthrough discoveries such as the detection of putative sub-glacial liquid water below the ice in the south pole layer deposits (Orosei et al., Reference Orosei, Lauro, Pettinelli, Cicchetti, Coradini, Cosciotti, Di Paolo, Flamini, Mattei, Pajola, Soldovieri, Cartacci, Cassenti, Frigeri, Giuppi, Martufi, Masdea, Mitri, Nenna, Noschese, Restano and Seu2018), the detection of methane plumes within the Gale crater (Webster et al., Reference Webster, Mahaffy, Atreya, Flesch, Mischna, Meslin, Farley, Conrad, Christensen, Pavlov, Martin-Torres, Zorzano, McConnochie, Owen, Eigenbrode, Glavin, Steele, Malespin, Archer, Sutter, Coll, Freissinet, McKay, Moores, Schwenzer, Bridges, Navarro-Gonzalez, Gellert and Lemmon2014), exposed ice sheets in the mid-latitudes (Dundas et al., Reference Dundas, Bramson, Ojha, Wray, Mellon, Byrne, McEwen, Putzig, Viola, Sutton, Clark and Holt2018) and seasonal variation of the atmospheric composition along Gale crater (Trainer et al., Reference Trainer, Wong, McConnochie, Franz, Atreya, Conrad, Lefèvre, Mahaffy, Malespin, Manning, Martín-Torres, Martínez, McKay, Navarro-González, Vicente-Retortillo, Webster and Zorzano2019) have further raised interest in exploring the subsurface of Mars and potentially habitable environments where there is an interaction with the surface environments. Geomorphological studies of subsurface environments are crucial to obtain a greater insight into the evolution of planetary landforms, hydrology, climate, geology and mineralogy. The uniqueness of the Martian subsurface environments for geomorphological studies has been elucidated by Dundas et al. (Reference Dundas, Bramson, Ojha, Wray, Mellon, Byrne, McEwen, Putzig, Viola, Sutton, Clark and Holt2018), where radar soundings indicate the presence of debris-covered glaciers (Holt et al., Reference Holt, Safaeinili, Plaut, Head, Phillips, Seu, Kempf, Choudhary, Young, Putzig, Biccari and Gim2008; Plaut et al., Reference Plaut, Safaeinili, Holt, Phillips, Head, Seu, Putzig and Frigeri2009) as well as buried regional ice sheets. The volcanic, tectonic and hydrological history of the extraterrestrial bodies can also be obtained from the study of subsurface environments. Monitoring subglacial environments (e.g., de Jacob et al., Reference de Jacob, Bárcena and Finster2011) has shown evidence of climate change impacting the glacial systems. Also, the study of subsurface geology with its implication for the survival of biosignatures has been discussed by Dartnell et al. (Reference Dartnell, Desorgher, Ward and Coates2007). With the state of the art exploration focussed on the study of organic chemical biomarkers, carbon and sulphur isotopes, biologically significant minerals to search for the presence of past or extant life on Mars, the new approach to biosignature detection involves the study of biogeomorphological characteristics (Gorbushina et al., Reference Gorbushina, Krumbein and Volkmann2004; Naylor, Reference Naylor2005; Cady and Noffke, Reference Cady and Noffke2009; Noffke et al., Reference Noffke, Christian, Wacey and Hazen2013; Westall et al., Reference Westall, Foucher, Bost, Bertrand, Loizeau, Vago, Kminek, Gaboyer, Campbell, Bréhéret, Gautret and Cockell2015). This approach to explore Martian astrobiology through geomorphological analysis of surface and subsurface features on earth analogues has been reported by Corenblit et al. (Reference Corenblit, Darrozes, Julien, Otto, Roussel, Steiger and Viles2019).
The understanding of the evolution of ancient climate and the development of life on Earth has been derived from the study of mineralogical, textural and geochemical signatures preserved in the sedimentary rock record in stratigraphic sections (De Sanctis et al., Reference De Sanctis, Altieri, Ammannito, Biondi, De Angelis, Meini, Mondello, Novi, Paolinetti, Soldani, Mugnuolo, Pirrotta and Vago2017). Surface environments of Mars are rich in sedimentary outcrops that exhibit visible stratigraphic features at a range of spatial scales (e.g., Malin, Reference Malin2000; Malin and Edgett, Reference Malin and Edgett2003; Grotzinger et al., Reference Grotzinger, Bell, Herkenhoff, Johnson, Knoll, McCartney, McLennan, Metz, Moore, Squyres, Sullivan, Aharonson, Arvidson, Joliff, Golombek, Lewis, Parker and Soderblom2006; Dromart et al., Reference Dromart, Quantin and Broucke2007; Lewis et al., Reference Lewis, Aharonson, Grotzinger, Kirk, McEwen and Suer2008; Milliken et al., Reference Milliken, Grotzinger and Thomson2010), thus highlighting the importance of studying subsurface layering and compositions.
We have developed a subsurface operable rover called KORE (KOmpact Rover for Exploration) to facilitate the autonomous investigation of the geomorphology of subsurface environments and perform astrobiology studies in Martian analogues, with applications to mining on earth. KORE has been designed making use of commercial off the shelf components (COTS). KORE is a large, semi-autonomous rover weighing 160 kg with L × W × H dimensions 1.2 m × 0.8 m × 1 m and a payload-carrying capacity of 100 kg using 800 W traction power that can power to a maximum speed of 8.4 km h−1. The design and development of the rover for analogue research in mines on Earth have been elucidated in Mathanlal et al. (Reference Mathanlal, Bhardwaj, Vakkada Ramachandran, Zorzano, Martín-Torres, Cockell, Paling and Edwards2020). This paper is a continuation of that work where a nominal operation of the rover is demonstrated. It demonstrates the use the low-cost, robust and remotely operable subsurface rover KORE to perform geomorphology, astrobiology and environmental characterization studies during its operation in the Mine Analog Research (MINAR6) campaign during September 2018 in the Boulby Mine (UK).
MINAR6 campaign
MINAR is an advanced series of subsurface exploratory research to study the mine environments as a Mars analogue for geological, geomorphological and astrobiological research, building on potential collaboration between planetary scientists within an active mine. The MINAR programmes enhance the testing and development of instruments and scientific studies related to the robotic and human exploration of the deep subsurface (Bowler, Reference Bowler2013; Payler et al., Reference Payler, Biddle, Coates, Cousins, Cross, Cullen, Downs, Direito, Edwards, Gray, Genis, Gunn, Hansford, Harkness, Holt, Josset, Li, Lees, Lim, Mchugh, Mcluckie, Meehan, Paling, Souchon, Yeoman and Cockell2016; Cockell et al., Reference Cockell, Holt, Campbell, Groseman, Josset, Bontognali, Phelps, Hakobyan, Kuretn, Beattie, Blank, Bonaccorsi, McKay, Shirvastava, Stoker, Willson, McLaughlin, Payler, Stevens, Wadsworth, Bessone, Maurer, Sauro, Martin-Torres, Zorzano, Bhardwaj, Soria-Salinas, Mathanlal, Nazarious, Ramachandran, Vaishampayan, Guan, Perl, Telling, Boothroyd, Tyson, Realff, Rowbottom, Lauernt, Gunn, Shah, Singh, Paling, Edwards, Yeoman, Meehan, Toth, Scovell and Suckling2018). One of the main identified research gaps in this direction was demonstrating synergy between space technology and mining. Though space and mining represent two potentially separate facets of technology, there is a great scope for incorporating technology used in these fields in a synergistic manner. The comprehensive nature of the MINAR campaigns provides an ideal scenario to test new scientific instruments and technologies and also gather useful and reliable data for meeting the needs of research in deep subsurface environments. The MINAR6 campaign was a more concise version, succeeding the MINAR5 campaign with a focus on subsurface robotic exploration. The two-week campaign was a hypothesis-driven campaign and in this work, we summarize the results related to some of these hypotheses. One of the hypotheses was that the autonomous monitoring of the distances and shapes of certain natural or artificial features could be performed using a low-cost, robust 3D mapping point cloud generation system that can be used to (1) inform about geologically relevant structures; and (2) inform about the safety of the mine. The second hypothesis is that in an enclosed subsurface environment, the air may be accumulating volatiles. Some of them are potentially hazardous to the miners and monitoring them remotely is necessitated. The second hypothesis though deviates from the domain of astrobiology, is a crucial synergistic application of an astrobiological exploration tool for human safety which not only caters to terrestrial mining but also to future human space exploration of extra-terrestrial subsurface or enclosed environments on the Moon or Mars. A corroboration between astrobiology exploration with human safety is elucidated in Lim et al. (Reference Lim, Abercromby, Kobs Nawotniak, Lees, Miller, Brady, Miller, Mirmalek, Sehlke, Payler, Stevens, Haberle, Beaton, Chappell, Hughes, Cockell, Elphic, Downs and Heldmann2019) where the design of NASA Biologic Analog Science Associated with Lava Terrains research program is discussed. Finally, autonomous robotic exploration is always the first step in space exploration and monitoring, in a cave environment, the accumulation and release of volatiles may also be important to understand other surficial processes like methane or oxygen release which have been observed robotically on the surface of Mars by the Curiosity rover (Webster et al., Reference Webster, Mahaffy, Atreya, Moores, Flesch, Malespin, McKay, Martinez, Smith, Martin-Torres, Gomez-Elvira, Zorzano, Wong, Trainer, Steele, Archer, Sutter, Coll, Freissinet, Meslin, Gough, House, Pavlov, Eigenbrode, Glavin, Pearson, Keymeulen, Christensen, Schwenzer, Navarro-Gonzalez, Pla-García, Rafkin, Vicente-Retortillo, Kahanpää, Viudez-Moreiras, Smith, Harri, Genzer, Hassler, Lemmon, Crisp, Sander, Zurek and Vasavada2018, Trainer et al., Reference Trainer, Wong, McConnochie, Franz, Atreya, Conrad, Lefèvre, Mahaffy, Malespin, Manning, Martín-Torres, Martínez, McKay, Navarro-González, Vicente-Retortillo, Webster and Zorzano2019) and may have their origin in the subsurface. To validate these hypotheses, the KORE rover platform was updated with a set of low-cost dedicated instruments. The instruments aboard the rover provided useful and reliable data for meeting the research needs which are highlighted in this paper. Logistics issues and active mining work restricted the accessible region close to the Boulby Underground Laboratory. Though with the limited operating spatial area, most of the requirements to validate the hypothesis were justified.
Materials and methods
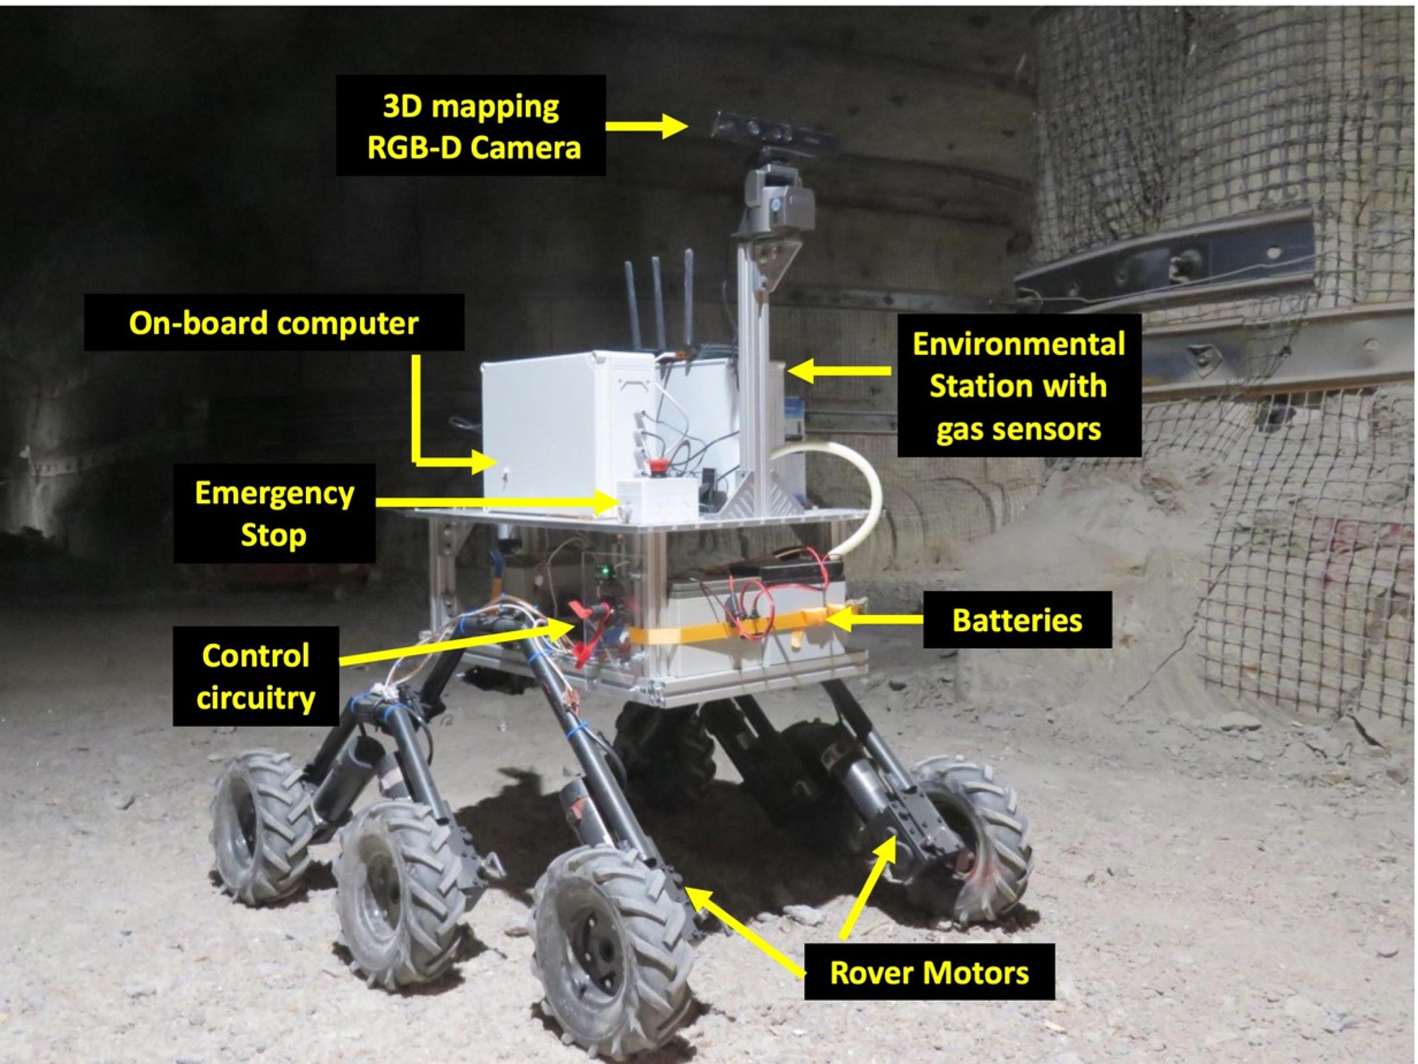
KORE is a low cost, robust rover platform designed to carry a wide suite of instruments for subsurface exploration in extraterrestrial analogue environments and key terrestrial environments such as mines. KORE is built with a robust design maximizing the use of COTS components and minimum custom-made parts to facilitate intelligibility to the research community to build such robotic platforms with a conservative budget without compromising the quality. The design ensures quick construction of the rover and improves portability of the rover to different field sites. The components used in the development of KORE are easily accessible and improve the serviceability of the rover in case of any failure. Moreover, the rover has the provision for easy and instant integration of more sensors as per the user requirements (Mathanlal et al., Reference Mathanlal, Bhardwaj, Vakkada Ramachandran, Zorzano, Martín-Torres, Cockell, Paling and Edwards2020). The in-situ 3D mapping tool eXploration of space 3D (InXSpace 3D) system, LASER-based methane detector and environmental sensors are the most critical instruments aboard the KORE rover. Figure 1 shows KORE during operation in the MINAR 6 campaign with the major components marked in the image.
KORE rover operating in the Boulby Mine during MINAR 6 campaign. The equipment is marked.
InXSpace 3D system
The InXSpace 3D system is a real-time 3D mapping system designed using a Microsoft Kinect™ first-generation camera that works based on Structured Light technology where the camera projects an active pattern and obtains the depth information by analysing the deformation of the pattern. The Microsoft Kinect™ camera also has a depth error in the order ≤1 to 75 mm depending upon the measurement distance from the sensor. Below 3 m the error rate is <1 mm, which justifies its application to short-range mapping. The total mapping range of the Kinect camera is 0.8–4 m.
LASER-based methane detector
The KORE rover utilizes a portable drone-mounted remote laser methane detection system from Hesai photonics. The methane detector works based on absorption spectroscopy and is pre-calibrated in the factory and is operable in the field out of the box. However, the methane detector was tested and the readings were validated, in laboratory conditions before mounting on the KORE rover. The detector provides a methane concentration output which is the integrated concentration of methane along the path of the laser beam. The specifications of the methane detector can be found in Table 5 of the first paper (Mathanlal et al., Reference Mathanlal, Bhardwaj, Vakkada Ramachandran, Zorzano, Martín-Torres, Cockell, Paling and Edwards2020).
Environmental Station
The Environmental Station on the KORE Rover has a multitude of sensors measuring common air pollutants, particulate matter and environmental parameters such as temperature, pressure and relative humidity. The gases measured are NO2, SO2, H2S, formaldehyde, CO, CO2, O3, O2 and volatile organic compounds (VOC). Ultra-Low Power Analog Gas Sensor Modules from Spec Sensors are used to measure the gases NO2, SO2, H2S, CO, O3 and VOC. Formaldehyde measurements are obtained from DFRobot Air Quality Monitor module. O2 measurement is obtained using digital ultraviolet (UV) Flux 25% Oxygen Sensor from CO2meter and CO2 measurement is obtained from The |CozIR®-A 2000 ppm CO2 Sensor from CO2meter. These sensors are pre-calibrated in the factory and have been particularly chosen for its pre-calibration which dissuades the need to perform a calibration procedure before deployment, saving cost and time. An Arduino microcontroller is employed in the retrieval of these gases and the data are stored onboard the environmental station computer. The data can be accessed through the rover computer or also directly from the environmental station itself. The environmental station provides a vivid characteristic of the environment around the rover.
During the MINAR6 campaign, a number of experiments were performed with these instruments onboard with a 6-day experimentation window with a total experimentation time of ~22 h. MATLAB and Cloud Compare software was extensively used during the analysis of the experiments.
Results and discussion
Algorithm testing with InXSpace 3D
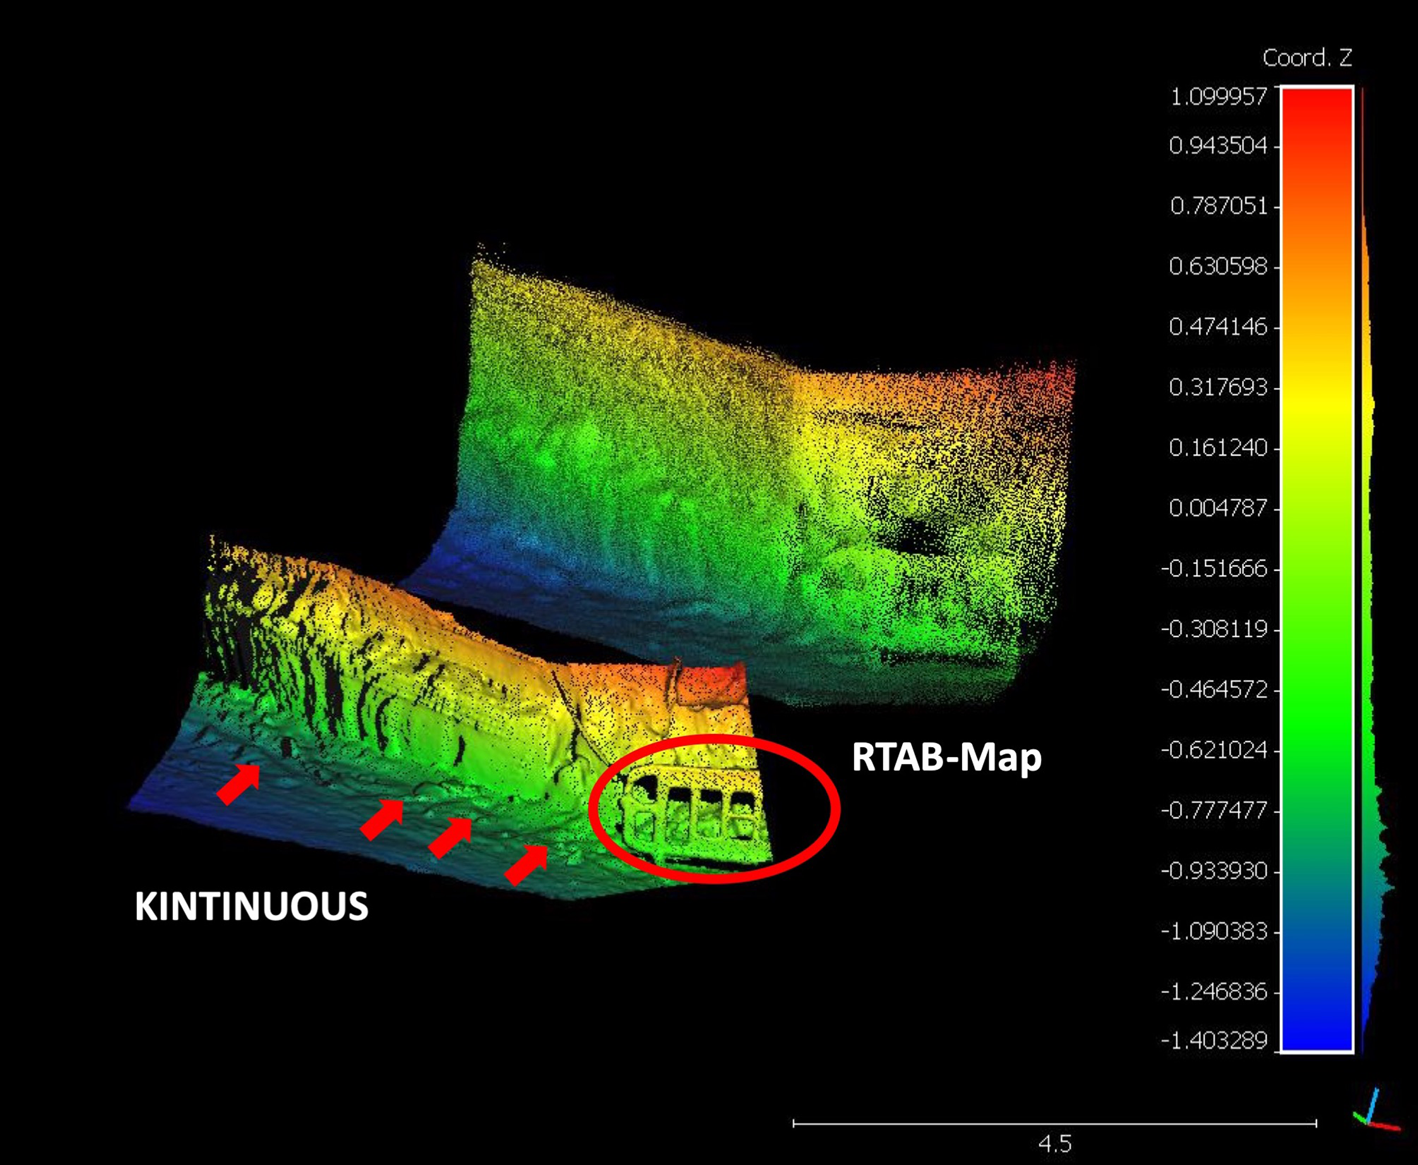
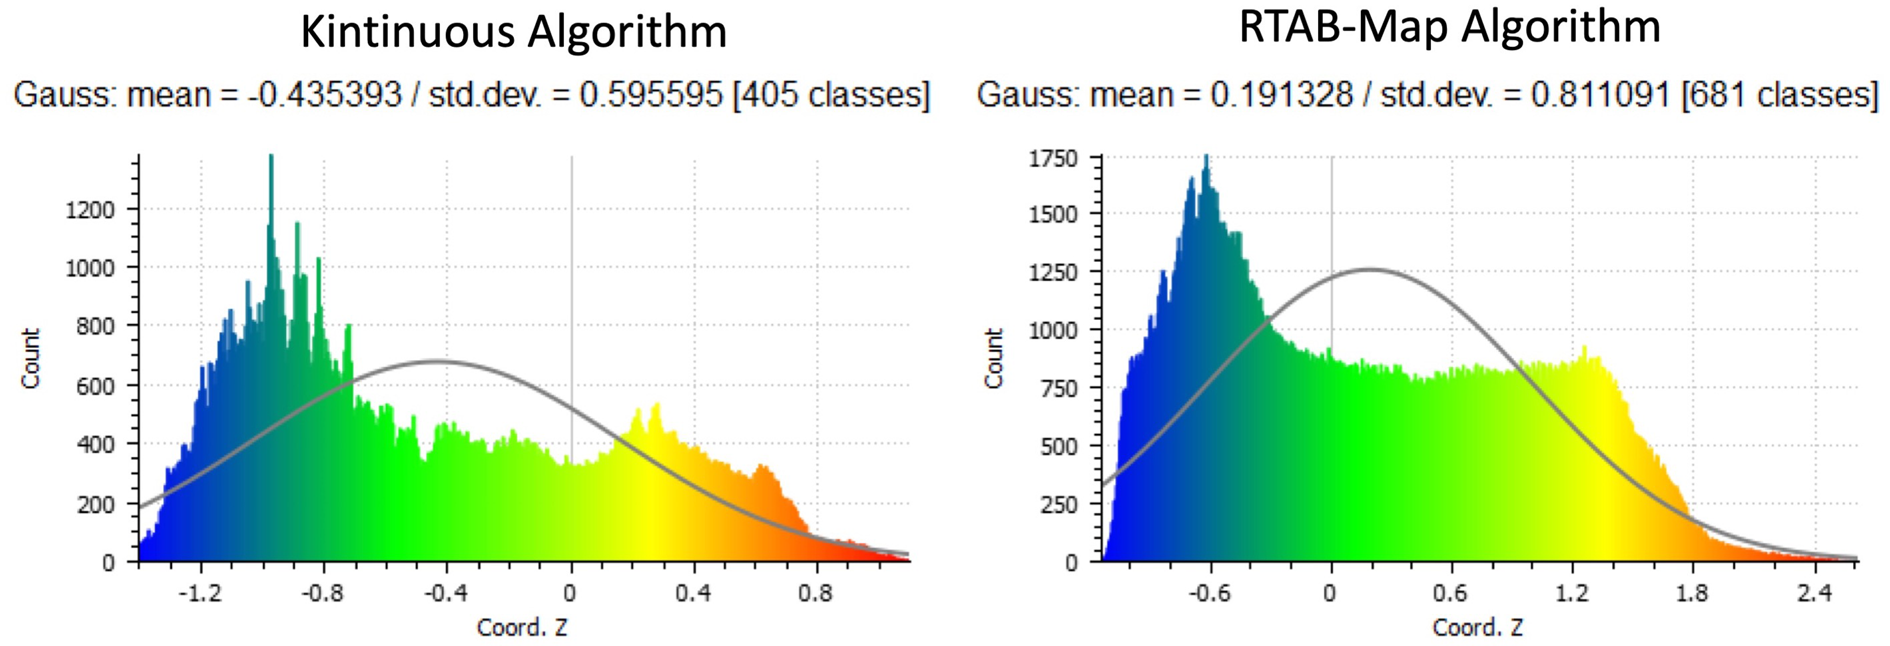
During the MINAR6 campaign, experiments were made with two dense simultaneous localization and mapping (SLAM) algorithms, Kintinuous (Whelan et al., Reference Whelan, Johannsson, Kaess, Leonard and McDonald2012a, Reference Whelan, McDonald, Kaess, Fallon, Johannsson and Leonard2012b) and Real-Time Appearance-Based Mapping (RTAB-Map) (Labbé and Michaud, Reference Labbé and Michaud2018), to choose the best algorithm for InXSpace 3D system. These two dense SLAM algorithms were chosen for study as they were compatible with the OpenNI driver through which the Microsoft Kinect first-generation camera was interfaced to the onboard Nvidia JETSON computer. The region along the mine shaft walls was chosen to test the resolution of the system with its capability to generate a point cloud with very minute details. The features along the mine shaft walls with the ground provided an ideal scenario to validate the 3D reconstruction capabilities of the algorithms used. KORE was made to perform two traverses with each algorithm loaded on a traverse. The traverses were made with identical velocity to ensure that both the algorithms had a similar time for scanning. The results from the two algorithms are shown in Fig. 2. It could be determined from the reconstructed Digital Terrain Model (DTM), that the Kintinuous algorithm produced a more pronounced point cloud compared to the RTAB-Map. The RTAB-Map captured more points than the Kintinuous algorithm but suffers from the poorer reconstruction of 3D map from the points. Figure 3 shows the histogram plot that indicates the number of points captured by each of the algorithms against the coordinate distance along z-axis. The spectral colour coding in the histogram marks the depth information of the points along the z-axis, with blue indicating points close to the ground and red in the farthest vertical height from the ground, as seen in Fig. 2. As clear from Fig. 3, RTAB-Map captured a larger portion of the wall in the same lighting conditions from the fixed point of observation, resulting in a greater number of points (Fig. 3). However, the point density of Kintinuous (7637 points m−2) was better and that resulted in an extremely well-constructed DTM where even cm-scale pebbles on the surface or minor grooves in the mine wall were clearly discernible. Thus, the use of either of these algorithms can be attributed to the user need for either higher resolution DTM or covering a larger area in lesser time at coarser resolutions.
Digital Terrain Model (DTM) of mine shaft walls generated from point cloud obtained through two different dense SLAM algorithms – Kintinuous and RTAB-Map. The scale bar is in metres. The red ellipse marks the barricade that was not resolved by RTAB-Map and the red arrows mark the pebbles and rocks on the surface.
Histogram of the points in the point cloud image along the z-direction for both the algorithms – Kintinuous (left) and RTAB-Map (right). The scaling in both the algorithms is different accounting for the observed differences in z-coordinates.
A detailed comparison between Kintinuous and RTAB-Map algorithm is elucidated by (Altuntas et al., Reference Altuntas, Uslu, Cakmak, Amasyali and Yavuz2017). Both the algorithms are visual SLAM systems but however, their approach to map features result in different performance rates. Kintinuous is more dependent on depth data, while RTAB-Map effectively uses RGB data. Since lighting conditions in subsurface environments are limited, the RTAB-Map suffers poor reconstruction of point cloud giving Kintinuous an upper hand in the 3D reconstruction of the point clouds. Thus, the further analyses of InXSpace 3D performance in this paper have been evaluated using Kintinuous algorithm as we were more interested in observing the clarity of reconstructed 3D terrain. InXSpace 3D can operate in pitch black dark scenarios owing to the presence of the infrared projector and scanner. The Microsoft Kinect camera projects a structured infrared light against the target to determine the depth information, which is then combined with the RGB-data. The Kintinuous algorithm uses these two data sets to obtain the 3D point cloud, enabling the capability to operate under varied lighting conditions. However, the influence of lighting on the point cloud generation with the Kintinuous algorithm was tested to determine if there was any significant drop in efficiency with zero lighting conditions. KORE was made to perform two traverses at identical velocities with onboard lights switched on and switched off. The DTMs obtained from the point clouds generated by Kintinuous algorithm during the two traverses are shown in Fig. 4.
DTM obtained from the point cloud captured using Kintinuous algorithm in two conditions – Lights ON and Lights OFF. The green box denotes the camera position and orientation at the beginning of the scan. The scale bar is in metres. The yellow ellipses highlight the blank regions in Lights-OFF conditions.
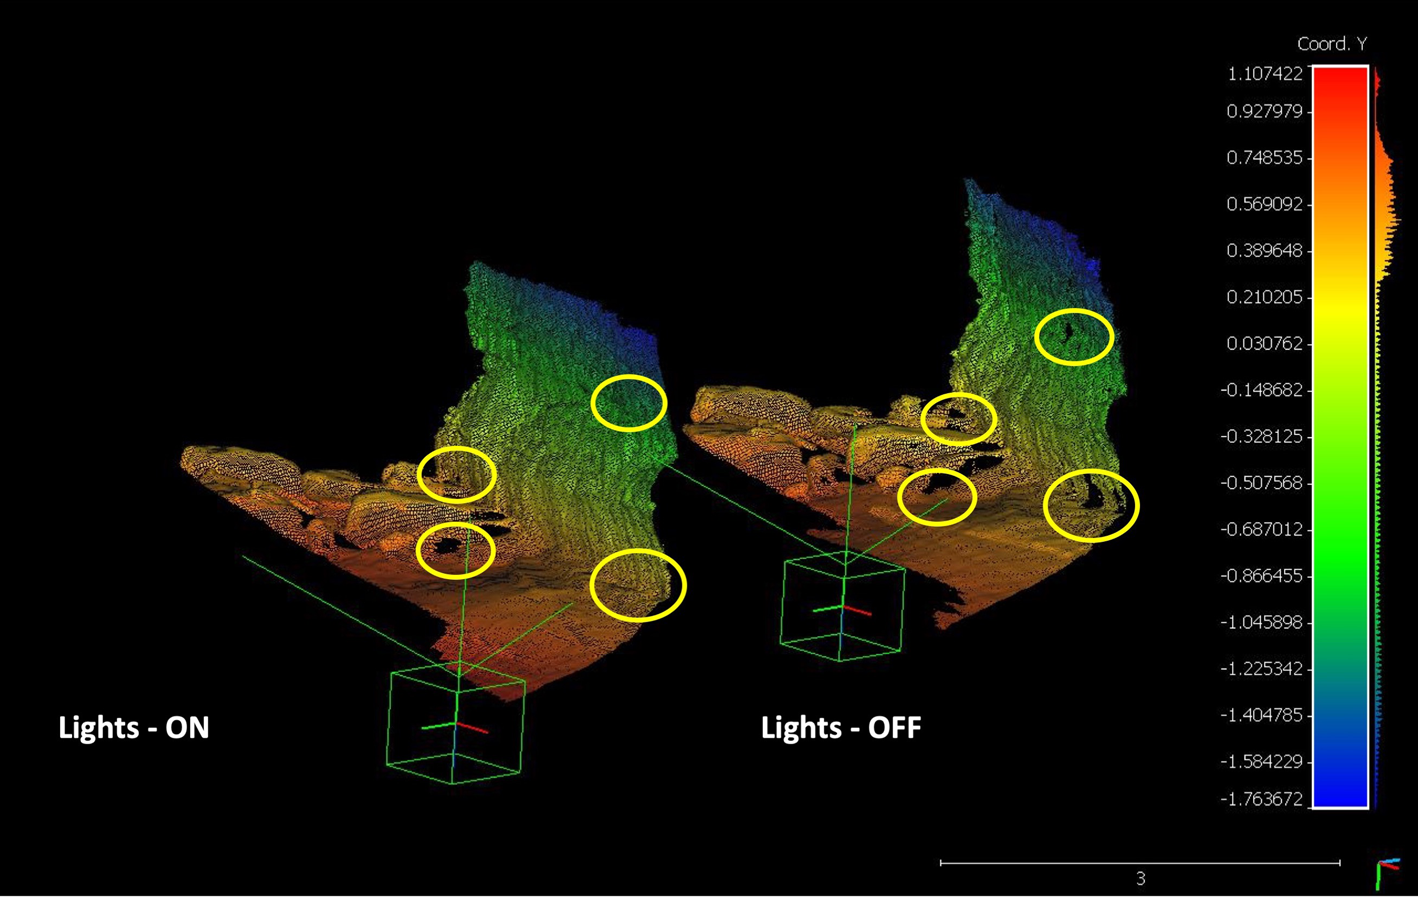
It could be seen from both the DTMs of the mine shaft walls that the point clouds are remarkably similar except for a few blanks (yellow ellipses in Fig. 4) in the lights-off condition. The reason for the loss of points in the lights-off condition is attributed to the operation of the Kintinuous algorithm. The Kintinuous algorithm uses two methods to estimate the pose, with geometric estimation being the first method utilized. This method matches the infrared depth data with the closest point in the scanned 3D volume. The second method utilizes the photometric estimation by comparing RGB data from two consecutive frames. The Kintinuous algorithm then estimates the final pose by taking a weighted sum of the geometric and photometric estimation. As elucidated in Altuntas et al. (Reference Altuntas, Uslu, Cakmak, Amasyali and Yavuz2017), Kintinuous primarily uses depth data than RGB-data for the 3D reconstruction of point clouds. With the presence of lights in the latter scenario, the availability of more RGB data points provides a slightly better pose estimation of the point clouds. A statistical evaluation of the surface density of the point clouds under both lights-on and lights-off condition is shown in Fig. 5.
Surface density of the point clouds under lights on condition (left) versus the surface density of the point clouds under lights off condition (right). The Kernel size of the points in both cases is 0.035.
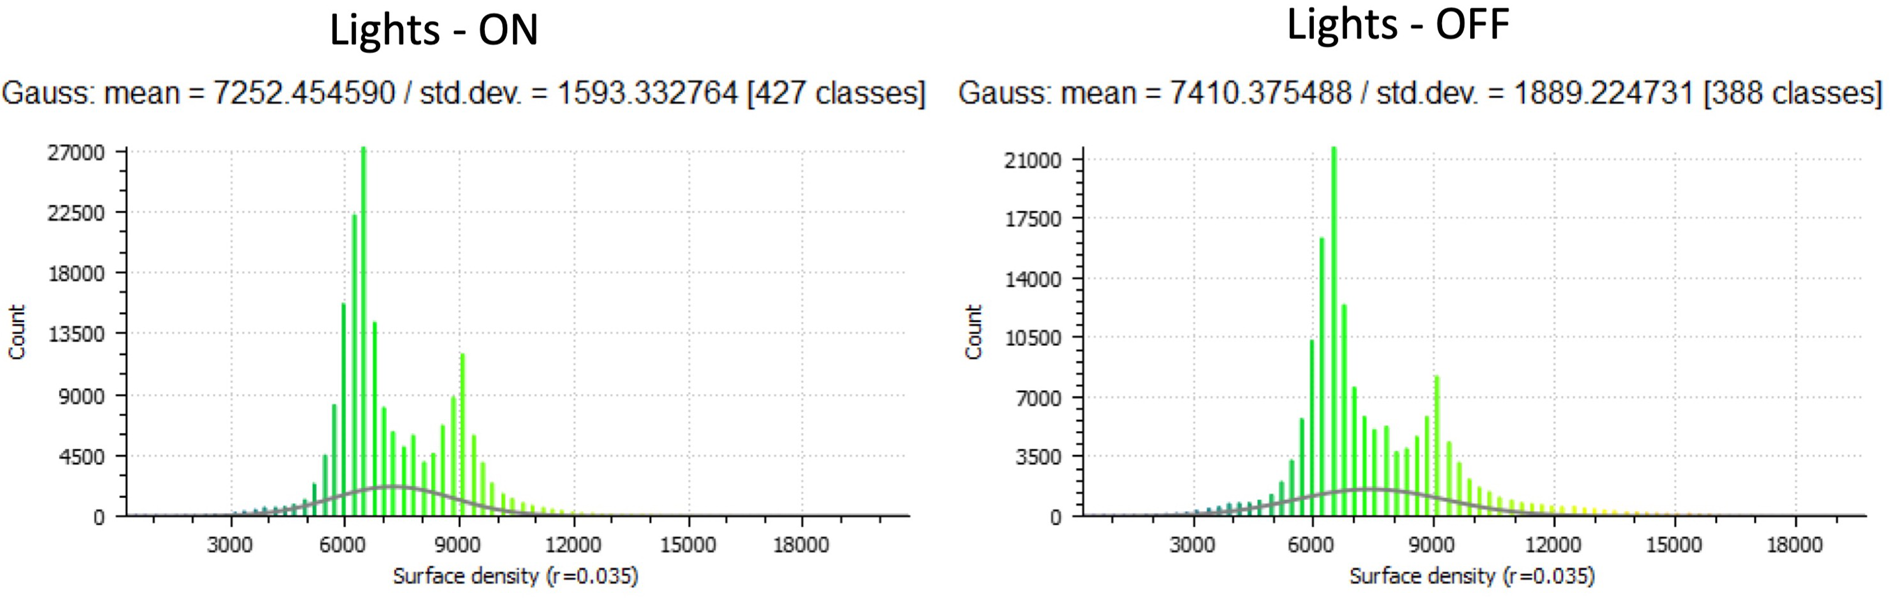
The graph on the left shows denser point cloud counts observed in the lights-on condition, whereas, the graph on the right shows rarer point cloud counts in the lights-off condition. This explains the few blank spots observed in the DTM image of the mine shaft walls. However, it could be determined that the surface density profile of the point clouds was very similar. This shows that the resolution obtained in both cases is indistinguishable. Thus, it is validated that the InXSpace 3D system has a very good capability of 3D reconstruction in pitch black conditions.
Mapping of polygonal features with InXSpace 3D
One of the most interesting geomorphological features found in the Boulby Mine is the dark lined polygon features observable in the ceiling of the mine shafts which represents a 250 million-year-old Permian evaporitic deposit. Figure 6 shows the RGB image of the polygon feature observed in the Boulby Mine.
RGB-image of the polygons observed in the mine shaft of the Boulby Mine.
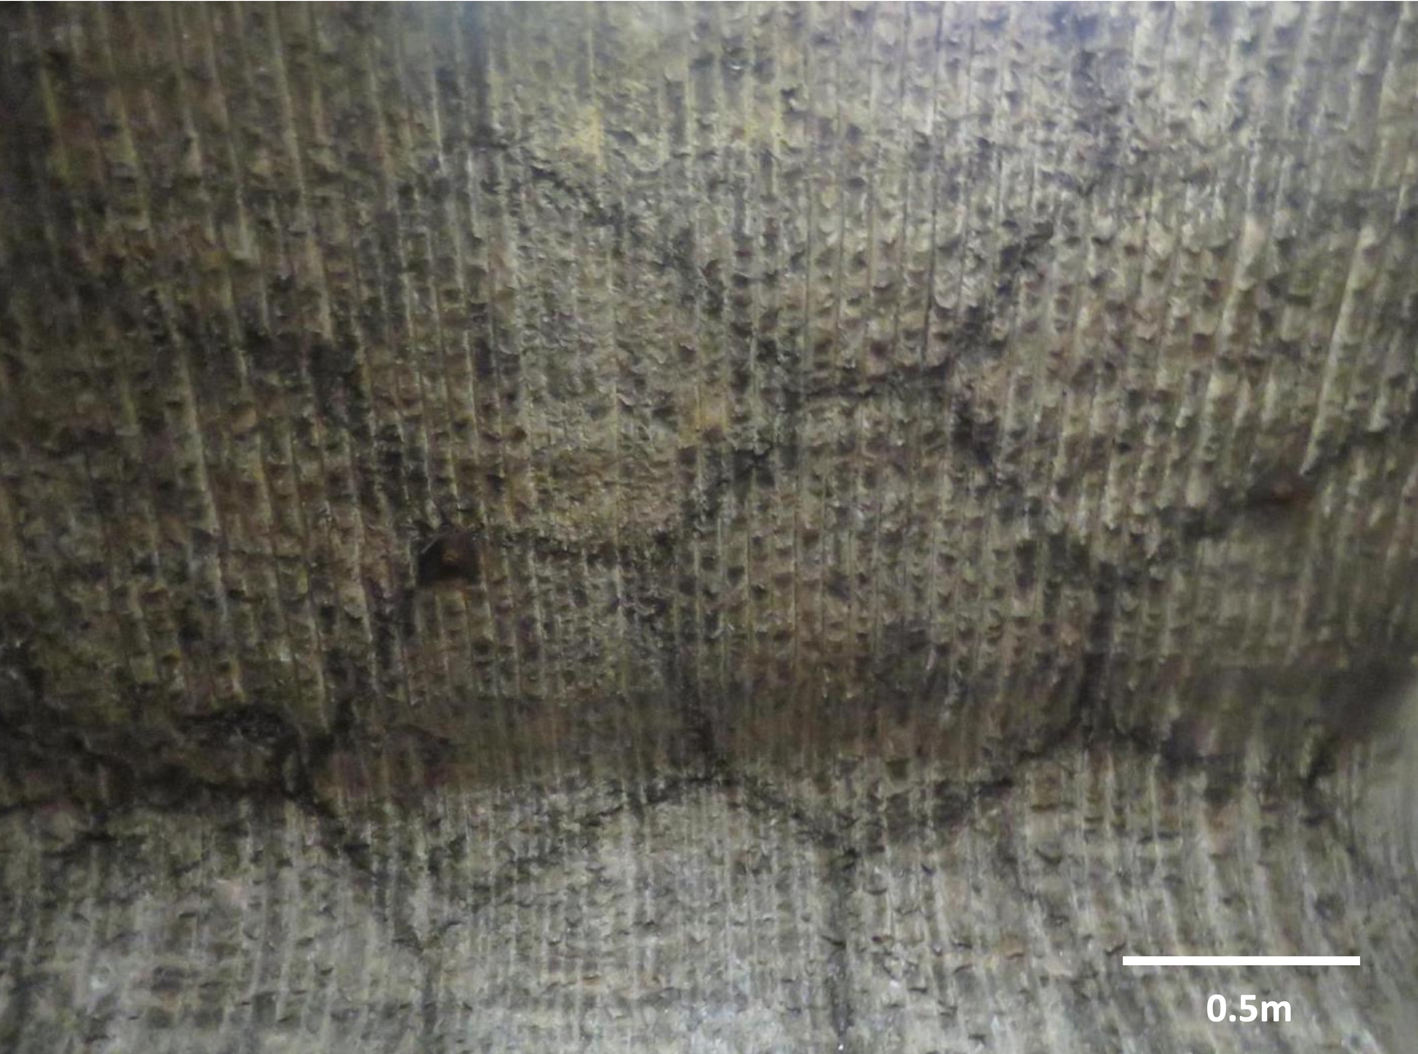
These polygons with black rims and white salty matrix in the middle are hypothesized to be remnant minerals from the Zechstein that generated these evaporitic deposits 250 million years ago. During the MINAR 5 campaign (Cockell et al., Reference Cockell, Holt, Campbell, Groseman, Josset, Bontognali, Phelps, Hakobyan, Kuretn, Beattie, Blank, Bonaccorsi, McKay, Shirvastava, Stoker, Willson, McLaughlin, Payler, Stevens, Wadsworth, Bessone, Maurer, Sauro, Martin-Torres, Zorzano, Bhardwaj, Soria-Salinas, Mathanlal, Nazarious, Ramachandran, Vaishampayan, Guan, Perl, Telling, Boothroyd, Tyson, Realff, Rowbottom, Lauernt, Gunn, Shah, Singh, Paling, Edwards, Yeoman, Meehan, Toth, Scovell and Suckling2018), samples were taken by sterile drilling of cores and the samples were analysed for the presence of lipid biomarkers. The recent analysis of the lipid biomarker has revealed the presence of a very low abundance of biomass dominated by primary alkanes and low levels of hopanes and steranes which are proposed to have been uniformly distributed along with the interior of the polygons quite rapidly before the crystallization of the halite (Wilhelm et al., Reference Wilhelm, Cockel, Perl, Wadsworth, Payler, Paling, Edwards and McMahon2019). The study also concludes that lipid biomarkers should have been from a terrestrial source and they have not undergone a significant thermal maturation since their deposition. The formation mechanisms of the polygons are not precisely known. They could be desiccation cracks, cracks caused by thermal contraction or they could be formed by other mechanisms (e.g. Warren, Reference Warren1999; Abbott, Reference Abbott2016). In the case of desiccation, tepee-like structures are often formed (Warren, Reference Warren1999). The black-rimmed polygons which were studied for lipid biomarkers were scanned with InXSpace 3D system to look for any observable tepee projections along the black rim of the polygons. Figure 7 shows the 3D point cloud image of the polygon feature (left) and the DTM of the corresponding 3D point cloud image. The InXSpace 3D was positioned such that the Kinect camera was pointing straight up to the polygons (Z-axis) on the ceiling, parallel to the polygon plane.
(left) RGB point cloud of the polygon; (right) DTM analysis of the polygon feature. The camera was positioned along the z-axis parallel to the polygon plane. The scale bar is denoted in metres.
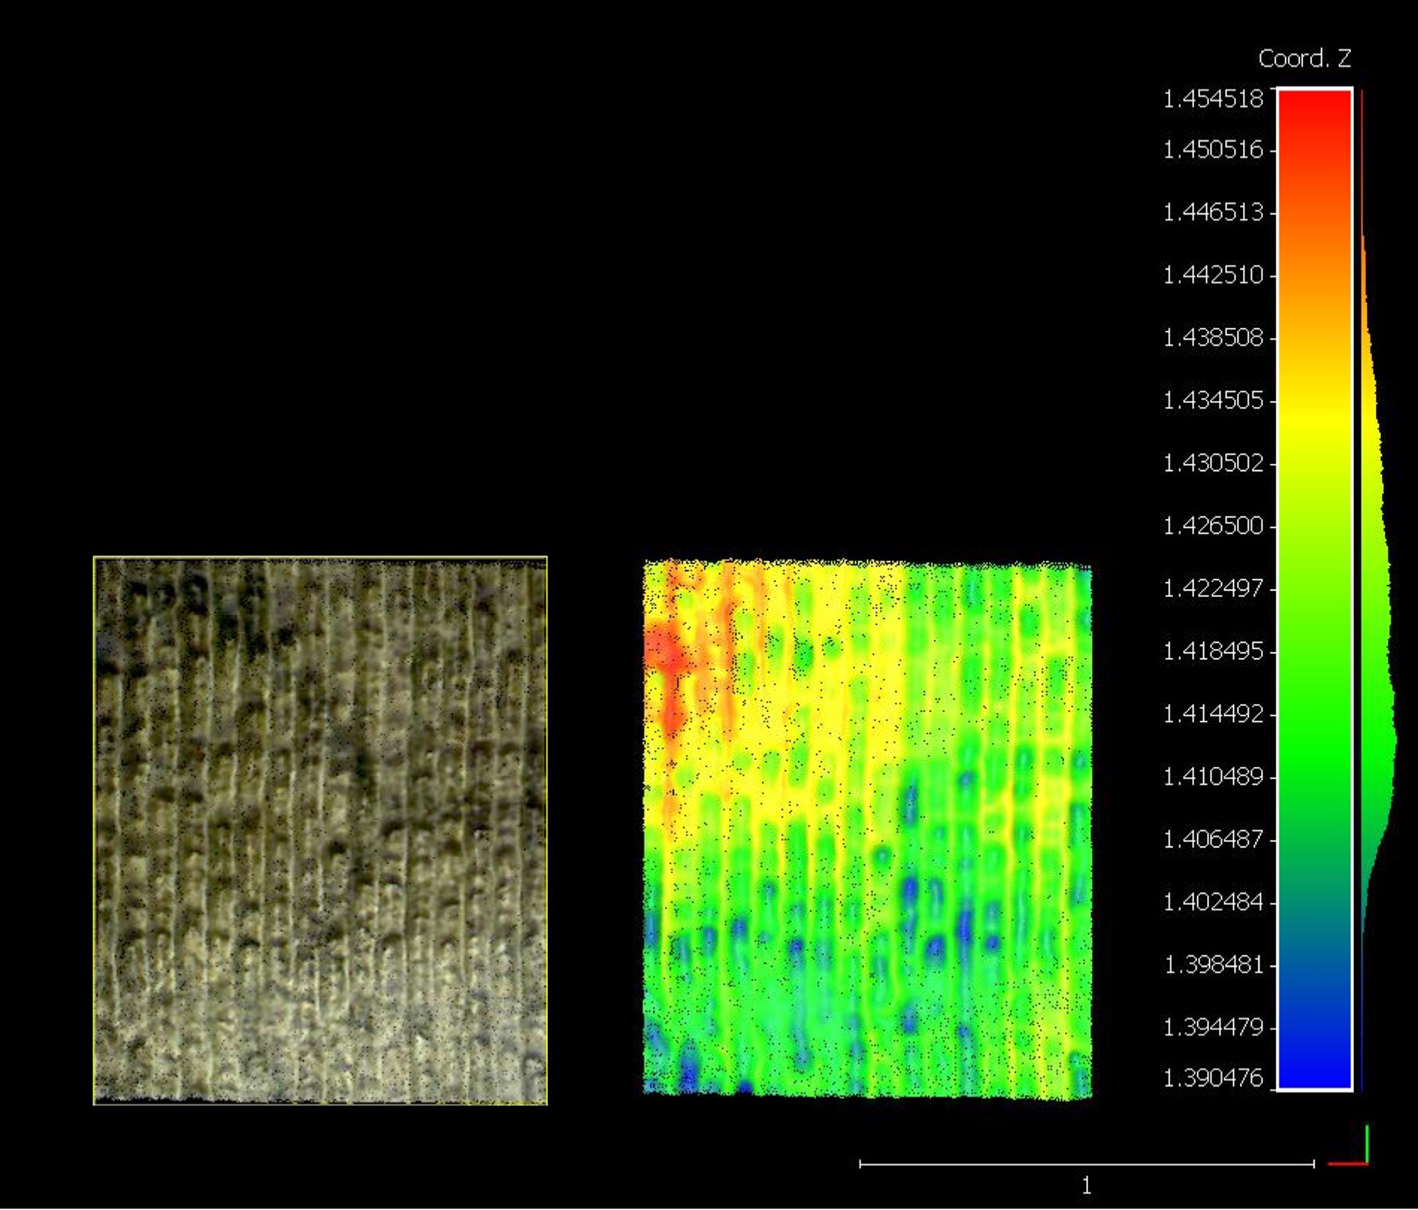
From the DTM it could be found that there is no tepee pattern observable corresponding to the black rims of the polygon. This case shows, however, the ability to observe 3D features with a very high resolution of 4 mm, which in this case are artificial and have been produced by the tools that were used to scrape this wall and expose the polygons. This was a case-specific scenario where the topographic changes were not present in the underlying polygon and only colour differences were marking the polygon boundaries. Thus, it does not mean that the system is unable to detect the topographic changes if they are actually present in another scenario or the algorithm is unable to make use of such detected topographical information in mapping. In spite of the absence of 3D features, the observable colour variations could indicate the presence of a different product, accumulated through a contraction-expansion process and/or a water cycle process. This boundary may concentrate on different minerals and create a different environment where biomarkers may have been preserved. These data show the potential for the use of this type of imaging for geomorphological analysis on Earth and in the subsurface of extraterrestrial bodies. Geomorphological mapping system cannot be considered as an absolute tool to study biomarkers but it is of course an accessory, as demonstrated by InXSpace 3D, that may be used for sample selection. The evolution of life on Earth has led to the formation of several biogeomorphological changes in the landforms and surface processes (Viles, Reference Viles1988; Butler, Reference Butler1995). Extending the capability of the InXSpace 3D apart from RGB imaging and depth map generation, an image processing framework has been developed in MATLAB to characterize the corner points in the polygon features. The framework was originally built to analyse polygons on Mars through the HiRISE images obtained from the MRO. Figure 8, shows the HiRISE image of the Martian polygon dunes, captured by the MRO on 18 March 2013.
HiRISE image of polygonal dunes of Mars (ESP_031138_1380) in original size (scale factor 1) with the inset image showing a zoomed-in polygonal dune (scale factor 10).
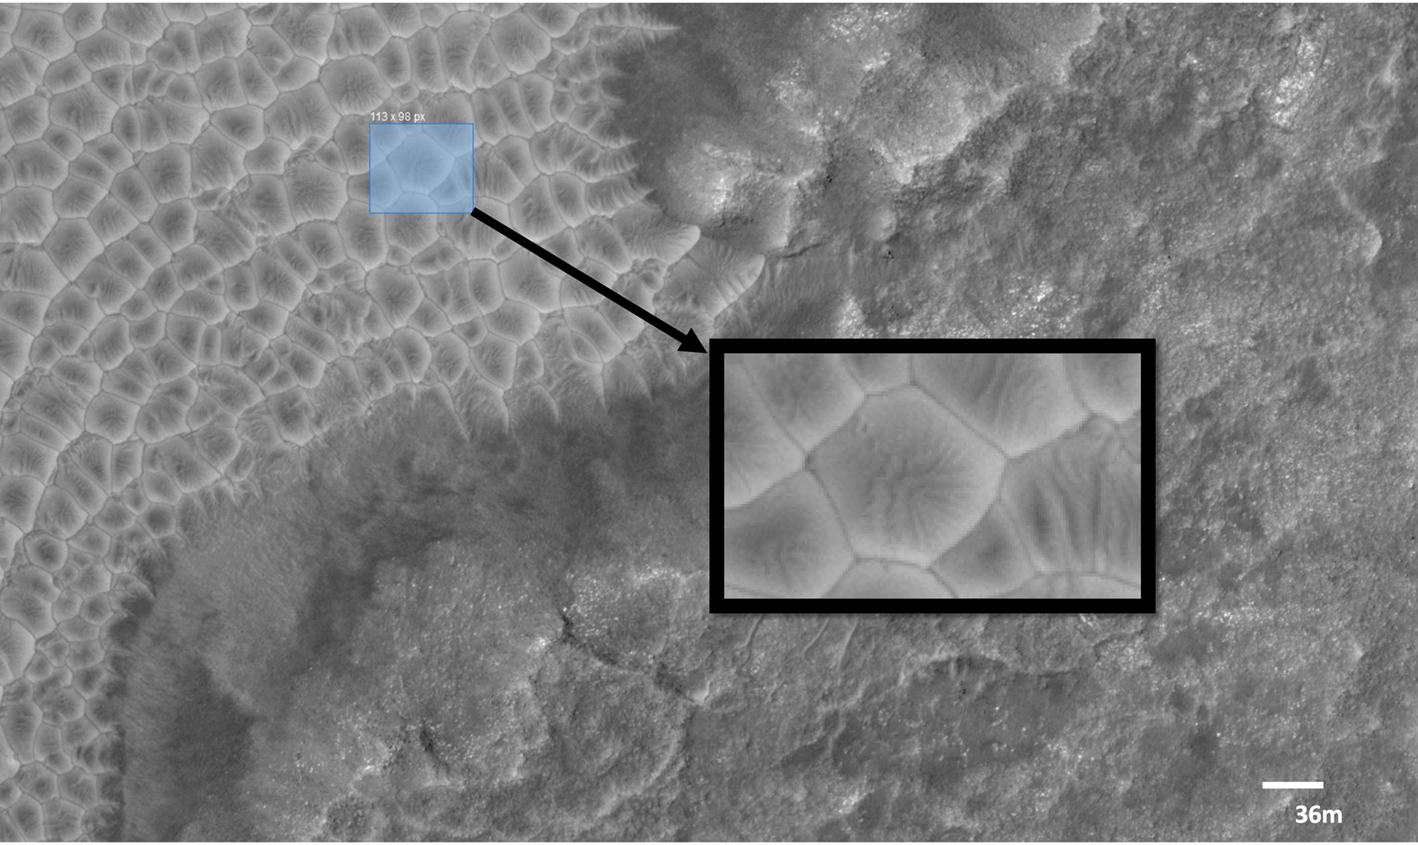
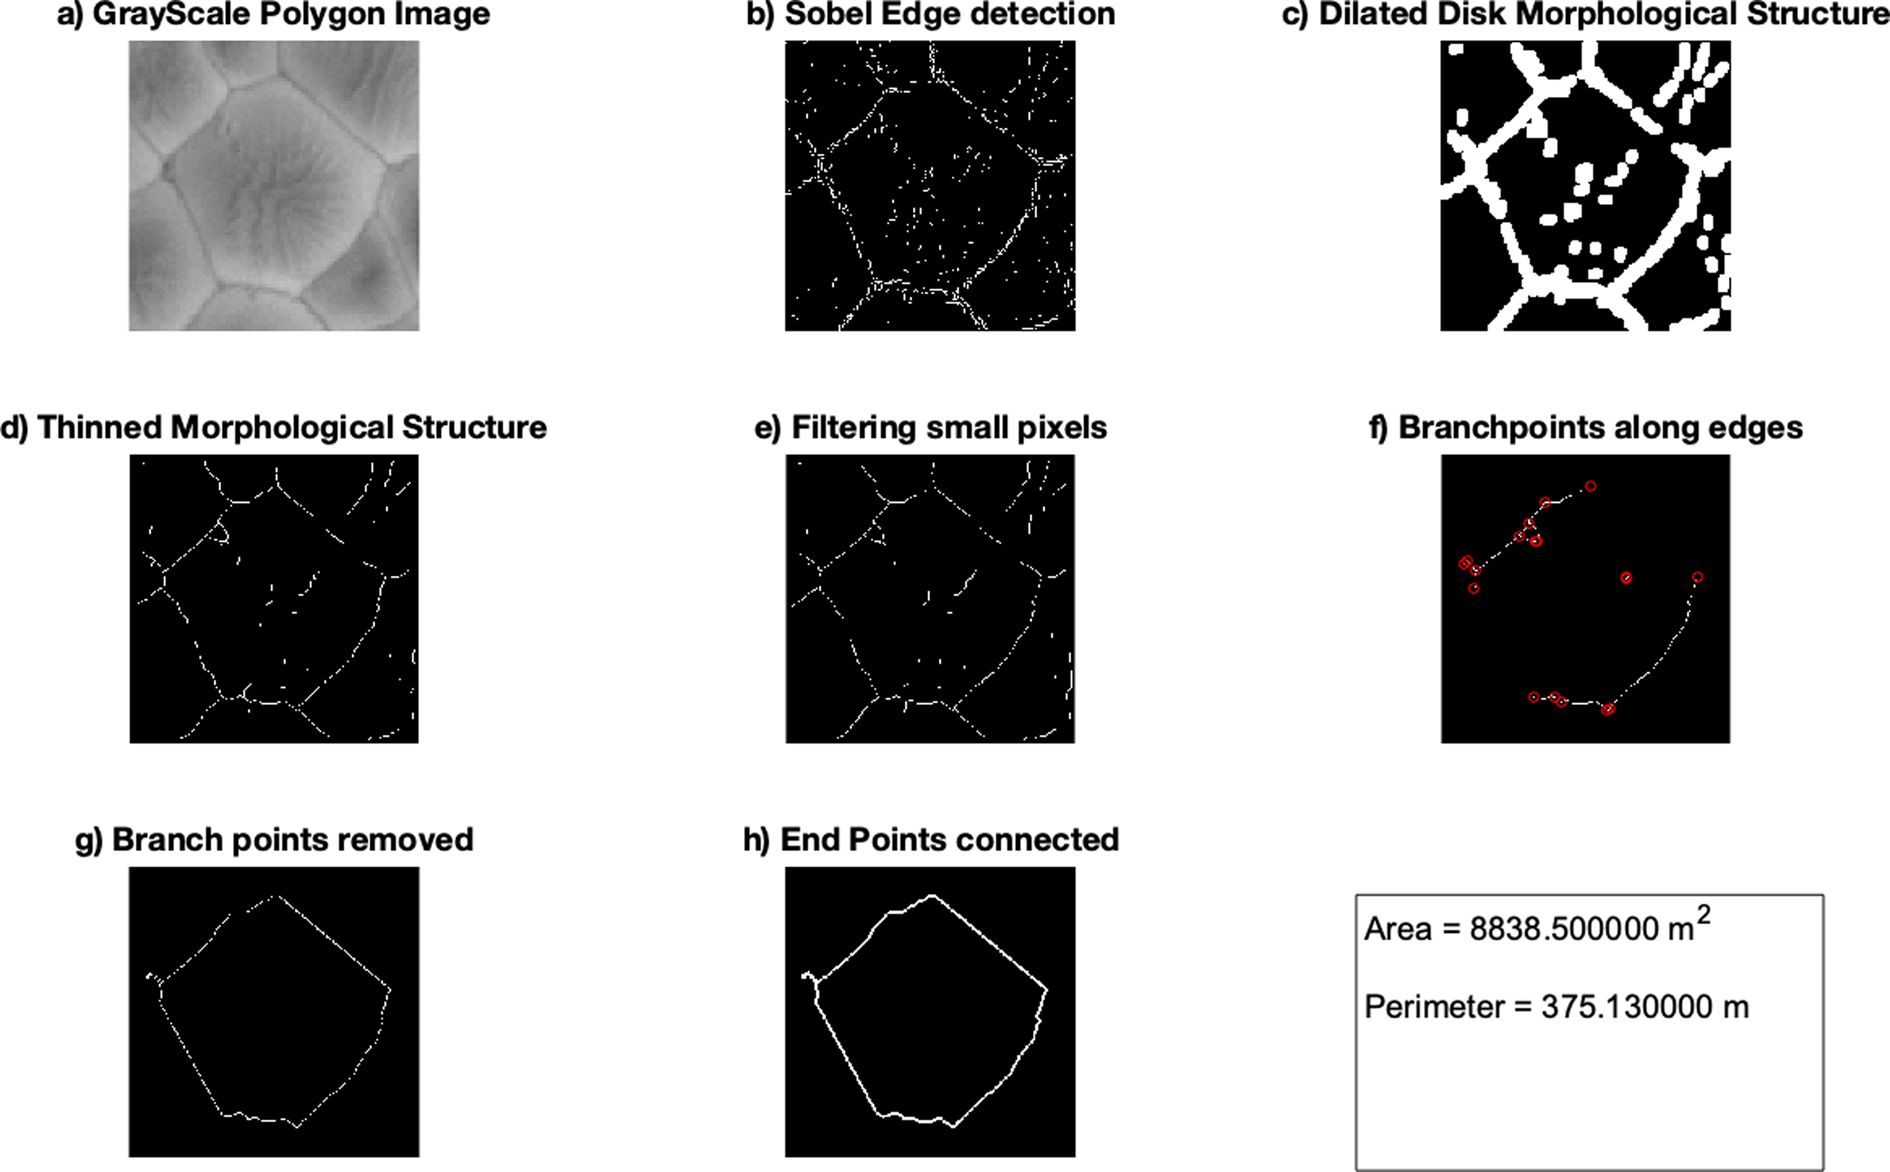
The reason for the formation of such polygonal geomorphological shapes on Mars often varies with many mechanisms put forth such as aeolian processes, thermal contraction, desiccation, volcanic and tectonic processes (Mutch et al., Reference Mutch, Arvidson, Head, Jones and Sainders1976, Reference Mutch, Arvidson, Binder, Guinness and Morris1977; Pechmann, Reference Pechmann1980; Lucchita, Reference Lucchita1983; Seibert and Kargel, Reference Seibert and Kargel2001; Mangold, Reference Mangold2005). Figure 9, shows the sequence of operations performed by the image processing framework to obtain the information regarding the dimensions of a scanned polygonal dune.
(a) Scale factor 10 zoomed-in HiRISE image of a Martian polygonal dune; (b) Sobel edge detection algorithm applied to binary image to determine edges; (c) dilated disk along the edge morphological structure; (d) thinning the morphological structure; (e) filtering disconnected isolated pixels (heuristics); (f) branch points determined; (g) branch points removed; and (h) endpoints connected to trace polygon. Perimeter and area of polygon measured are shown in the bottom-right box.
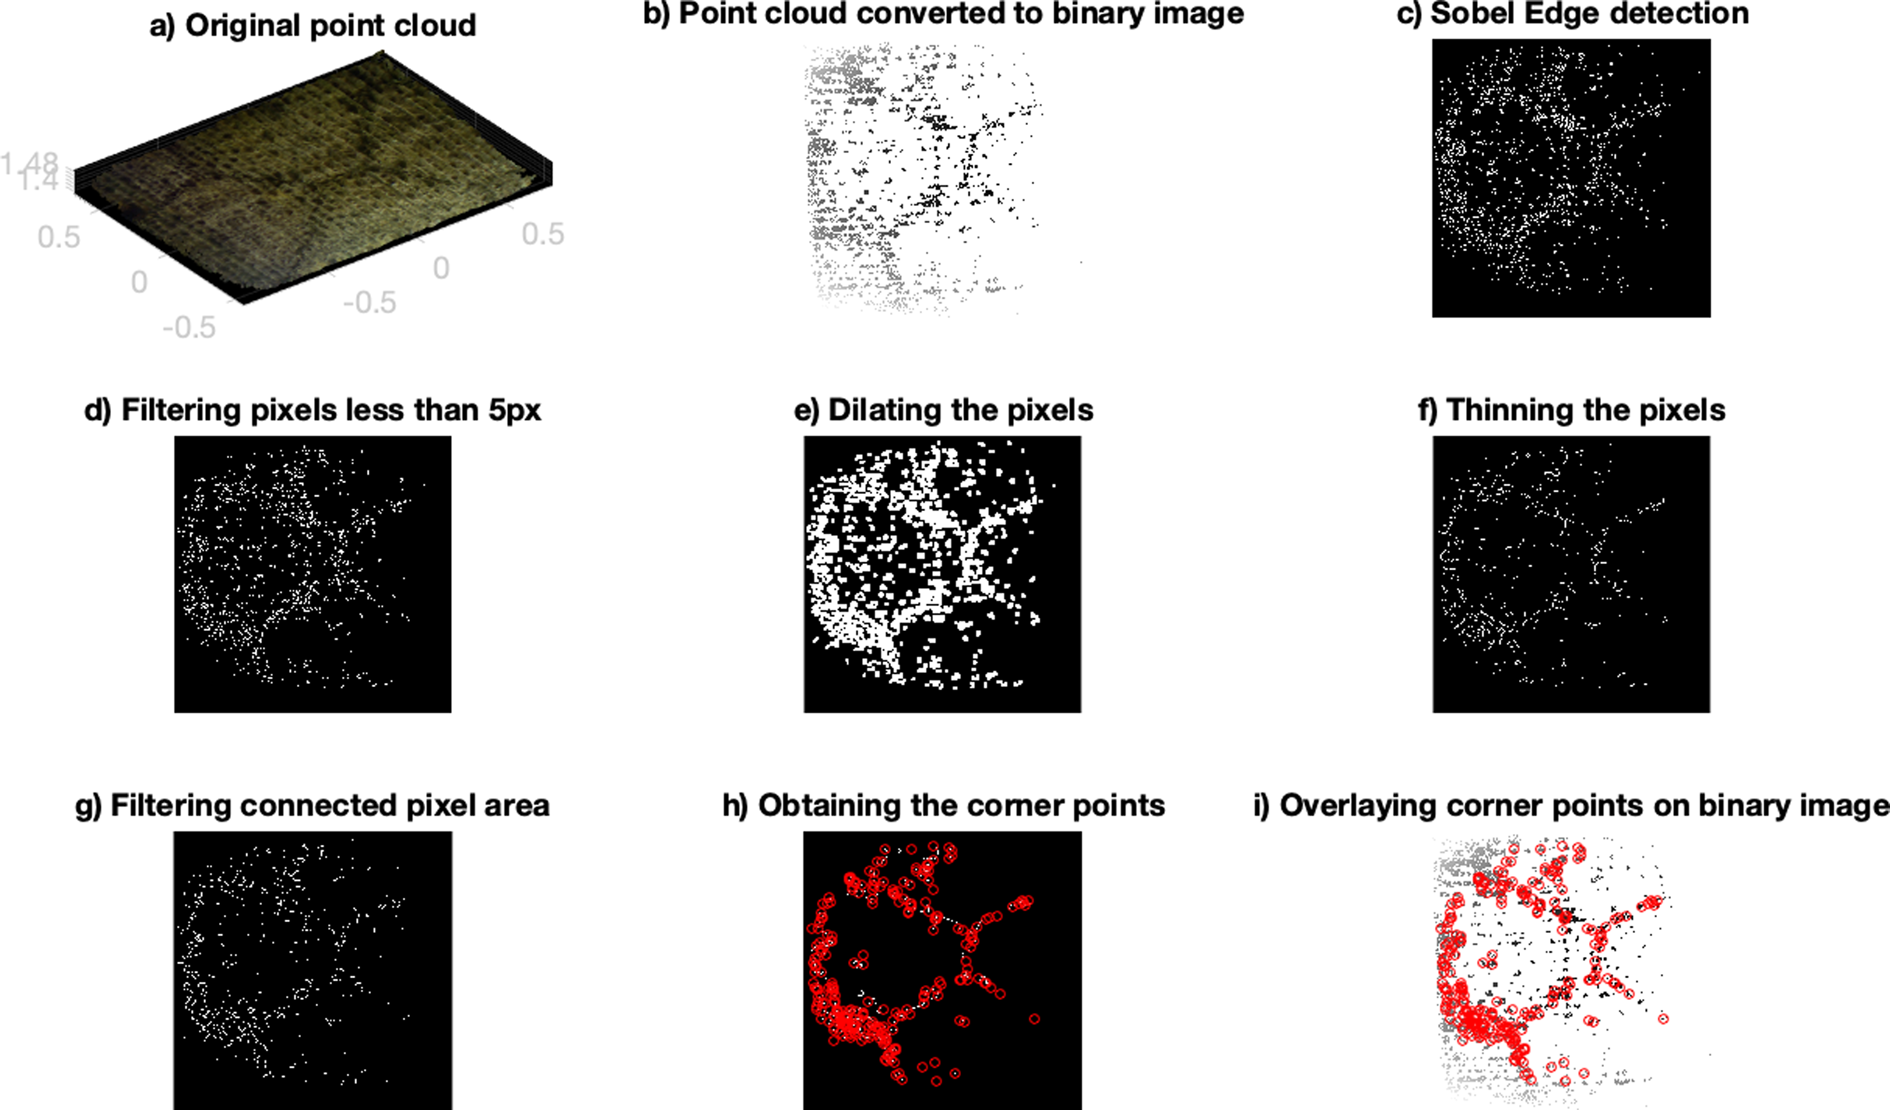
The image processing framework developed to characterize the branch points in the polygons of Mars can equivalently be applied to the analysis of polygons on the Boulby Mine walls. Repeated observations over a wider temporal resolution of these polygons would provide us with an insight to the evolution of these features. Figure 10 shows the sequence of operations performed by the image processing framework on a point cloud of the polygon.
Image processing framework to obtain the corner points in the polygon point cloud. (a) The original point cloud image in RGB; (b) filtered point cloud converted to binary image with only RGB pixels greater than the mean of entire point cloud RGB; (c) Sobel edge detection algorithm used to capture edges; (d) filtering isolated pixels (heuristics); (e) dilating the filtered pixels; (f) thinning the dilated pixels; (g) filtering the connected pixels in binary image; (h) obtaining the corner points in the polygon indicated in red; and (i) overlaying the corner points over the binary image of the polygons.
The current framework utilizes heuristics to determine the disconnected pixels which limit the framework to polygons with well-defined sharp boundaries. This limitation can be overcome by utilizing convolutional neural network (CNN). CNN's high dimensionality offers the prospect for merging the CNN algorithm with 3D mapping algorithm such as Kintinuous to permit the inclusion and extraction of spectral data from the depth point cloud. Deep learning techniques and CNN can be exploited to obtain a detailed topographical study of such features over a wider spatial and temporal resolution. A CNN-based approach using HiRISE images to study geological landforms of Mars, primarily volcanic rootless cones and transverse aeolian ridges has been discussed by Palafox et al. (Reference Palafox, Hamilton, Scheidt and Alvarez2017). Similarly, a rapid machine learning-based approach to extract and measure ice-wedge polygons from high-resolution DTM generated by airborne lidar survey using CNN has been put forth by Abolt et al. (Reference Abolt, Young, Atchley and Wilson2019). The application of deep learning CNN for edge detection can provide a powerful tool for the surface and subsurface geomorphological exploration of planetary bodies with stereoscopic depth cameras. Polygonal features found on Mars underlain by ice heightens interest in life-detection as their close looking terrestrial ice-wedge polygons found in the arctic have been found to contain a higher amount of culturable respiring microorganisms compared to other ice-bearing habitats (Wilhelm et al., Reference Wilhelm, Radtke, Mykytczuk, Greer and Whyte2012). The is of great interest from an astrobiology perspective as these water-bearing habitats could have harboured extant life on Mars.
Long-range mapping and localization with InXSpace 3D
A long-range 3D mapping of the mine shaft was also performed to test the consistency of the InXSpace 3D system over longer distances. The RTAB-Map algorithm was used in this test rather than the Kintinuous algorithm owing to the poor volumetric estimation as the camera is subjected to rotational estimation error and tangential drifting of camera pose. This limitation of Kintinuous algorithm restricts its application to mapping along a single plane. However, a novel algorithm based on iterative closest point scheme has been proposed by Ren et al. (Reference Ren, Wu, Lv, Cheng and Lu2019) which can account for the tangential drifting and erroneous rotational estimations due to input device errors and these can be incorporated into the existing Kintinuous algorithm. Figure 11 shows the 3D point cloud image of the mine shaft made by KORE as it traversed a length of 10 m with the path marked with tapes and the endpoint marked with a stone. While the striped tape line would obviously not exist on a planetary context, other naturally formed features (like ground cracks or limiting regions with contrasting albedo) may be followed similarly and autonomously.
The image on the top shows KORE following a marked traversal path of 10 m. The image below shows the long-range mapping point cloud of the mine shaft generated by using the RTAB-Map algorithm. The absence of points in a semi-circle pattern in the lower part of the point cloud indicates the shadow zone of KORE.
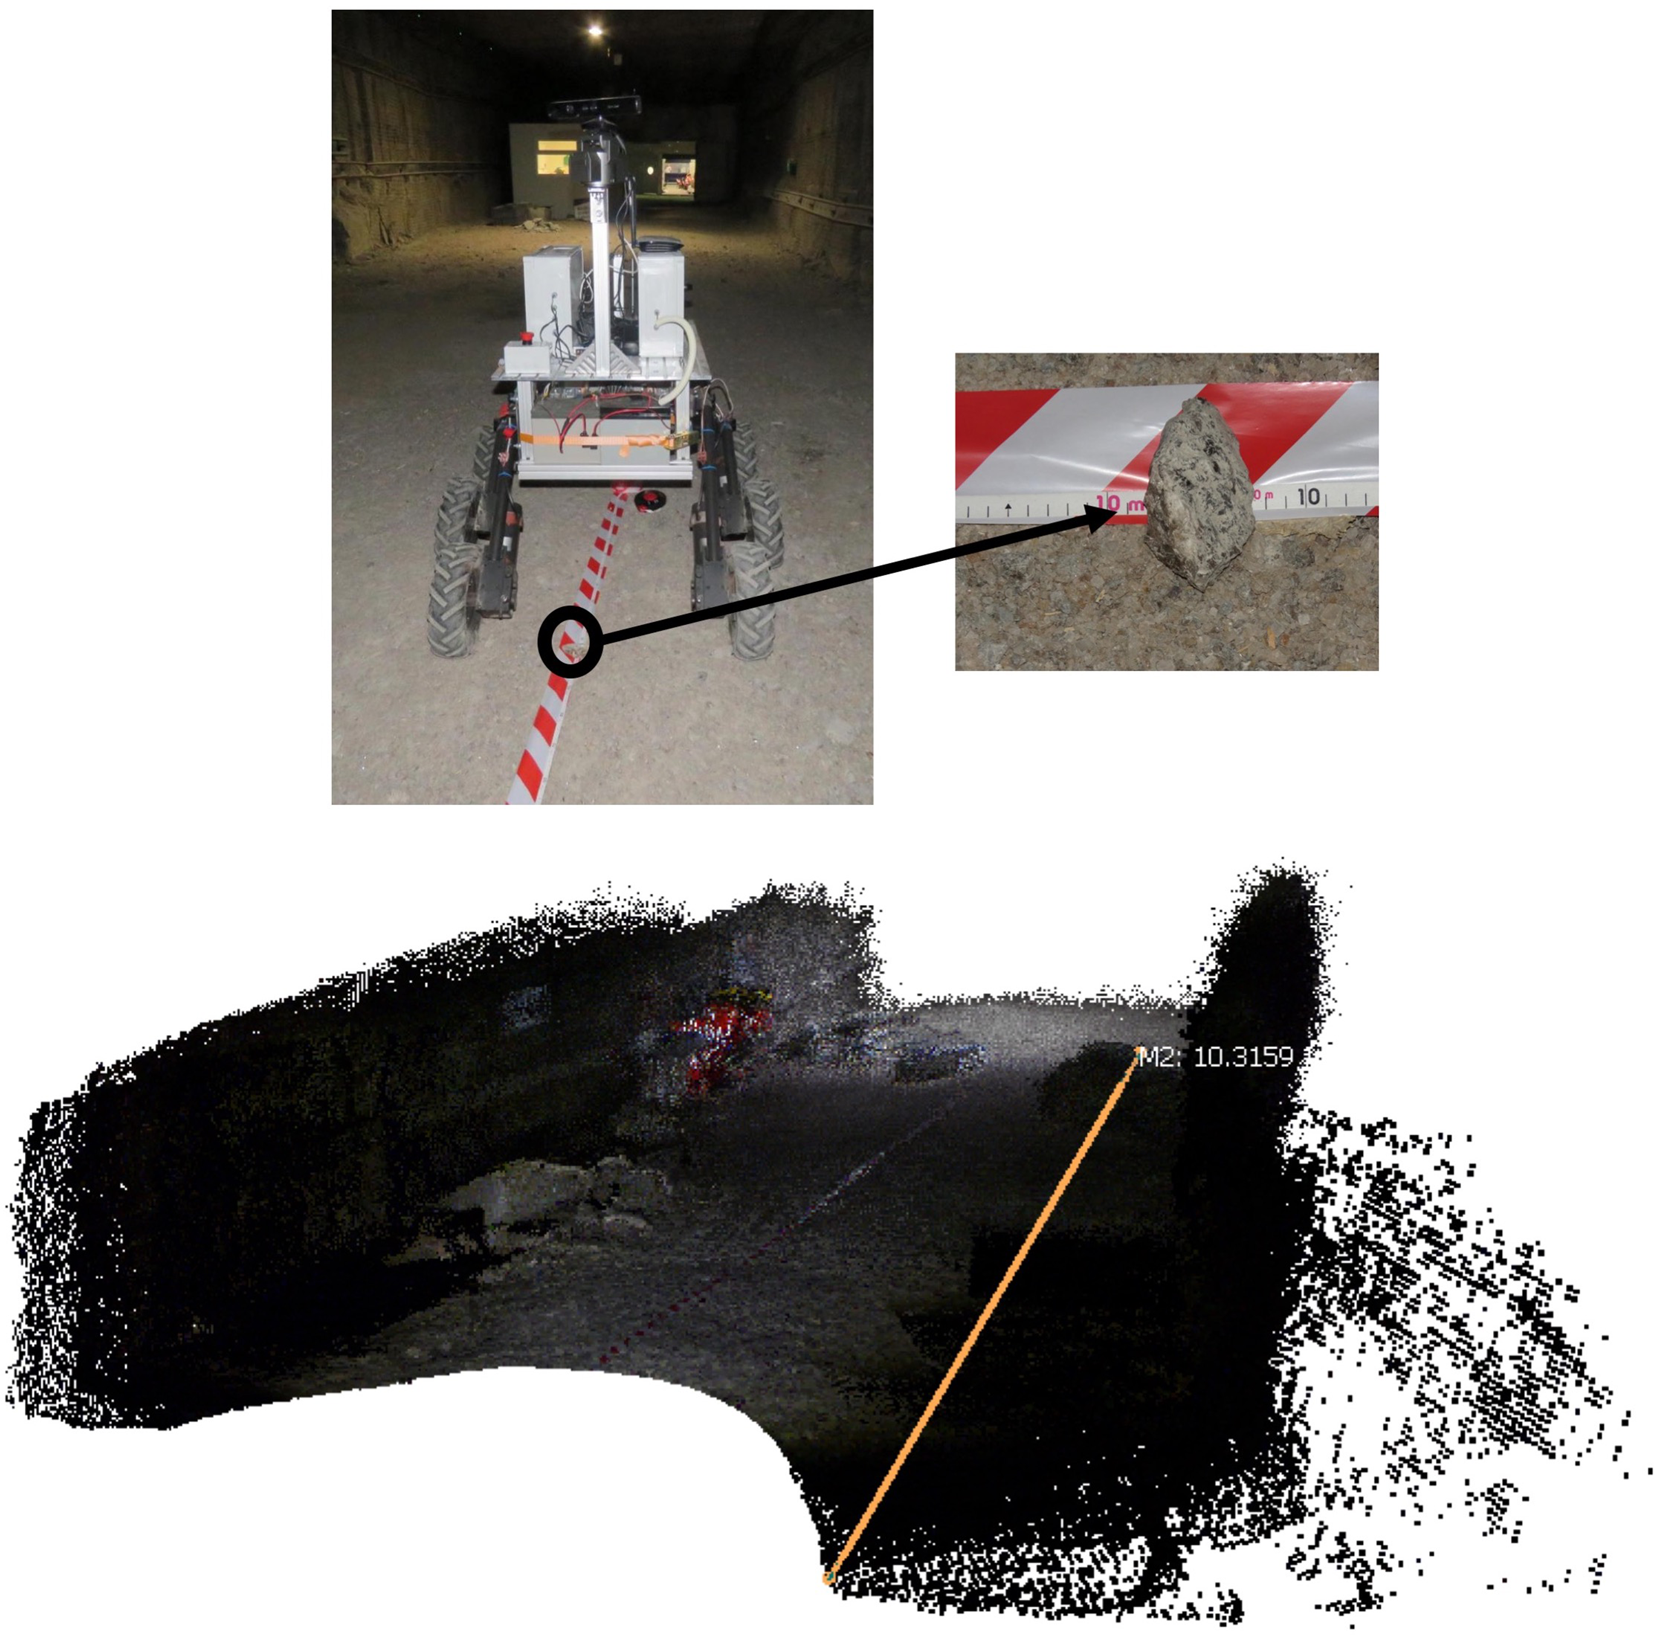
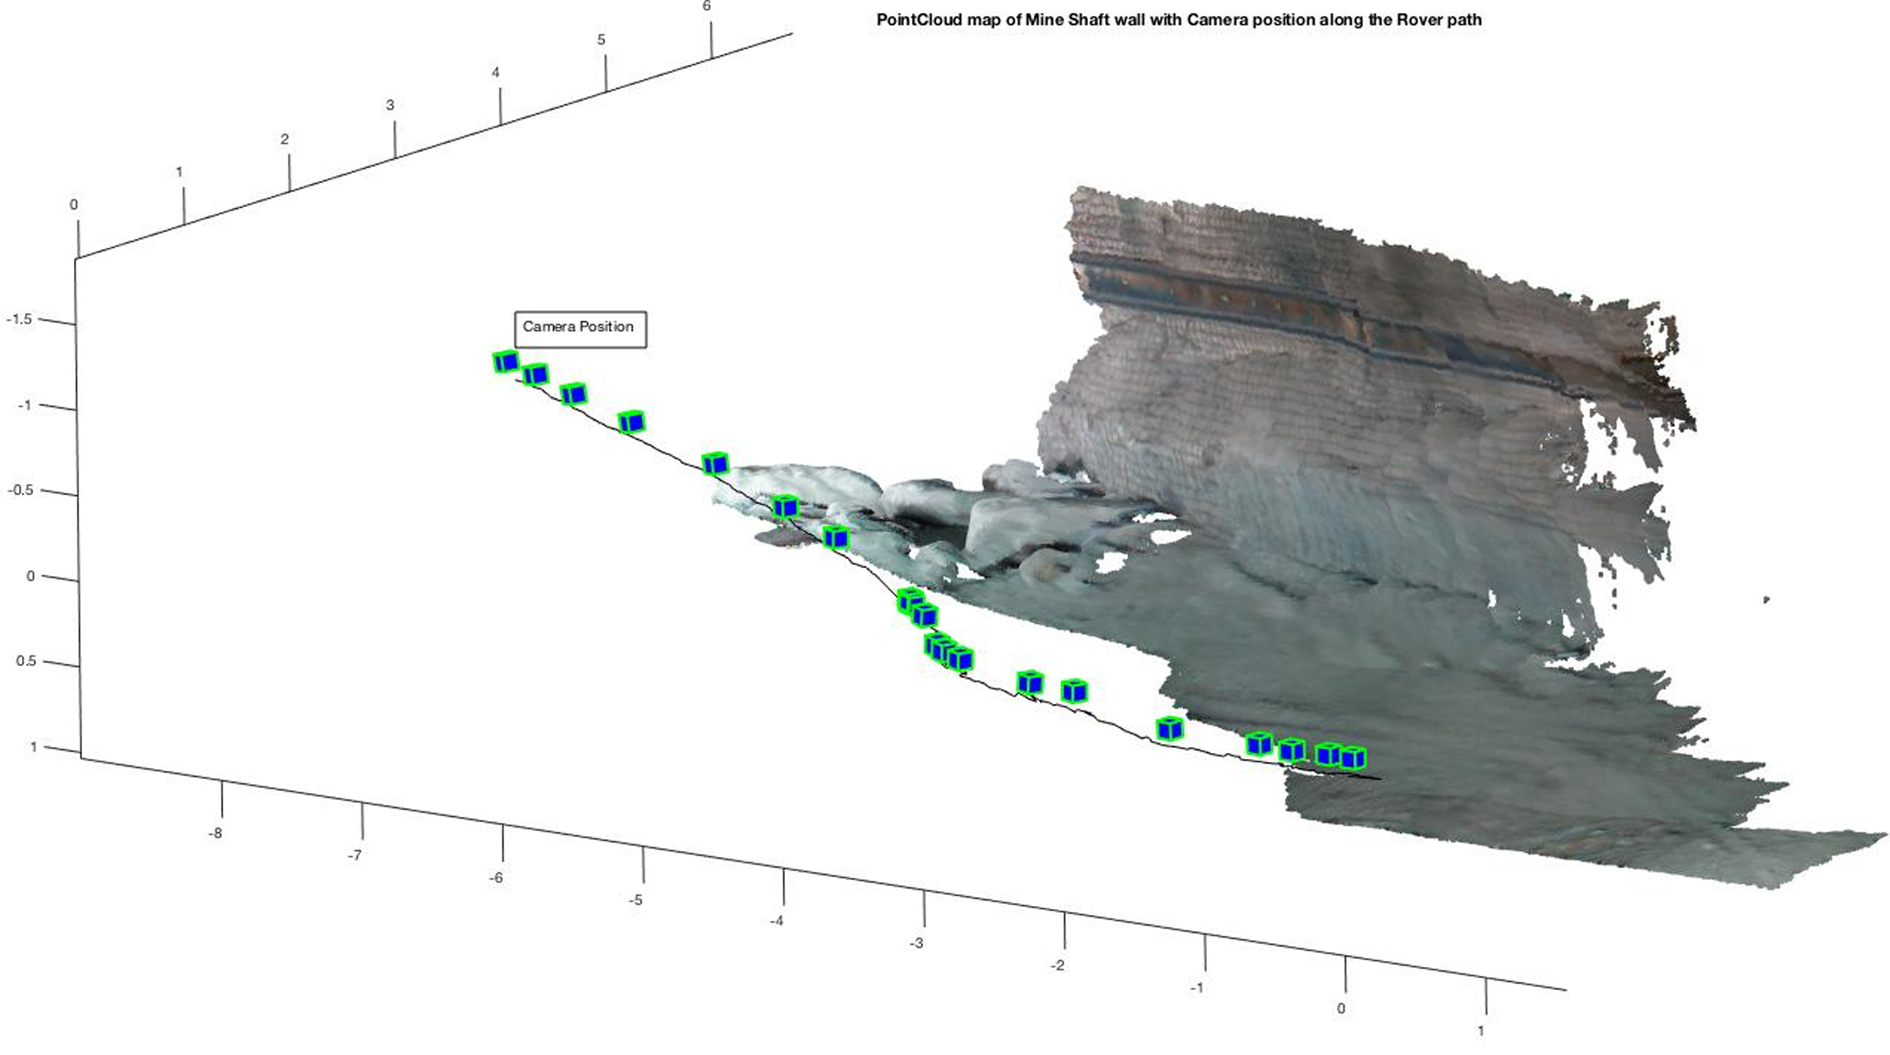
From the first point on the point cloud to the point representing the stone, the distance could be observed to be approximately 10 m. This test shows that the InXSpace 3D can be used as a viable system to generate local maps of subsurface environments which is a pre-requisite for autonomous navigation in remote environments. The 6 Degree of Freedom camera odometry estimation along with the novel graphics processing unit- based implementation of an existing dense RGB-D visual odometry algorithm and an advanced fused real-time surface colouring of the Kintinuous algorithm for spatially extended KinectFusion enables a robust tracking along with Red Green Blue – Depth (RGB-D) mapping (Whelan et al., Reference Whelan, Johannsson, Kaess, Leonard and McDonald2012a, Reference Whelan, McDonald, Kaess, Fallon, Johannsson and Leonard2012b). Localization is beneficial for Rover navigation especially in places like subsurface environments where there is an absence of Global Positioning System signal reception. The use of a depth camera for localization have been elucidated by Li and Li (Reference Li and Li2014) and Biswas and Veloso (Reference Biswas and Veloso2012). The localization data from the pose graph estimates of the InXSpace 3D system can be exploited to create autonomous navigation paths for future exploration rovers after a primary rover such as KORE has scanned the subsurface environment and created a 3D point cloud map. Figure 12 shows the traversal path of KORE from the localization data obtained from the pose graph of the Kinect camera.
Rover path with the camera position obtained from the pose graph data obtained through the Kintinuous algorithm during mapping of the mine shaft walls.
Mine safety with InXSpace 3D
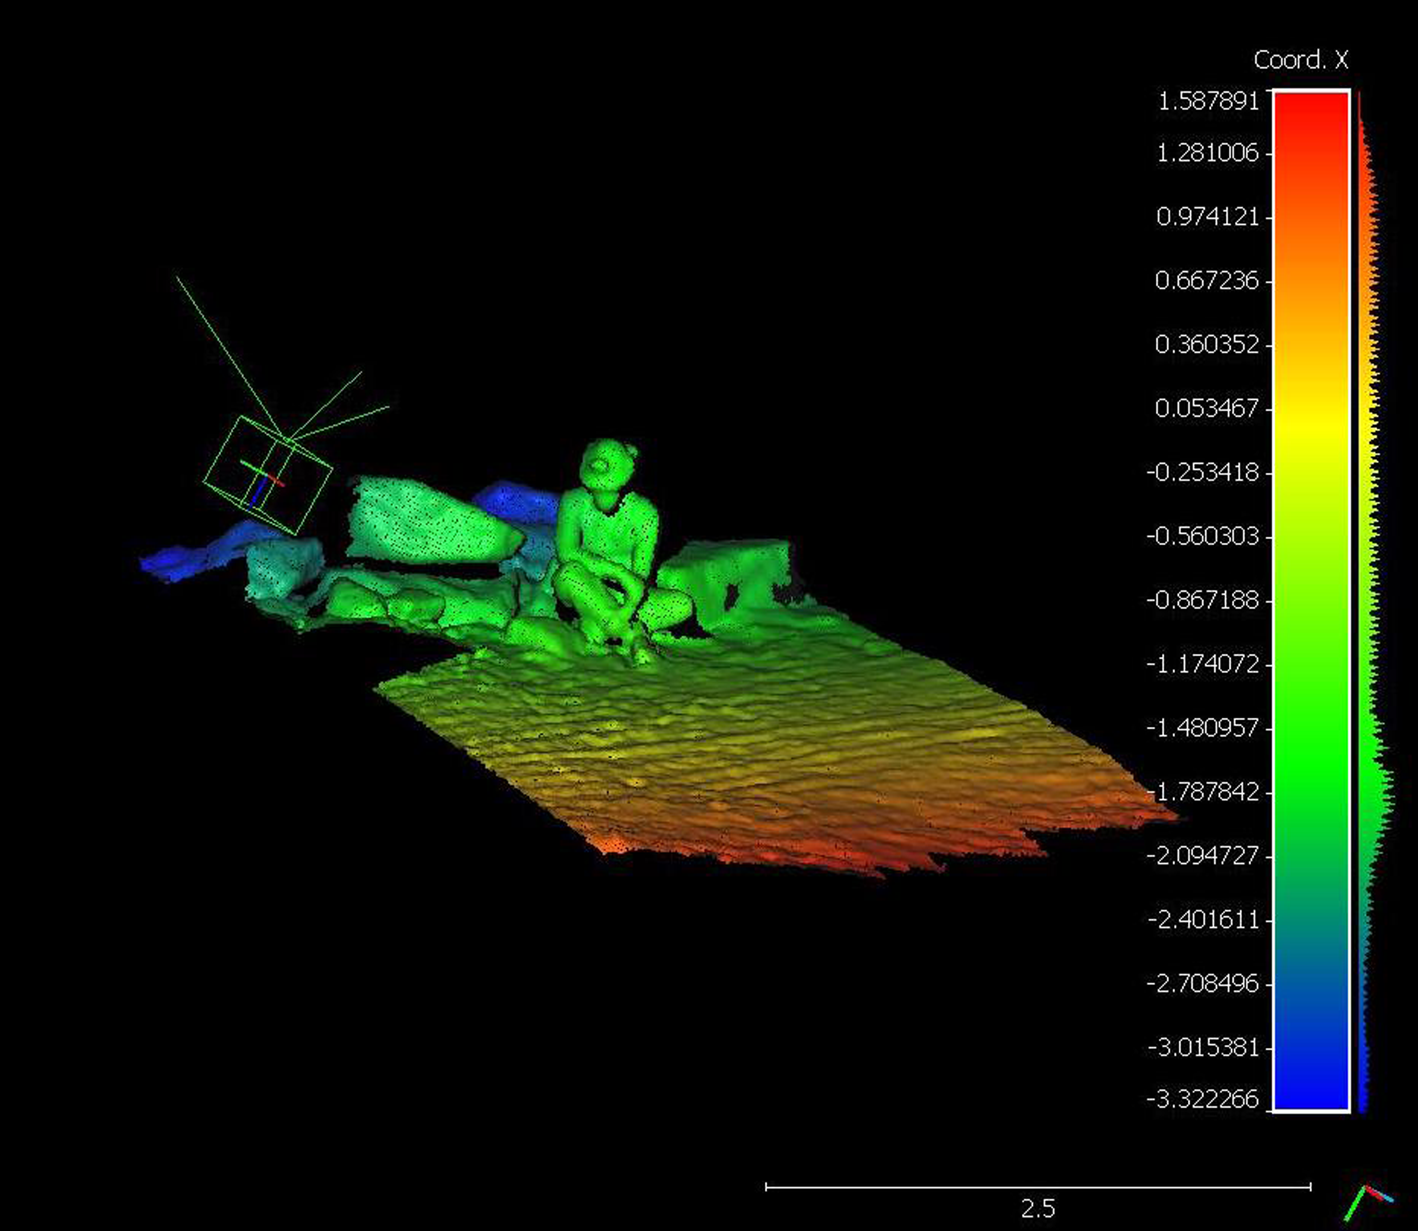
Along with the mapping capability of the InXSpace 3D system for geomorphological studies, the system was tested for its applicability to mine safety. The synergy between mining and analogue studies for planetary exploration is one of the fundamental drivers for the MINAR campaigns (Payler et al., Reference Payler, Biddle, Coates, Cousins, Cross, Cullen, Downs, Direito, Edwards, Gray, Genis, Gunn, Hansford, Harkness, Holt, Josset, Li, Lees, Lim, Mchugh, Mcluckie, Meehan, Paling, Souchon, Yeoman and Cockell2016) which emphasizes technology transfer between both fields. The InXSpace 3D on KORE was utilized in demonstrating mine safety by mapping a miner in complete pitch-black darkness. This test showed that InXSpace 3D could be a viable tool for identifying miners who are trapped in the mine due to mine shaft wall collapse or other hazardous scenarios. By close-range mapping, the facial features from the 3D point cloud could be obtained to account for the trapped person. Figure 13 shows the 3D point cloud image of a miner sitting on a rock down in the mine shaft.
3D reconstruction of a miner sitting on a rock in the Boulby Mine with the green box indicating the position of the camera as the KORE rover approached him. The scale bar is in metres.
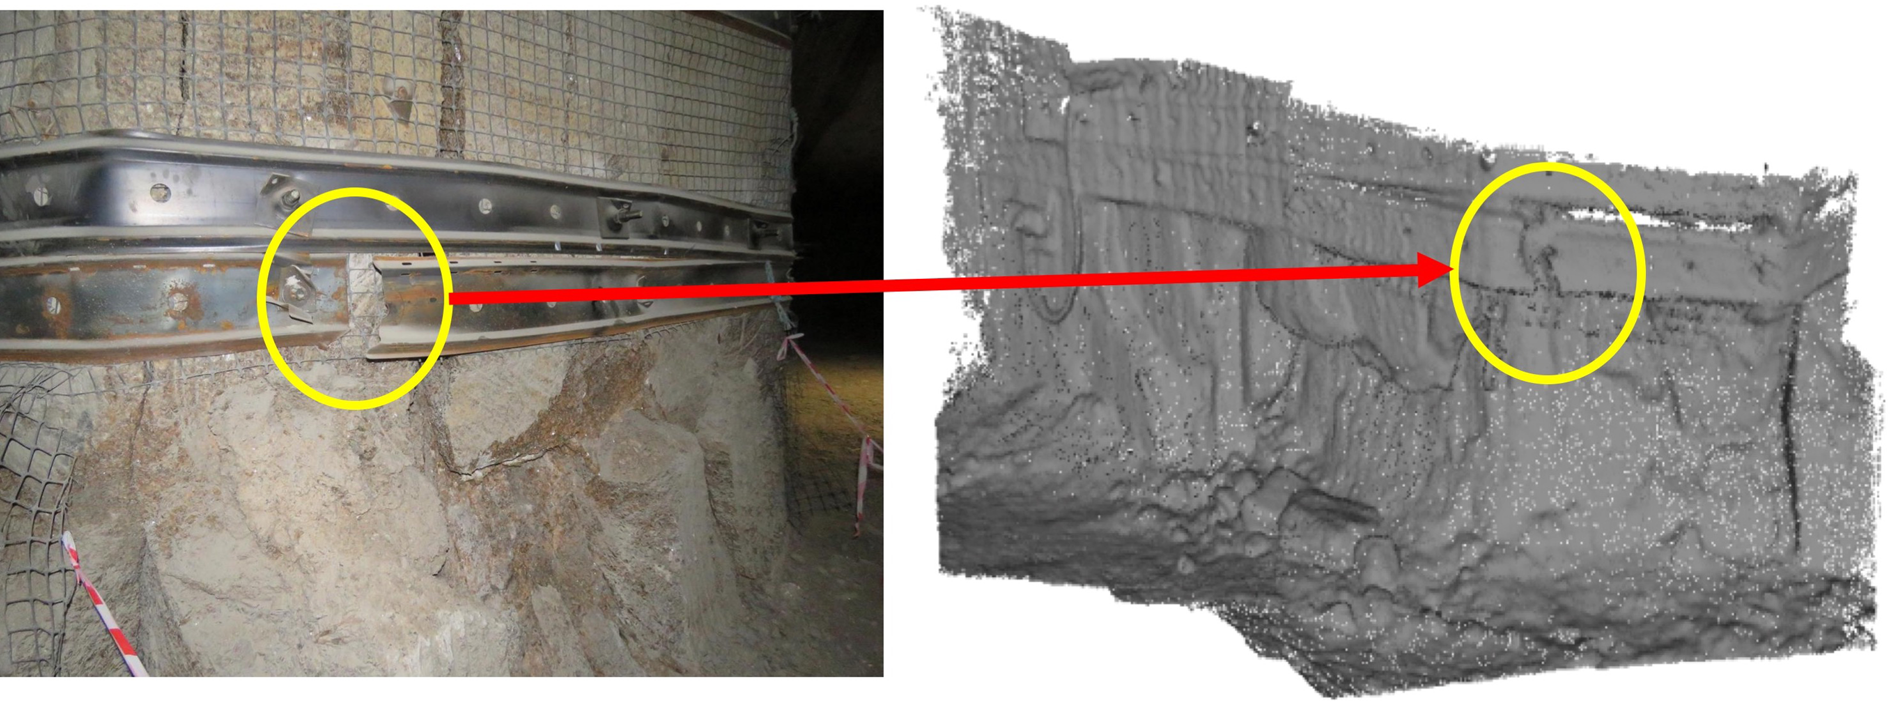
Moreover, the InXSpace 3D system can be used as an inspection tool to analyse safety features in the mine shaft. Figure 14 indicates a snap in the metal frame against the mine wall that occurred due to compressive forces acting along the mine shaft walls. The advantage of having a 3D point cloud of the failure part in close range mapping rather than a 2D image is that the point cloud analysis allows precise monitoring of the dimensions of failures in such hazardous regions to ensure that these regions do not grow over a period of time. Also, from the point cloud image, we can observe that the bolts that hold the metal frames to the mine shaft walls are clearly visible, which can allow remote monitoring of these critical components. Manual inspection of these critical elements using traditional visual methods is time-consuming, laborious and prone to human factor errors. Robotic exploration is a viable option that reduces inspection time and can account for reduced errors. Image processing with RGB image data sets using deep learning have been discussed by Huang et al. (Reference Huang, Li and Zhang2018). However, utilizing 3D point cloud data for such inspection supersedes the use of 2D images (Koch and Brilakis, Reference Koch and Brilakis2011). The 3D point cloud data generated from the RGB-D camera using the SLAM algorithms can also be exploited for such automatic detection of missing bolts or anomalies by incorporating neural networks as proposed in detecting the polygonal geomorphological features. The synergistic application is not only limited to terrestrial mining but could also be used as a crucial safety assessment tool to analyse unknown subsurface extra-terrestrial environments especially during human space exploration.
(left) RGB image of the metal frame failure detected and (right) shows the 3D point cloud of the failure. Also, the bolts along the metal frame are visible in the point cloud data.
Astrobiology experiments
Subsurface environments span the entire solar system with every planetary body being unique.
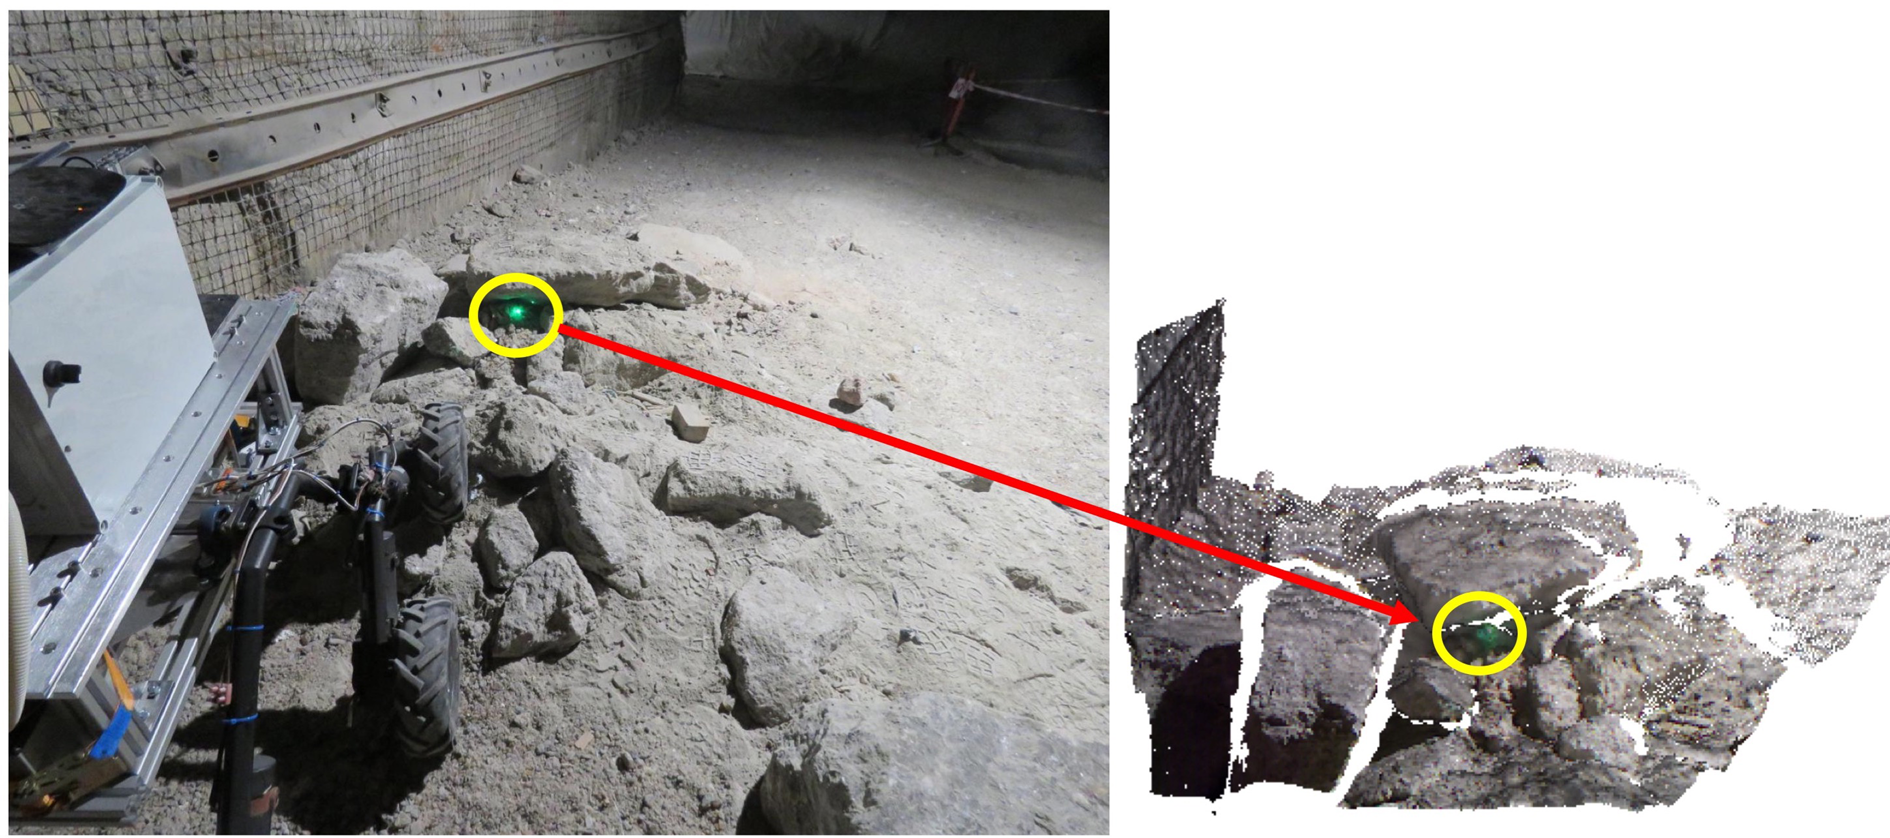
Subsurface oceans have been found to exist on the moons of Jupiter such as Ganymede, Callisto, Europa and Saturnian moons such as Enceladus and Titan, and there are other bodies in the solar system where possible subsurface ocean could exist. The presence of these subsurface oceans further raises the question of life in them. Apart from the presence of subsurface oceans on the icy moons, subsurface environments of the rocky planet such as Mars are proposed to have had the right conditions to host life (Tarnas et al., Reference Tarnas, Mustard, Sherwood Lollar, Bramble, Cannon, Palumbo and Plesa2018). The intense UV radiation bombarding the planet, low pressures close to the triple point of water, oxidizing perchlorate rich soil and cold freezing temperatures provide an inhospitable scenario for life to exist on the surface of Mars. Unlike the surface of Mars, the subsurface of Mars is expected to have a higher pressure (Schuerger et al., Reference Schuerger, Ulrich, Berry and Nicholson2013), shielding from intense UV irradiation and galactic cosmic rays, a stable temperature (Fisk and Giovannoni, Reference Fisk and Giovannoni1999) and potentially the presence of subglacial liquid water (Orosei et al., Reference Orosei, Lauro, Pettinelli, Cicchetti, Coradini, Cosciotti, Di Paolo, Flamini, Mattei, Pajola, Soldovieri, Cartacci, Cassenti, Frigeri, Giuppi, Martufi, Masdea, Mitri, Nenna, Noschese, Restano and Seu2018) which provides an ideal scenario to host life. A study made by Michalski et al. (Reference Michalski, Onstott, Mojzsis, Mustard, Chan, Niles and Johnson2018), suggested that life could exist in the subsurface of Mars up to 8 km. A detailed study on the subsurface habitability of Mars was done by Cockell (Reference Cockell, Kallmeyer and Wagner2014). Methane detected on Mars, raises the question of whether it could be from biotic or abiotic sources. One of the hypotheses is that methane could be produced by the methanogens in the subsurface of Mars. During the MINAR 5 campaign, methane analysis was performed at 13 locations in the mine tunnel shafts and it was found that the methane concentrations at few places reached above 100 ppm (Cockell et al., Reference Cockell, Holt, Campbell, Groseman, Josset, Bontognali, Phelps, Hakobyan, Kuretn, Beattie, Blank, Bonaccorsi, McKay, Shirvastava, Stoker, Willson, McLaughlin, Payler, Stevens, Wadsworth, Bessone, Maurer, Sauro, Martin-Torres, Zorzano, Bhardwaj, Soria-Salinas, Mathanlal, Nazarious, Ramachandran, Vaishampayan, Guan, Perl, Telling, Boothroyd, Tyson, Realff, Rowbottom, Lauernt, Gunn, Shah, Singh, Paling, Edwards, Yeoman, Meehan, Toth, Scovell and Suckling2018). The presence of these methane concentrations may represent the partial trapping of upwelling thermogenic methane found concentrated within certain mineral layers like potash. However, in a study by Fernández-Remolar et al. (Reference Fernández-Remolar, Prieto-Ballesteros, Rodríguez, Gómez, Amils, Gómez-Elvira and Stoker2008) of underground habitats in the Rio Tinto Basin, Spain, methane could be detected between 13 and 34 ppm in one of the boreholes dug, with an inverse correlation with hydrogen signifying the presence of methanogenesis. During the MINAR6 campaign, KORE was fitted with a laser absorption spectroscopy-based methane detector on a linear actuator which could detect methane plumes from about a distance of upto 50 m. The setup could be controlled remotely to scan an area of interest using the rover locomotion and linear actuator-based platform. A technological demonstration of the setup was performed by simulating a methane plume from under rock rubble as shown in Fig. 15 by releasing methane from an aluminium coated Tedlar bag. Issues with logistics prevented rover access to the sites explored in MINAR5 campaign with methane produced by the thermogenic activity.
(left) KORE pointing the laser methane detector at a simulated methane plume created with a methane packet placed under the rock rubble; (right) 3D point cloud of the rock rubble with the green point indicating the laser impingement point.
The use of such remote methane monitoring instrument with a long detection range of 50 m to detect methane satisfies the application to preliminary astrobiology studies and mine safety. The laser-based methane detector is limited in sensitivity to 5 ppm and cannot determine the C and H stable isotopes which are of interest to study the source of the methane. The laser-based methane detector can be substituted with a more sophisticated hyperspectral imager. Hyperspectral imagers are a great tool to remotely monitor the hydrocarbon emissions along with gases such as carbon monoxide, carbon dioxide, nitrogen dioxide and hydrogen sulphide. These gases are of biological significance and scanning potential habitats such as polygonal structures can provide an insight into the biosignature detection in such closed environments. The use of such remote monitoring instruments provides a very flexible platform to study locations which are quite inaccessible. The remote gas detection techniques on rovers enhance mine safety operations, as these detectors can be used to scan a potential hazardous location from a safe distance rather than a close encounter.
Environmental sensors
KORE is fitted with an environmental station that measures atmospheric parameters such as temperature, humidity, pressure along with various gases such NO2, SO2, H2S, CO, CO2, O3, O2, formaldehyde, VOC and particulates. The environmental station was operated for a quite a short period of time (22 h) due to operational limitations, especially with the limited battery capacity and hence some of the electrochemical sensors such as the ones measuring CO, O3, SO2, NO2, H2S and VOC failed to stabilize within this interval of time. The data obtained from the temperature, humidity, pressure, CO2, O2 and formaldehyde sensors are shown in the following plot, Fig. 16. The first 2 hours of data can be neglected to account for the time required for the sensors to stabilize.
Plots obtained from the data of the Environmental sensors aboard KORE rover operating over a span of 22 h. The initial 2 h are neglected to account for the sensor warm up time.
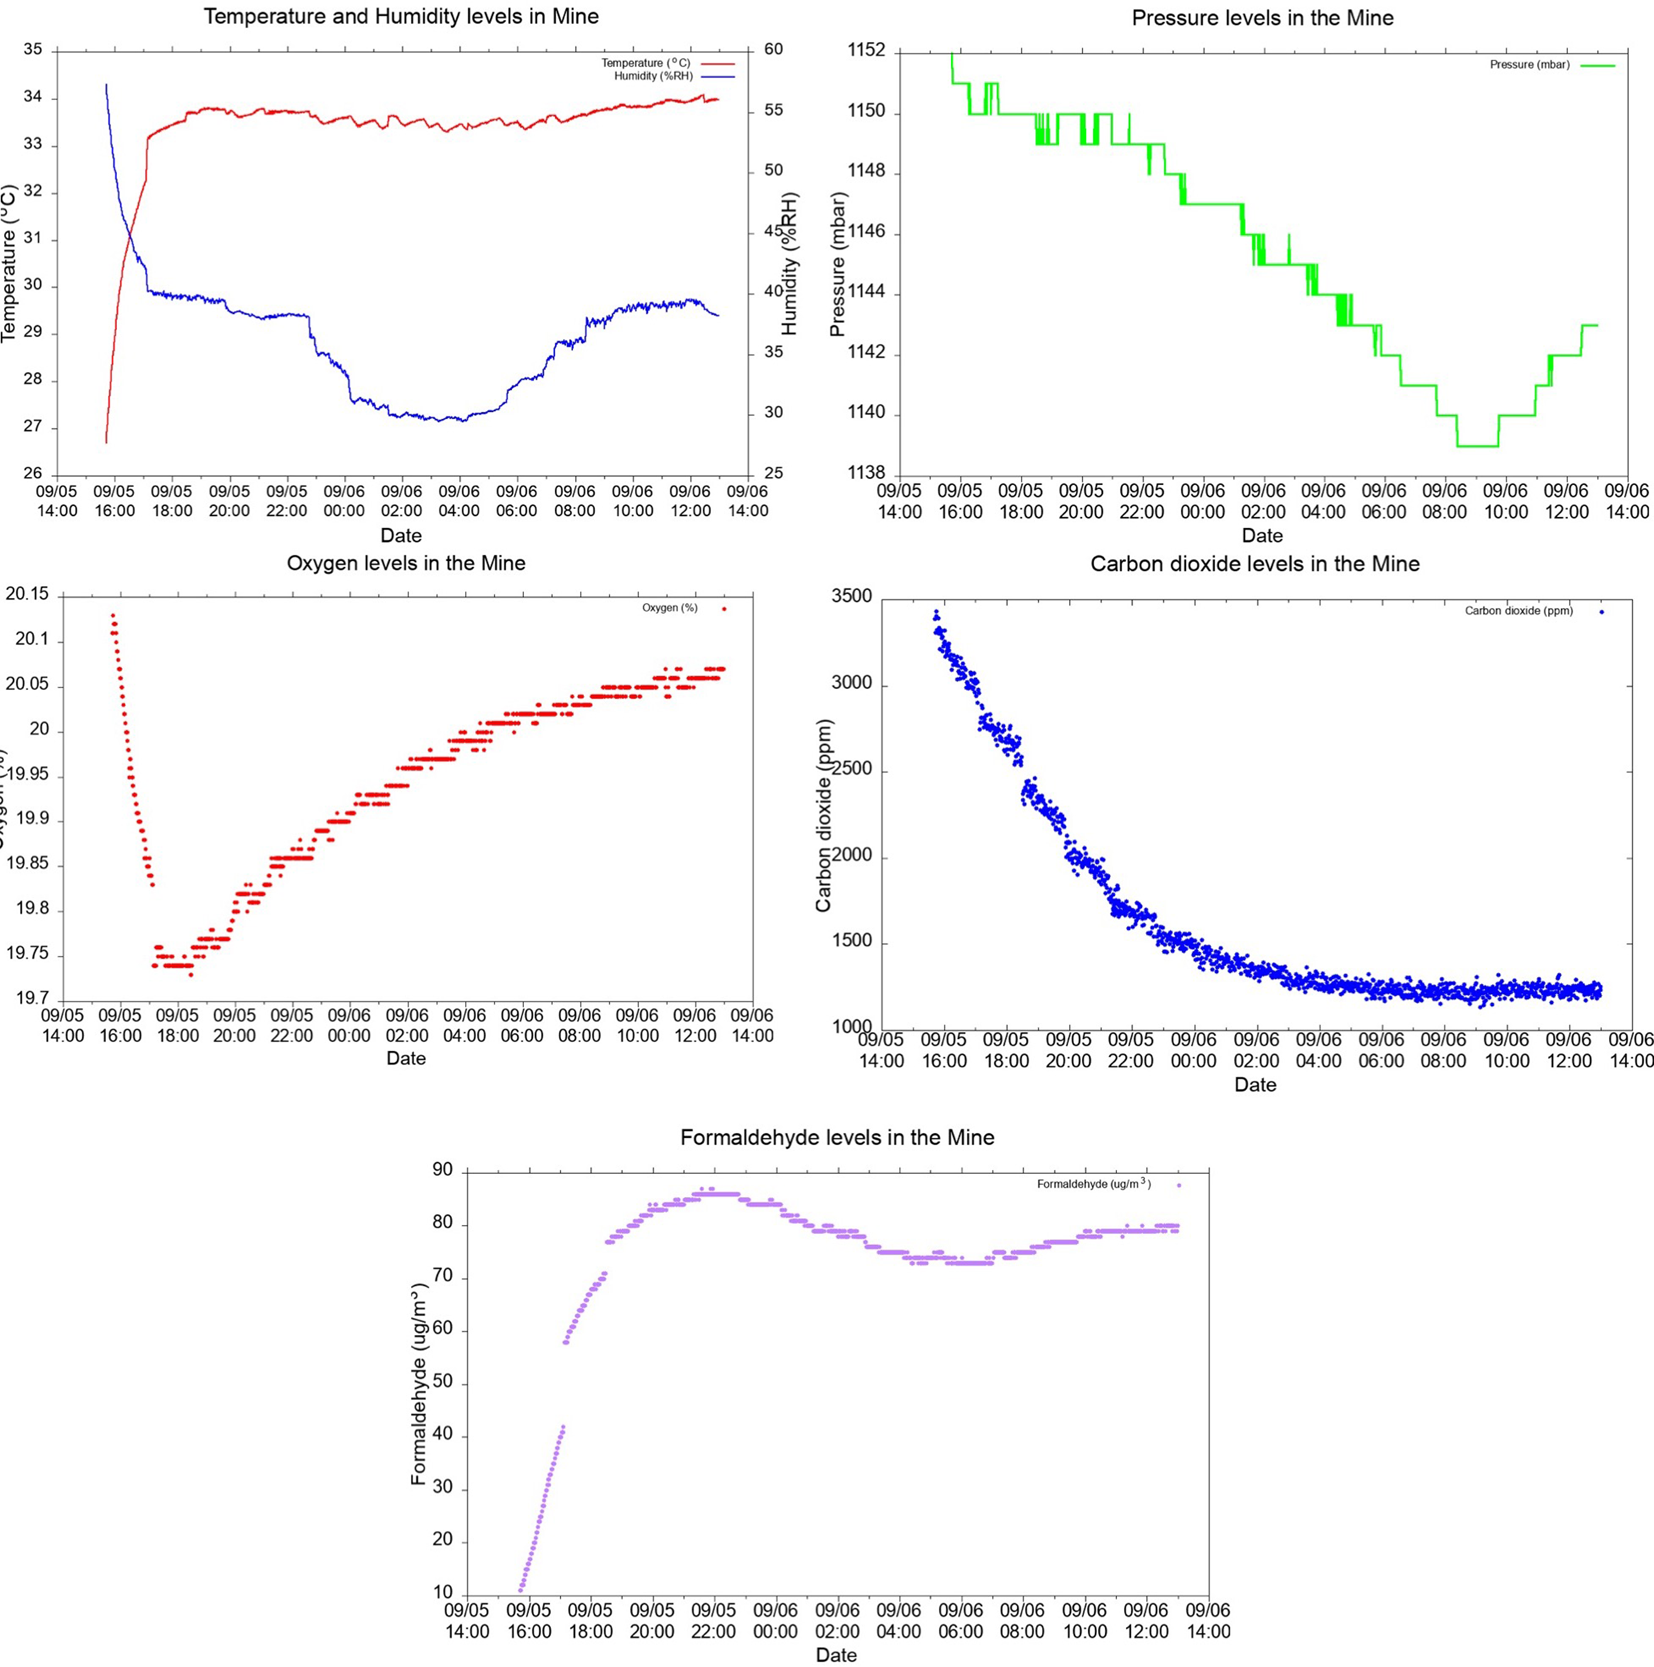
The mean CO2 levels in the mine are above 1000 ppm which is expected owing to the presence of an indoor environment down in the mine shafts. The most interesting observation from the gas measurements was the levels of formaldehyde present in the mine. During the 22 h of operation of the environmental station, we could observe an average formaldehyde concentration of 78.5 μg m−3 which is well within the safe exposure levels as with concentration of above 100 μg m−3, formaldehyde has been associated with irritation to the eyes, skin, nose and throat, however, there is a substantial variation in individual responses (WHO, 2000). Hence monitoring the formaldehyde levels is very important in enclosed environments such as mines where the dilution of these gases with the ambient air is restricted and is very crucial for the occupational health of the miners. Formaldehyde has also a strong implication in extra-terrestrial environments as a prebiotic chemical (Cleaves, Reference Cleaves2008; Kitadai and Maruyama, Reference Kitadai and Maruyama2018) and hence monitoring this or other potentially relevant prebiotic or life-related volatiles is very useful for astrobiology (Blair et al., Reference Blair, Magnani, Brand and Wouterloot2008).
Conclusion
The KORE rover has been built as a technological demonstration for analogue exploration of subsurface environments. For this purpose, it has been completely designed using COTS components and thus none of the components used in the rover is still flight qualified. Technical demonstrators allow to test and show the scientific application of a payload while estimating the power consumption, volume, weight etc. needs and finding the most important functional requirements that limit or allow operability. These low technological readiness level prototypes are the first step required to build space exploration spacecrafts and/or payloads. During the MINAR6 campaign, a number of observations were implemented using KORE as an autonomous laboratory rover with instrumentation that is used to validate certain hypothesis. The rover campaign lasted 6 days with a total experimentation time of ~22 h. As a hypothesis-driven campaign, the MINAR 6 served as an ideal scenario to validate the hypothesis of using a low-cost subsurface rover platform with low-cost mapping technologies to capture point clouds of both man-made artificial features and naturally occurring polygons on the polyhalite roofs of the mine. The methodology incorporated in the mapping with InXSpace 3D system coupled with machine learning and CNN can be exploited for future surface and subsurface robotic explorations to obtain a more vivid study of the geomorphological features.
The 3D point cloud data generated using the Kintinuous algorithm can also be utilized to perform an inspection of critical elements such as bolts in the mine shafts and with deep learning incorporated their inspection capability can be further enhanced. The localization information obtained from the mapping algorithms can be used to create a local map of the environment, which would provide an automated navigation capability to the rover. This would help the rover traverse a relatively plain terrain without encountering large boulders and debris. The study of the volatile accumulation in the mine has also been validated from an astrobiological point of view, using a methane detection payload and environmental station to measure formaldehyde concentrations, which is crucial to the occupational health of the miners. This study demonstrates that a low-cost, robust remotely operable subsurface platform can be used for geomorphology, astrobiology and mining study and it has been successfully validated by utilizing KORE.
Acknowledgement
The authors of this paper would like to thank Kempe Foundation for its generous funding support to develop KORE, the workshop at the Teknikens Hus, Luleå, for their invaluable and unconditional support in helping with the fabrication of the KORE components and the organizers of the MINAR campaign comprising the UK Centre of Astrobiology, ICL Boulby Mine and STFC Boulby Underground Laboratory, UK. MPZ has been partially funded by the Spanish State Research Agency (AEI) Project No. MDM-2017-0737 Unidad de Excelencia ‘María de Maeztu’- Centro de Astrobiología (INTA-CSIC).


 Open access