


Introduction
Kochia is a summer-annual C4 tumbleweed capable of causing large yield losses in wheat (Triticum aestivum L.), oat (Avena sativa L.), sugar beet (Beta vulgaris L.), sunflower (Helianthus annuus L.), soybean [Glycine max (L.) Merr], and other economically important crops in the Great Plains of North America (Friesen et al. Reference Friesen, Beckie, Warwick and Van Acker2009; Yadav et al. Reference Yadav, Kumar and Jha2020). This invasive weed is native to Eurasia, but was introduced to the Americas as an ornamental garden forb in the mid to late 1800s, and later considered as a forage crop that grows well in drought or saline conditions (Friesen et al. Reference Friesen, Beckie, Warwick and Van Acker2009; Nair et al. Reference Nair, Lima, Abdalla, Molnar, Wang, McAllister and Geddes2021). In a 2017 survey of 1,232 annual-cropped fields in Alberta, Canada, kochia was the most abundant weed species following postemergence herbicide application in the southern Mixed Grassland ecoregion, and the fifth most abundant species in the Moist Mixed Grassland ecoregion (Leeson et al. Reference Leeson, Hall, Neeser, Tidemann and Harker2019). Among annual crops, it was most abundant in lentil (Lens culinaris Medik.), followed by durum (Triticum durum Desf.), spring wheat, and field pea (Pisum sativum L.). Similarly, among annual crops in a 2014/2015 survey in Saskatchewan, kochia was most abundant in fields of durum, followed by lentil, field pea, and mustard [including Brassica juncea (L.) Czern. and Sinapis alba L.; Leeson Reference Leeson2016]. Kochia also infests pastures, rangelands, and ruderal areas like roadside ditches, oil well sites, and railway rights-of-way (Friesen et al. Reference Friesen, Beckie, Warwick and Van Acker2009).
Kochia has become one of the worst agricultural weed problems in the Great Plains of Canada and the United States due to several unique biological characteristics that aid its ability to invade both marginal and fertile lands, and enable its rapid evolution of resistance to recurrent selection pressures such as herbicides (Friesen et al. Reference Friesen, Beckie, Warwick and Van Acker2009; Kumar et al. Reference Kumar, Jha, Jugulam, Yadav and Stahlman2019b). Kochia seed has low innate dormancy, resulting in short (1 to 2 yr) seed longevity in the soil seedbank and rapid population turnover (Beckie et al. Reference Beckie, Blackshaw, Leeson, Stahlman, Gaines and Johnson2018; Dille et al. Reference Dille, Stahlman, Du, Geier, Riffel, Currie, Wilson, Sbatella, Westra, Kniss, Moechnig and Cole2017; Schwinghamer and Van Acker Reference Schwinghamer and Van Acker2008). It is often the first weed to emerge in the spring after only 50 to 168 growing degree days (GDD, Tbase 0 C), but it also exhibits prolonged emergence periodicity and can emerge following postemergence herbicide application (Dille et al. Reference Dille, Stahlman, Du, Geier, Riffel, Currie, Wilson, Sbatella, Westra, Kniss, Moechnig and Cole2017; Schwinghamer and Van Acker Reference Schwinghamer and Van Acker2008). In Canada, kochia plants emerging prior to the fourth week of August (2,140 GDD) can produce viable seed before the end of the growing season (Geddes and Davis Reference Geddes and Davis2021). The plants are heat, drought, and saline tolerant (Friesen et al. Reference Friesen, Beckie, Warwick and Van Acker2009). Protogynous flowering aids in cross-pollination resulting in the transfer of herbicide resistance traits, and populations maintain high genetic diversity within and among fields (Beckie et al. Reference Beckie, Blackshaw, Hall and Johnson2016; Martin et al. Reference Martin, Benedict, Wei, Sauder, Beckie and Hall2020). In the fall, the stem abscises resulting in a tumbleweed that can disperse seeds among multiple fields within a single year. Kochia can produce up to 100,000 seeds plant−1 resulting in large seedbank inputs (Beckie et al. Reference Beckie, Blackshaw, Hall and Johnson2016; Friesen et al. Reference Friesen, Beckie, Warwick and Van Acker2009; Kumar et al. Reference Kumar, Jha, Jugulam, Yadav and Stahlman2019b).
Kochia populations are known to exhibit resistance to up to four herbicide sites of action (Varanasi et al. Reference Varanasi, Godar, Currie, Dille, Thompson, Stahlman and Jugulam2015). Kochia with resistance to atrazine [a photosystem II inhibitor; Weed Science Society of America (WSSA) Group 5] was first reported in Kansas in 1976, and has since been found in at least 11 U.S. states (Friesen et al. Reference Friesen, Beckie, Warwick and Van Acker2009). Acetolactate synthase (ALS) inhibitor (WSSA Group 2)–resistant kochia was first discovered in Kansas in 1987 (Kumar et al. Reference Kumar, Jha, Jugulam, Yadav and Stahlman2019b), and after less than two decades it was found in 18 U.S. states and 3 Canadian provinces (Heap Reference Heap2021). Synthetic auxin (WSSA Group 4) herbicide-resistant (HR) kochia was discovered first in Montana in 1993/1994 (Cranston et al. Reference Cranston, Kern, Hackett, Miller, Maxwell and Dyer2001), and is now present in 6 U.S. states and 3 Canadian provinces (Beckie et al. Reference Beckie, Hall, Shirrif, Martin and Leeson2019; Geddes et al. Reference Geddes, Pittman, Gulden, Jones, Leeson, Sharpe, Shirriff and Beckie2021; Heap Reference Heap2021; Kumar et al. Reference Kumar, Jha, Jugulam, Yadav and Stahlman2019b). Glyphosate (WSSA Group 9)-resistant (GR) kochia was initially reported in Kansas in 2007, and later in Canada in 2011 (Beckie et al. Reference Beckie, Blackshaw, Low, Hall, Sauder, Martin, Brandt and Shirriff2013; Heap Reference Heap2021; Kumar et al. Reference Kumar, Jha, Jugulam, Yadav and Stahlman2019b). Seven years after the initial report of GR kochia, it was found in 10 U.S. states and 3 Canadian provinces. The most recent survey of kochia in Alberta, performed in 2017, showed that all 305 kochia populations were ALS inhibitor-resistant, 50% were GR, and 18% were dicamba (WSSA Group 4)-resistant (Beckie et al. Reference Beckie, Hall, Shirrif, Martin and Leeson2019). About 10% of these populations were triple-HR to thifensulfuron/tribenuron (WSSA Group 2), glyphosate, and dicamba (Beckie et al. Reference Beckie, Hall, Shirrif, Martin and Leeson2019); whereas a kochia population with four-way resistance to atrazine, chlorsulfuron (WSSA Group 2), glyphosate, and dicamba was reported in Kansas in 2013 (Heap Reference Heap2021; Varanasi et al. Reference Varanasi, Godar, Currie, Dille, Thompson, Stahlman and Jugulam2015).
Synthetic auxin-HR kochia was discovered only recently in Canada where it was reported in a wheat field in Saskatchewan in 2015, and subsequently in multiple fields and ruderal areas in Alberta in 2017 (Beckie et al. Reference Beckie, Hall, Shirrif, Martin and Leeson2019). While the initial auxinic-HR kochia population from Saskatchewan exhibited resistance to dicamba and fluroxypyr (WSSA Group 4; Heap Reference Heap2021), the Alberta populations were tested with dicamba only. Preliminary screening of a 2018 grower-submitted kochia sample from a wheat field in Rocky View County, Alberta, showed high-level resistance to fluroxypyr but not dicamba (CM Geddes, unpublished data). Because auxinic-HR kochia is a recent phenomenon in Canada, there is a need to further characterize these populations to fully understand the scope of the problem.
This study was designed to characterize 1) the level of resistance and 2) patterns of cross-resistance to dicamba and fluroxypyr in kochia populations collected during a 2017 survey carried out in Alberta (Beckie et al. Reference Beckie, Hall, Shirrif, Martin and Leeson2019) and a grower-submitted sample from 2018. These populations were compared with the initial Canadian auxinic-HR kochia population reported from Saskatchewan in 2015, and four susceptible controls.
Materials and Methods
Kochia Populations
Single-dose screening experiments and dose-response experiments were used to characterize resistance to dicamba and fluroxypyr in 12 putative auxinic-HR kochia populations collected from western Canada. The majority of kochia populations tested were collected during a 2017 postharvest survey of HR kochia in Alberta (Beckie et al. Reference Beckie, Hall, Shirrif, Martin and Leeson2019). Of the 305 populations sampled during this survey, single-dose screening identified 11 kochia populations that contained >20% dicamba-resistant individuals (Beckie et al. Reference Beckie, Hall, Shirrif, Martin and Leeson2019). These populations were collected from a range of cropped and non-cropped environments, including small-grain cereals [consisting of spring wheat, durum, barley (Hordeum vulgare L.) or oat], canola (Brassica napus L.), field pea (Pisum sativum L.), chemical fallow, and roadside ditches (Table 1). In addition, one grower-submitted sample collected in 2018 from a wheat field in Rocky View County, Alberta, was also included. This population was included because single-dose screening showed high-level fluroxypyr resistance but dicamba susceptibility (CM Geddes, unpublished data). These 12 populations were compared with the first confirmed auxinic-HR kochia population in Canada (hereafter referred to as the ‘Resistant’ control), which was found in a Saskatchewan wheat field in 2015. Four susceptible control populations were also included, three of which were laboratory-preserved controls used for resistance diagnostics (two ALS inhibitor-resistant but glyphosate- and synthetic auxin-susceptible controls, ‘Susceptible-1’ and ‘Susceptible-2’, and a GR but synthetic auxin-susceptible control, ‘Susceptible-3’). These three populations were maintained through recurrent population-level seed increases. The fourth susceptible control, ‘Susceptible-4’, was a field population collected from a wheat field in Alberta in 2017 and subsequently confirmed to be glyphosate- and synthetic auxin-susceptible but ALS inhibitor-resistant.
Incidence of glyphosate-, dicamba-, or fluroxypyr-resistant individuals within each kochia population determined using single-dose screening, and a brief description of each population.
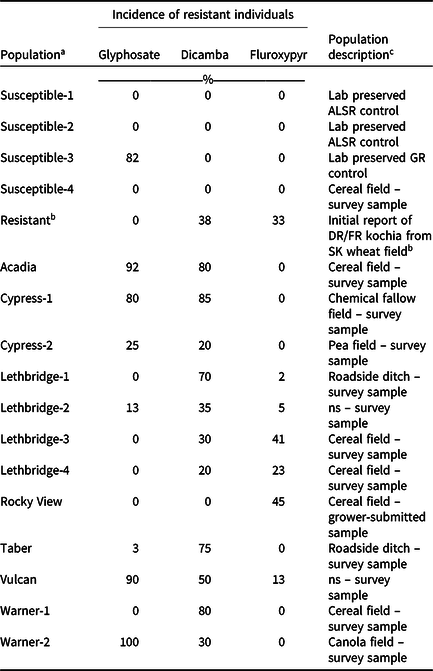
a Population names indicate the county from which they were collected. Field coordinates are not provided to protect farmer identity.
b The first reported auxinic herbicide-resistant kochia population in Canada was used for a resistant control. This population was collected from southern Saskatchewan and exhibited resistance to dicamba and fluroxypyr (Heap Reference Heap2021).
c Abbreviations: ALSR, acetolactate synthase inhibitor-resistant; DR, dicamba-resistant; FR, fluroxypyr-resistant; GR, glyphosate-resistant; ns, not specified; SK, Saskatchewan.
All kochia populations were collected postharvest in late September/early October. The reproductive biomass of 10 to 20 mature kochia plants per sample site was removed and combined to create a composite sample representing the kochia population (Beckie et al. Reference Beckie, Hall, Shirrif, Martin and Leeson2019). Each sample was dried at room temperature, threshed by hand under controlled conditions, and stored at 4 C until use. Each putative auxinic-HR kochia population represented a field population and was not subjected to further selection or inbreeding. Thus, resistance reported in the current study represented field-evolved resistance absent of further selection pressures.
Single-Dose Experiments
Single-dose population screening assays were conducted to determine the incidence of individuals within each population that were resistant to glyphosate, dicamba, or fluroxypyr. Each kochia population was planted in three 52 × 26 × 5 cm flats filled with modified Cornell soilless potting mixture supplemented with 756 mg N, 857 mg P, and 505 mg K L−1 mixture before planting. The seedlings within each flat were counted prior to herbicide treatment when they reached 2 to 5 cm in height. At least 100 seedlings were screened from each kochia population. The herbicide rates were chosen based on field use rates and previous research conducted in Canada and Montana (Beckie et al. Reference Beckie, Blackshaw, Low, Hall, Sauder, Martin, Brandt and Shirriff2013, Reference Beckie, Hall, Shirrif, Martin and Leeson2019; Jha et al. Reference Jha, Kumar and Lim2015). Separate flats were treated with either glyphosate (Roundup WeatherMax®; Bayer CropScience Inc., Calgary, AB), dicamba (XtendiMaxTM with VaporGripTM Technology; Bayer CropScience Inc., Calgary, AB), or fluroxypyr (PrestigeTM XCA; Corteva Agriscience Canada, Calgary, AB) at 900, 280, or 140 g ae ha−1, respectively, using a moving-nozzle cabinet sprayer. The sprayer was equipped with a flat-fan TeeJet® 8002VS nozzle (Spraying Systems Co., Wheaton, IL) and was calibrated to deliver 200 L ha−1 spray solution at 275 kPa in a single pass over the foliage at a speed of 2.4 km h−1. After treatment, the flats were placed in the greenhouse and watered daily under 20/18 C day/night temperature and a 16-h photoperiod supplemented with 100 µmol m−2 s−1 light. Each herbicide was considered a different experiment following a completely randomized design and the single-dose experiments were not repeated in time.
The plants within each flat were rated visually as susceptible (dead or nearly dead) or resistant (some injury with new regrowth or no injury) at 21 d after application (DAA) for glyphosate and 28 DAA for dicamba and fluroxypyr compared with treated and untreated resistant and susceptible controls. The incidence of resistant individuals within each flat was determined by dividing the number of resistant individuals by the total number of seedlings treated with the herbicide and multiplying by 100.
Dose-Response Experiments
Dose-response experiments were conducted to determine the level of resistance to dicamba and fluroxypyr within each kochia population using whole-plant bioassays. Separate dose-response experiments were conducted for each herbicide. Seeds from each kochia population were planted in 10 × 10 cm greenhouse pots containing the same soilless potting mixture as the single-dose experiments. When the seedlings reached 1 cm height, they were thinned to a density of 6 plants pot−1. Each individual pot was considered an experimental unit. When the seedlings reached 5 to 7 cm in height, different experimental units were treated with a rate titration equivalent to 0×, ⅛×, ¼×, ½×, 1×, 2×, or 4× the field rate of either dicamba or fluroxypyr using the same moving-nozzle cabinet sprayer as the single-dose experiments. The dicamba rates included 0, 35, 70, 140, 280, 560, and 1,120 g ae ha−1, while the fluroxypyr rates included 0, 17.5, 35, 70, 140, 280, and 560 g ae ha−1. Field rates of dicamba and fluroxypyr were considered 280 and 140 g ae ha−1, respectively. Following herbicide treatment, the pots were placed back in the greenhouse under the same environmental conditions described for the single-dose experiments. The pots were arranged in the greenhouse following a randomized complete block design. Each treatment (kochia population by herbicide rate combination) consisted of three replicate pots, and each experiment was repeated two times.
Visible injury was assessed following a rating scale of 0 (no injury using the 0 rate control as a reference) to 100 (plant death) at 14 and 28 DAA. Plant survival was determined at 28 DAA based on herbicide symptomology. Since kochia injury at field rates of dicamba or fluroxypyr does not result in complete necrosis, we considered surviving plants as those that exhibited unaltered leaf angle and regrowth from the apical meristem at the time of assessment, while plants that had succumbed to mortality were those that exhibited swelling of the stem, altered leaf angle, and were absent of regrowth from the apical meristem. Plant survival was determined for each experimental unit by dividing the number of surviving plants by the total number of treated plants (6) and multiplying by 100. Also, at 28 DAA, kochia shoot biomass within each experimental unit was harvested down to the soil surface, and shoot fresh weight (FW) was determined. The harvested shoot biomass was dried in an oven at 60 C until equilibrium, and shoot dry weight (DW) was determined.
Statistical Analyses: Dose-Response Experiments
Visible injury at 14 and 28 DAA, plant survival at 28 DAA, and shoot FW and DW at 28 DAA from the dose-response bioassays were analyzed via ANOVA using the MIXED procedure of SAS 9.4 software (SAS Institute, Cary, NC). In the initial ANOVAs, kochia population, herbicide rate, and experimental run were considered fixed effects, whereas experimental replication nested within run was considered a random effect. The main and interaction effects for experimental run were not significant for each response variable, and thus subsequent analyses were combined across runs. Residual normality was assessed using the Shapiro-Wilk test in the SAS UNIVARIATE procedure, whereas homoscedasticity was assessed visually by plotting the residuals against the predicted values (Littell et al. Reference Littell, Milken, Stroup, Wolfinger and Schabenberger2006). Extreme outliers were removed based on Lund’s test (Lund Reference Lund1975).
The drc package in R software version 3.6.0 (R Core Team 2019) was used for nonlinear regression of the response variables regressed against herbicide rate for each population using the three-parameter log-logistic model (Equation 1):
 $$y = \left\{ {d/1 + \exp \left[ {b\left( {\log x - \log e} \right)} \right]} \right\}$$
where y is the response variable, d is the upper asymptote, b is the slope of the response curve at the inflection point, and e is the response curve inflection point (Ritz et al. Reference Ritz, Baty, Streibig and Gerhard2015). Appropriate fit of the response curves was assessed using the lack-of-fit test (P > 0.05) and compared with the fit of other candidate nonlinear regression models using the Akaike Information Criterion. For each population, the herbicide doses causing 50% visible injury (ED50) were extracted based on the absolute reference of 100% visible injury, while the herbicide doses resulting in 50% plant mortality (LD50) were extracted relative to plant survival at herbicide dose 0. The resistance indices [resistant to susceptible (R/S) ratio] for each population and response variable were determined by dividing the ED50 or LD50 for the population of interest by the average ED50 or LD50 for the four susceptible control populations. Populations resulting in a resistance index of 4.0 or greater were considered resistant (Jha et al. Reference Jha, Kumar and Lim2015), whereas resistance indices between 2.0 and 3.9 were considered as potentially developing resistance.
Results and Discussion
Single-Dose Experiments
Single-dose screening revealed multiple patterns of resistance to dicamba and fluroxypyr among the kochia populations. Of the 12 putative auxinic-HR populations, five contained both dicamba- and fluroxypyr-resistant individuals, six contained dicamba-resistant individuals but were absent of fluroxypyr resistance, and one population contained individuals resistant to fluroxypyr but not dicamba (Table 1). The incidence of dicamba-resistant individuals within these populations ranged from 0% to 85%, whereas fluroxypyr-resistant individuals ranged from 0% to 45%. The populations with dicamba-resistant individuals were collected from fields with small-grain cereals, canola, field pea, chemical fallow, and roadside ditches, whereas the populations with fluroxypyr-resistant individuals were collected from small-grain cereal fields and a roadside ditch (Table 1). Beckie et al. (Reference Beckie, Hall, Shirrif, Martin and Leeson2019) reported dicamba resistance in 18% of the kochia populations sampled in Alberta in 2017, but did not evaluate fluroxypyr resistance. Surveys of HR kochia in Saskatchewan and Manitoba are underway. Random surveys carried out in Montana between 2013 and 2016 found 15 sites with dicamba-resistant kochia (Kumar et al. Reference Kumar, Jha, Jugulam, Yadav and Stahlman2019b). In Colorado, kochia surveys between 2012 and 2014 found that 33% of the 171 populations tested were dicamba-resistant, and no populations exhibited fluroxypyr resistance (Westra et al. Reference Westra, Nissen, Getts, Westra and Gaines2019). One dicamba-resistant kochia population was found in a 2009/2010 survey of 71 kochia populations in Nebraska, while fluroxypyr resistance was not evaluated (Crespo et al. Reference Crespo, Bernards, Sbatella, Kruger, Lee and Wilson2014). Previous reports from the United States have documented kochia populations with resistance to dicamba alone, or with cross-resistance to dicamba, fluroxypyr, and/or 2,4-D (Goss and Dyer Reference Goss and Dyer2003; Jha et al. Reference Jha, Kumar and Lim2015; Kumar et al. Reference Kumar, Currie, Jha and Stahlman2019a; LeClere et al. Reference LeClere, Wu, Westra and Sammons2018; Nandula and Manthey Reference Nandula and Manthey2002); however much less is known about synthetic auxin cross-resistance in Canadian kochia populations.
Dose-Response Experiments
A significant lack-of-fit test for kochia shoot FW and DW indicated that the three-parameter log-logistic model did not appropriately explain the kochia biomass response to dicamba or fluroxypyr rate. Although shoot FW and DW have been successful in discriminating auxinic-HR from susceptible kochia populations in some studies (Jha et al. Reference Jha, Kumar and Lim2015; Kumar et al. Reference Kumar, Currie, Jha and Stahlman2019a), other researchers have reported that quantitative measures such as plant height, shoot biomass, or plant diameter were inadequate in discriminating among these biotypes (Cranston et al. Reference Cranston, Kern, Hackett, Miller, Maxwell and Dyer2001). Cranston et al. (Reference Cranston, Kern, Hackett, Miller, Maxwell and Dyer2001) suggested that visible injury ratings were more effective than other quantitative measures at parsing auxinic-HR from susceptible kochia populations because the epinasty, stem swelling, and tissue proliferation that are typical of synthetic auxin injury can result in shoot biomass from injured plants weighing as much or more than uninjured plants. In the current study, other appropriate nonlinear regression models inadequately fit shoot FW and DW data (lack-of-fit P < 0.05), and therefore, these response variables were analyzed using ANOVA with herbicide rate as a categorical parameter.
Dicamba Dose Response
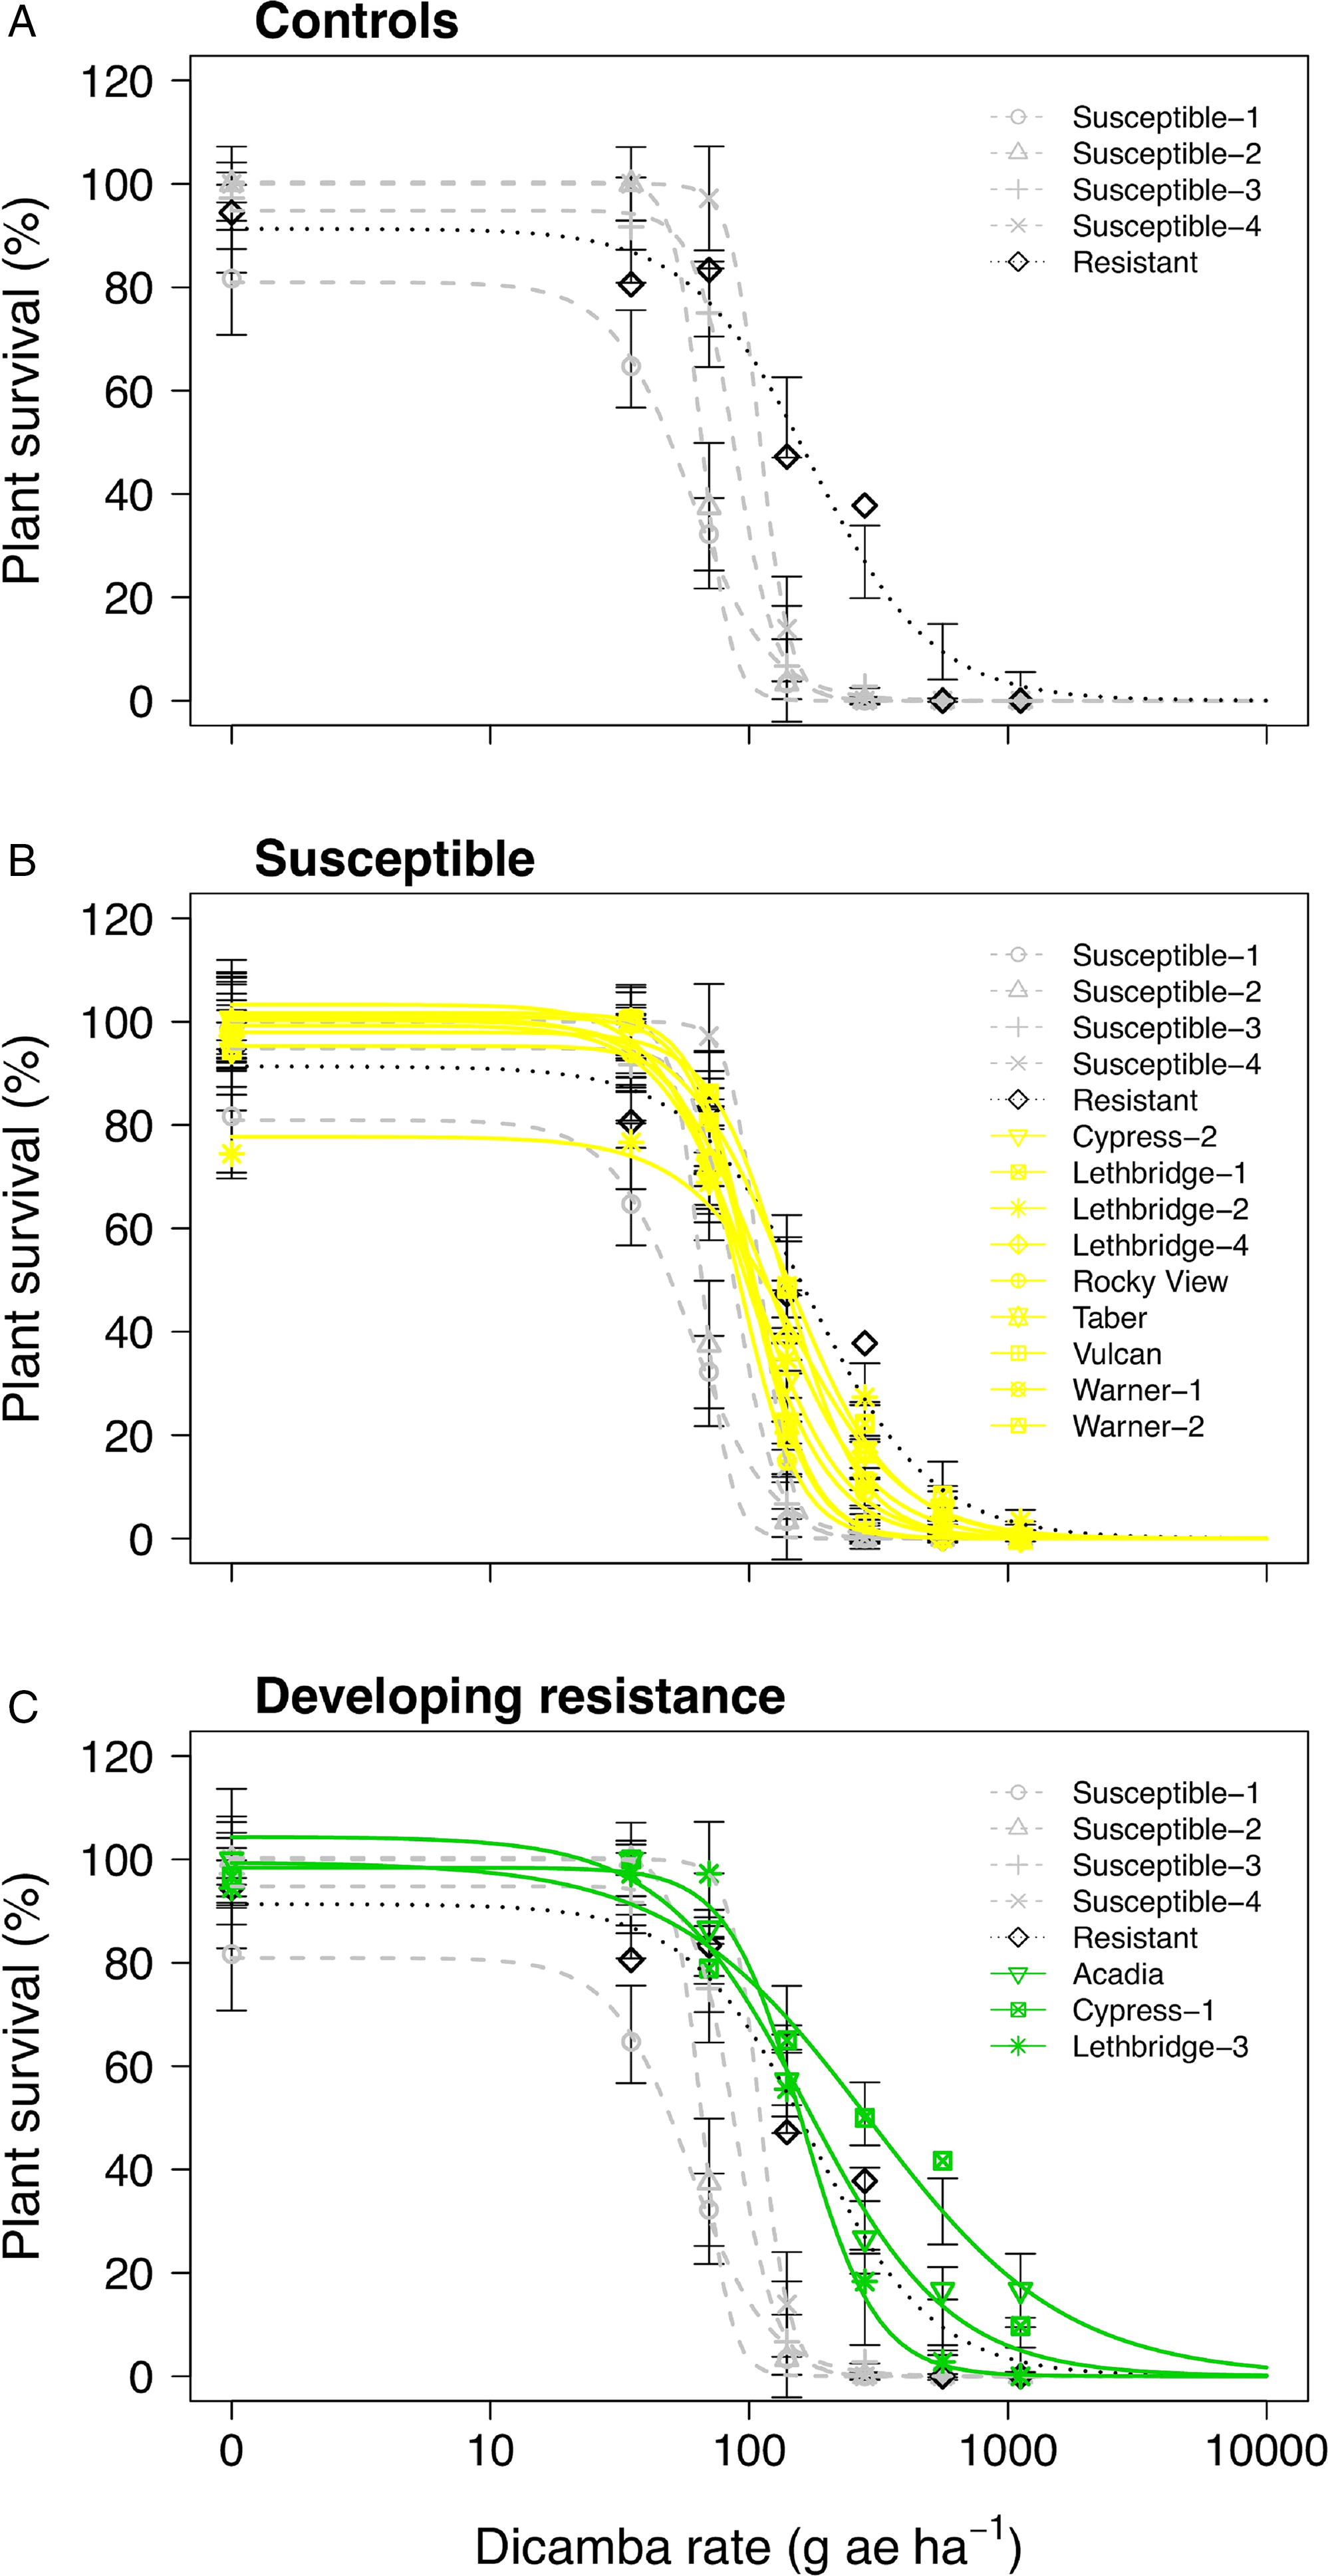
Only one of the putative auxinic-HR kochia populations exhibited dicamba resistance based on the dose-response experiments, while two others were potentially developing resistance. Cypress-1 resulted in 5.4-fold and 6.5-fold resistance to dicamba based on visible injury at 14 and 28 DAA, respectively (Table 2). Acadia showed 3.0-fold and 2.7-fold resistance to dicamba based on these same response variables, while Lethbridge-3 resulted in 2.2-fold and 2.1-fold resistance. Kochia plant survival data agreed with visible injury ratings with the exception of Cypress-1, which exhibited 3.7-fold resistance based on plant survival; and because this was less than the resistance threshold of 4.0 it was categorized as potentially developing resistance based on this parameter (Table 2; Figure 1; Supplementary Table S1). The resistant control collected from Saskatchewan in 2015 was characterized as developing resistance with an index of 2.0 for visible injury and plant survival (Table 2).
The effective dose causing 50% visible injury (ED50) 14 and 28 d after application (DAA), and lethal dose causing 50% plant mortality (LD50) 28 DAA of dicamba and fluroxypyr to 17 kochia populations with corresponding resistance indices. a,d
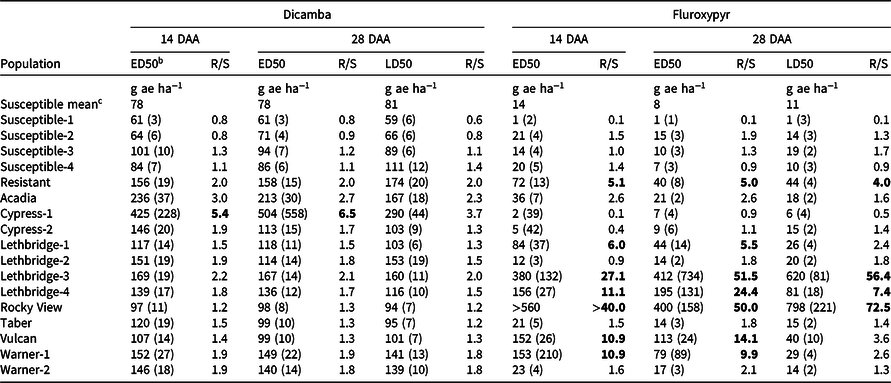
a Bold values indicate resistance at a R/S ratio threshold of ≥4.0.
b Values are means, while parenthetical values are the SE.
c Mean ED50 and LD50 values for all four susceptible populations.
d Abbreviations: DAA, days after application; ED50, the effective dose causing 50% visible injury relative to the untreated control for each population; LD50, the lethal dose causing 50% plant mortality relative to the untreated control for each population; R/S, the resistance index determined as the ratio of the ED50 or LD50 value for each population relative to the mean ED50 or LD50 value for all four susceptible populations.
Plant survival as a function of the dicamba rate applied to 17 kochia populations collected from western Canada separated into (A) resistant or susceptible control populations, (B) controls with susceptible populations, and (C) controls with populations developing resistance. Symbols represent observed means; vertical bars indicate ± SE. Grey dashed lines represent the susceptible controls, the dotted black line represents the resistant control, yellow solid lines represent susceptible populations, and green solid lines represent populations developing resistance. The dicamba field application rate was considered to be 280 g ae ha−1.
The dicamba ED50 values ranged among the putative auxinic-HR populations from 97 to 425 g ae ha−1 14 DAA, and from 98 to 504 g ae ha−1 28 DAA (Table 2; Figure 2; Supplementary Table S1). This compared with the ED50 for the four susceptible control populations, which ranged from 61 to 101 g ae ha−1 and from 61 to 94 g ae ha−1 at 14 and 28 DAA, respectively. The fitted dose-response models for visible injury at 14 and 28 DAA clearly showed that two populations, Cypress-1 and Acadia, exhibited reduced response to dicamba compared with the dicamba-resistant control population (Figure 2; Supplementary Table S1). A similar response was observed for kochia shoot FW and DW (Figure 3). Cypress-1 shoot FW was reduced to 44% and shoot DW to 54% of the 0 rate control when treated with dicamba at 560 g ae ha−1. At the same rate, the shoot FW and DW of Acadia was 24% and 41%, while the shoot FW and DW of Lethbridge-3 was 13% and 36% (Figure 3). This compared with the average of the four susceptible controls of 5% shoot FW and 23% shoot DW when treated with dicamba at 560 g ae ha−1 (data not shown).
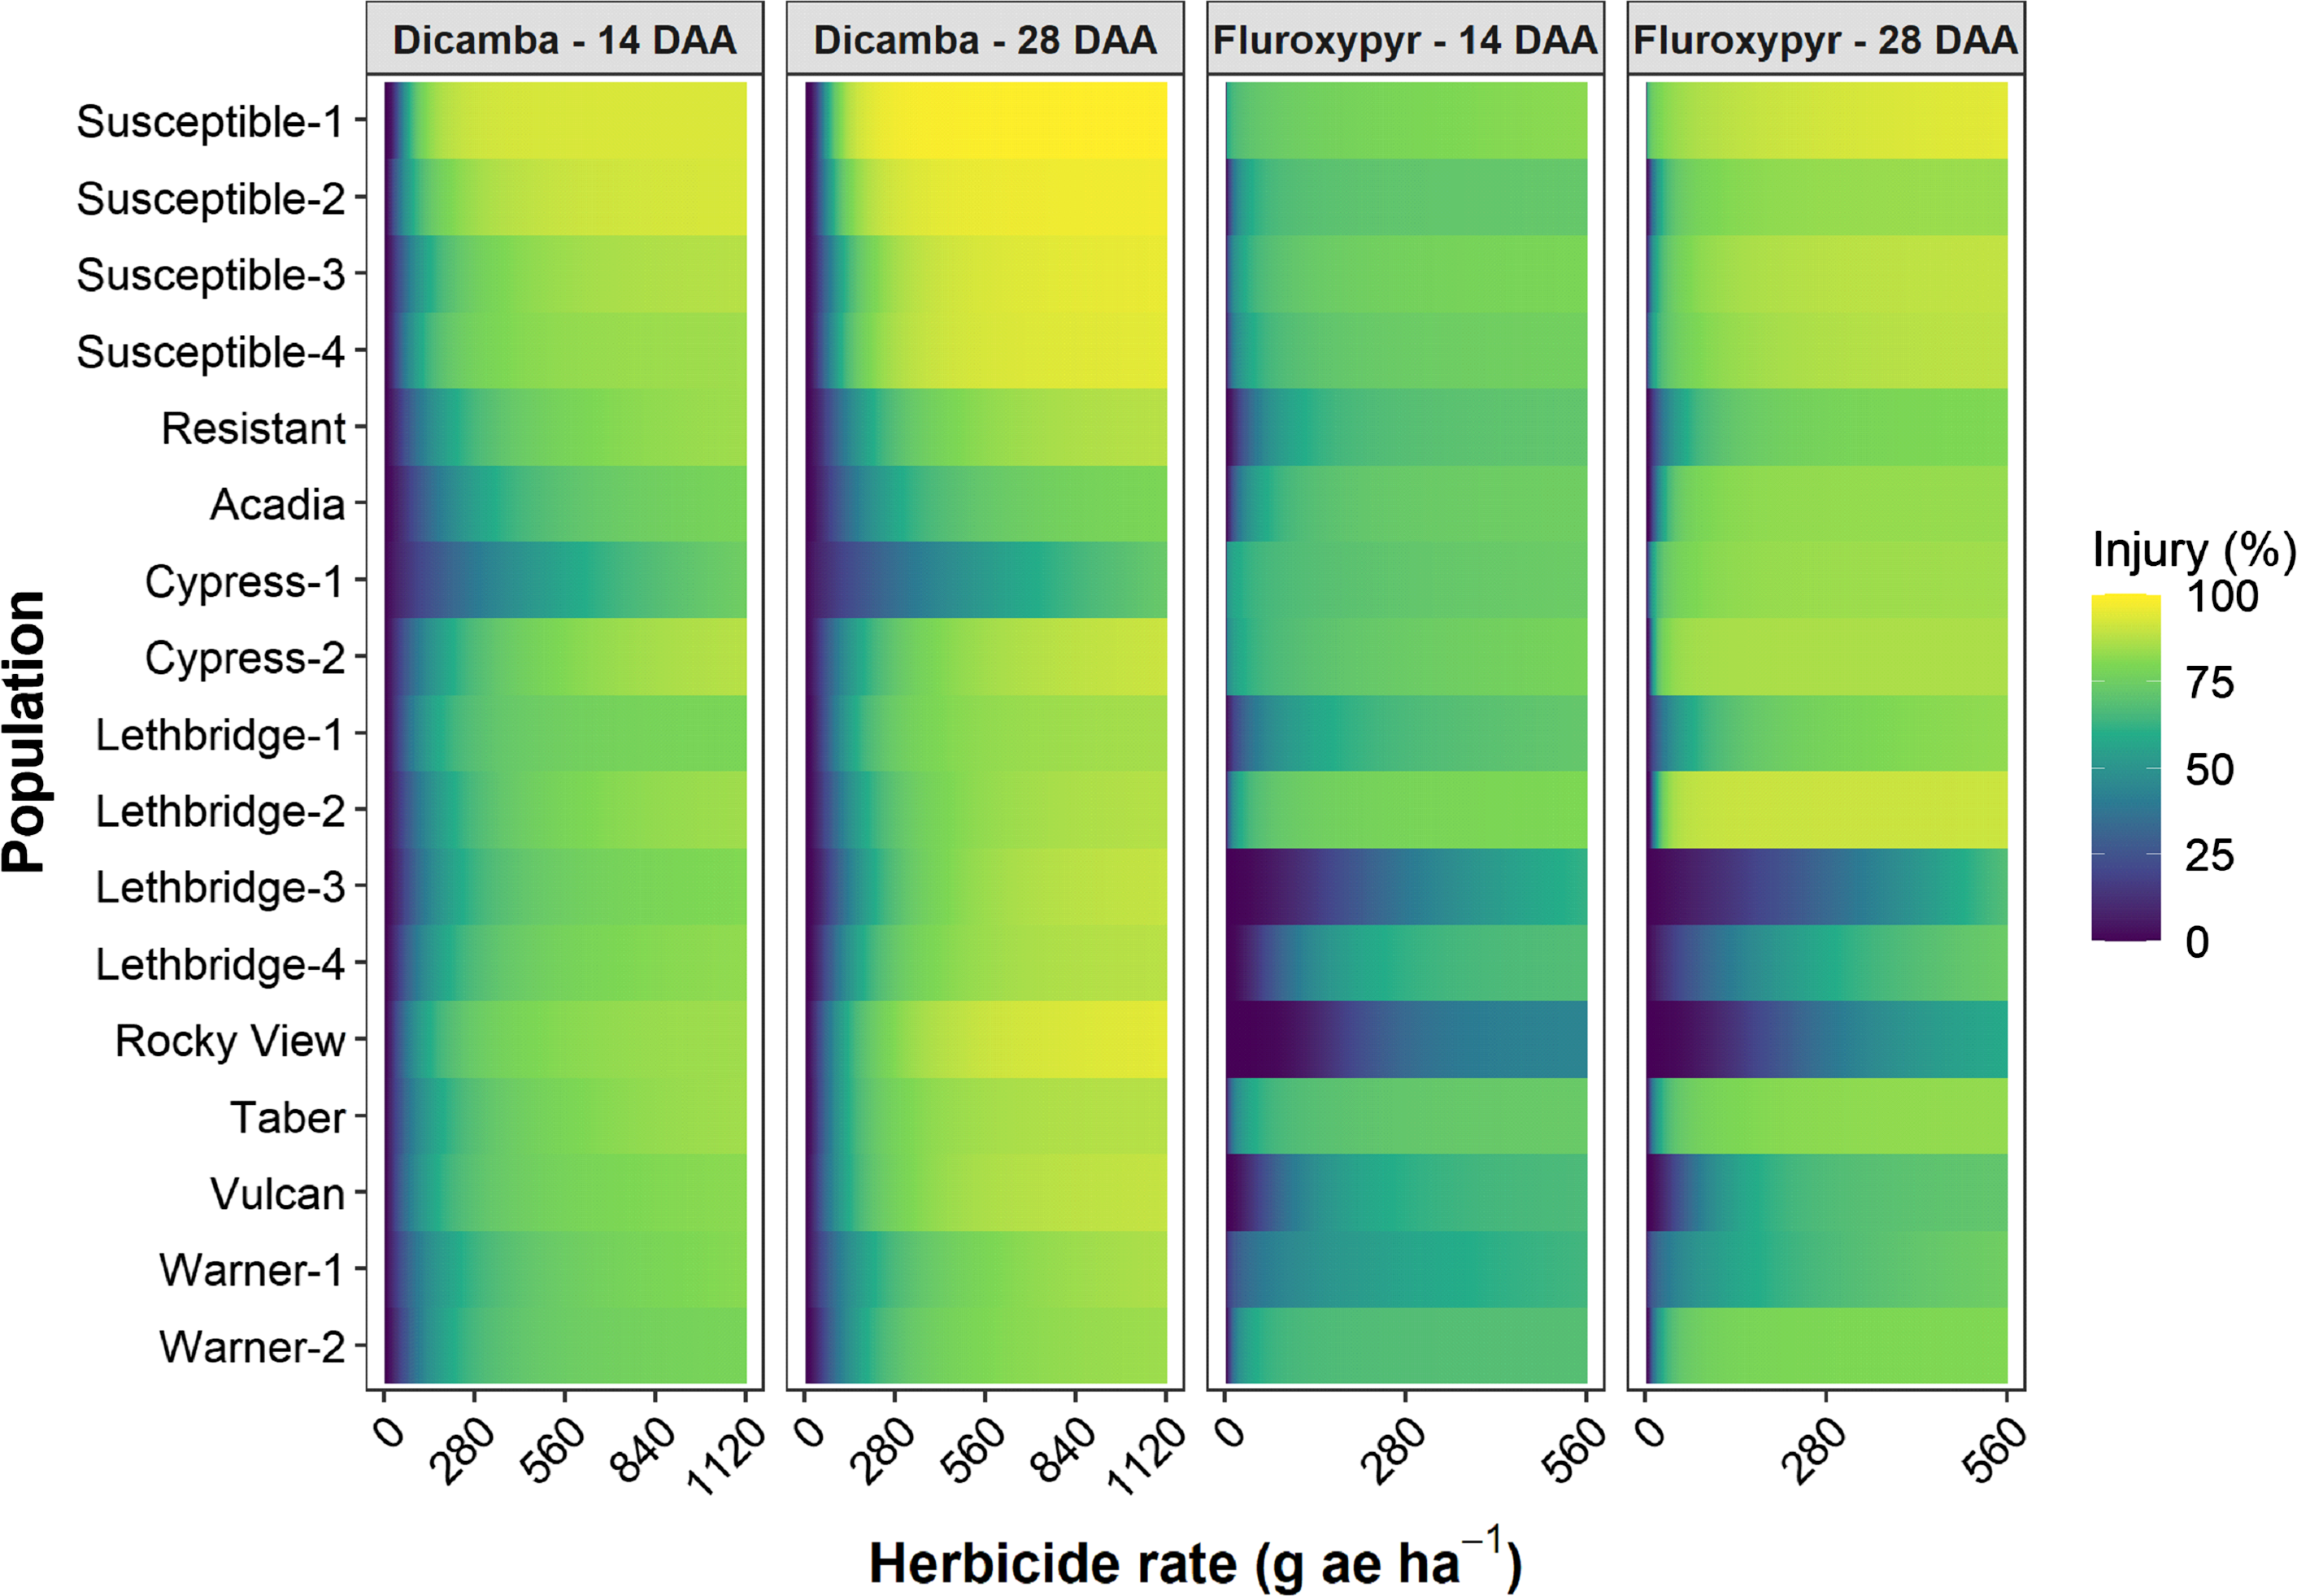
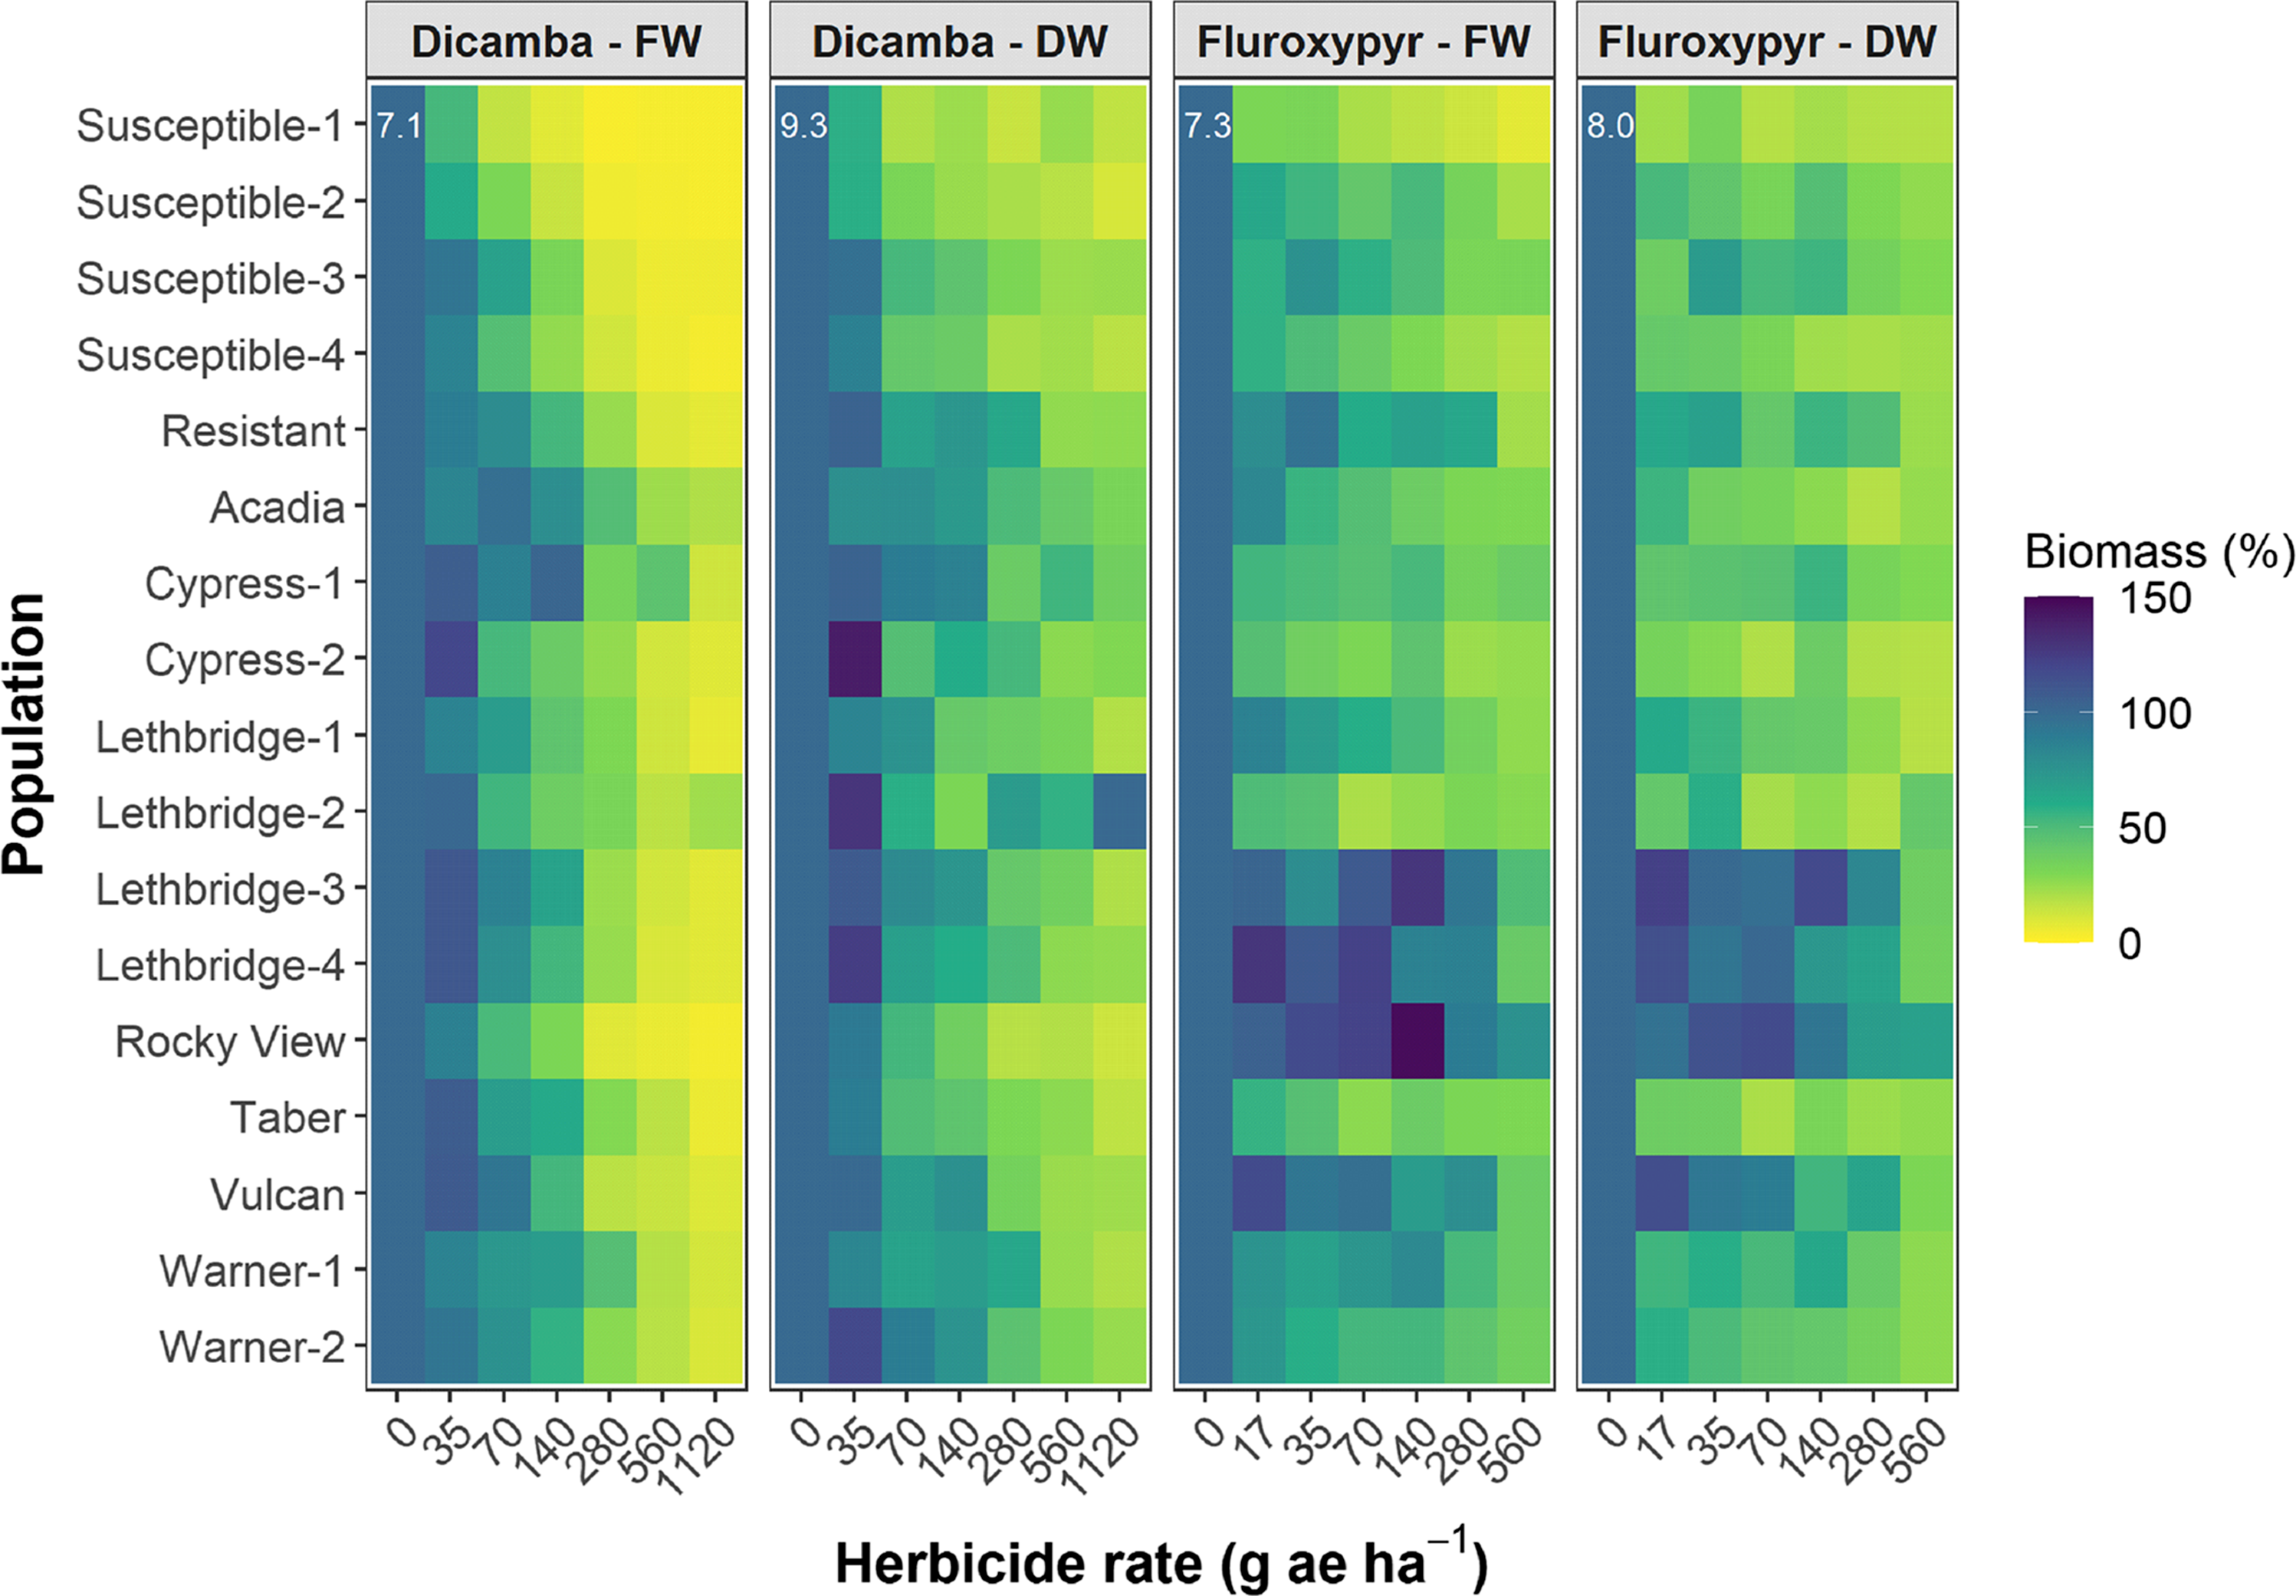
Visible injury at 14 and 28 d after application (DAA) as a function of dicamba or fluroxypyr rate applied to 17 kochia populations relative to the 0 rate control for each population. The color gradients represent predicted visible injury based on the three-parameter log-logistic dose-response models for each population, herbicide, and assessment timing combination. The dicamba and fluroxypyr field application rates were considered to be 280 and 140 g ae ha−1, respectively.
Shoot biomass fresh weight (FW) and dry weight (DW) 28 d after application (DAA) as a function of the dicamba or fluroxypyr rate applied to 17 kochia populations relative to the 0 rate control for each population. Colors indicate observed means; the white numbers in the upper left of each subplot indicate the SEM. The dicamba and fluroxypyr field application rates were considered to be 280 and 140 g ae ha−1, respectively.
The dicamba resistance indices in the current study correspond with previous reports showing variable response of kochia populations to dicamba. Inbred accessions developed from kochia populations collected from Montana in 2011 exhibited up to 6.8-fold resistance to dicamba based on shoot DW (Jha et al. Reference Jha, Kumar and Lim2015). Cranston et al. (Reference Cranston, Kern, Hackett, Miller, Maxwell and Dyer2001) reported 4.6-fold resistance to dicamba based on visible injury at 14 DAA for an inbred accession developed from a Montana field population collected in 1993. Inbred accessions developed from kochia populations collected in North Dakota in 1995 exhibited 4-fold to 10-fold resistance to dicamba based on visible injury at 28 DAA (Nandula and Manthey Reference Nandula and Manthey2002). More recently, auxinic-HR kochia inbred accessions developed from field populations collected in Kansas in 2017 varied from 2.0-fold to 15.1-fold and from 3.1-fold to 9.4-fold resistance to dicamba based on shoot FW and DW (Kumar et al. Reference Kumar, Currie, Jha and Stahlman2019a). Field populations collected from Nebraska in 2010, absent of further inbreeding, resulted in a difference of 11.3-fold and 19.0-fold in the dose of dicamba causing 50% reduction in shoot DW and 50% visible injury 28 DAA (Crespo et al. Reference Crespo, Bernards, Sbatella, Kruger, Lee and Wilson2014). An inbred accession developed from a Nebraska kochia population resulted in 30- and 38-fold resistance to dicamba in two separate studies, and also exhibited cross-resistance to 2,4-D (WSSA Group 4) and fluroxypyr (LeClere et al. Reference LeClere, Wu, Westra and Sammons2018; Preston et al. Reference Preston, Belles, Westra, Nissen and Ward2009). Despite the putative auxinic-HR populations resulting in a wide but low range (between 1.2-fold and 6.5-fold resistance) in dicamba resistance indices in the current study, these field-evolved populations were absent of further selection pressure and resistance enrichment that is often concomitant with the development of resistant inbred accessions. Thus, resistance indices were expected to be lower than those reported for inbred lines. The development of inbred accessions using these field populations will further our understanding of auxinic-HR kochia in Canada, and provide a source for in-depth assessment of resistance mechanisms. Indeed, lower homogeneity in field populations compared with inbred accessions could explain discrepancies among the single-dose and dose-response experiments (Tables 1 and 2). The incidence of resistance in the single-dose experiments appeared to be better explained by shoot biomass FW and DW than by visible injury or plant survival (Tables 1 and 2; Figures 1, 2, and 3).
Fluroxypyr Dose Response
Six of the putative auxinic-HR populations were fluroxypyr-resistant based on the dose-response experiments. These populations varied widely in their level of resistance. Based on visible injury 14 DAA, the fluroxypyr ED50 resistance indices varied among all putative auxinic-HR populations from 0.1 to >40.0 (Table 2). At 28 DAA the ED50 resistance indices ranged from 0.9 to 51.5, and the LD50 indices ranged from 0.5 to 72.5. Three populations, Lethbridge-3, Lethbridge-4, and Rocky View were confirmed to be resistant based on all three parameters (Table 2; Figures 2 and 4; Supplementary Table S2). Three other populations (Lethbridge-1, Vulcan, and Warner-1) were considered resistant based on visible injury assessments, but developing resistance based on plant survival estimates. The resistant control resulted in 4.0-fold to 5.1-fold resistance compared with the average ED50 and LD50 values for the four susceptible controls (Table 2).
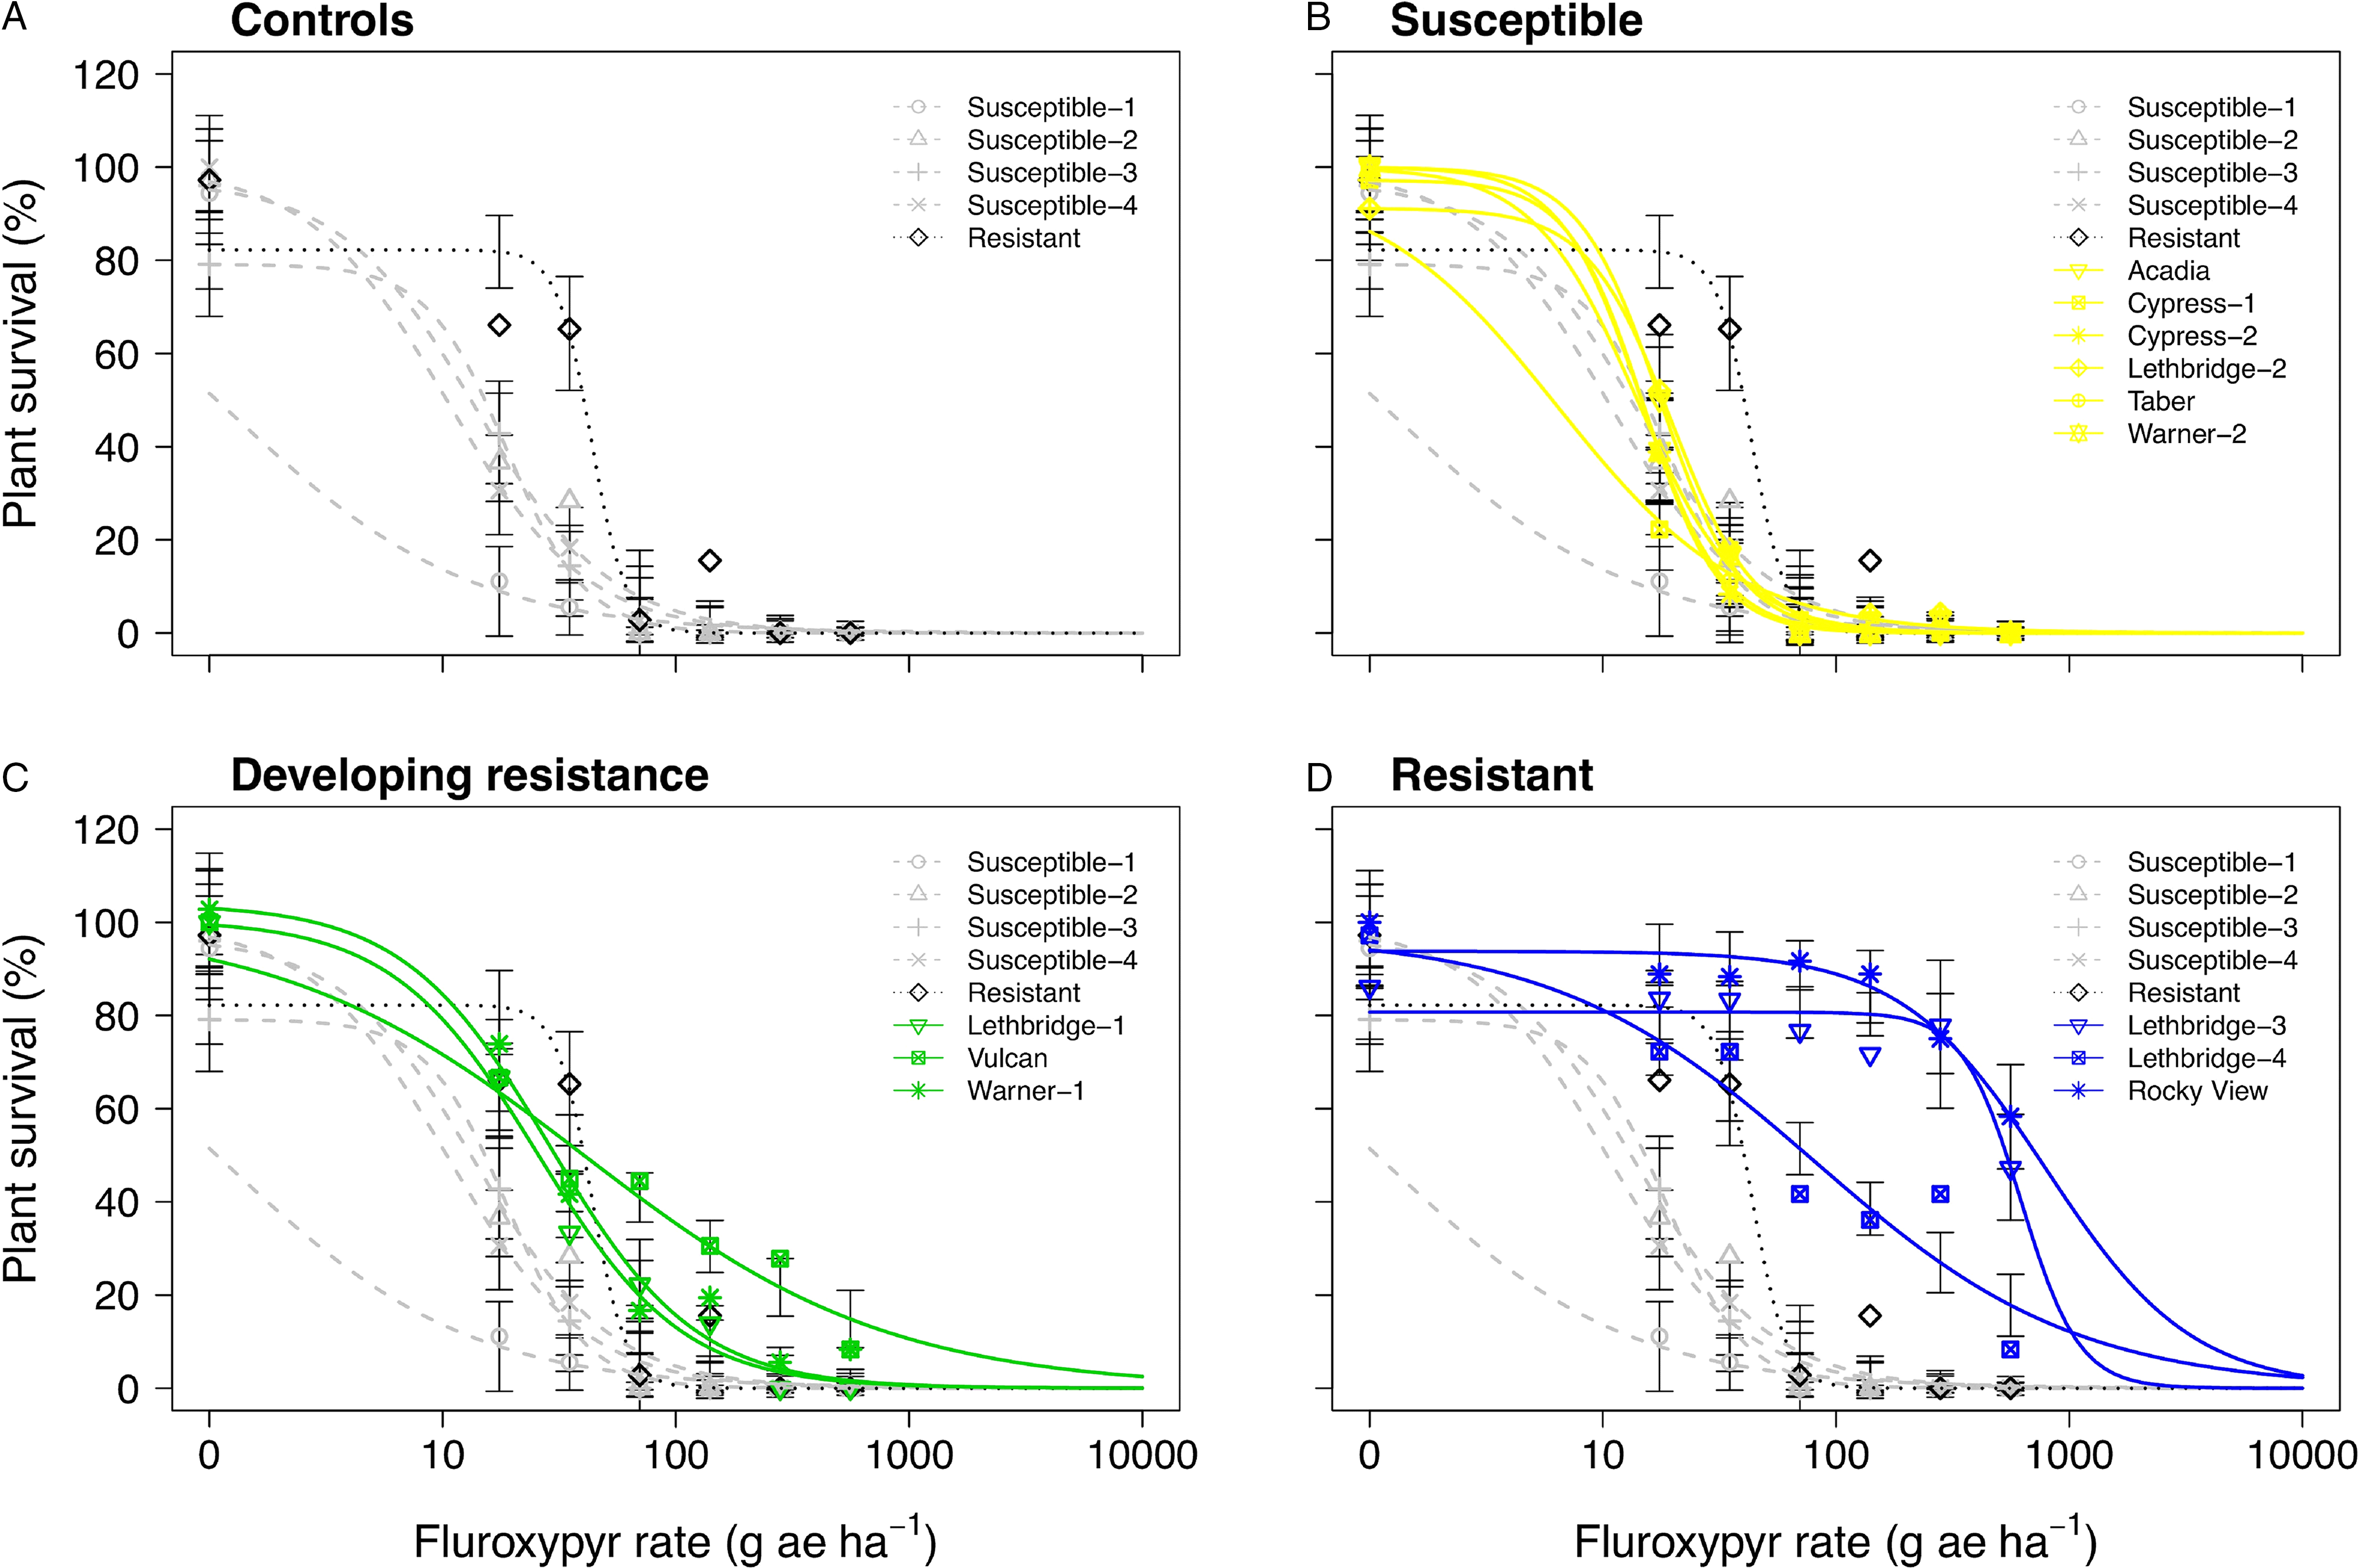
Plant survival as a function of the fluroxypyr rate applied to 17 kochia populations collected from western Canada separated into (A) resistant or susceptible control populations, (B) controls with susceptible populations, (C) controls with populations developing resistance, and (D) controls with resistant populations. Symbols represent observed means; vertical bars indicate ± SE. Grey dashed lines represent the susceptible controls, the dotted black line represents the resistant control, yellow solid lines represent susceptible populations, green solid lines represent populations developing resistance, and blue solid lines represent resistant populations. The fluroxypyr field application rate was considered to be 140 g ae ha−1.
The fluroxypyr ED50 values for the putative auxinic-HR populations ranged from 2 to >560 g ae ha−1 14 DAA and from 7 to 412 g ae ha−1 28 DAA (Table 2; Figure 2; Supplementary Table S2). This compared with the four susceptible control populations that ranged in ED50 from 1 to 21 g ae ha−1 14 DAA and from 1 to 15 g ae ha−1 28 DAA when treated with fluroxypyr. Similarly, LD50 values for fluroxypyr ranged among the putative auxinic-HR populations by 133-fold from 6 to 798 g ae ha−1 (Table 2; Figure 4; Supplementary Table S2). Visualization of the fitted log-logistic models for visible injury at 14 and 28 DAA revealed four populations (Lethbridge-3, Lethbridge-4, Rocky View, and Vulcan) that responded less to fluroxypyr than the resistant control population, and another two populations (Lethbridge-1, and Warner-1) that were similar to the resistant control (Figure 2; Supplementary Table S2). Lethbridge-3 and Lethbridge-4 clearly stood out from the rest of the populations in their response to fluroxypyr, and these populations were also those that had the greatest ED50 and LD50 values (Table 2). A similar trend was observed for shoot FW and DW (Figure 4). Shoot FW and DW of Rocky View were 77% and 67% that of the 0 rate control when treated with fluroxypyr at 560 g ae ha−1. When treated with the same rate of fluroxypyr, shoot FW and DW values for Lethbridge-3 were 49% and 37%, respectively. This compared with an average shoot FW among the four susceptible populations of 20% and shoot DW of 24% relative to the 0 rate controls when treated with fluroxypyr at 560 g ae ha−1 (data not shown).
The Lethbridge-3 and Rocky View populations exhibited a much greater level of resistance to fluroxypyr compared with previous reports, whereas levels of resistance in the other fluroxypyr-resistant populations were similar to those found elsewhere. Inbred accessions derived from Montana field populations collected in 2011 resulted in resistance indices of 1.4 to 5.7 based on visible injury and 1.6 to 4.0 based on shoot DW response to fluroxypyr (Jha et al. Reference Jha, Kumar and Lim2015). Two kochia populations collected from North Dakota exhibited up to 6-fold resistance to fluroxypyr (Howatt and Ciernia Reference Howatt and Ciernia2014), while an inbred accession from Nebraska showed 13-fold resistance (LeClere et al. Reference LeClere, Wu, Westra and Sammons2018). Inbred accessions developed from Kansas kochia populations ranged from 3.8-fold to 7.3-fold and from 3.0-fold to 8.6-fold resistance to fluroxypyr based on shoot FW and DW, respectively (Kumar et al. Reference Kumar, Currie, Jha and Stahlman2019a). In comparison, fluroxypyr resistance levels of up to 72.5-fold in Rocky View and 56.4-fold in Lethbridge-3 (Table 2) were well above the levels of fluroxypyr resistance in kochia reported previously.
Multiple Patterns of Synthetic Auxin Resistance
The single-dose and dose-response experiments in the current study identified multiple patterns of synthetic auxin resistance in kochia. Kochia populations present in Canada may exhibit resistance to dicamba alone, fluroxypyr alone, or cross-resistance to dicamba and fluroxypyr (Tables 1 and 2; Figure 5). The majority of previous research identified kochia with resistance to dicamba alone or dicamba-resistant kochia with cross-resistance to fluroxypyr and/or 2,4-D (Goss and Dyer Reference Goss and Dyer2003; Jha et al. Reference Jha, Kumar and Lim2015; Kumar et al. Reference Kumar, Currie, Jha and Stahlman2019a; LeClere et al. Reference LeClere, Wu, Westra and Sammons2018; Nandula and Manthey Reference Nandula and Manthey2002). This study is the first report of fluroxypyr-resistant kochia absent of resistance to dicamba, although we are aware of one other kochia population from Colorado that also exhibits a similar resistance pattern (OE Todd, personal communication). Potential cross-resistance to other synthetic auxin (WSSA Group 4) herbicides such as halauxifen in kochia populations remains unknown.
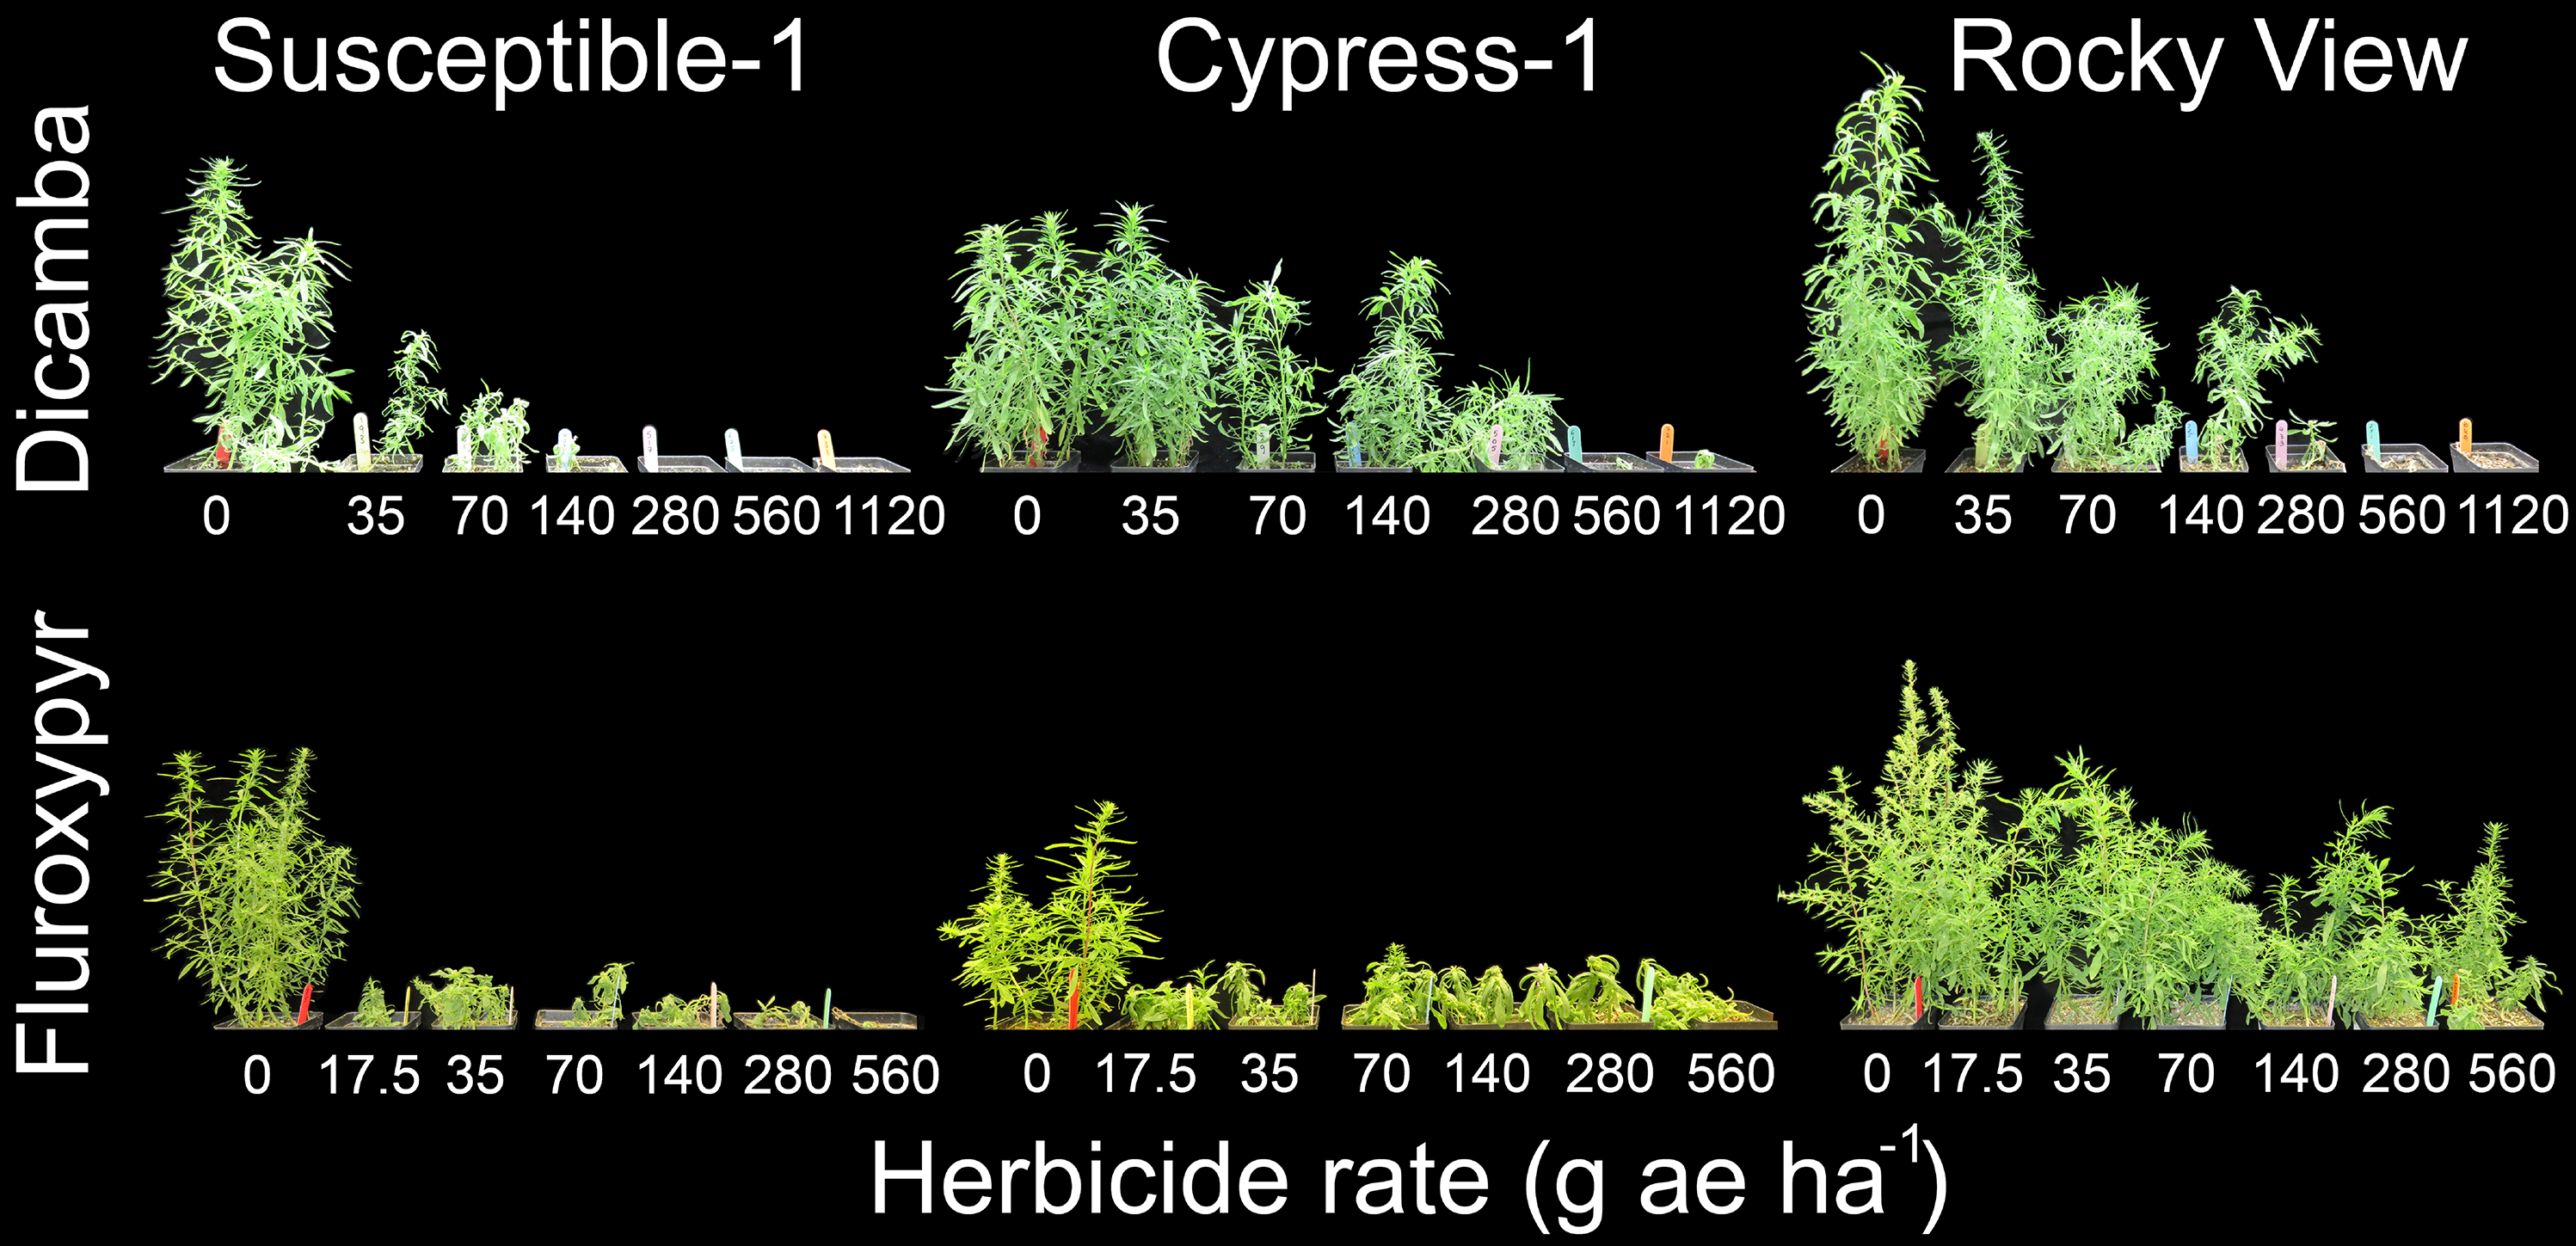
Visible response of kochia populations Susceptible-1, Cypress-1, and Rocky View 28 d after application of multiple dicamba or fluroxypyr rates in a whole-plant dose-response bioassay. The dicamba and fluroxypyr field application rates were considered to be 280 and 140 g ae ha−1, respectively.
Inconsistent patterns of resistance to dicamba and fluroxypyr in the current study suggest that resistance to these two herbicides in Canada may be conferred by separate mechanisms. The mechanism of action for synthetic auxins is not fully elucidated, but recent insight suggests that auxin herbicides are perceived by transport inhibitor response 1 (TIR1) and homologue proteins, binding targets Aux/indole-3-acetic acid (IAA) transcriptional repressor proteins for degradation resulting in depression of proteins that activate transcription of auxin-response genes and causing upregulation of abscisic acid and ethylene production; ethylene further upregulates abscisic acid production, which promotes growth inhibition, senescence, and plant death (Grossmann Reference Grossmann2010). The growing body of research suggests that multiple mechanisms can confer dicamba resistance in kochia. Cranston et al. (Reference Cranston, Kern, Hackett, Miller, Maxwell and Dyer2001) concluded that dicamba resistance in kochia was not likely due to reduced uptake, translocation, or enhanced metabolism. Goss and Dyer (Reference Goss and Dyer2003) hypothesized that a dicamba-resistant kochia biotype from Montana had impaired auxin binding or signal transduction pathways resulting in delayed phenotypic response in the absence of dicamba treatment. Subsequent research identified differential expression of genes associated with cell wall modification and another elusive function in this dicamba-resistant population (Kern et al. Reference Kern, Chaverra and Dyer2005). Dicamba resistance in an inbred kochia accession from Nebraska was conferred by a single allele with high dominance (Preston et al. Reference Preston, Belles, Westra, Nissen and Ward2009). Further research identified that this biotype was also resistant to fluroxypyr and 2,4-D (LeClere et al. Reference LeClere, Wu, Westra and Sammons2018). Transcriptome sequencing of this biotype revealed a double nucleotide base change resulting in a glycine to aspargine substitution (G73N) in a highly conserved region of an Aux/IAA protein, KsIAA16, which conferred dicamba resistance (LeClere et al. Reference LeClere, Wu, Westra and Sammons2018). Using this same population, Pettinga et al. (Reference Pettinga, Ou, Patterson, Jugulam, Westra and Gaines2017) reported 2-fold higher transcription of chalcone synthase, the gene that regulates synthesis of flavonols quertecin and kaemperfol. These flavonols compete with auxin for intercellular transport and vascular loading via ATP-binding cassette subfamily B (ABCB) membrane transporters, thus potentially reducing dicamba translocation. Different unlinked genes conferred dicamba resistance in this Nebraska kochia population and another Kansas population, suggesting that resistance in these populations evolved independently through different mechanisms (Ou et al. Reference Ou, Gaines, Fritz, Stahlman and Jugulam2021). The mechanism(s) of dicamba and/or fluroxypyr resistance in the kochia populations evaluated in the current study warrants further investigation.
Kochia biotypes with cross-resistance to dicamba and fluroxypyr are associated with fitness penalties, suggesting that the frequency of these biotypes might decline if the selection pressures from these auxin-based herbicides are removed (Kumar and Jha Reference Kumar and Jha2016; LeClere et al. Reference LeClere, Wu, Westra and Sammons2018; Wu et al. Reference Wu, LeClere, Liu, Paciorek, Perez-Jones, Westra and Sammons2021b). However, because these fitness penalties have only minor effect on reproductive output, the usage frequency of auxin-based herbicides is high, and the species exhibits extensive pollen- and seed-mediated gene flow, the likelihood of auxinic-HR kochia populations reverting to susceptible biotypes is low. In the absence of competition, an inbred dicamba/fluroxypyr-resistant kochia accession from Montana exhibited reduced plant height, plant width, primary branches, leaf area, stem diameter, shoot biomass, reproductive fitness, and seed weight compared with a susceptible accession (Kumar and Jha Reference Kumar and Jha2016). The resistant accession was also less competitive when grown in mixture with a susceptible accession. Pettinga et al. (Reference Pettinga, Ou, Patterson, Jugulam, Westra and Gaines2017) proposed that increased expression of chalcone synthase and its cascade could confer a fitness penalty in the Nebraska kochia population. Subsequent research identified significant impairment of vegetative growth in segregating lines of the Nebraska G73N accession, which manifest as reduced plant height, thicker leaf blades with lower photosynthetic efficiency, reduced stem diameter with less developed vascular bundle systems, impaired plant competitiveness, and lower biomass (LeClere et al. Reference LeClere, Wu, Westra and Sammons2018; Wu et al. Reference Wu, LeClere, Liu, Paciorek, Perez-Jones, Westra and Sammons2021b). Despite these vegetative defects, the G73N mutation was associated with higher reproductive allocation, an earlier yet extended flowering window, reduced stigma-anther distance potentially aiding in self-pollination and reproductive assurance, and winged seeds that could facilitate long-distance dispersal (Wu et al. Reference Wu, Paciorek, Liu, LeClere, Perez-Jones, Westra and Sammons2021a). It is yet unclear whether these fitness penalties and resulting compensatory evolution of traits aiding in reproductive assurance are associated with other mechanisms that confer synthetic auxin resistance in kochia.
Management Implications
Kochia populations resistant to dicamba and/or fluroxypyr limit the herbicide options available for kochia control in several crops and cropping systems, including small-grain cereals, chemical fallow, and new stacked trait dicamba-resistant crops such as corn, soybean, or cotton (Beckie et al. Reference Beckie, Hall, Shirrif, Martin and Leeson2019; Torbiak et al. Reference Torbiak, Blackshaw, Brandt, Hall, Hamman and Geddes2021a, Reference Torbiak, Blackshaw, Brandt, Hamman and Geddes2021b; Yadav et al. Reference Yadav, Kumar and Jha2020). The current study—together with a recent survey (Beckie et al. Reference Beckie, Hall, Shirrif, Martin and Leeson2019)—suggests that synthetic auxin resistance in kochia is spreading more quickly in Canada than in the United States where it has been present at low frequency since the early 1990s (Kumar et al. Reference Kumar, Jha, Jugulam, Yadav and Stahlman2019b). Kochia populations in Canada can exhibit multiple different patterns of resistance to synthetic auxin herbicides. Two of the kochia populations in the current study exhibited very high fluroxypyr resistance beyond that reported previously. Farmers are advised to adopt proactive nonchemical weed control methods to help maintain efficacy of the remaining herbicide options for kochia control. Spot tillage, competitive crops, cover crops, and implementing diverse crop rotations could be among the most important nonchemical tools for kochia management (Kumar et al. Reference Kumar, Jha, Jugulam, Yadav and Stahlman2019b; Mosqueda et al. Reference Mosqueda, Lim, Sbatella, Jha, Lawrence and Kniss2020). Implementation of weed management targeting the critical period for weed seed control (Geddes and Davis Reference Geddes and Davis2021), in combination with harvest weed seed control methods (Tidemann et al. Reference Tidemann, Hall, Harker and Beckie2017) and postharvest management (Kumar and Jha Reference Kumar and Jha2015), could help limit seed return to the soil seedbank, thereby exploiting the short seed longevity of this species (Beckie et al. Reference Beckie, Blackshaw, Leeson, Stahlman, Gaines and Johnson2018; Dille et al. Reference Dille, Stahlman, Du, Geier, Riffel, Currie, Wilson, Sbatella, Westra, Kniss, Moechnig and Cole2017). However, efforts to deplete kochia seedbanks will be effective only if reinfestation is prevented, which suggests an important role for community-based weed control programs aimed at mitigating transportation of this tumbleweed among farms and fields.
Acknowledgments
This research was supported by the Saskatchewan Ministry of Agriculture – Agriculture Development Fund project #ADF20200318, Alberta Wheat Commission, Bayer CropScience Canada, BASF Canada, Corteva Agriscience, FMC of Canada, Nufarm Canada, Manitoba Crop Alliance, Saskatchewan Barley Development Commission, Saskatchewan Pulse Growers, and Saskatchewan Wheat Development Commission. No conflicts of interest have been declared.
Supplementary material
To view supplementary material for this article, please visit https://doi.org/10.1017/wet.2021.69


 Open access