

Obesity and type 2 diabetes (T2DM) have been associated with increased circulating concentrations of acylcarnitines( Reference Schooneman, Vaz and Houten 1 ) and branched chain amino acids (BCAA) (isoleucine, leucine, and valine) in single time point studies( Reference Newgard, An and Bain 2 ). Investigating 24 h daily rhythms (peak time and amplitude) of these metabolites in obesity and T2DM would help direct future study into any circadian clock-related mechanisms behind these changes.
The hypothesis that weight and/or T2DM affect the concentration and rhythmicity of acylcarnitines and BCAA across a 24 h day was tested.
In a controlled laboratory study, hourly milkshakes (06:30–21:30 h) were given to 8 lean (L), 10 overweight (OW) and 7 OW with T2DM men, aged 45–65 years, lying semi-recumbent and awake between 06:30–22:30 h (light period) and asleep between 22:30–06:30 h (dark period). Plasma samples (2 h across 24 h) were analysed using quantitative targeted LC/MS metabolomics (Biocrates, Austria).
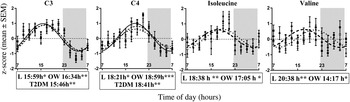
Two-way ANOVA identified significant group differences with increased 24 h concentrations in propionylcarnitine (C3) (L vs OW and L vs T2DM, p < 0·001), butyrylcarnitine (C4) (L vs OW and L vs T2DM, p < 0·001) and valerylcarnitine (C5) (L vs OW, p < 0·001) in OW and T2DM compared to the L group. C3 and C4 displayed significant 24 h rhythms in all groups (Fig. 1). C5 lost its rhythm in OW and T2DM. Weight and T2DM increased the 24 h concentrations of isoleucine (L vs OW, p = 0·009; L vs T2DM, p < 0·001), leucine (L vs OW, p = 0·035; L vs T2DM, p = 0·010) and valine (L vs T2DM, p < 0·001) in the OW and T2DM groups compared to the L group. Isoleucine and valine displayed significant daily rhythms in the L and OW groups only (Fig. 1), with no significant daily rhythm for leucine in any group.
24 h rhythms of propionylcarnitine (C3), butyrylcarnitine (C4), valine and isoleucine. Where a significant daily cosine rhythm was expressed (* p < 0.05, **p < 0.01, ***p < 0.005), the peak time is shown below each graph. The L group is represented by a dotted line; OW a dashed line, and T2DM a solid line.
The increased concentrations of the short-chain acylcarnitines, C3, C4 and C5, and BCAA in obesity and T2DM support previous studies. C3 and C4 retained their 24 h rhythm in all groups although C5 rhythmicity was lost in OW and T2DM. Isoleucine and valine lost rhythmicity in T2DM. Our findings likely reflect disruption of normal energy metabolism in OW and/or T2DM. The rhythms observed may result from the complex interaction between metabolism in the fed and fasting state and/or circadian timing.
This work was funded by Diabetes-UK (grant 08/0003607), EU FP7-HEALTH-2011 EuRhythDia (grant 278397), BBSRC (grant BB/I019405/1 and grant BB/D526853/1) and Stockgrand Ltd.

