

In older adults, undernutrition or protein–energy malnutrition is a commonly reported and worldwide health problem( Reference Chen, Schilling and Lyder 1 ), but there is considerable variety in the reported prevalence rates due to different assessment methods( Reference Meijers, van Bokhorst-de van der Schueren and Schols 2 , Reference Phillips, Foley and Barnard 3 ). When based on low mid-upper arm circumference (MUAC<25 cm) and/or unintentional weight loss of ≥4 kg in 6 months, the prevalence of undernutrition in community-dwelling older adults is estimated to be between 11 and 35 %( Reference Wijnhoven, Schilp and van Bokhorst-de van der Schueren 4 ). The prevalence of (risk of) undernutrition, defined as poor appetite in the previous week in combination with difficulty climbing stairs, is estimated between 2 and 9 %( Reference Wijnhoven, Schilp and van Bokhorst-de van der Schueren 4 ). Due to the ageing population, increasing pressure on health-care systems initiates a shift in care from the institutional setting to the community. For this reason, prevention and treatment of undernutrition in community-dwelling older adults is essential.
In order to prevent and treat undernutrition in community-dwelling older adults, clear insight into the primary and secondary factors associated with undernutrition is needed. In previous studies undernutrition in older adults was associated with poor health outcomes including decreased functionality( Reference Lee, Kritchevsky and Tylavsky 5 , Reference Strobl, Muller and Emeny 6 ), reduced quality of life( Reference Vetta, Ronzoni and Taglieri 7 ) and higher mortality risk( Reference Atlantis, Browning and Kendig 8 ). Thus, undernutrition may affect older adults’ level of dependency and thereby the risk of early institutionalization( Reference Chen, Schilling and Lyder 1 , Reference Luppa, Luck and Weyerer 9 , Reference Gaugler, Duval and Anderson 10 ). A recent comprehensive systematic overview of twenty-eight observational studies on the determinants of undernutrition in community-dwelling older adults indicated that poor appetite, hospitalization, poor self-reported health, not being diabetic and being edentulous were important factors associated with undernutrition in community-dwelling older adults( Reference van der Pols-Vijlbrief, Wijnhoven and Schaap 11 ). However, despite the volume of research conducted on potential factors associated with undernutrition over the past decade, many studies had a small sample size or were of poor quality. Besides, very few studies examined a broad range of potential factors from different domains. Furthermore, potential other important factors such as falls and chronic obstructive pulmonary disease were not studied.
A study assessing a wide range of potential factors associated with undernutrition from different domains in community-dwelling older adults is currently lacking. The aim of the present cross-sectional study was to examine potential factors associated with (risk of) undernutrition in community-dwelling older adults in the Netherlands.
Methods
Study population
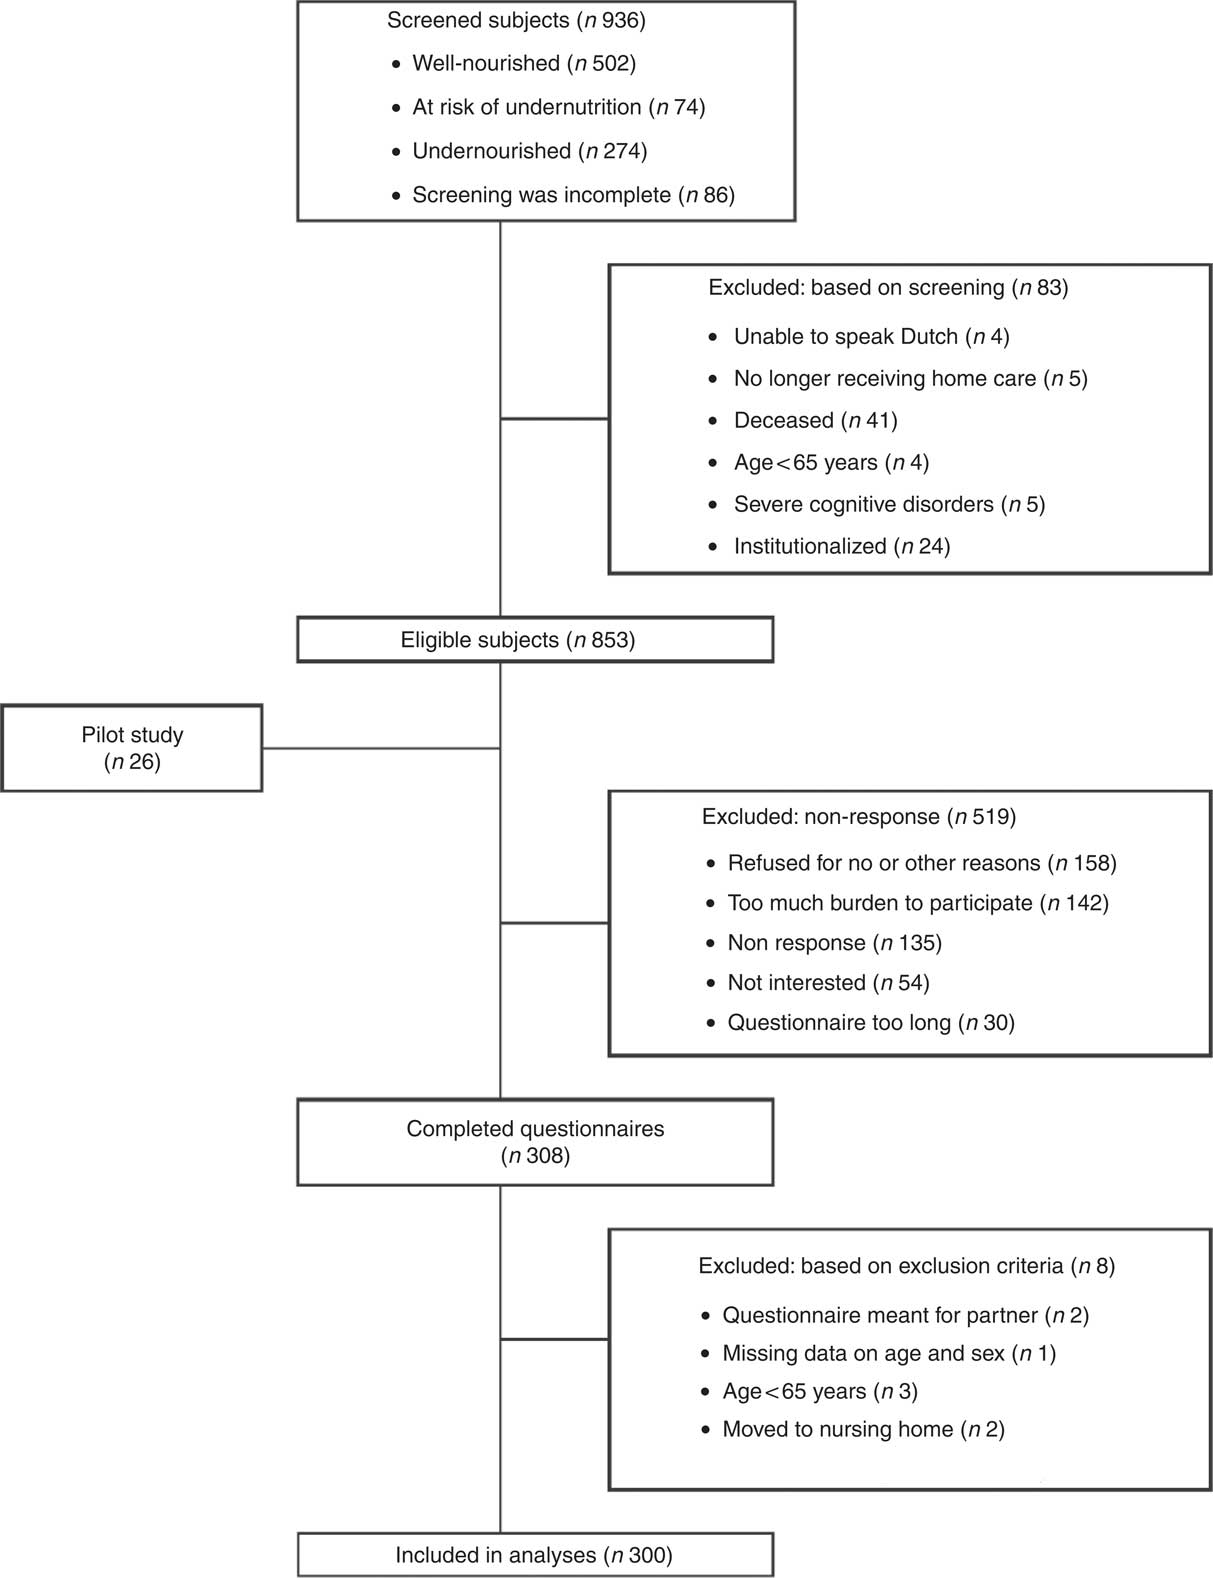
The nutritional status of 936 subjects was screened using the Short Nutritional Assessment Questionnaire (SNAQ65+) by nurses working in home care organizations in Amsterdam and dietitians of the Dutch Malnutrition Steering Group( Reference Wijnhoven, Schilp and van Bokhorst-de van der Schueren 4 ) in the Netherlands. All subjects received personal support by a home care nurse. Based on the SNAQ65+ screening 502 subjects were well-nourished, seventy-four were at risk for undernutrition and 274 were undernourished; for the remaining eighty-six subjects screening information was incomplete. In close collaboration with these home care organizations, the screened subjects were invited to complete a questionnaire, excluding those who were institutionalized (n 24), aged <65 years (n 4), had a severe cognitive disorder (n 5), were unable to speak Dutch (n 4), no longer received home care (n 5) and those who had died between screening and the sending of the questionnaire (n 41). The detailed questionnaire was developed and pilot-tested in twenty-six subjects, and after minor adaptation, sent to the 827 eligible subjects. If no response was received from a subject after two weeks, a reminder was sent by regular mail. A total of 519 subjects were unable or unwilling to participate for different reasons, and 308 were willing to participate and completed the questionnaire. Figure 1 shows the specific reasons for exclusion and non-response. Statistical analyses were conducted in 300 participants.
Flowchart of the screening, inclusion and response of participants
Procedures and questionnaire
A questionnaire consisting of fourteen topics was used to examine the potential factors associated with (risk of) undernutrition among community-dwelling older adults. Eight topics were captured using questionnaires validated in older adults. Factors of interest were selected a priori based on a framework of previous research (a literature review( Reference van der Pols-Vijlbrief, Wijnhoven and Schaap 11 ) and a qualitative study on the self-reported causes of undernutrition by community-dwelling older adults (R van der Pols-Vijlbrief, HAH Wijnhoven, M Visser et al., unpublished results)) and professional expertise. The questionnaire was pilot-tested giving consideration to the letter size and clarity of the questions. Completing the questionnaire took approximately 45 min and participants were allowed to receive help completing the questionnaire if needed. Three participants received help from one of the researchers. Finally, if the questionnaire was returned incomplete, follow-up telephone calls were made, when possible, to complete the missing information.
Undernutrition
The study outcome, (risk of) undernutrition, was determined with the SNAQ65+, a screening instrument consisting of four items: (i) unintentional weight loss of ≥4 kg in the past 6 months; (ii) MUAC<25 cm; (iii) loss of appetite in the past week; and (iv) inability to walk up and down stairs of fifteen steps without resting. The SNAQ65+ screening tool was developed and validated by Wijnhoven et al. in two large longitudinal studies( Reference Wijnhoven, Schilp and van Bokhorst-de van der Schueren 4 ). An advantage of the use of MUAC over BMI is the easy measurement in older adults using a simple tape, without the hinder of standing problems, fluid retention and heavy equipment. Moreover, low MUAC showed a stronger association with mortality risk than low BMI. The cut-off point to define thinness is based on the 5th percentile in a community-dwelling sample and is 25 cm for both men and women( Reference Wijnhoven, van Bokhorst-de van der Schueren and Heymans 12 ). Persons were classified as undernourished if they either experienced unintentional weight loss of ≥4 kg in the past 6 months or if their MUAC was <25 cm. A person was considered at risk of undernutrition if a poor appetite was experienced in the previous week in combination with difficulty climbing stairs. Finally, a person was considered well-nourished if none of the above was applicable.
Operationalization of (risk of) undernutrition
The SNAQ65+ questions from the questionnaire and the MUAC measurement from the SNAQ65+ screening (performed by the home care nurse) were used (n 287). If the MUAC measurement from the initial SNAQ65+ screening was missing, the self-reported MUAC from the questionnaire was used (n 5). This MUAC was self-assessed using a measurement tape provided with the questionnaire. A specific colour indicated whether the MUAC was <25 cm. For three participants who received assistance completing the questionnaire, the MUAC measurement was performed by a researcher. For five participants all information on MUAC was missing.
Factors associated with undernutrition
Potential factors were categorized into the following domains: demographic, social, financial, lifestyle, disease and care, psychological, physical function, food intake and appetite, and oral function. Factors in the anthropometric domain included MUAC and BMI, the latter calculated from self-reported height and body weight (kg/m2). MUAC was used as part of the outcome measure and BMI was used only for descriptive purposes.
Demographic domain
The demographic domain included sex (male/female), age (years) and level of education. Level of education was categorized as low (no education, elementary school, primary vocational education, general secondary education), medium (secondary vocational education, general higher education) or high (higher vocational education, academic education) according to the Dutch classification of education of the Central Bureau for Statistics( 13 ).
Social domain
Participants’ marital status was assessed (married, unmarried, divorced or widowed) and categorized into widowed (yes/no). The living situation was categorized as either living alone or with someone else. Eating alone most of the time was classified by eating alone on four or more days per week. The six-item validated Lubben Social Network Scale (LSNS-6) was used to determine the quantity of the social network. Participants were classified as having either a small social network (score <12) or a normal to large social network (score ≥12)( Reference Lubben, Blozik and Gillmann 14 ). Additionally, social support in healthy eating (yes/no) was assessed by a single item( 15 ).
Financial domain
Net monthly household income was divided into three categories, low (<€975), medium (between €975 and €1386) and high (≥€1386). The lowest category represents income below the social welfare level, the medium category represents income between the social welfare level and the median income level, and the highest category represents income above the moderate level of income of older adults in the Netherlands in 2015( 16 ). Furthermore, the financial ability to buy food was assessed by using a single item of the Determine Your Nutritional Health Checklist (NSI Checklist)( Reference Barrocas, Bistrian and Blackburn 17 , Reference White, Dwyer and Posner 18 ).
Lifestyle domain
Smoking status was categorized as current, former (stopped smoking in the past 15 years)( Reference van Domburg, Meeter and van Berkel 19 , Reference Kawachi, Colditz and Stampfer 20 ) and non-smokers (those who never smoked and smokers who stopped smoking more than 15 years ago). Alcohol use was examined based on the number of days per week that alcohol was consumed and the number of consumed glasses per day, and classified according to the principles of Garretsen: light, moderate, excessive or very excessive alcohol use( Reference Garretsen 21 ). Physical activity was examined by the self-reported number of days per week that moderate physical activity was performed for more than 30 min and dichotomized according to the Dutch guidelines for healthy physical activity (NNGB) for older adults (<5 d/week and ≥5 d/week)( Reference Kemper, Ooijendijk and Stiggelbout 22 ).
Disease and care domain
The self-reported number of chronic diseases identified by a general practitioner or physician was categorized as either fewer than two chronic diseases or two or more chronic diseases (multi-morbidity)( Reference Hoeymans, Schellevis and Oostrom 23 ). The number of medications prescribed by a doctor was categorized as using either five or more (polypharmacy) or fewer than five medications( Reference Fried, O’Leary and Towle 24 , Reference Lemmens and Weda 25 ). Hospital admission in the past 6 months was dichotomized (yes/no). Overall self-reported health was assessed on a scale from 1 to 5. This was dichotomized into either poor (<3) or normal to good health (≥3). The presence of several health complaints (yes/no) in the past month was determined: nausea, intestinal problems and fatigue. Pain was determined by six items (pain while sitting, standing, changing position and walking, constant pain and pain intensity) from the Nottingham Health Profile’s questionnaire (NHP)( Reference Hunt, McEwen and McKenna 26 ). Pain was present when at least one of the above-mentioned items was scored as yes( Reference Heim, Snijder and Deeg 27 ).
Psychological domain
Cognitive decline was assessed using the Informant Questionnaire on Cognitive Decline in the Elderly (IQCODE)( Reference Jorm 28 ). This sixteen-item questionnaire compares aspects of the cognitive function to 10 years earlier. The score summation was divided by 16, with a score higher than 3·3 indicating cognitive decline( Reference Quinn, Fearon and Noel-Storr 29 ). The presence of depressive symptoms was assessed with the validated ten-item Center for Epidemiologic Studies Depression scale (CES-D-10). A score of 10 or higher was used as the clinical cut-off for depressive symptoms( Reference Andresen, Malmgren and Carter 30 ).
Physical functioning domain
The level of dependency in activities of daily living (ADL) was assessed using the Barthel index( Reference Mahoney and Barthel 31 ). This validated questionnaire consists of ten items on different ADL: feeding, moving from the wheelchair to bed and returning, performing personal hygiene, getting on and off the toilet, bathing, walking on a level surface/propelling a wheelchair, ascending and descending stairs, dressing and undressing, continence of bowels and bladder control. The sum of scores ranges from 0 to 20, with a higher score indicating a higher level of independence( Reference Mahoney and Barthel 31 ). To determine difficulties in aspects of instrumental ADL, participants were asked whether they needed assistance during several activities including taking care of the household (yes/no), buying groceries (yes/no) and preparing meals (yes/no).
Mobility was assessed using a single item from the Mini Nutritional Assessment (MNA) tool, which asked participants whether they were bound to the bed or chair and/or whether they were able to move around the house but unable to go outside independently (or were able to go outside independently)( Reference Guigoz, Lauque and Vellas 32 ). Difficulty climbing stairs was assessed using the SNAQ65+ item (yes/no). The ability to walk 100 m with or without an assisting tool was also assessed (yes/no). Furthermore, the number of falls in the past 6 months was assessed (any fall incident/no fall incident).
The questions used to assess visual function and hearing ability originate from the Organisation for Economic Co-operation and Development’s long-term disability indicator( Reference McWhinnie 33 – Reference Schilp, Wijnhoven and Deeg 35 ). Visual function was assessed by two questions: if a person could read the newspaper and was able to recognize a person’s face from a distance of 4 m. If both of these items were answered with ‘yes, without difficulty’, this was considered good visual function. All other combinations were considered as limited visual functioning. Two similar items were used to identify problems in hearing during a conversation in a group and with one individual, with or without a hearing aid. The classifications made were similar to those of visual function.
Food and appetite domain
Appetite was assessed using the Simplified Nutritional Appetite Questionnaire (SNAQapp). This validated questionnaire consists of four items concerning appetite. The total score ranges from 4 to 20, with a higher score indicating a better appetite( Reference Wilson, Thomas and Rubenstein 36 ). Furthermore, loss of taste and smell was determined by the question asking whether participants experienced a decline in smell or taste in the past 10 years (yes/no). Accessibility to food was assessed by asking if there were days when they did not have enough food due to a lack of time, difficulty getting groceries, a specific diet, a cooking inability or a dysfunctional stove (yes/no); or they could answer that ‘another reason’ caused inaccessibility to food. The number of snacks consumed per day was classified as fewer than three snacks daily (v. three or more daily). Finally, a question was posed if participants were occasionally skipping meals (yes/no).
Oral functioning domain
Self-reported oral health was determined on a scale ranging from 1 to 5 and was classified into either poor/moderate (≤3) or good oral health (>3). Oral problems were assessed, including teeth or gum problems, denture problems, dry mouth, biting or chewing difficulties, and swallowing problems (yes, any problem v. no problems). Chewing surface was examined based on four items assessing the number of natural teeth in the upper and lower jaw and partial or complete dentures in the upper and lower jaw. This was dichotomized as having a full chewing surface or having no or partial chewing surface. In addition, participants were asked whether or not they used dentures and if they experienced problems regarding their food intake as a result of denture problems.
Data analyses
Characteristics of both undernourished participants and participants at risk of undernutrition were compared with those of the well-nourished group by using post hoc analyses (independent Bonferroni α test) for continuous variables and Fisher’s exact test (two-sided) for dichotomous variables.
Missing items were imputed by performing multiple imputations( Reference Eekhout, de Vet and Twisk 37 ). Patterns in missing items were analysed to check whether data were missing completely at random. This was verified by the Expectation–Maximization algorithm test (P=0·396). In total, 0·11 % of the values were missing in 7·33 % of the participants in 17·8 % of the variables used for analyses. Five data sets with five iterations were created. Multiple imputation by chained equations was used to impute the single items. Variables included in the imputation model were those with one or more missing values or those that were related to a variable with missing values: MUAC, body weight, education, income, social support in healthy eating, number of medications, limitation in hearing, and all single items of the CES-D-10, LNSN-6 and Barthel index. For statistical analyses, the pooled variable was used. The significance was calculated based on the median of P values, since research suggests that the median is more reliable than the mean of P values (I Eekhout, unpublished results).
Univariable logistic regression analyses were performed to investigate the association between all potential factors associated with (risk of) undernutrition, with the well-nourished group as reference. The five most frequently reported chronic diseases – osteoarthritis, osteoporosis, heart failure, diabetes mellitus and rheumatoid arthritis – were tested in univariable analyses. Furthermore, chronic obstructive pulmonary disease( Reference Itoh, Tsuji and Nemoto 38 ), cancer( Reference Hebuterne, Lemarie and Michallet 39 ) and kidney failure( Reference Ikizler, Cano and Franch 40 ) were included in univariable analyses since previous research presented these as risk factors for undernutrition.
Potential effect modification by sex and age was tested and if present, analyses were stratified by age (<83 years and ≥83 years based on median age) or sex. Additionally, linearity was checked for all continuous variables and multicollinearity was assessed using the variance inflation factor for all variables associated (P<0·10) with the outcome in univariable analyses, and Cohen’s κ was used for correlation of dichotomous variables. A variance inflation factor >10 or a Cohen’s κ>60 % was considered a high correlation, and the variable with the lowest P value in the univariable analysis was subsequently used in multivariable analyses.
For multivariable regression analyses, the stepwise forward selection procedure was used and factors with P value<0·10 in univariable analyses were included. In every step the determinant with the strongest association, meaning the lowest P value, was added to the model for the next step, until none of the variables had a P value<0·10( Reference Twisk 41 ). The quality of the final models was tested by performing the Hosmer and Lemeshow test. Results were presented as odds ratios with 95 % confidence intervals, a P value of <0·05 was considered statistically significant. Sensitivity analyses in complete cases were done for testing whether the imputation had affected the conclusions. For all statistical analysis, the statistical software package IBM SPSS Statistics Version 21 was used.
Results
The characteristics of the study sample are presented in Table 1. According to the SNAQ65+ screening the original group (n 936) and the sub-sample (n 300) were comparable based on nutritional status (percentage undernourished and risk group). All 300 included participants received support in personal care (100·0 %), additional support was needed in the household (67·7 %), with groceries (61·3 %) and in preparing meals (35·7 %). Their average age was 81·7 (sd 7·6) years, 68·3 % were female, 72·7 % were living alone, and their mean BMI was 25·8 (sd 5·2) kg/m2. Ninety-two participants were undernourished, twenty-four were at risk of undernutrition and 184 were well-nourished. There were more current or former smokers in the risk group (41·7 %) and the undernourished group (35·1 %) compared with the well-nourished group (17·4 %). As expected, in the well-nourished group BMI and MUAC were higher compared with the risk group and the undernourished group. Within the undernourished group, fifty-one participants were undernourished based on weight loss, thirty-one based on low MUAC and ten based on both criteria.
Characteristics of the study population of community-dwelling older adults (≥65 years) receiving home care in the Netherlands, classified according to nutritional status
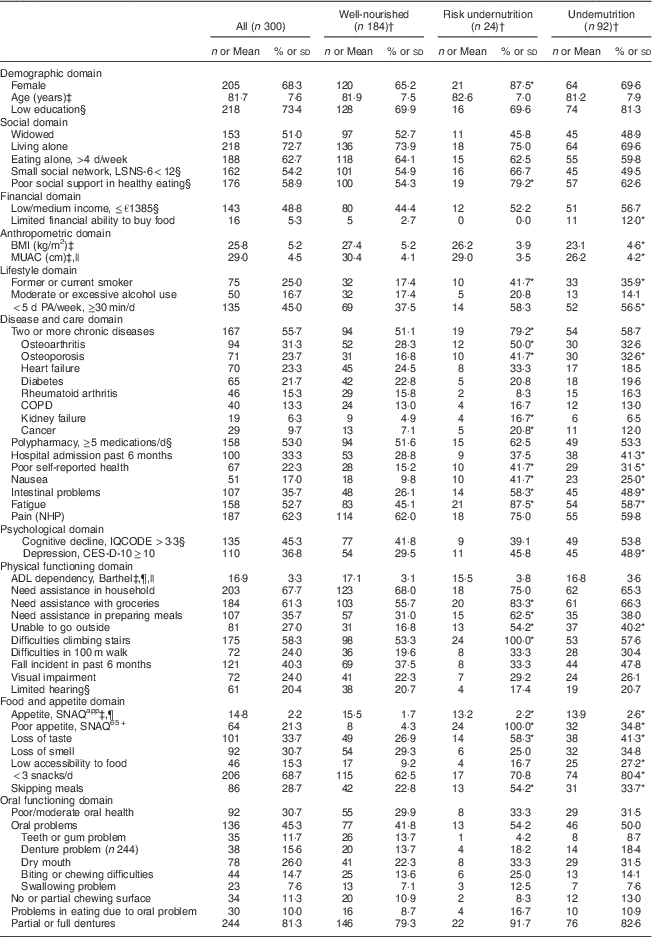
LSNS-6, six-item Lubben Social Network Scale; MUAC, mid-upper arm circumference; PA, physical activity; COPD, chronic obstructive pulmonary disease; NHP, Nottingham Hamilton Profile; IQCODE, Informant Questionnaire on Cognitive Decline in the Elderly; CES-D-10, ten-item Center for Epidemiologic Studies Depression scale; ADL, activities of daily living; SNAQapp, Simplified Nutritional Appetite Questionnaire; SNAQ65+, Short Nutritional Assessment Questionnaire.
Original data are presented; values are number and percentage per group for categorical variables.
* Statistically significant difference from no undernutrition (P<0·05). P value is derived from post hoc analyses (independent Bonferroni α test) for continuous variables, Pearson’s χ 2 test (two-sided) for categorical variables and Fisher’s exact test (two-sided) for dichotomous variables.
† Classification based on the SNAQ65+.
‡ Values are mean and standard deviation for continuous variables.
§ Missing values in categorical variables: limited hearing, n 1 in risk group; social network, n 1 in undernourished group; social support, n 1 in undernourished group; cognitive decline, n 1 in undernourished and n 1 in risk group; depression, n 1 in well-nourished group; income, n 4 in well-nourished, n 1 in risk and n 2 in undernourished group; medication, n 2 in well-nourished group; education, n 1 in well-nourished, n 1 in risk and n 1 in undernourished group.
|| Data available for MUAC: total, n 247; well-nourished, n 153; risk group, n 20; undernourished, n 74. Data available for BMI: total, n 293; well-nourished, n 180; risk group, n 23; undernourished, n 90. Data available for ADL: total, n 298; n 1 missing in risk and undernourished group.
¶ SNAQapp values range from 4 to 20, with higher numbers representing a better appetite; Barthel score ranges from 0 to 20 with higher numbers representing a higher degree of independency in ADL.
Univariable analyses
Univariable analyses showed that twenty-seven factors were associated with (risk of) undernutrition (P<0·10) wherefrom nineteen variables were significantly associated (P<0·05; Table 2). Effect modification was tested and found for some factors (e.g. living alone, need assistance with groceries or preparing meals and visual impairment). However, as stratification resulted in small subgroups and large confidence intervals due to low statistical power, no stratification was performed in univariate and multivariable analyses.
Univariable associations of factors were associated with (risk of) undernutrition among community-dwelling older adults (≥65 years) receiving home care in the Netherlands
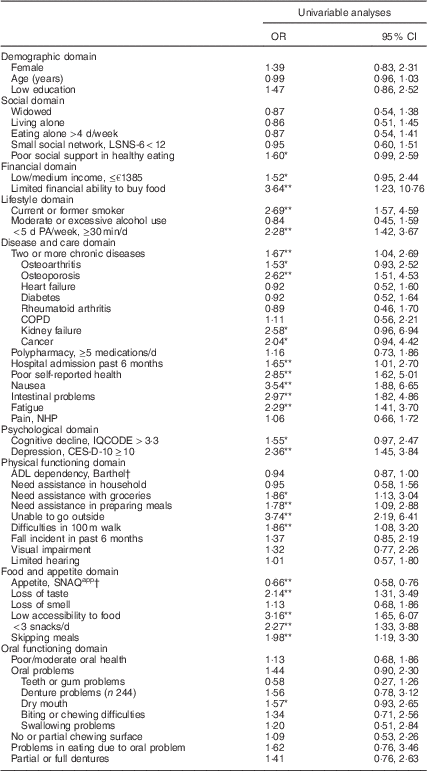
LSNS-6, six-item Lubben Social Network Scale; PA, physical activity; COPD, chronic obstructive pulmonary disease; NHP, Nottingham Hamilton Profile; IQCODE, Informant Questionnaire on Cognitive Decline in the Elderly; CES-D-10, ten-item Center for Epidemiologic Studies Depression scale; ADL, activities of daily living; SNAQapp, Simplified Nutritional Appetite Questionnaire.
Imputed data are presented; values are odds ratios and 95 % confidence intervals for undernutrition (n 94) and risk of undernutrition (n 24) v. no undernutrition (n 182).
* Statistically significant different from well-nourished (P<0·10).
** Statistically significant different from well-nourished (P<0·05).
† SNAQapp values range from 4 to 20, with higher numbers representing a better appetite; Barthel score ranges from 0 to 20 with higher numbers representing a higher degree of independency in ADL.
Multivariable analyses
No multicollinearity was found (highest Cohen’s κ=0·51 and highest variance inflation factor=2·08) and therefore all factors with a P value<0·10 in univariable analyses were included in the first step of the forward stepwise procedure. Table 3 presents the final multivariable model of the stepwise forward selection procedure for factors associated with (risk of) undernutrition. Factors that were statistically significantly (P<0·05) and positively associated with (risk of) undernutrition included: being unable to go outside, having intestinal problems, smoking, having osteoporosis, eating fewer than three snacks daily, being ADL dependent, being physically inactive, nausea and cancer. Depression symptoms were found to be borderline significantly associated with (risk of) undernutrition (P=0·053). In sensitivity analyses using the original data set including complete cases only, no other or different factors were found as compared with the imputed analyses.
Stepwise multivariable model showing factors associated with (risk of) undernutrition in community-dwelling older adults (≥65 years; n 300) receiving home care in the Netherlands
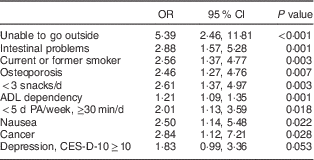
PA, physical activity; ADL, activities of daily living; CES-D-10, ten-item Center for Epidemiologic Studies Depression scale.
Imputed data are presented. Multivariable model based on forward prediction model (Hosmer and Lemeshow test P=0·919). Values are odds ratios and 95 % confidence intervals.
Discussion
The purpose of the present cross-sectional study was to examine potential factors associated with undernutrition from multiple domains in community-dwelling older adults. Several factors from different domains were found to be statistically significantly associated with (risk of) undernutrition: being unable to go outside, having intestinal problems, smoking, having osteoporosis, eating fewer than three snacks daily, being ADL dependent, being physically inactive, nausea, cancer and depressive symptoms (borderline significant).
In the present study, poor appetite (based on the SNAQapp) was univariately associated with (risk of) undernutrition, but was not be included in the multivariate model as a poor appetite (SNAQ65+) was part of the dependent variable (risk of) undernutrition. Previous research showed that poor appetite is an independent determinant of undernutrition defined as low BMI, MUAC or unintentional weight loss in community-dwelling older adults( Reference van der Pols-Vijlbrief, Wijnhoven and Schaap 11 , Reference Schilp, Wijnhoven and Deeg 35 ). A poor appetite is found to be associated with lower nutritional intake( Reference Payette, Gray-Donald and Cyr 42 ) and thereby increases the risk of undernutrition( Reference Margetts, Thompson and Elia 43 ). Smoking was associated with (risk of) undernutrition and with being at risk of undernutrition. A possible explanation for this association is that smoking is known to reduce taste perception and appetite( Reference Cochrane and Afolabi 44 , Reference Vennemann, Hummel and Berger 45 ). Moreover, smoking may increase the feeling of fullness when consuming a hot evening meal, thereby lowering energy intake( Reference Gregersen, Moller and Raben 46 ). In addition, smoking is known to increase resting energy expenditure, which could lead to higher energy needs( Reference Blauw, Boon and Rosendaal 47 ). Depressive symptoms were borderline significantly associated with undernutrition in multivariable analyses. Depression is shown to be associated with a poor appetite( Reference Engel, Siewerdt and Jackson 48 ). This may explain the observed link between depression and undernutrition.
Similar to other studies( Reference Meijers, Schols and van Bokhorst-de van der Schueren 49 , Reference Sheard, Ash and Mellick 50 ), intestinal problems (such as diarrhoea and constipation) were associated with undernutrition in the current study. Diarrhoea may cause excessive losses (malabsorption) thereby increasing energy requirements, and constipation may increase feeling of fullness and reduce appetite( Reference Soenen and Chapman 51 ). Osteoporosis was associated with undernutrition and an explanation for this could be that participants with osteoporosis had a less adequate daily nutritional intake. Low protein intake and low calcium intake are associated with an increase in bone loss( Reference Caroli, Poli and Ricotta 52 ), and furthermore low BMI is shown to be a risk factor for osteoporosis and fractures( Reference Czerwinski, Badurski and Marcinowska-Suchowierska 53 ). Osteoporosis may thus be a consequence rather than a cause of (risk of) undernutrition. However, due to the observational design no causality statements can be made. Consumption of fewer than three snacks daily was associated with (risk of) undernutrition, which may be explained by a decrease in energy intake resulting in weight loss. Nausea and cancer were associated with (risk of) undernutrition. It is generally known that gastrointestinal symptoms such as nausea and vomiting are associated with unintentional weight loss especially among cancer patients receiving cancer treatment strategies( Reference Sanchez-Lara, Ugalde-Morales and Motola-Kuba 54 ). Besides, cancer patients suffer from unintentional weight loss because of indirect tumour effects, treatment side-effects and psychological factors. Metabolic changes such as mechanical obstruction or systemic effects caused by tumour cells (glucose intolerance, fat depletion, protein turnover) may induce loss of appetite or increase energy expenditure( Reference Barrera 55 ).
Dependency in ADL, inability to go outside and physical inactivity were all associated with poor nutritional status in the multivariate model. It is possible that these factors result in difficulty purchasing food and groceries and difficulties preparing meals, which in turn could result in inadequate energy intake leading to undernutrition. Inability to go outside and, univariately associated, limited financial ability to buy food and low accessibility to food are all components of food insecurity that is shown to be associated with undernutrition among older adults( Reference Lee and Frongillo 56 – Reference Quine and Morrell 58 ). However, we cannot exclude that the association is reverse; a decreased functionality might be a consequence of undernutrition (e.g. unintentional weight loss)( Reference Lee, Kritchevsky and Tylavsky 5 , Reference Ritchie, Locher and Roth 59 ) and low dietary intake( Reference Milaneschi, Tanaka and Ferrucci 60 ) in the older adults.
In contrast to some other studies( Reference Margetts, Thompson and Elia 43 , Reference Feldblum, German and Castel 61 , Reference Johansson, Bachrach-Lindstrom and Carstensen 62 ), low self-reported health was not associated with undernutrition in the multivariate model. A possible explanation for this is that in those studies undernutrition was defined using the MNA( Reference Feldblum, German and Castel 61 – Reference Han, Li and Zheng 63 ), a tool which includes information on health status. Therefore, it is to be expected that health status is associated with the MNA score. In the present study, health status was not included in the nutritional assessment tool (SNAQ65+). In the current study, no factors from the social and oral function domain were found to be associated with (risk of) undernutrition. It is possible that some of the social or oral factors are sex- or age-related, since our stratified univariable analyses showed a statistically significant association of living and eating alone and undernutrition in female participants (OR=2·33 and OR=1·75) but not in male participants (OR=0·20 and OR=0·16). Oral factors, such as swallowing problems, showed non-significant positive and negative effect sizes (OR for male=3·13, OR for female=0·53) and for chewing difficulty the effect size was higher for younger compared with older participants (OR for age <83 years=4·48, OR for age ≥83 years=1·27). However, since stratification resulted in large confidence intervals due to the small sample size, these results should be interpreted with caution (results not shown).
The present study has several strengths, limitations and methodological issues. The extensive assessment of a broad range of factors related to undernutrition from several domains is a unique point and a major strength of the study. The domains were all assessed using short questionnaire versions validated in a large and often frail older population. Statistical analyses were exhaustive and included a multivariable model of acceptable quality (Hosmer and Lemeshow test: P=0·919). Besides, handling of missing data was done by multiple imputations using the state-of-the-art multiple imputation by chained equations method. Multiple imputation is found to be more accurate than mean item imputation and complete case analyses( Reference Eekhout, de Boer and Twisk 64 ). Further, single items were imputed instead of the overall score of questionnaires( Reference Eekhout, de Vet and Twisk 37 ).
The following limitations need to be discussed. The potential factors revealed in the present study are related to protein–energy malnutrition specifically and other factors associated with specific nutrient deficiencies were not identified. All included older adults who lived at home and received home care. They are likely more disabled and/or frail compared with community-dwelling older adults in general. Since the questionnaire was self-administered, older adults unable to write or read, or older adults with severe cognitive decline might be under-represented. Support from a family member or caregiver in completing the questionnaire was suggested in the information letter. Besides, three older adults completed the questionnaire with support of the researcher. Some (i.e. physical- and frailty-related) factors associated with (risk of) undernutrition could be more common in this group than in general community-dwelling older adults. Although the sub-sample of older adults used in the analyses was comparable to the initial screened group of older adults based on nutritional status, the sub-sample might differ on other underlying factors. Therefore, the results of the study should be generalized to the general older population with caution.
Another possible limitation is that a screening tool was used to define undernutrition risk based upon functional limitations and poor appetite. This screening tool has already been applied in the home care organization in the Netherlands and validated against mortality in two longitudinal cohorts. There is no agreement or gold standard on how to assess (risk of) undernutrition, so the definition of undernutrition should be kept in mind when interpreting the results( Reference Wijnhoven, Schilp and van Bokhorst-de van der Schueren 4 ). For some participants, the time between the measurement of MUAC and completing the questionnaire was up to 18 months. It is therefore possible that the used MUAC was not representative of the actual MUAC at the time of completing the questionnaire. Additionally, due to a rather small sample size no stratification could be performed and it is possible that sex and age differences exist in the association with undernutrition. In further research with a larger sample size, potential effect modification by sex and age should be examined. Due to the observational nature of the study design it was not possible to make any statements about the causality of the factors associated with undernutrition. Intervention studies targeting associated factors in order to reduce undernutrition are necessary to obtain information on causality.
Conclusion
In conclusion, the present study underlines the hypothesis that the aetiology of undernutrition is multifactorial involving many different domains. Some associated factors, such as the number of daily snacks, dependency in ADL, physically inactivity or intestinal problems, are potentially modifiable and provide suggestions for preventive measures. Several non-modifiable associated factors such as cancer and osteoporosis show that increased awareness is needed in primary and secondary care to prevent or diminish undernutrition in old age.
Acknowledgements
Acknowledgements: The authors would like to thank Margot de Roon, Hetty Geerars and all trainees for their assistance conducting the study. Furthermore they would like to thank the participants for giving their time to fill in the questionnaires. Financial support: This research has been executed in the Lifestyle, Overweight and Diabetes research programme of the EMGO Institute for Health and Care Research. The study was funded by the Netherlands Organization for Health Research and Development (ZonMw; project number 200320004). ZonMw had no role in the design, analysis or writing of this article. Conflict of interest: None declared. Authorship: R.v.d.P.-V contributed to the formulation of the research question(s), designing and conducting the study, analysing the data and writing the article. H.A.H.W. contributed to the formulation of the research question(s), designing the study and writing the article. H.M. contributed to analysing the data and writing the article. M.V. contributed to the formulation of the research question(s), designing the study and writing the article. Ethics of human subject participation: This cross-sectional questionnaire study was approved by the Medical Ethical Committee of the VUMC in Amsterdam.


