


Introduction
Cryoconites are mini-entombed ecosystems existing on the surface of glaciers worldwide, composed of mineral sediments, biota and organic material (e.g. Reference Wharton, Vinyard, Parker, Simmons and SeaburgWharton and others, 1981, Reference Wharton, McKay, Simmons and Parker1985; Reference Takeuchi, Kohshima, Yoshimura, Seko and FujitaTakeuchi and others, 2000; Reference Fountain, Tranter, Nylen, Lewis and MuellerFountain and others, 2004; Reference Foreman, Sattler, Mikucki, Porazinska and PriscuForeman and others, 2007; Reference Bøggild, Brandt, Brown and WarrenBøggild and others, 2010). The Swedish explorer N. Nordenskjold coined the term ‘cryoconite’ on returning from his 1870 Greenland expedition, from the combination of the Greek words ‘kryos’ meaning cold and ‘konis’ meaning dust. Cryoconite is distinct from other forms of glacier cover (e.g. moraine and loess) in that it contains a variable percentage of organic components that are specific to the location and altitude and can be of extraglacial or englacial origin. Extraglacial cryoconite can originate from rockfall onto the ice surface (Reference Reznichenko, Davies, Shulmeister and McSaveneyReznichenko and others, 2010) or from transport driven by circulation systems (e.g. Reference Bøggild, Brandt, Brown and WarrenBøggild and others, 2010). Cryo-conite of englacial origin comes from the release of debris trapped within glaciers as melting occurs, and may also consist of debris that was originally sourced subglacially or extraglacially (Reference Nansen and HerzfeldNansen and H., 1891; Reference OdellOdell, 1925; Reference Reznichenko, Davies, Shulmeister and McSaveneyRezni-chenko and others, 2010; Reference Wientjes, Van de Wal, Reichart, Sluijs and OerlemansWientjes and others, 2011). There are also reports of Arctic cryoconite containing soot from forest fires (Reference Kim, Hatsushika, Muskett and YamazakiKim and others, 2005), cosmic debris (Reference Pillinger, Kroto, Haddon, Iijima and LeachPillinger and others, 1993; Reference Kurat, Koeberl, Presper, Brandstatter and MauretteKurat and others, 1994) and anthropogenic particulates (Reference Pfirman, Eicken, Bauch and WeeksPfirman and others, 1995; Reference Meese, Reimnitz, Tucker, Gow, Bischof and DarbyMeese and others, 1997; Reference Bossew, Lettner and HubmerBossew and others, 2006, Reference Bossew, Lettner, Hubmer, Erlinger and Gastberger2007; Reference Tieber, Lettner, Bossew, Hubmer, Sattler and HofmannTieber and others, 2009).
Cryoconites have been shown to contain viral-like particles, bacteria, nanoflagellates, ciliates (Reference Sawstrom, Mumford, Marshall, Hodson and Laybourn-ParrySawstrom and others, 2002; Reference Christner, Kvito and ReeveChristner and others, 2003; Reference Anesio, Mindl, Laybourn-Parry, Hodson and SattlerAnesio and others, 2007; Reference Foreman, Sattler, Mikucki, Porazinska and PriscuForeman and others, 2007) and microfauna such as tardigrades, rotifers (Reference Takeuchi, Kohshima, Yoshimura, Seko and FujitaTakeuchi and others, 2000; Reference Porazinska, Fountain, Nylen, Tranter, Virginia and WallPorazinska and others, 2004; Reference DastychDastych, 2005), protozoans, copepods, insect larvae (Reference KohshimaKohshima, 1984; Reference KikuchiKikuchi, 1994), algae and cyanobacteria (Reference Wharton, Vinyard, Parker, Simmons and SeaburgWharton and others, 1981, Reference Wharton, McKay, Simmons and Parker1985; Reference Mueller, Vincent, Pollard, Fritsen, Elster, Seckbach, Vincent and Lhotsky =Mueller and others, 2001). Organic constituents can be categorized into viable and residual categories. The viable portion consists of microbes, whereas residual organic debris or ‘humus’ is composed of polymeric compounds resulting from microbial waste (Reference HodsonHodson and others, 2010a). This is the agent that binds inorganic clasts together and causes cryoconite grains to grow in size over time. Reference TakeuchiTakeuchi (2002) cites the humic constituent of cryoconites as a principal instigator of snow and ice melt.
Because of the relatively darker surface of cryoconite with respect to the surrounding snow or glacier ice, the presence of cryoconite on a glacier can enhance surface melting through increased absorption of solar radiation. There are also other processes through which cryoconite might contribute to melting. Microbial organisms within cryoconite create heat energy through metabolic activities, further promoting hole development (Reference TakeuchiTakeuchi, 2002; Reference Fountain, Tranter, Nylen, Lewis and MuellerFountain and others, 2004) and, consequently, lowering the surface albedo at small spatial scales (Reference KikuchiKikuchi, 1994). Moreover, microbial exudates (i.e. humic detritus) are composed of polymeric compounds such as polyethylene and benzene that preferentially absorb shortwave radiation (350–550 nm) due to their dark colour (Reference TakeuchiTakeuchi, 2002), potentially further contributing to additional snow and ice loss.
Surface debris may aggregate over time as a consequence of melting caused by the increased ability of cryoconites to absorb solar radiation with respect to the surrounding snow or ice surfaces. This melting around the cryoconite grains allows them to group in holes, which continue to melt downward until they reach an equilibrium state wherein the depth balances the decreased albedo caused by the dust and biogenic material (Reference GribbonGribbon, 1979; Reference Fountain, Tranter, Nylen, Lewis and MuellerFountain and others, 2004; Reference Bagshaw, Tranter, Fountain, Welch, Basagic and LyonsBagshaw and others, 2007).
Arctic and Antarctic cryoconite holes exhibit different behaviour. Because energy-balance conditions favour frozen surfaces and internal melting (Reference Fountain and TranterFountain and Tranter, 2008), cryoconite holes in Antarctica were found to be covered by 30–40 cm thick ice lids over periods of observation spanning several years to decades (Reference TranterTranter and others, 2004), whereas those in the Arctic form and evolve as pools of surface water open to the atmosphere, remaining uncovered for most of the melting season. The study by Reference Fountain, Tranter, Nylen, Lewis and MuellerFountain and others (2004) of Antarctic ice-capped cryoconite holes reveals very different properties from those previously studied in Arctic environments. The ice-lidded Antarctic cryoconite holes were highly pressurized and showed seasonal evolution of freezing and melt. Holes from Antarctica varied in depth from 4 to 56 cm and in width from 4 to 145 cm (Reference Porazinska, Fountain, Nylen, Tranter, Virginia and WallPorazinska and others, 2004; Reference Fountain, Nylen, Tranter and BagshawFountain and others, 2008).
In recent years, many studies have focused on analysing physical and spectral properties of cryoconites at different locations (e.g. Reference Takeuchi, Kohshima, Yoshimura, Seko and FujitaTakeuchi and others, 2000; Reference Fountain, Tranter, Nylen, Lewis and MuellerFountain and others, 2004; Reference Bøggild, Brandt, Brown and WarrenBøggild and others, 2010), but the body of literature focusing on the comparison between cryoconites from sites in the two polar regions remains relatively small (Reference Mueller, Vincent, Pollard, Fritsen, Elster, Seckbach, Vincent and Lhotsky =Mueller and others, 2001; Reference Mueller and PollardMueller and Pollard, 2004). Comparing cryoconite properties from Arctic and Antarctic sites is important to improve our understanding of the spatio-temporal evolution of cryoconite in the context of different and wide-ranging environmental settings, to study how cryoconites are impacting (or are eventually impacted by) surface processes, and to determine how this information can be employed to advance the reliability of surface mass-and energy-balance model estimates and predictions.
In this study, we report results concerning spectral, physical and mineralogical properties of cryoconite samples collected over Jakobshavn Isbræ, West Greenland, and Canada Glacier, McMurdo Dry Valleys, Antarctica, during the boreal and austral summers of 2010. In particular, we compare the distribution of grains from the samples collected at the two polar sites using digital photography and image-processing software and report the mineralogical composition of the two samples. We also study the reflectance spectra in the 400–2500nm region before and after the removal of organic material through combustion, and focus on relating their spectral properties to the mineralogy.
Methods and Materials
Sampling procedure
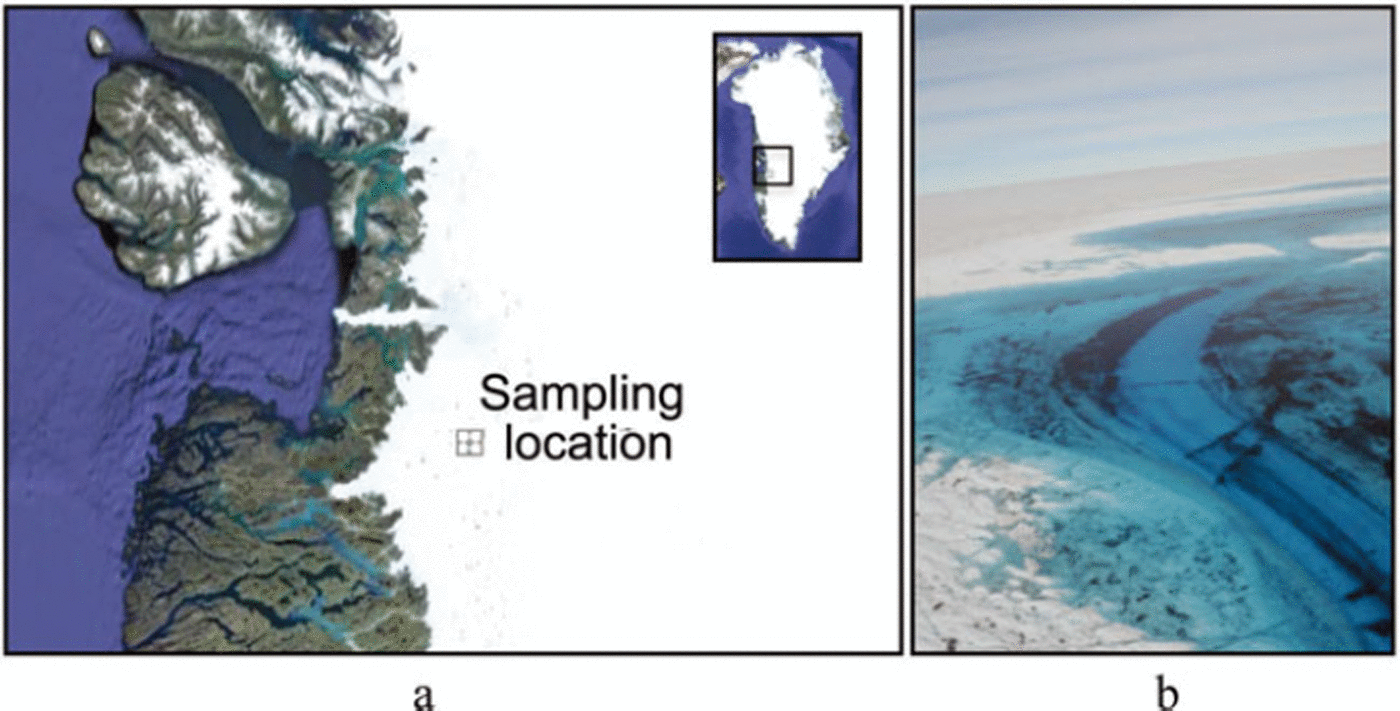
Samples of cryoconite material from the Antarctic site were collected on 18 December 2010 from the surface of Canada Glacier (77.61668 S, 163.18338 E). Canada Glacier flows southeast into Taylor Valley one of the three dry valleys in the Transantarctic Mountains, west of McMurdo Sound (Fig. 1a and b). The area of the dry valleys is ∼4800km2 and represents the largest ice-free region in Antarctica, cutting through the Beacon Sandstone geological formation. Samples from the Greenland site were collected on 4 July 2010 at 68.57558 N, 49.36228 W, south of Jakobshavn Isbræ (Fig. 2). The sampling site was ∼50 km from the ice edge and surrounded by supraglacial lakes. A recent study focusing on an area in South Greenland suggests that the observed dark region is probably caused by outcropping ice that contains high amounts of local dust from periods when more dust settled in the accumulation zone of the ice sheet (Reference Wientjes, Van de Wal, Reichart, Sluijs and OerlemansWientjes and others, 2011).
(a) Location of the Antarctic sampling site, Canada Glacier; and (b) image of the site where cryoconite material was collected. Source for (a): http://earthobservatory.nasa.gov/IOTD/view.php?id=35535

(a) Location of the Greenland sampling site and (b) image of the site where cryoconite material was collected.
For each site, multiple samples were collected from different holes (eight holes in Greenland and four holes in Antarctica). The holes in Antarctica had a similar diameter of ∼20cm and were covered by an ice lid ∼20cm thick (Fig. 3a and b). Conversely, the holes in Greenland were open (Fig. 3c) and had diameters ranging from a few centimetres to 40 cm. For each collected sample, the material was stored in 250 mL polyethylene bottles and placed in a container (Greenland) or a freezer (Antarctica). The samples were then shipped to Kangerlussuaq International Science Station in the case of Greenland and to McMurdo station in the case of Antarctica, where they were dried in an oven. The dried material was then shipped to our laboratory for analysis.
Cryoconite holes used for sampling in (a, b) Antarctica and (c) Greenland.

Mineralogy and grain size
For the mineralogical analysis, samples were prepared as 30 mm diameter polished sections. A polyethylene pill-vial was first made of each sample and after curing in cold-mounting epoxy, the vial was cut in half longitudinally. Each counterpart was then re-mounted face down to account for any density fractionation during potting, mixing and curing. Minerals and other attributes are measured using a mineral liberation analyzer (MLA), a quantitative mineralogical technology based, in our study, on an FEI Quanta600F scanning electron microscope (SEM). The ‘F’ designation refers to the field emission gun used as opposed to a normal tungsten filament SEM system. Results are obtained from the combination of image analysis employing atomic-number contrast imaging (from backscattered electron (BSE) signal intensity) and energy-dispersive spectrometry (EDS) (e.g. Reference Fandrich, Gu, Burrows and MoellerFandrich and others, 2007) using two Bruker 5010 SDD detectors. Based on comparisons of semi-quantitative EDS and literature values, chemical compositions of each mineral were assigned and assays calculated by the MLA. X-ray diffraction (XRD) analysis was used to verify the mineralogy, using a Panalytical X’Pert Pro Diffractometer equipped with a Cu X-ray source. Accuracy of MLA data is conventionally evaluated on how close a calculated composition based on the mineralogy agrees with a direct assay. The reproducibility of individual measurements is 0.3% mineral on average. Further information about the specific processes can be found at http://www.actlabs.com.
Visual analysis of grains from the cryoconite samples was performed using a SEM (Zeiss# SUPRA 55VP) and digital photography. In the latter case, the dried cryoconite material was displaced over a transparent support back-illuminated by means of an array of white light-emitting diodes (LEDs) facing the camera lens. This set-up was selected after several tests, as it was the one that reduced shadowing effects and increased the contrast of the images. The images were then analysed with either ImagePro1 software or a MatlabTM-based image-analysis software. Highly magnified (10x) photographs of the cryoconite were taken over the back light and then converted into black-and-white images and analysed for area, axis lengths and aspect ratio using MatlabTM functions. Multiple photographs from the same sample were taken, resulting in an overall sample size of ∼1000 particles for the samples from Greenland and ∼980 particles for the samples from Antarctica.
Organic matter and carbonate
The following steps were performed to quantify the amount of organic matter and carbonate in the samples, building on prior work by Reference DeanDean (1974), Reference Takeuchi, Kohshima, Shiraiwa and KubotaTakeuchi and others (2001) and Reference Takeuchi and LiTakeuchi and Li (2008). In the first stage, the sample was placed in an oven in a pre-weighed ceramic crucible at 1058C for 12 hours to remove moisture. The sample and the crucible were then weighed to obtain the dry weight and used as a basis for the weight loss calculations. The sample and the crucible were then placed in a muffle furnace at 5008C for 3 hours to combust the organic material. In a dried and powdered sample such as ours, the organic material starts igniting at ∼2008C and it is completely ignited by the time the furnace reaches 5008C (Reference DeanDean, 1974). The sample and the crucible were cooled to room temperature and weighed. The difference between the dry weight and this weight represents the amount of organic carbon lost on ignition. The sample in the crucible was again placed in the furnace at 10008C for 1 hour to remove calcium carbonate (Reference DeanDean, 1974). The loss of weight between the second and the third sample represents the amount of CO2 evolved from carbonate.
In the following, we refer to these samples as Sdry_XX, S500_XX and S1000_XX, with XX being Gr for the Greenland sites and An for the Antarctic sites. When XX is not specified, the discussion will refer to the samples from both locations. The weight of each sample before and after combustion was measured on a digital balance (±0.0001 g). Organic matter determination and spectral measurements were performed on all Sdry, S500 and S1000 samples. The accuracy of organic matter determination by means of the technique used here (e.g. loss-on-ignition, LOI) is affected by some major known factors. In general, the results concerning the amount of organic matter can be considerably overestimated because of various losses, which belong to volatile salts, organic compounds, structural water, sulphide oxidation or inorganic carbon (e.g. Reference Heiri, Lotter and LemckeHeiri and others, 2001; Reference VeresVeres, 2002). For example, as reported in Reference VeresVeres (2002), eventual inorganic carbon will evolve CO2 at temperatures between 4258C and 5208C in minerals such as magnesite, rhodochrosite or siderite. Moreover, because of the way the technique is designed, any bias of LOI at 5008C will influence the results of LOI at 10008C. Studies reported in the literature indicate that the amount of organic matter determined by LOI at ∼5008C is considered to be ‘approximately’ twice the organic carbon content, with different conversion factors proposed for converting organic carbon to original organic matter content of a sample, ranging between 2.13 and 1.45 (Reference VeresVeres, 2002).
Spectral measurements
Reflectance in the 400-2500 nm range was measured in the laboratory using an ASD spectrometer and an ASD high-intensity contact probe (www.asdi.com). The probe is designed for contact measurements of solid raw materials such as minerals, grains and other granular materials, which are illuminated by means of a halogen-calibrated light. Spectralon® tiles (12.5 cm x 12.5 cm) were used as a reference target (2, 50, 75 and 99% reflectance) to evaluate instrument calibration before, during and after measurements and to characterize the error. For each sample, measurements were repeated after rotating the sample by an angle of 158 under the probe and results were averaged. Spectral resolution for the ASD instrument is 3 nm at 700 nm and 10nm above 1400nm. The sampling interval was 1.4 nm in the 350-1050 nm band and 2 nm in the 10002500 nm band.
Results
Mineralogy, grain size and organic matter
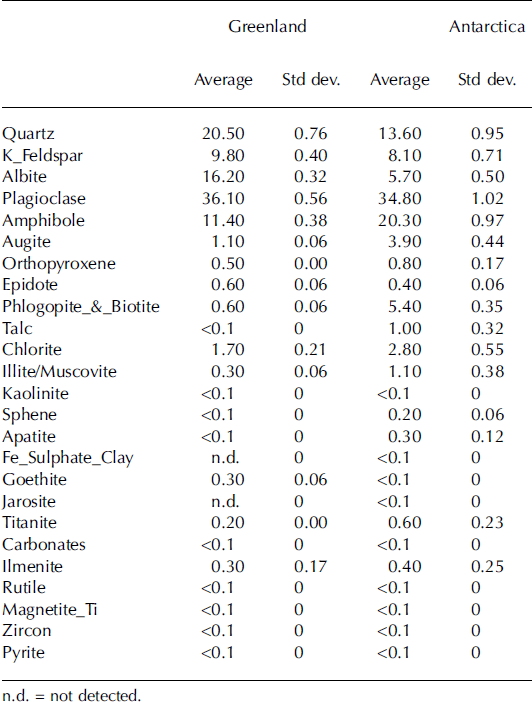
Results from the mineralogical analyses for the Sdry_Gr and Sdry_An samples are reported in Table 1. The samples collected at the Greenland site contained a higher concentration of quartz (20.5%) and albite (16.2%) than the samples from Antarctica (13.6% quartz and 5.7% albite). Amphibole, augite, phlogopite/biotite, talc and chlorite are present in higher concentrations in the samples collected at Canada Glacier. Conversely, albite and goethite were found in higher concentrations in the samples from Jakobshavn Isbræ. The remaining minerals identified in both samples have similar concentrations.
Results of the mineralogical analysis of the samples from Greenland and Antarctica
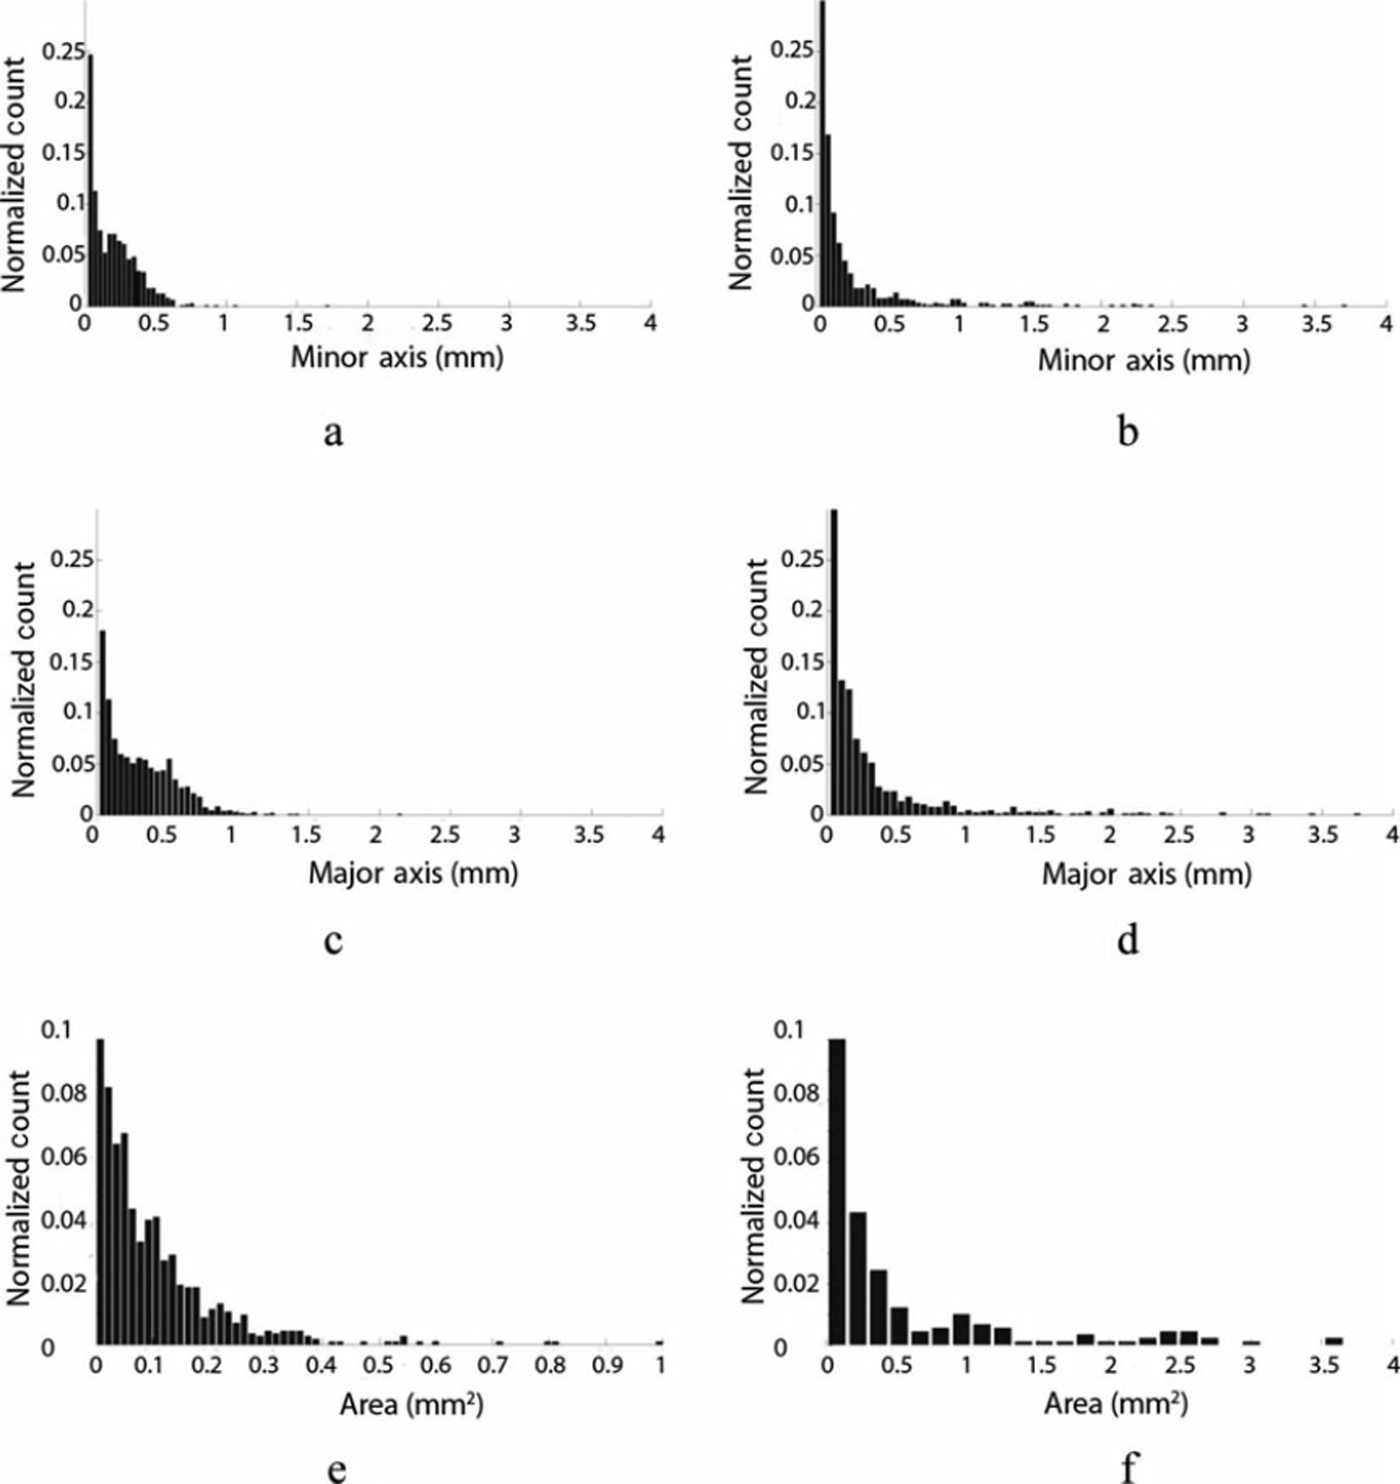
Visual inspection of the cryoconite grains from the samples collected at the two sites reveals distinct differences in grain size and morphology. Figure 4 shows SEM and microscope images of grains from the cryoconite samples from the two locations. The pictures show the absence of clustering in the samples from the Antarctic site, with the grains appearing as distinct fragments of different sizes and shapes. Most grains have angular shapes and are characterized by sharp edges. As pointed out by Reference Wientjes, Van de Wal, Reichart, Sluijs and OerlemansWientjes and others (2011), acute angles are typical for volcanic material but have also been observed in glacial grains. Conversely, the material from Greenland is composed of small particles clumped into relatively larger rounded agglomerates (Fig. 4c and d). Figure 5 shows the histogram plots of the minor axes (Fig. 5a and b), the major axes (Fig. 5c and d) and the area (Fig. 5e and f) for the samples from the Greenland sites (Fig. 5a, c and e) and Antarctic sites (Fig. 5b, d and f). Most of the minor-axis values in the samples from Greenland lie below 0.5 mm. The sample from Antarctica shows a higher diversity of particle sizes than the sample from Greenland. Analysis of the particle areas indicates that the samples from Greenland have an area generally below 0.5-0.6 mm2 while the samples from Antarctica can reach values up to 3.54 mm2 . No substantial difference is evident in the aspect ratios. This differs from the results obtained in a previous study, which suggested that larger particles from cryoconite in Greenland might have a greater aspect ratio than smaller ones (Reference Irvine-Fynn, Bridge and HodsonIrvine-Fynn and others, 2010). The amount of organic matter obtained from LOI of Greenland samples was 9.3 ± 1 . 2 % . The Antarctic samples contained less organic matter (1.21 ±0.2%). Combustion at 10008C further reduced the weight of the samples by 14.2 ± 1 . 1 % in the case of Greenland and 10.91 ± 0 . 1% in the case of Antarctica. In total, after the two combustions, the Greenland samples lost ∼ 2 4% of their original dry weight, whereas those from Antarctica lost ∼ 1 2 . 1 %.
(a, c) SEM and (b, d) microscope images of grains from (a, b) Canada Glacier and (c, d) Jakobshavn Isbræ cryoconite samples.

Distribution of (a, b) minor and (c, d) major axes and (e, f) surface area of the cryoconite grains in (a, c, e) Greenland and (b, d, f) Antarctic samples.
Spectral reflectance
The reflectance spectra of the samples from Jakobshavn Isbræ and Canada Glacier in the 400-2500 nm range are plotted in Figure 6. The reflectance spectra for the dry samples (Sdry_XX) from the two sites show comparable values, despite the differences in percentage of organic material. The shape and absolute values of the reflectance values for both samples are consistent with previously published results (e.g. Reference TakeuchiTakeuchi, 2002). The removal of organic material considerably increases the reflectance of the samples from Greenland (Fig. 6a) for wavelengths above ∼500 nm, with the difference between the reflectance of the Sdry_Gr and S500_Gr samples generally increasing until ∼ 1 4 0 0 nm and remaining relatively constant above 1400 nm, with a peak value of ∼ 0 . 1 . This corresponds to a relative increase in reflectance for the Greenland samples before and after the first combustion above 500 nm ranging between ∼110% and ∼160% (Fig. 6c), with the peak occurring at ∼1700nm. Combustion of the Greenland samples at 10008C further increased reflectance over most of the measured spectrum, with relatively small change occurring below ∼500nm. The absolute change in the reflectance between the S1000_Gr and S500_Gr samples is smaller than that associated with the difference between the S500_Gr and Sdry_Gr samples up to ∼1400 nm, after which the changes are comparable (peaking at ∼0.15).
Spectral reflectance for (a) Greenland and (b) Antarctic samples for Sdry (solid line), S500 (dashed line) and S1000 (dotted line) and difference between the Sdry and S500 (black bars) and S500 and S1000 (grey bars) values. Error bars indicate the standard deviation computed from all measurements and are reported only every 100 nm to improve the readability of the figure. (c) Relative percentage difference between the reflectance values measured before and after the ignition. (d) Difference between the spectral reflectance values of Jakobshavn Isbræ and Canada Glacier samples measured after each combustion.
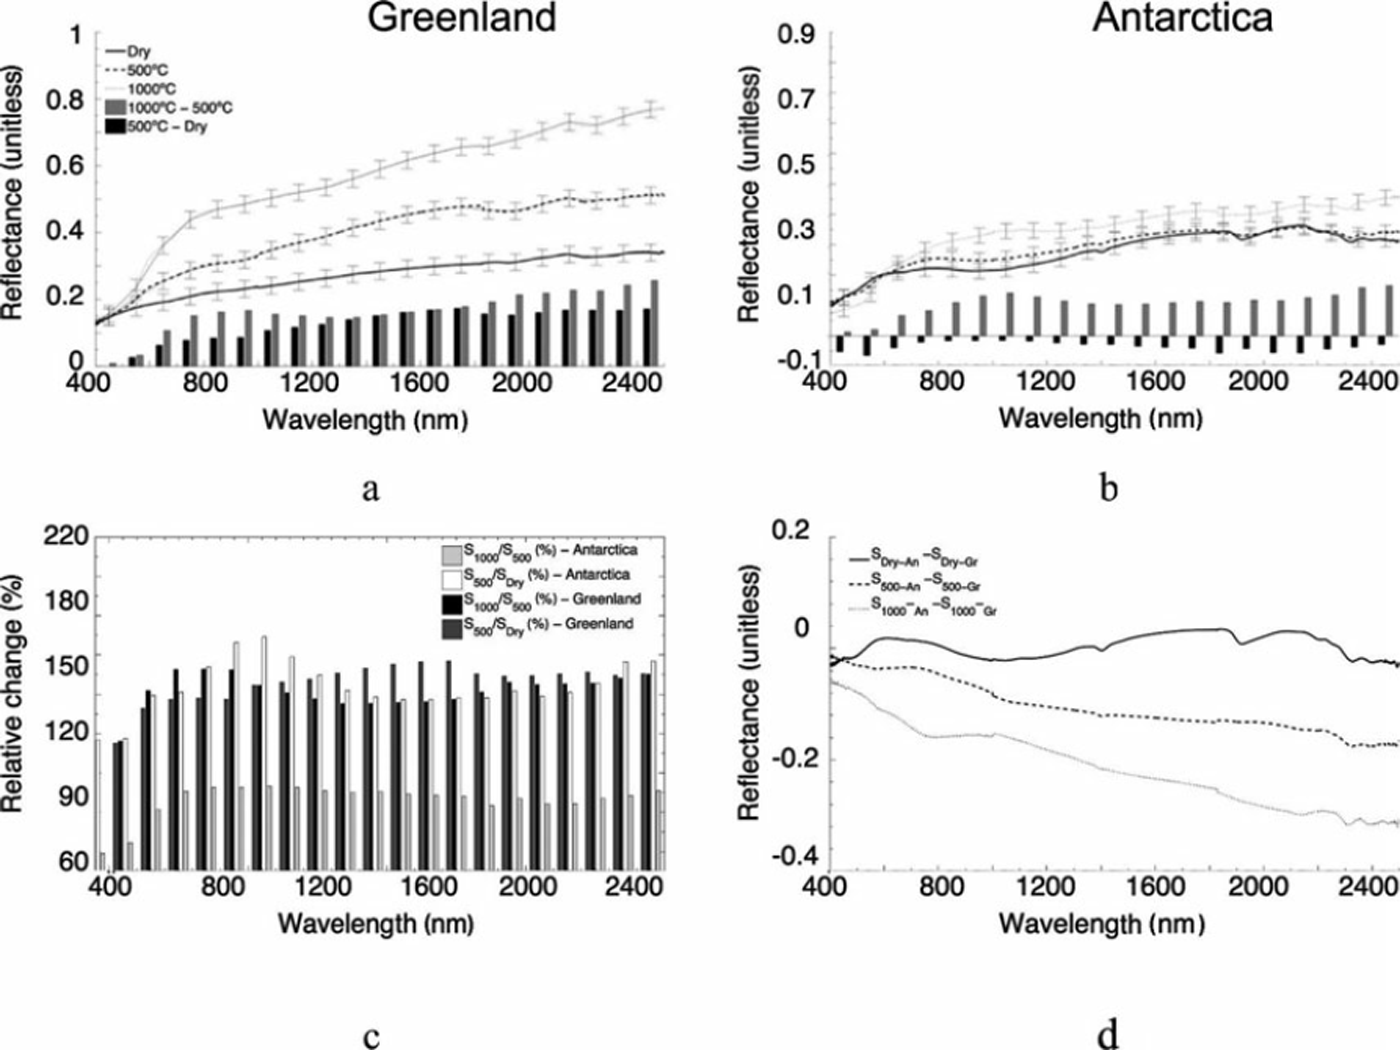
Relative changes between the reflectance values of the S1000_Gr and S500_Gr samples are similar to the relative changes between S500_Gr and Sdry_Gr samples, though slightly smaller and ranging between 118% and 152% (black bars in Fig. 6c). In contrast to the samples from Greenland, removal of organic matter from the samples collected at Canada Glacier did not considerably change the reflectivity along the measured spectrum (Fig. 6; e.g. ∼0.05 below ∼700nm and above ∼-1800nm, hence falling within the measurement uncertainty). The reflectance values of the S1000_An samples are, however, much higher than those of the S500_An samples, peaking at values up to ∼0.4 at ∼2500 nm and showing an absolute increase of ∼0.1 relative percentage (∼140-170%). Figure 6d shows the difference between the spectral reflectance values of Jakobshavn Isbræ and Canada Glacier samples measured after each combustion stage. The plot shows that the spectra of the Sdry_Gr and Sdry_An samples are similar across the measured spectrum. However, for the remaining two cases, the samples from Antarctica show a reduced reflectivity over those collected in West Greenland, still over the measured spectrum. The spectral values published by Reference Bøggild, Brandt, Brown and WarrenBøggild and others (2010) are consistent with our study of Antarctic cryoconite following the removal of organics. Reference Bøggild, Brandt, Brown and WarrenBøggild and others (2010) reported that the average spectral measurement of ice in Greenland’s Kronprins Christians Land ranged between 0.2 and 0.6 as a function of percent cryoconite cover and ice morphology (Reference Adhikary, Nakawo, Seko and ShakyaAdhikary and others, 2000), whereas the albedo of wet cryoconite can be far lower (i.e. 0.04–0.1; Reference SolbergSolberg and others, 2009; Reference Bøggild, Brandt, Brown and WarrenBøggild and others, 2010).
Discussion
The results of our mineralogical analysis are consistent with Reference HodsonHodson and others (2010b), who found that mineralogy of cryoconite from Svalbard was dominated by quartz, with lower concentrations of dolomite, orthoclase (feldspar), muscovite, biotite and kaolinite. Also, Reference Stibal, Tranter, Telling and BenningStibal and others (2008) reported that cryoconite mineralogy from Svalbard lacked apatite and mainly consisted of chlorite, edenite (amphibole), quartz, albite, muscovite and unidentified amorphous clasts. Reference Langford, Hodson, Banwart and BøggildLangford and others (2010, Reference Langford, Hodson and Banwart2011) determined that quartz, feldspar, mica, kaolinite and dolomite were the main cryoconite minerals at their collection sites in Greenland and Svalbard. However, unlike Reference Stibal, Tranter, Telling and BenningStibal and others (2008), they noted that apatite was present in minor amounts. Our mineralogical results are similar to other localities in the Northern Hemisphere. For instance, Reference Takeuchi, Ishida and LiTakeuchi and others (2011) report that the inorganics associated with cryoconite collected from Urumqi glacier No. 1, Tien Shan, China, consist of the same types of minerals referenced above as well as a lesser fraction of amorphous clasts. Reference Li, Maa, Jiang and WangLi and others (2011) also indicated that the cryoconite mineralogy from Urumqi glacier No. 1 consists of nearly equal amounts of quartz and feldspar that account for ∼ 6 5% of the nodules and that the remaining fraction is divided between dark minerals (25%) and clay minerals (10%). Likewise, cryoconite in Laptev Sea (Russian Arctic) ice contains quartz, feldspar and an assortment of various clay minerals that are diagnostic of their source area, as well as low percentages of phyllosilicates and opaque materials (pyrite, siltstone, glauconite, amphibole) (Reference NurnbergNurnberg and others; 1994). Moreover, Reference Foreman, Sattler, Mikucki, Porazinska and PriscuForeman and others (2007) reported that cryoconite material recovered from flooded holes in Antarctica’s McMurdo Dry Valleys also consisted principally of the amphibole hornblende (dark-coloured), actinolite (light-coloured) and to a lesser extent quartz. Reference Bagshaw, Tranter, Fountain, Welch, Basagic and LyonsBagshaw and others (2007) reported carbonates, sulfates and silicates as the likely mineral types in McMurdo Dry Valley cryoconite.
The mineralogical analysis of the samples from the two sites suggests that the samples from Jakobshavn Isbræ contain a higher percentage of minerals with relatively higher reflectance over the measured spectrum. Conversely, the samples from Canada Glacier contain a higher percentage of materials with relatively low reflectance. We do not have measurements of mineralogical composition of the areas surrounding the sampling site and can only speculate on the connection between the mineralogical composition of cryoconite and the local geology of each site. A geological map of Greenland was compiled by the Geological Survey of Denmark and Greenland (GEUS) and is available at http://www.geus.dk/program-areas/raw-mater-ials-greenl-map/greenland/gr-map/kost_1-uk.htm. The map indicates that the Jakobshavn area is dominated by ‘reworked amphibolite facies Archaean gneiss in early Proterozoic fold belts (∼3000Ma age)’ (indicated with the classification #74 in the map). Proterozoic basement rock (felsic igneous and metamorphic gneiss suites) appears to comprise the area encompassing Jakobshavn Isbræ (Reference Weidick and BennikeWeidick and Bennike, 2007; Reference Henriksen, Higgins, Kalsbeek and PulvertaftHenriksen and others, 2009). This could represent the prevailing local source of the cryoconite minerals in our samples based on the data presented in Table 1, which clearly documents the high concentration (∼82%) of felsic minerals. A bedrock geologic map of the McMurdo Dry Valleys is also available at http://www.nrri.umn.edu/egg/REPORTS/MAP200802/MAP200802.html. The site where our Antarctic samples were collected is dominated by biotite orthogneiss (quartz, biotite, plagio-clase, kspar gneiss of granitic composition). This might explain the higher content of biotite in the Antarctic samples compared with the ones from Greenland and the relatively high concentration of plagioclase. Moreover, Reference Angino, Turner and ZellerAngino and others (1962) report that the exposures of the lower Taylor Valley contain metasedimentary, granitic and gneissic exposures and could account for the relatively high felsic content (∼60%) observed in our cryoconite samples (Table 1). However, it is unclear where the mafic minerals (∼25%) originate, although local metasedimentary sequences are one possibility.
Further analysis of the linkages between the regional geology and the sampling site is necessary to better understand the potential impact of the local material on the mineralogical composition of cryoconite. In particular, it is important to understand whether the samples collected at the two sites are representative of the areas surrounding the sampling sites. In this regard, systematic collection of samples from multiple sites spatially distributed over selected areas would provide information on the variability of the quantities reported here. Unfortunately, such a dataset is not available for the Antarctic site, and, to our knowledge, no funded project is currently focusing on this. We attempted to address this issue by collecting samples of cryoconite from multiple locations along the west coast of Greenland during the 2011 and 2012 field seasons. Those datasets are currently being analysed.
The difference between the spectra of the samples from the Antarctic and Greenland sites after removal of the organic matter can be explained by the differences in concentration of materials with different spectral properties. Indeed, the spectrum of a material can be decomposed into a weighted sum of the spectra of the so-called end-members, with the coefficients of the weighted sum representing the spectral abundance (related to the fraction of the end-member in the sample). In Figure 7a we show the spectral reflectance of some minerals with different concentrations in the samples from the two sites (obtained from http://speclab.cr.usgs.gov/spectral-lib.html). The higher percentage of minerals with lower reflectance in the Antarctic is likely responsible for the lower reflectance values of the samples from the Southern Hemisphere after the removal of organic matter. Conversely, a high percentage of minerals with high reflectance is responsible for the relatively high reflectance of the samples from Jakobshavn Isbræ.
Examples of reflectance spectra (400–2500 nm) for (a) minerals with a percentage difference between the Greenland and Antarctic samples that is substantial and (b) oxides present in the samples or potentially forming after combustion.

The mineral composition in the case of Canada Glacier samples is likely responsible for the relatively small difference between the pre- and post-ignition reflectance values. We point out, however, that the percentage content of organic matter in the samples from Greenland is higher than that in the samples from Antarctica and this difference might reduce the reflectance of the samples from Greenland more than that of the samples from Antarctica. This, together with the mineralogical composition, is responsible for the large difference in the reflectance values of Sdry_Gr and S500_Gr. Interestingly, the shape of the reflectance spectrum of the samples after the removal of organic matter is similar to that of materials containing oxides, consistent with Reference Foreman, Sattler, Mikucki, Porazinska and PriscuForeman and others’ (2007) reporting iron hydroxide coatings on cryoco-nite material from the McMurdo Dry Valleys. Oxide minerals such as goethite and ilmenite are present in small amounts in the samples from the two sites, together with traces of jarosite and magnetite (Table 1). The spectra of goethite and ilmenite are plotted in Figure 7b (http://speclab.cr.usgs.gov/spectral-lib.html ). The reflectance curve of goethite is similar in shape to the curve of the S1000_XX samples, suggesting that the presence of oxides might be responsible for the shape of the spectral reflectance. Nevertheless, the percentage of goethite and other oxides in the samples before the combustion appears to be too low to justify the observed shape of the reflectance spectrum. It is possible that oxides or clay-like material could form during the combustion process. These materials might change the bulk reflectance properties of the sample and would not be present in our current pre-combustion mineralogical analysis. The combustion of the samples might indeed produce a more oxidized form of goethite (e.g. gematite, with high reflectance in the red region; see Fig. 8), the spectrum of which is also shown in Figure 7b. Muscovite and iron chlorite may also be oxidized after the combustion.
Photographs of the material sampled from (a, b) the Greenland site and (c, d) the Antarctic site in the crucible (a, c) before and (b, d) after the combustion. The diameter of each crucible is 1.25 cm.

Samples from Greenland and Antarctica show relatively higher reflectance values (up to 0.7 as in the case of the S1000_Gr sample) for wavelengths above ∼1000-1400 nm. In most previously published work, spectral measurements are collected up to the near-infrared, with the exception of a few studies (e.g. Reference Bøggild, Brandt, Brown and WarrenBøggild and others, 2010). The impact of cryoconite in the shortwave infrared region on the energy balance of ice and snow cryoconite-covered surfaces is, however, small or negligible. This is due to the very low absorption of solar radiation by snow- and ice-covered surfaces above 1400 nm (e.g. Reference Grenfell and PerovichGrenfell and Perovich, 2004; Reference Bøggild, Brandt, Brown and WarrenBøggild and others, 2010).
Conclusions
We have reported results from a comparative analysis of Jakobshavn Isbræ and Canada Glacier cryoconite samples aimed at quantifying and understanding the mineralogical, morphological and spectral differences and analogies between samples collected at the two sites. The sample from Greenland was composed mainly of relatively small particles clumped together into larger rounded particles, whereas the sample from Antarctica contained both fine and large particles with no agglomerates. The results of the mineralogical analysis showed different concentrations of minerals in the samples from the two locations. The material collected in Greenland contained a higher percentage of relatively brighter minerals, such as quartz and albite. In contrast, the material collected from the cryoconite holes in Antarctica contained a higher percentage of relatively dark minerals such as amphibole, augite and biotite. Other minerals, such as illite, sphene and apatite, were more abundant in the samples from Antarctica, though their concentration was generally low. Though biological material has been the subject of many past cryoconite studies, mineralogy also plays a key role in these systems. The cryoconite particles are, indeed, the main source of nutrients for biological activity because the surrounding glacial water is relatively pristine. Reference Smith, Tow, Stafford, Cary and CowanSmith and others (2006) and Reference Langford, Hodson, Banwart and BøggildLangford and others (2010) indicated that mineral heterogeneity influences the distribution of bacterial communities and asserted that the physical parameters of minerals may be a key factor in the cryoconite-forming process. Specifically, kinetic dynamics between colliding colloidal grains can promote binding in the early stages of cryoconite agglomeration. Mineral grain enlargement eventually provides a suitable substrate for biofilms to form, furthering cryoconite growth and incorporation of larger suspended mineral grains into nodules by chemical adherence afforded by polymeric substances that are generated by the microbes.
Our data from spectral measurements in the laboratory confirm the primary role of organic material in reducing the reflectance over the measured spectrum (400-2500 nm) in the case of the sample from Jakobshavn Isbræ. The relatively negligible change in reflectance after the removal of organic matter in the case of the samples from Canada Glacier can be explained by the presence of a higher concentration of minerals with lower reflectance and by the relatively low amount of organic matter. Removal of calcium carbonate further increased reflectance of the samples from both sites for wavelengths above ∼500 nm, reaching values up to ∼ 0 .7 in the shortwave infrared region. The relatively low reflectance in the visible and near-infrared region plays a key role in reducing the overall albedo of snow and ice surfaces covered by cryoconite, hence increasing the amount of absorbed solar radiation and favouring melting. However, the shortwave infrared portion of the spectrum plays a negligible role in the energy absorbed by ice covered by cryoconite in view of the low reflectance values of snow and ice in that region.
Our results suggest that it may be possible to apply remote-sensing tools to study the spatio-temporal variability of cryoconite, using, for example, high spatial resolution (1 m) multispectral data collected by commercial satellites (e.g. WorldView, QuickBird), as in Reference Takeuchi, Uetake, Fujita, Aizen and NikitinTakeuchi and others (2006b) in the case of red algae in snow. Such an approach would likely be more successful when applied to samples similar to those from Greenland, where there exists a well-marked difference between the reflectance of the cryoconite with and without organic content. Higher uncertainty might be present in the case of cryoconite similar to that collected from Canada Glacier, because of the relatively small difference between reflectance values when organic matter is present or absent. We plan to analyze in situ spectral data collected during the 2011 and 2012 field seasons in West Greenland (Jakobshavn and Kangerlussuaq) to investigate the development of a statistically robust relationship between albedo and the fraction of surface covered by cryoconite. We also plan to use the collected samples to investigate the presence of key elements that could provide clues to the origin of the materials within the holes.
Acknowledgements
We acknowledge the support of the US National Science Foundation through grant No. 0909388 of the NASA Cryosphere Program to M.T. and NSF OPP 0838970 to C.M.F. The World Wildlife Foundation is acknowledged for partially supporting fieldwork activities in Greenland. We also acknowledge the reviewers and the editor for constructive and helpful suggestions.



