Globally, overweight affects over 2·5 billion adults aged 18 years and older, including 890 million adults living with obesity in 2022(1). The increasing number of women of reproductive age who are overweight or obese is of particular concern, with estimates based on a systematic review and meta-analysis of population-level data suggesting that, since 2010, one in six pregnancies has been complicated by obesity(Reference Kent, McGirr and Eastwood2). In 2019, 63·3 % of adult Brazilian women were classified as overweight and 30·2 % as obese(3). Additionally, pre-pregnancy overweight increased from 22·6 to 28·8 % and obesity from 9·8 to 19·8 % between 2008 and 2018(Reference Carrilho, Rasmussen and Hutcheon4).
Pregnancy and the postnatal period represent vulnerable phases in women’s lives, characterised by changes in body weight and body composition (BC)(Reference Gunderson, Sternfeld and Wellons5–Reference Soltani and Fraser7). Typically, pregnancy leads to increased body fat (BF), followed by a decrease during the third trimester and lactation(Reference Huda, Forrest and Paterson8). However, these changes vary among populations, with fat depletion observed across pregnancies in nutritionally stressed populations and steady accumulation in well-nourished sedentary populations(Reference Wells, Griffin and Treleaven9,Reference Butte and Hopkinson10) .
The BMI is the most widely used indicator for assessing nutritional status in surveys and healthcare systems, despite its limitation in distinguishing between fat mass (FM) and fat-free mass (FFM)(Reference Rothman11). BC can be determined using bioelectrical impedance analysis (BIA), a non-invasive, fast and low-cost method(Reference Bosaeus, Andersson-Hall and Andersson12). Although BIA is widely used in epidemiological studies, assessing BC in postpartum women presents physiological issues, such as changes in hydration status(Reference Biddulph, Holmes and Kuballa13). However, the modernisation of BIA equipment has enhanced its performance and data reliability for this population(Reference Obuchowska, Standyło and Kimber-Trojnar14), supporting its use as a valid tool for studying BC changes in the postpartum period(Reference Barry, Martin and Chandler-Laney15). In addition, BC assessment during lactation seems to be an essential indicator of maternal nutritional status, which is central to the overall health of the mother and child(Reference Biddulph, Holmes and Kuballa13).
Evidence suggests that parity(Reference To and Wong16), delivery mode(Reference Legro, Lehman and Kjerulff17), maternal age(Reference Caire-Juvera, Casanueva and Bolaños-Villar18) and socio-economic conditions(Reference Bazzazian, Ozgoli and Riazi19) are associated with changes in maternal BC. However, longitudinal studies exploring factors associated with postpartum changes in maternal BC and maternal BMI among lactating women are limited. Our overall hypothesis was that maternal and socio-economic factors, including maternal age, parity, family income, pre-pregnancy BMI (ppBMI) and infant sex, predict changes in maternal BC during the postpartum period. To our knowledge, this is the first study to consider a variety of BC parameters within a Brazilian sample. Therefore, we aimed to (1) assess trajectories of maternal BC and BMI from 1 to 8·5 months postpartum and (2) investigate the maternal and infant factors associated with these trajectories.
Methods
Study design and participants
The present study uses data from a subsample of the ‘The Mothers, Infants, and Lactation Quality (MILQ)’ study (Clinical trial registration: NCT03254329, https://clinicaltrials.gov/study/NCT03254329), an international multi-centre cohort study conducted in Bangladesh, Brazil, Denmark and The Gambia. The MILQ study was designed to establish reference values for micro- and macronutrient concentrations in human milk across the first 8·5 months postpartum. It was initially powered to detect differences of 0·25–0·30 sd with 80–90 % power, based on a sample of 250 women per country and period. Based on the Brazilian subsample, the power calculation for detecting differences of 0·30 sd in comparison tests for the present study was 0·68. For detecting correlations ≥ 0·30, the power was 0·94, while for detecting moderate (f2 = 0·15) and large (f2 = 0·35) effects in linear models, the power was 0·97 and 0·99, respectively. These calculations were based on the smallest sample size (visit M3, n 131), meaning that all other visits had a higher power. Detailed information about the MILQ study protocol can be found elsewhere(Reference Allen, Hampel and Shahab-Ferdows20).
The participants were recruited from a public hospital in Rio de Janeiro and were enrolled during the third trimester of pregnancy (>28th week of gestation) or immediately after delivery. Participants underwent four visits throughout the study period: one at 24–72 h postpartum (visit C), followed by three scheduled visits at specific time intervals: 1·0–3·49 months (visit M1), 3·5–5·99 months (visit M2) and 6·0–8·5 months postpartum (visit M3). Visits M1 through M3 were divided into 3-week time windows, ensuring a balanced distribution of participants across these periods. This approach allowed data collection to cover all ages between 1 and 8·5 months postpartum and to distribute dyads within the window randomly. The data collection in Brazil occurred from January 2018 to March 2022 and included an interruption of 6 months in recruitment due to the COVID-19 pandemic.
The data collected during the three scheduled visits (M1–M3) included height, weight and maternal BC measurements. Additionally, questionnaires were used to collect birth details, sociodemographic characteristics, maternal and infant health conditions and breastfeeding practices.
This study was conducted according to the guidelines laid down in the Declaration of Helsinki, and all procedures were approved by the National Commission for Research Ethics (2.086.708, 2.875.218, 4.865.685, approved on 29 May 2017), the Research Ethics Committees of the Maternity School of Rio de Janeiro Federal University (1.948.992, 2.769.611, 4.449.007, approved on 6 March 2017) and the Municipal Secretary of Health and Civil Defence of the State of Rio de Janeiro, Brazil (2.100.255, approved on 5 June 2017; project number: 64767717.4.0000.5275). Written informed consent was obtained from all participants.
Eligibility criteria and subjects
Maternal inclusion criteria comprised being free of chronic or infectious diseases, age 18–40 years, with a ppBMI between 18·5 and 29·9 kg/m2, a height > 145 cm and Hb > 100 g/l during the third trimester of pregnancy. Mothers should be non-smokers and should not have used vitamin or mineral supplementation during the third trimester of pregnancy and postpartum follow-up, except for iron and folic acid, as recommended by the Brazilian governmental guidelines(21). Additionally, they were expected to have a low consumption of fortified foods, not have a regular alcohol intake of >30 g per week and not follow a vegan or macrobiotic diet. Women were excluded if they had any chronic diseases or developed medical conditions relevant to the study (e.g. gestational diabetes or pre-eclampsia) and if they discontinued exclusive breastfeeding (EBF) before M1. The infant’s inclusion criteria comprised being a singleton and born at term (≥37 and ≤42 gestational weeks) with a birth weight between 2500 and 4200 g and without congenital malformations that interfere with feeding, growth or development. Infants were excluded if they had a z-score < –2 for length-for-age, weight-for-age or weight-for-length according to the WHO Child Growth Standard (22); no EBF at M1 or if breastfeeding was discontinued entirely at any of the follow-up timepoints.
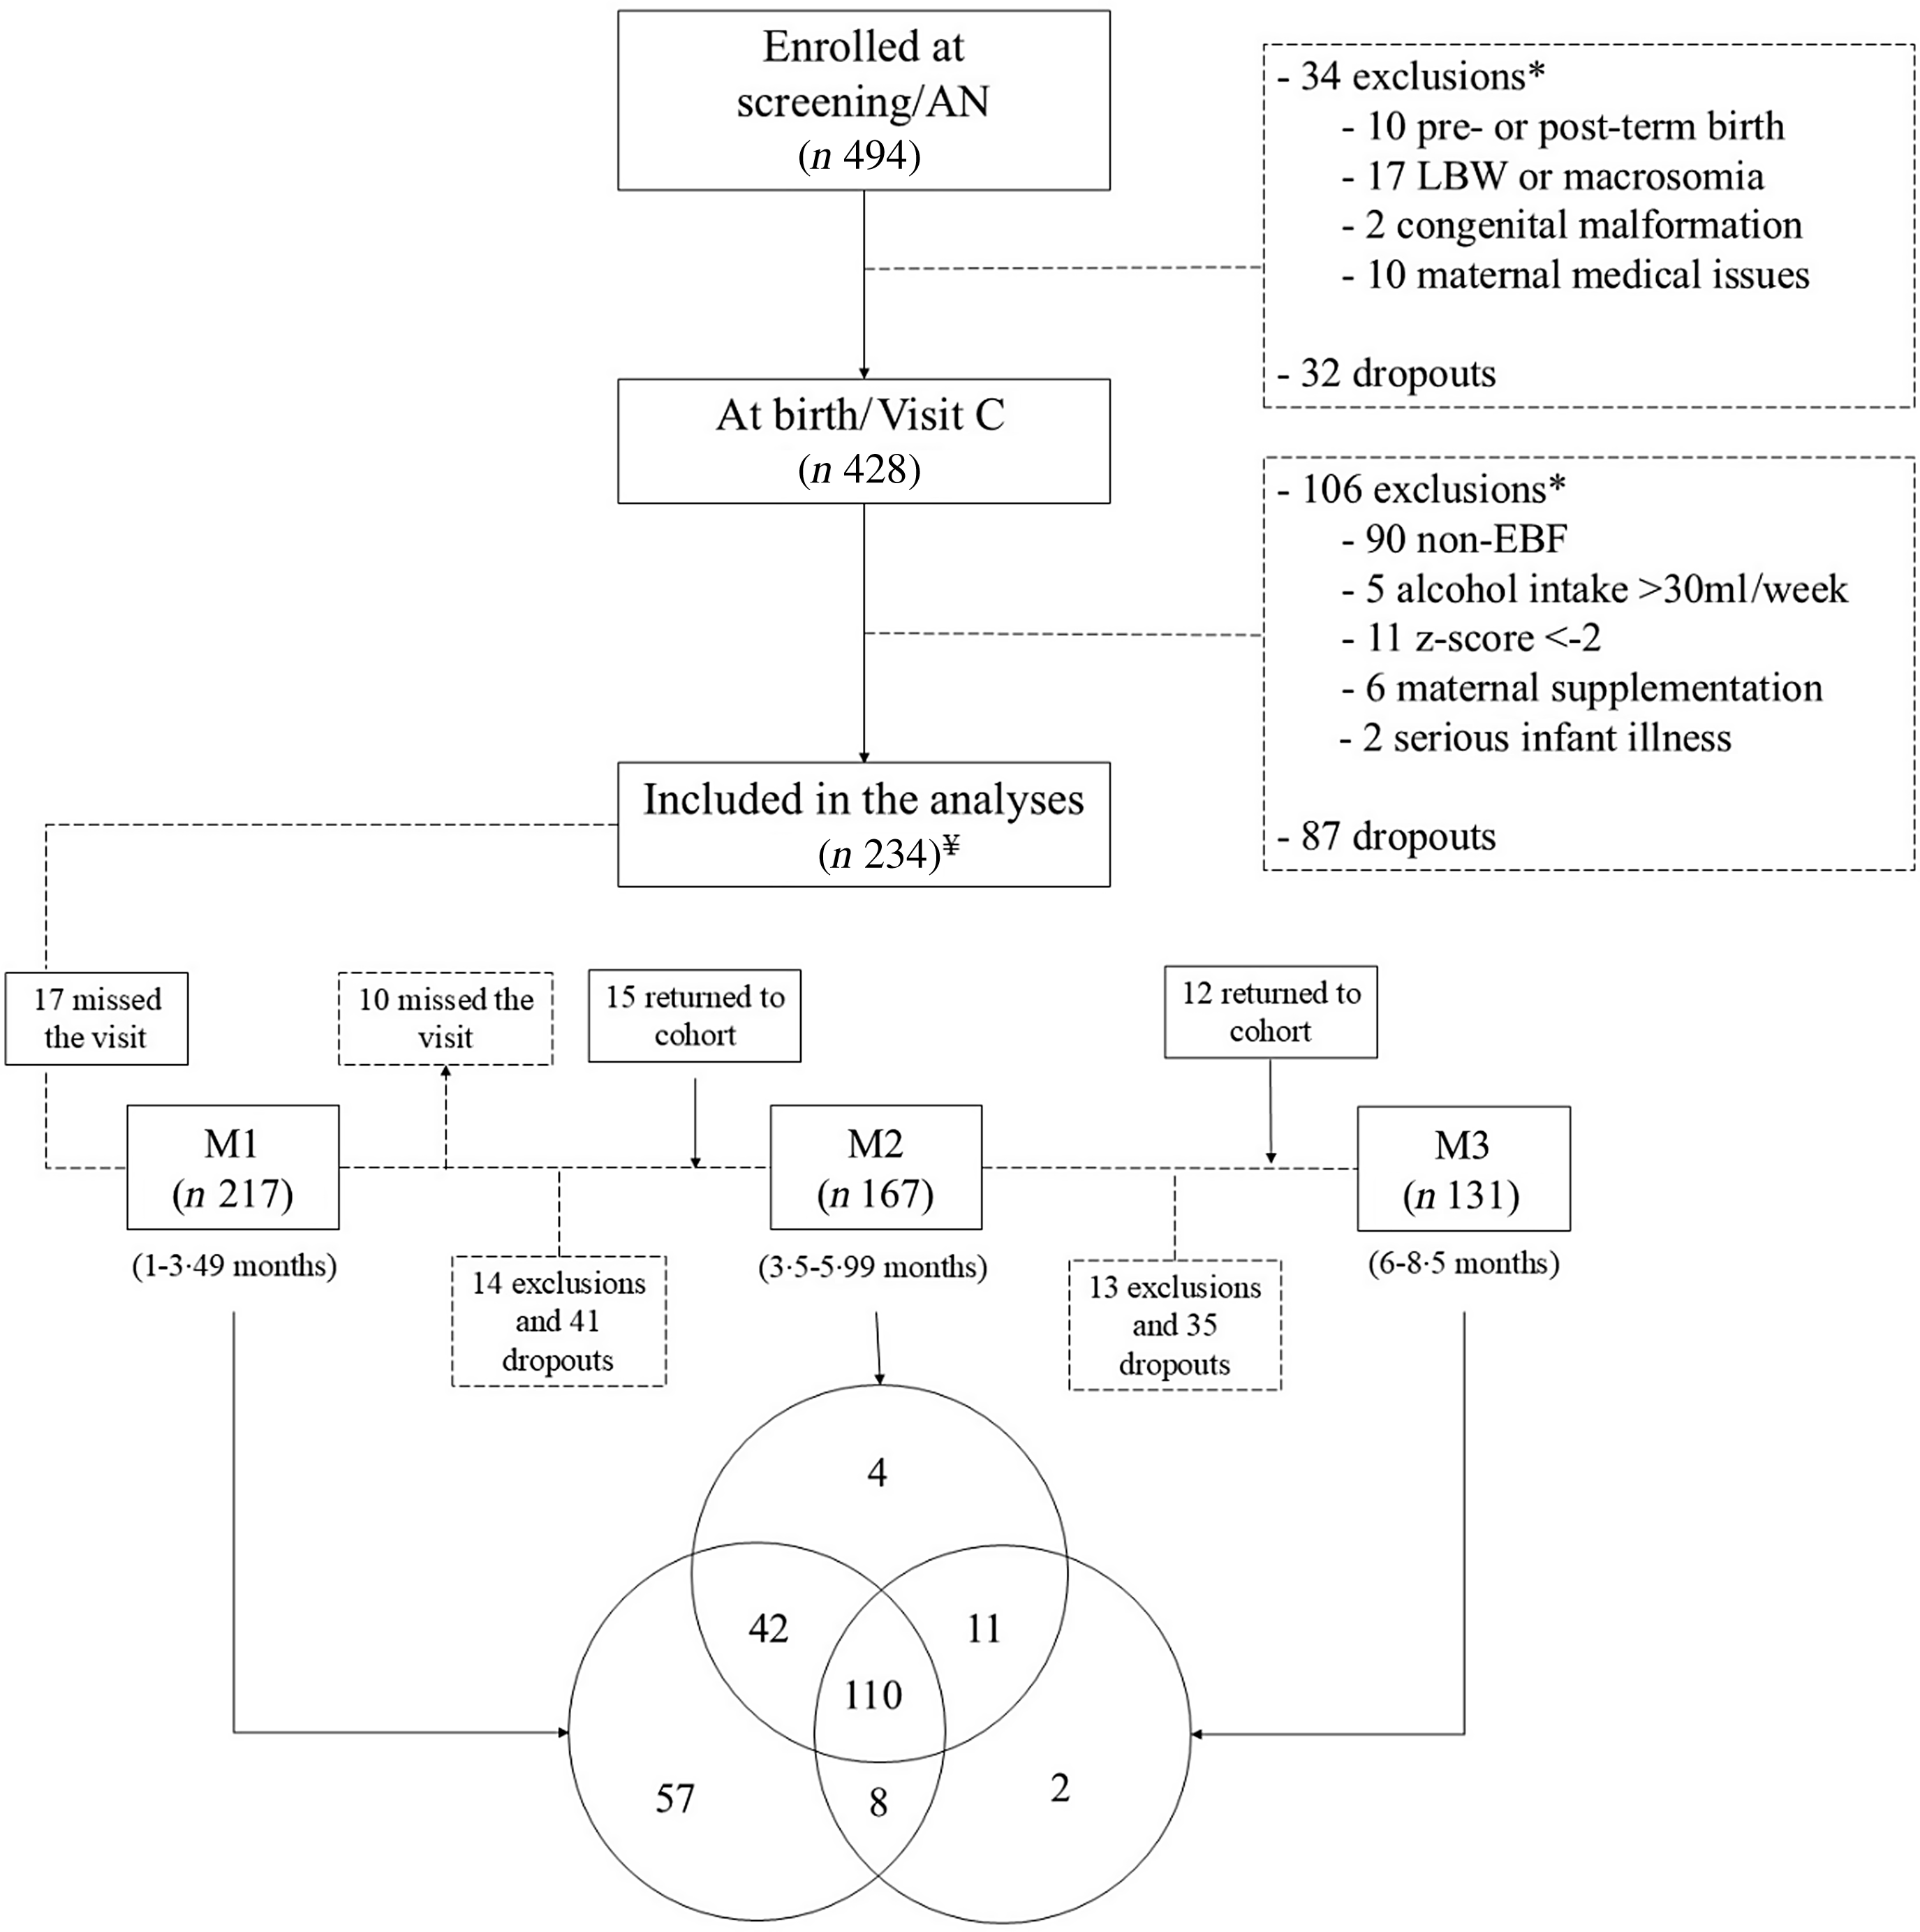
A total of 494 mother–infant dyads were initially recruited at the study’s baseline. Of these, 34 dyads were excluded, and 32 dropped out of the study, resulting in 428 dyads assessed at visit C. At M1, an additional 106 dyads were excluded, and another 87 more dropped out. For the present analyses, only women who had BC evaluated at least once during the follow-up visits were included (n 234) (Fig. 1).
Flow chart of the final sample for the analysis of maternal body composition during women’s lactation followed in the Brazilian MILQ cohort (n 234). Note: Venn diagram showing the distribution of participants: 57 participants attended only M1, 42 attended both M1 and M2, 8 attended M1 and M3, 2 attended only M3, 11 attended M2 and M3, 4 attended only M2 and 110 attended all three (M1, M2 and M3). Exclusions between recruitment and C: pre- or post-term (gestational age ≤ 37 or ≥ 42 weeks) (n 10); LBW: low birth weight (≤ 2·500 g birth weight) (n 11); macrosomia: ≥ 4·200 g birth weight (n 6); congenital malformation (n 2); maternal medical issues: pre-eclampsia (n 8) and gestational diabetes (n 2). Exclusions between C and M1: no exclusive breastfeeding (EBF) (n 90); maternal alcohol intake > 30 g per week (n 5); z-scores < −2 for length-for-age, weight-for-age or weight-for-length (n 11); maternal nutrient supplementation (n 6); infant illness (n 2). Exclusions at M2: discontinued breastfeeding (n 9); maternal alcohol intake > 30 g per week (n 3); z-scores < −2 for length-for-age, weight-for-age or weight-for-length (n 2). Exclusions at M3: discontinued breastfeeding (n 4); maternal alcohol intake > 30 g per week (n 2); z-scores < −2 for length-for-age, weight-for-age or weight-for-length (n 2); maternal nutrient supplementation (n 2); abnormal development according to ASQ-3 (n 3). At M1: mothers who did not attend the M1 for any reason (n 17) but followed to the next visits (fifteen returned to M2 and M3, and two returned only at M3). At M2, ten mothers missed the visit for some reason but returned to the cohort at M3. The reasons for dropout are COVID-19, moving away, failure to attend the visit, infant death, project end or other reasons. *Some women were excluded based on multiple criteria. ¥Only women with at least one BIA measurement during the follow-up were included.

Maternal anthropometry and body composition
The ppBMI was calculated as weight divided by the square of height (kg/m2) based on the pre-pregnancy weight and height data recorded in the pregnancy booklet. Maternal height was measured in triplicate during M1 using a fixed digital stadiometer SECA 264 (Seca) with a precision of 1 mm. The data used were based on the mean of the three measurements. The postpartum weight retention was calculated as the difference between weight at each follow-up visit and pre-pregnancy body weight.
Mothers had their body weight and BC measured during all follow-up visits using the Tanita MC-780U instrument (Tanita Corporation). The instrument has a precision of 100 g and a capacity of 270 kg. The BC was assessed after ensuring participants had fasted for at least 3 h and had not consumed large meals or engaged in intense physical activity in the past 12 h. Women were also asked to empty their bladders before performing the exam. Participants with pacemakers were not assessed due to safety contraindications. The first step comprised entering the sex, age and height data into the device. Subsequently, the participant stood barefoot on the four electrodes of the scale platform, wearing minimal clothes and without metal objects (earrings, rings, necklaces, bracelets). Straps with integrated electrodes were held in both hands, and the participants’ arms remained relaxed by their sides until the results appeared on the equipment’s display. The internal Tanita algorithm estimated BF percentage, FM and FFM measurements in kg.
Sociodemographic, anthropometric and health data collection
A structured questionnaire was administered at baseline to collect sociodemographic and reproductive data, including maternal age (18 and 19, 20–29 and 30–40 years), marital status (single or married/cohabiting), maternal education (schooling years, categorised in <8, 8–12 and >12 years), parity (primiparous or multiparous), total family income per month (US$, categorised in quartiles), maternal occupation (employed or unemployed) and self-reported skin colour (white, black, mixed and other). Pre-pregnancy BMI was classified as normal weight (18·5–24·9 kg/m2) or overweight (25·0–29·9 kg/m2). At visit C, another structured questionnaire was administered to collect details about the birth, such as the mode of delivery (caesarean section or vaginal) and the infant’s sex (male or female). The type of breastfeeding was classified according to WHO guidelines(23) at all follow-up visits as EBF or partial breastfeeding. Infants who received formula within the first 7 d after birth were still classified as EBF. This adjustment was established by the project’s central coordination to ensure feasibility, given the high frequency of formula supplementation during the immediate postpartum for hospitalised mothers with difficulties in initiating breastfeeding.
Statistical analysis
The distribution of all continuous variables was assessed based on the visual inspection of histograms, skewness and kurtosis measurements. Summary statistics were calculated as mean and sd for normally distributed variables, median and interquartile ranges for skewed variables and absolute (n) and relative frequencies (%) for categorical variables. To assess whether data were missing completely at random, we compared the characteristics of women who completed all follow-up visits with those who missed any visit using the Mann–Whitney U test, χ 2 test and t test, as appropriate.
BF, FM, FFM and BMI were the outcomes. BF, FM and FFM implausible values were evaluated using a visual inspection of box plots and histograms for each visit. Extreme measures were considered when they exceeded the z-score cut-off points (at 3 sd from the mean). Moreover, a longitudinal approach was applied to assess implausible changes over time, following the methodology described by Boone-Heinonen et al. (2019)(Reference Boone-Heinonen, Tillotson and O’Malley24). This approach allowed us to remove only the specific data points considered outliers, not the entire record. No outliers were found.
The mean values of BF, FM and FFM were initially described over time considering the visits (M1, M2 and M3). Repeated-measures ANOVA was used to compare the means of these outcomes across visits. Also, maternal factors (maternal age, parity, family income, ppBMI) and infant sex were analysed by ANOVA to provide a more exploratory view of the longitudinal data. Additionally, longitudinal linear mixed-effects models were fitted to describe temporal variations for each outcome, incorporating all available data points, including participants with incomplete follow-up, under the assumption that data were missing at random. These models included time (weeks postpartum) as the interaction term and estimated β-coefficients to provide a combined estimate of the associations between participants and within participants over time. Linearity was assessed using regression fractional polynomials described by Royston and Altman (1994)(Reference Royston and Altman25). No transformations were needed for the outcomes (BF, FM, FFM and BMI). The main effects were considered statistically significant when P-values were <0·05. Pearson residual plots were used to assess the linearity and homoscedasticity, and quantile-quantile plots were used to check the normality of the residuals.
Longitudinal linear mixed-effects models were also used to investigate what exposure factors would predict changes in each outcome. The first step in constructing these models was to apply bivariate mixed-effects models, assessing possible correlations between maternal and infant characteristics and the changes in BC and BMI over time. Possible covariates (maternal age, parity, family income, ppBMI, delivery mode, breastfeeding status and infant sex) were selected based on theoretical evidence of potential associations, and the final models included covariates with significance at P < 0·20 in the bivariate modelling(Reference David, Hosmer and Lemeshow26).
Interactions between maternal and infant factors and time (postpartum weeks) were tested to evaluate if the slope in maternal BC and BMI over time differed based on maternal-infant factors (ppBMI, family income, parity, maternal age, delivery mode and infant sex). The models were individually adjusted by specific confounders (e.g. parity, family income, maternal age, ppBMI). Statistical significance for interaction terms was considered when P < 0·10(Reference Altman, Bland and Altman27). Interaction plots containing longitudinal prediction and 95 % CI were constructed to depict BC and BMI trajectories according to the maternal-infant factors.
Only statistically significant results are presented using interaction plots and supplemental tables. Statistical analyses were performed using Stata statistical software (StataCorp), version 15.0, and the R software (lme4 package), version 4.3.2 (the R Foundation).
Results
Study design and participants
A total of 494 mother–infant dyads were recruited. However, only 234 mothers had BC and anthropometry assessed in at least one follow-up visit: M1 (n 217), M2 (n 167) and M3 (n 131) (Fig. 1).
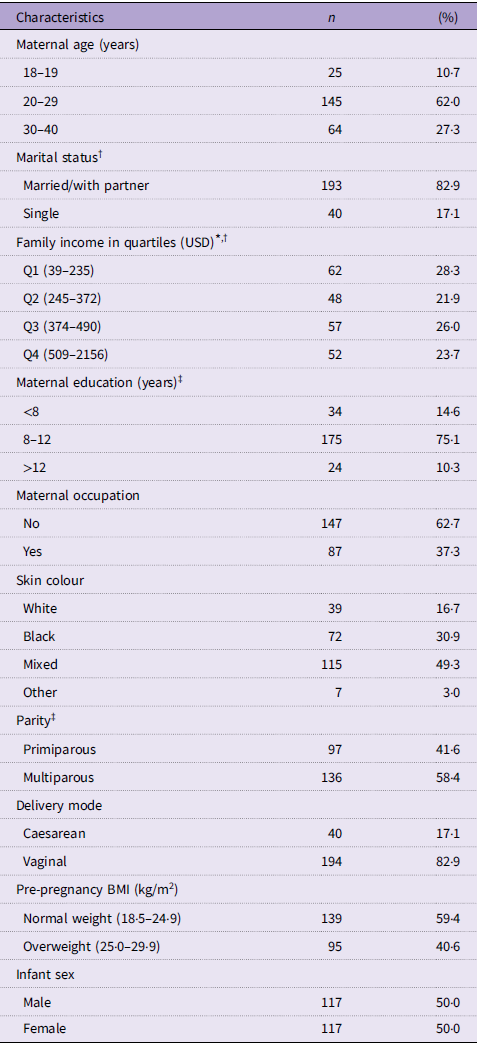
Sixty-two percent of the women were between 20 and 29 years, 75 % had 8–12 years of education, and 40·6 % were classified as pre-pregnancy overweight (Table 1). The women who completed all follow-ups (n 110) and those who were classified as a loss of follow-up at any visit (n 124) did not differ in their maternal and sociodemographic characteristics (online Supplementary Table 1).
Characteristics of the participants, Brazil (n 234) (Numbers and percentages)

USD, US dollar.
* Exchange rate from Real to USD (R$ 4·94 = USD 1) March 2020.
† n 219 because of missing data.
‡ n 233 because of missing data.
Maternal body composition and BMI postpartum trajectories
The mean BMI fell 0·2 kg/m2 (∼0·8 %) between 1 and 8·5 months (M1–M3). BF decreased by 0·1 %, whereas FFM decreased by 0·3 kg (M1–M3). Repeated-measures ANOVA showed significant differences over time (M1–M3). Women aged ≥ 30 at baseline and those with pre-pregnancy overweight showed higher BF and FM compared with younger women and those with normal weight, respectively. Additionally, multiparous women exhibited a higher mean BF than primiparous women (M1–M3) (data not shown in Table).
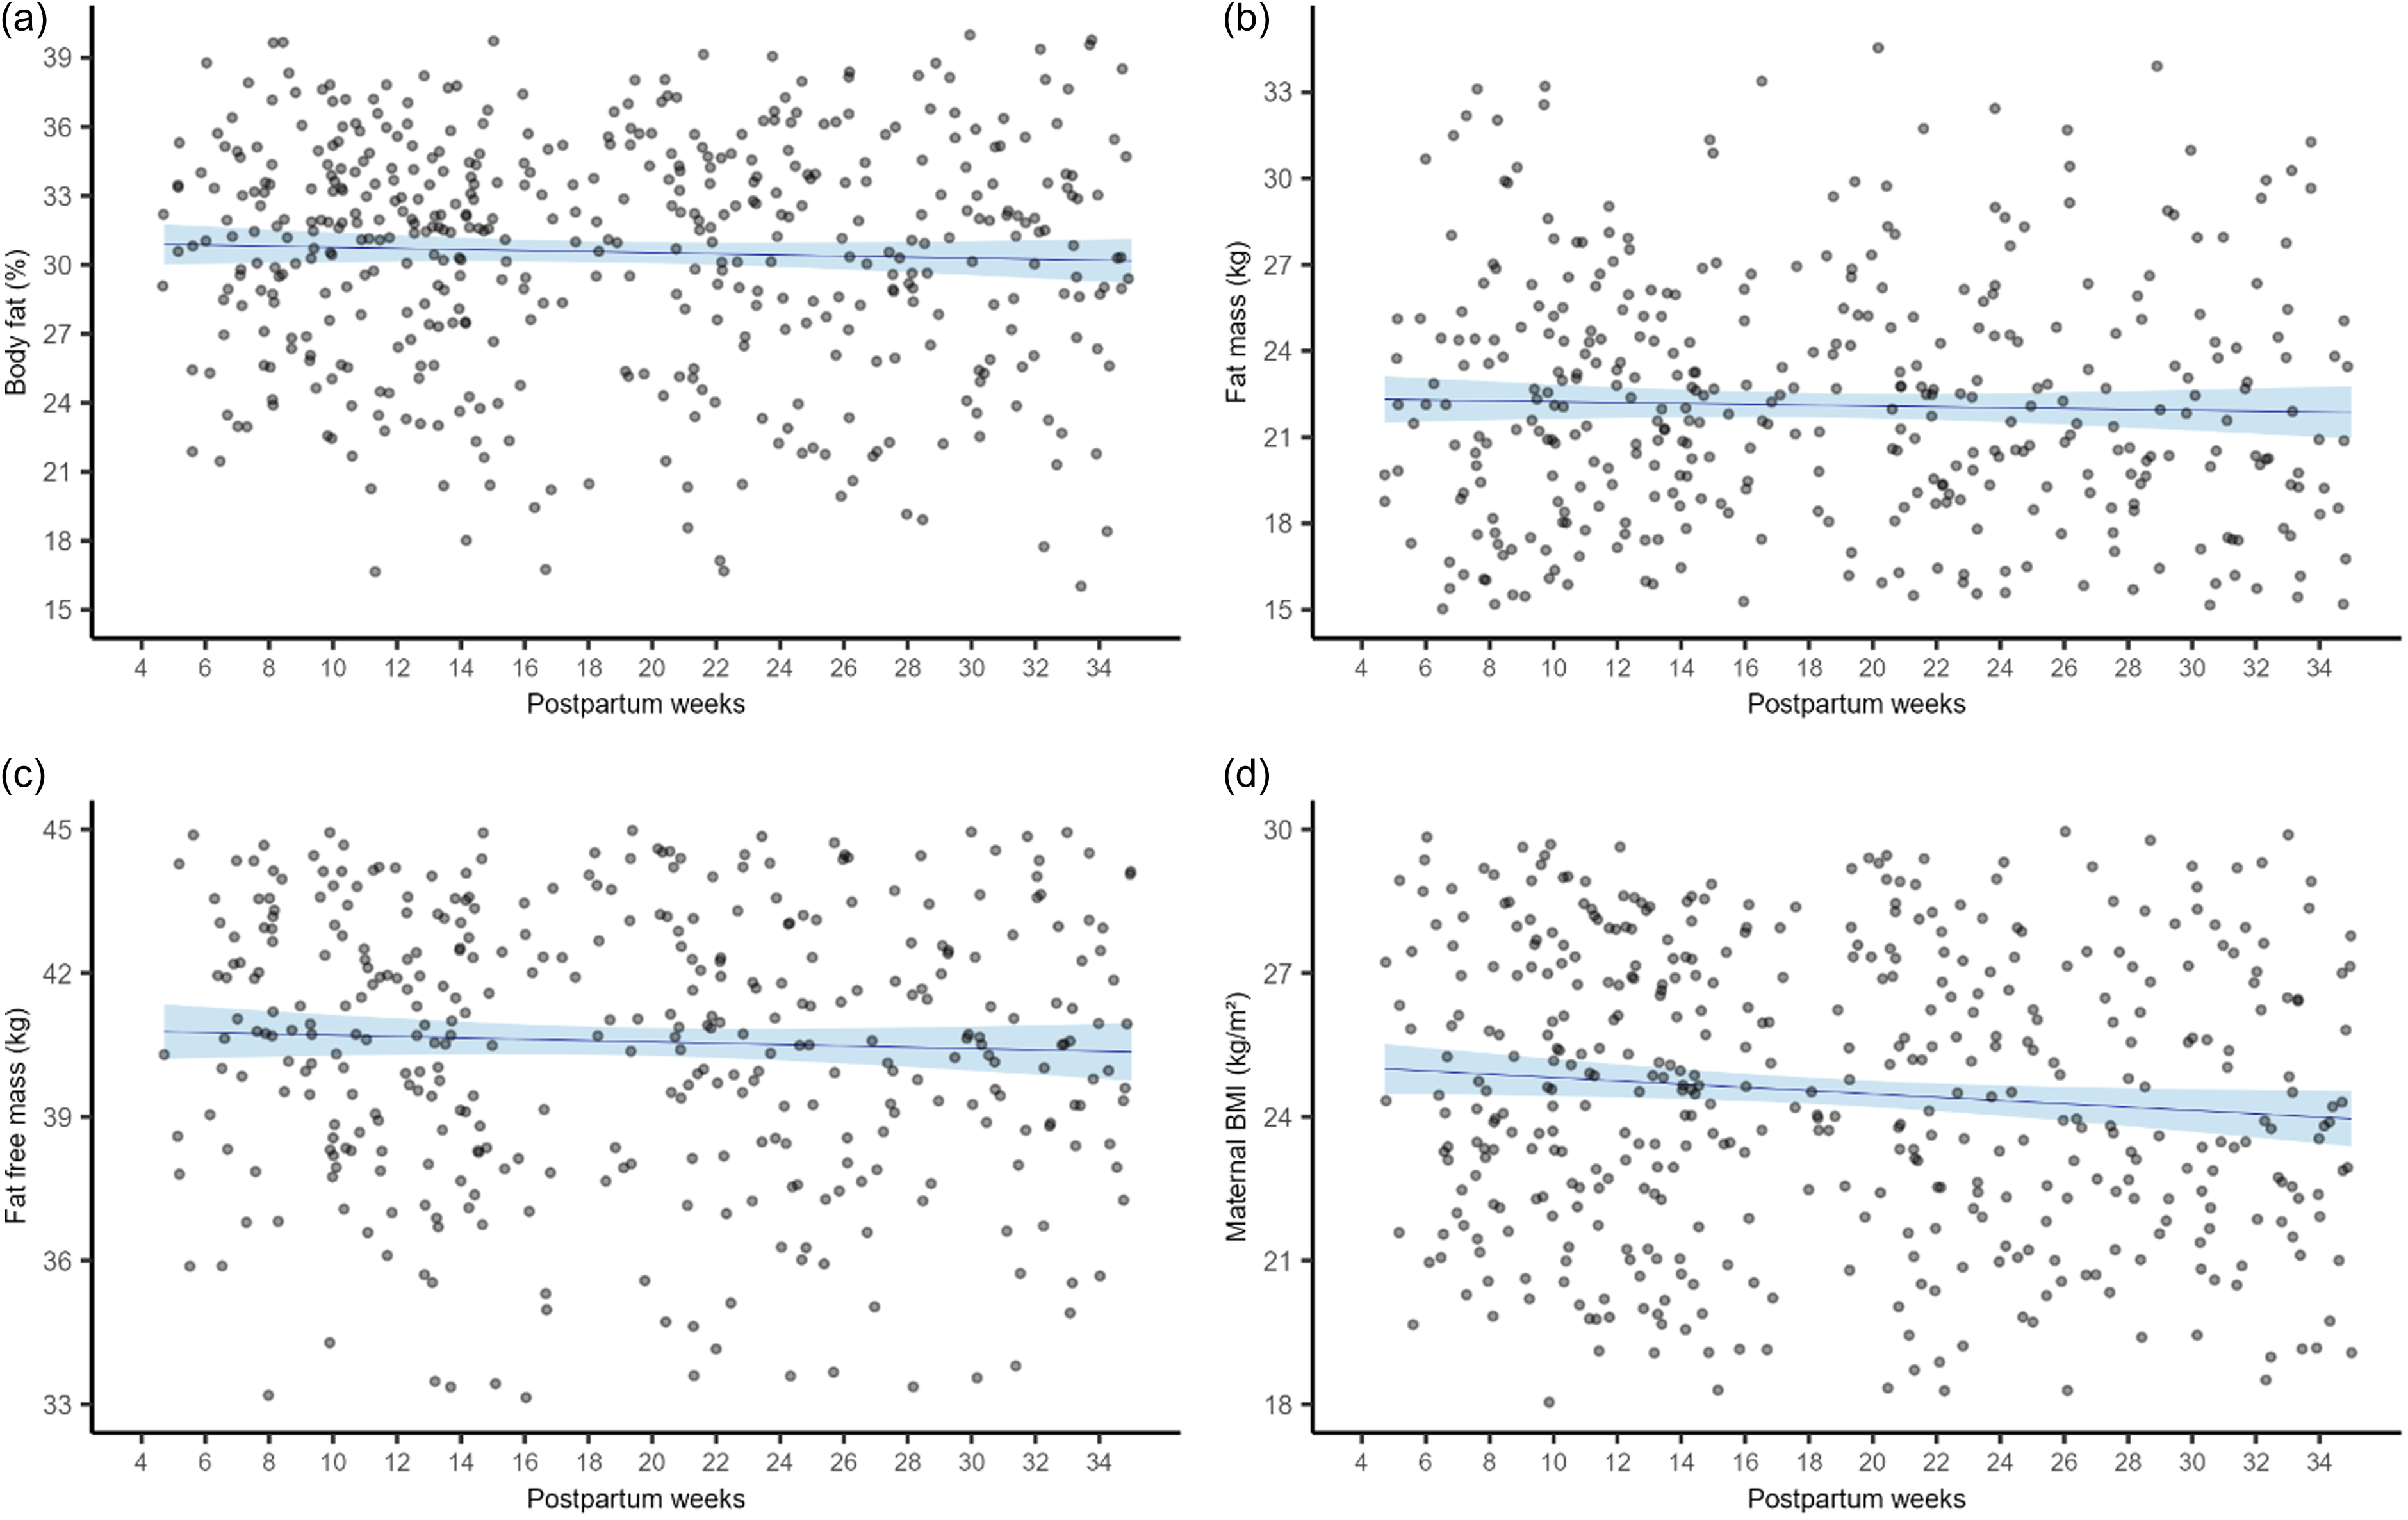
FFM reduced significantly throughout the study period, with a mean loss of 0·024 kg per week (95 % CI –0·03, −0·01; P < 0·001). BMI also showed a borderline reduction of 0·009 kg/m2 (95 % CI –0·01, 1·57; P = 0·054) per week. BF (95 % CI −0·02, 0·02; P = 0·98) and FM (95 % CI –0·22, 0·02; P = 0·83) remained stable over time (Fig. 2).
Longitudinal predictions of maternal body composition and BMI between 1 and 8·5 months postpartum, Brazil (n 234). Notes: Longitudinal linear mixed-effect models for each maternal body component and BMI were performed. The beta-coefficients (β) and 95 % CI represent body constituents (body fat, fat mass and fat-free mass) trajectories according to postpartum weeks. (a) Body fat (%): β = −0·000 (–0·02, 0·02); P-value = 0·98. (b) Fat mass (kg): β = 0·002 (–0·22, 0·02); P-value = 0·83. (c) Fat-free mass (kg): β = −0·024 (–0·03, −0·01); P-value < 0·001. (d) BMI (kg/m2): β = −0·009 (–0·01, 1·57); P-value = 0·05. Number of observations: from 4 to 14 weeks (M1): n 217; from 15 to 24 weeks (M2): n 167; from 16 to 34 weeks (M3): n 131.

Factors associated with maternal body composition and postpartum BMI trajectories
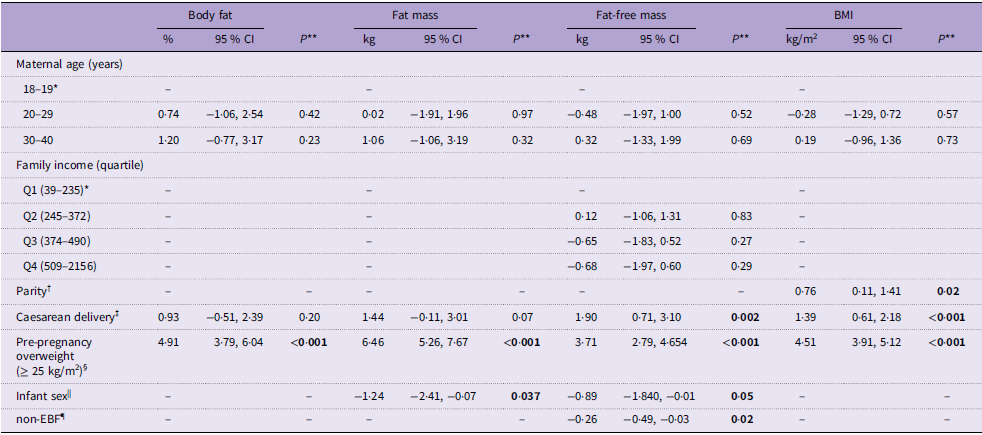
Pre-pregnancy overweight women experienced a significant increase in the mean of all assessed body components (BF: β = 4·91 %, 95 % CI 3·79, 6·04; FM: β = 6·46 kg, 95 % CI 5·26, 7·67; FFM: β = 3·72 kg, 95 % CI 2·79, 4·65) and BMI (β = 4·51 kg/m2, 95 % CI 3·91, 5·12) throughout the study period compared with normal weight women. Multiparous women had a greater BMI (β = 0·76 kg/m2, 95 % CI 0·11, 1·41) than primiparous women, while those who delivered by caesarean section, compared with vaginal delivery had greater FFM (β = 1·90 kg, 95 % CI 0·71, 3·10) and BMI (β = 1·39 kg/m2, 95 % CI 0·61, 2·18). Women who gave birth to girls experienced a reduction in the mean FM (β = −1·24 kg; 95 % CI –2·41, −0·07) and FFM (β = −0·89 kg; 95 % CI –1·84, −0·01) compared with mothers who had delivered boys. Women in non-EBF had lower FFM (–0·26 kg; 95 % CI –0·49, −0·03) over time than those in EBF (Table 2).
The maternal and infant factors associated with maternal body composition and BMI between 1 and 8·5 months postpartum, Brazil (n 234)

Non-EBF, non-exclusive breastfeeding.
Note: Longitudinal linear mixed-effects (LME) models were used to assess predictors of changes in body composition and BMI. Bivariate mixed-effects models identified correlations between maternal and infant factors and these outcomes. Covariates were selected based on theoretical evidence and included in the final LME models if significant at P < 0·20 in bivariate analysis.
*Reference category; **Refers to maximum likelihood estimator.
The boldface indicates statistical significance for P-values is ≤ 0·05.
† Multiparous compared with primiparous.
‡ Compared with vaginal.
§ Compared with normal weight (≥ 18·5 and ≤ 24·9 kg/m2).
|| Women who gave birth to females compared with males.
¶ Compared with exclusive breastfeeding.
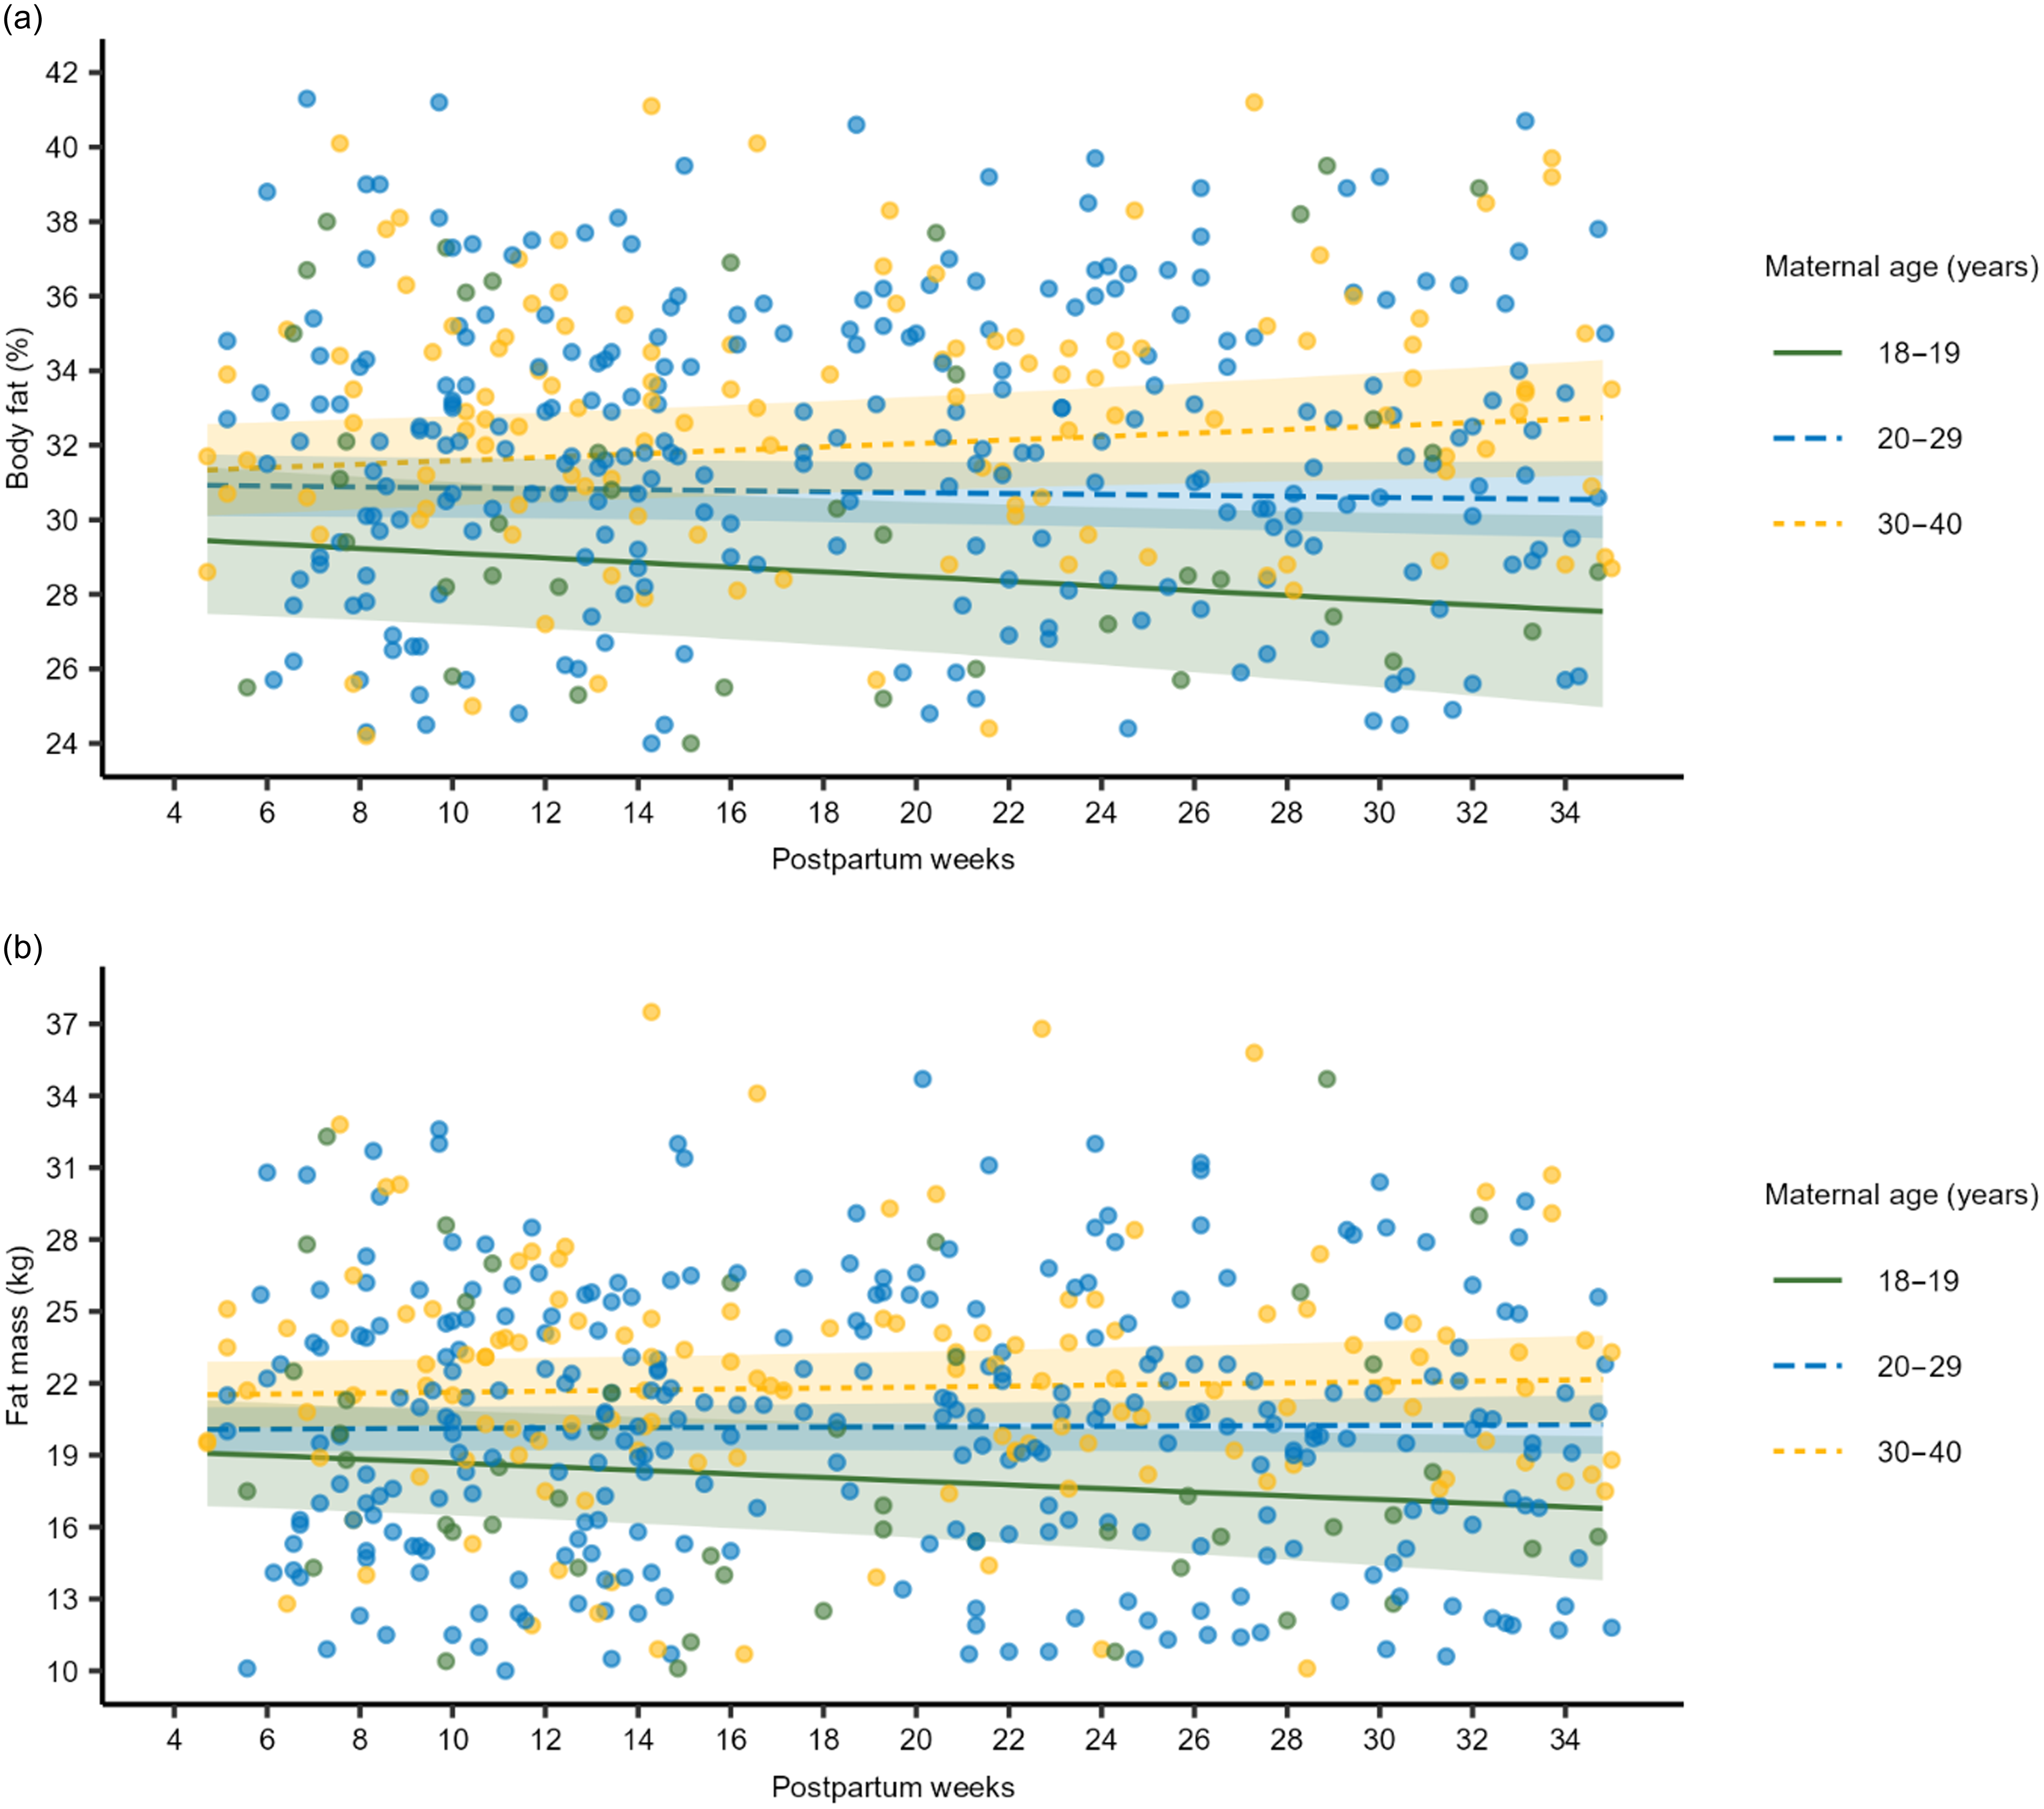
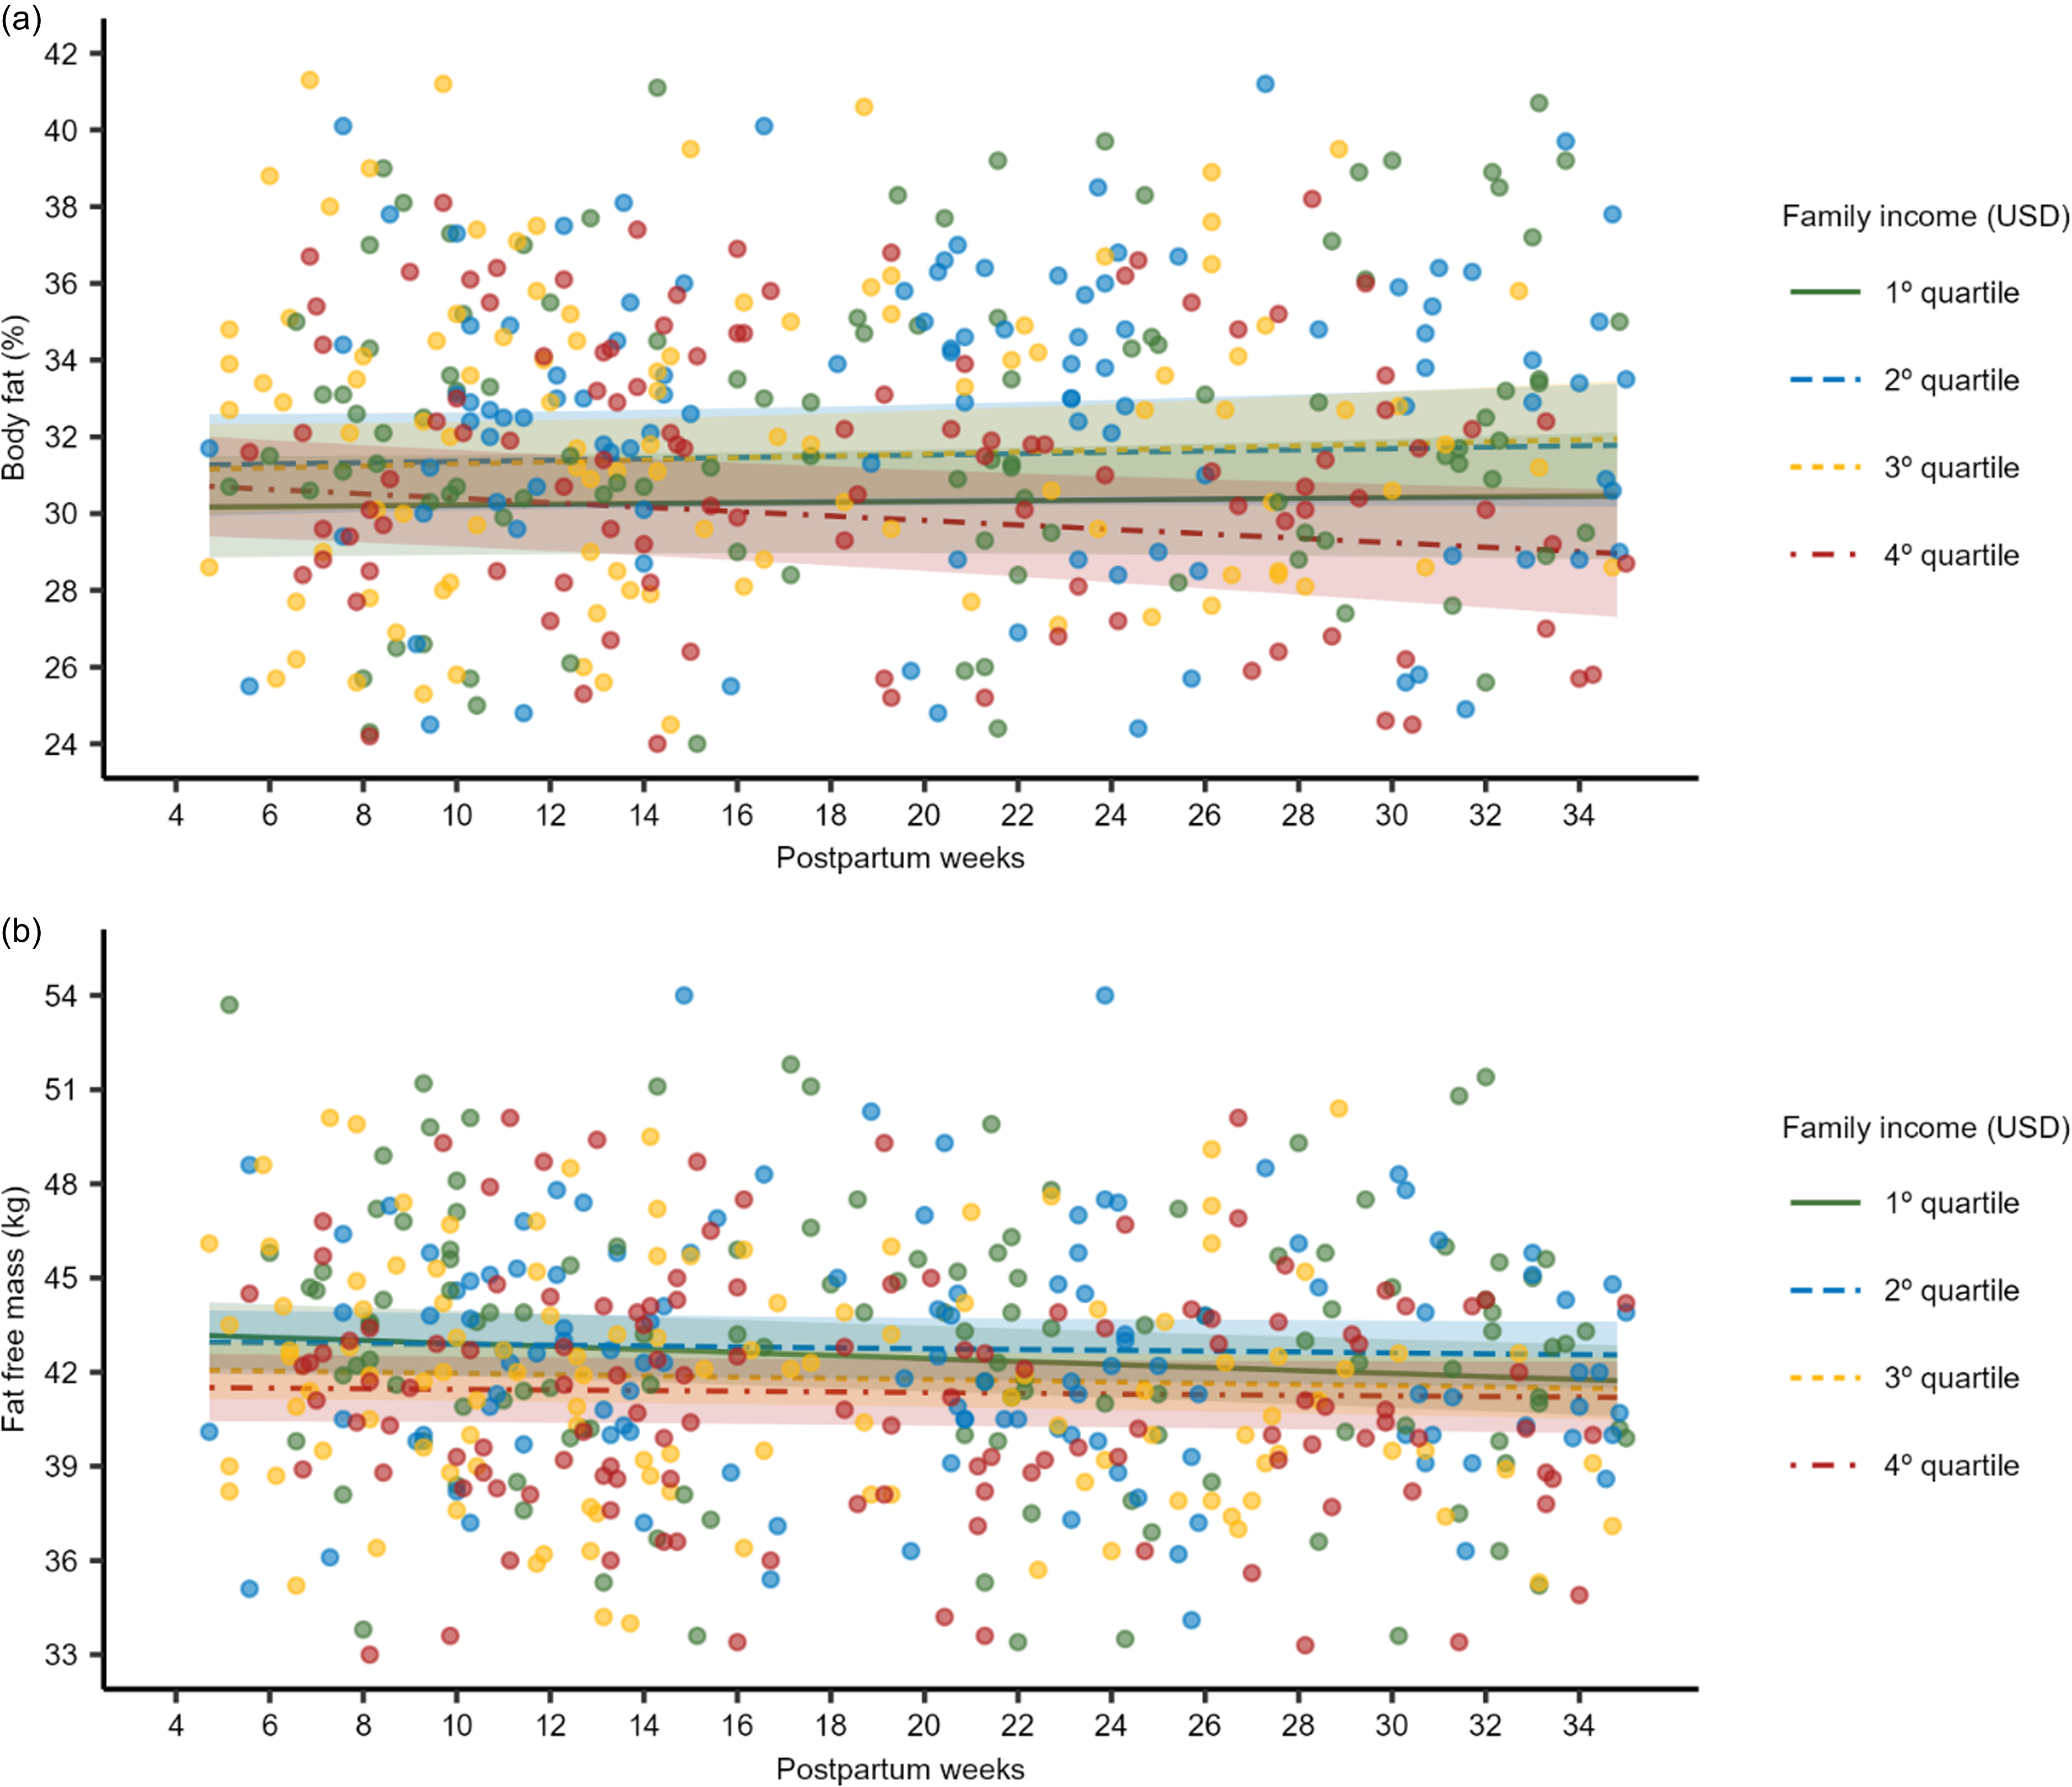
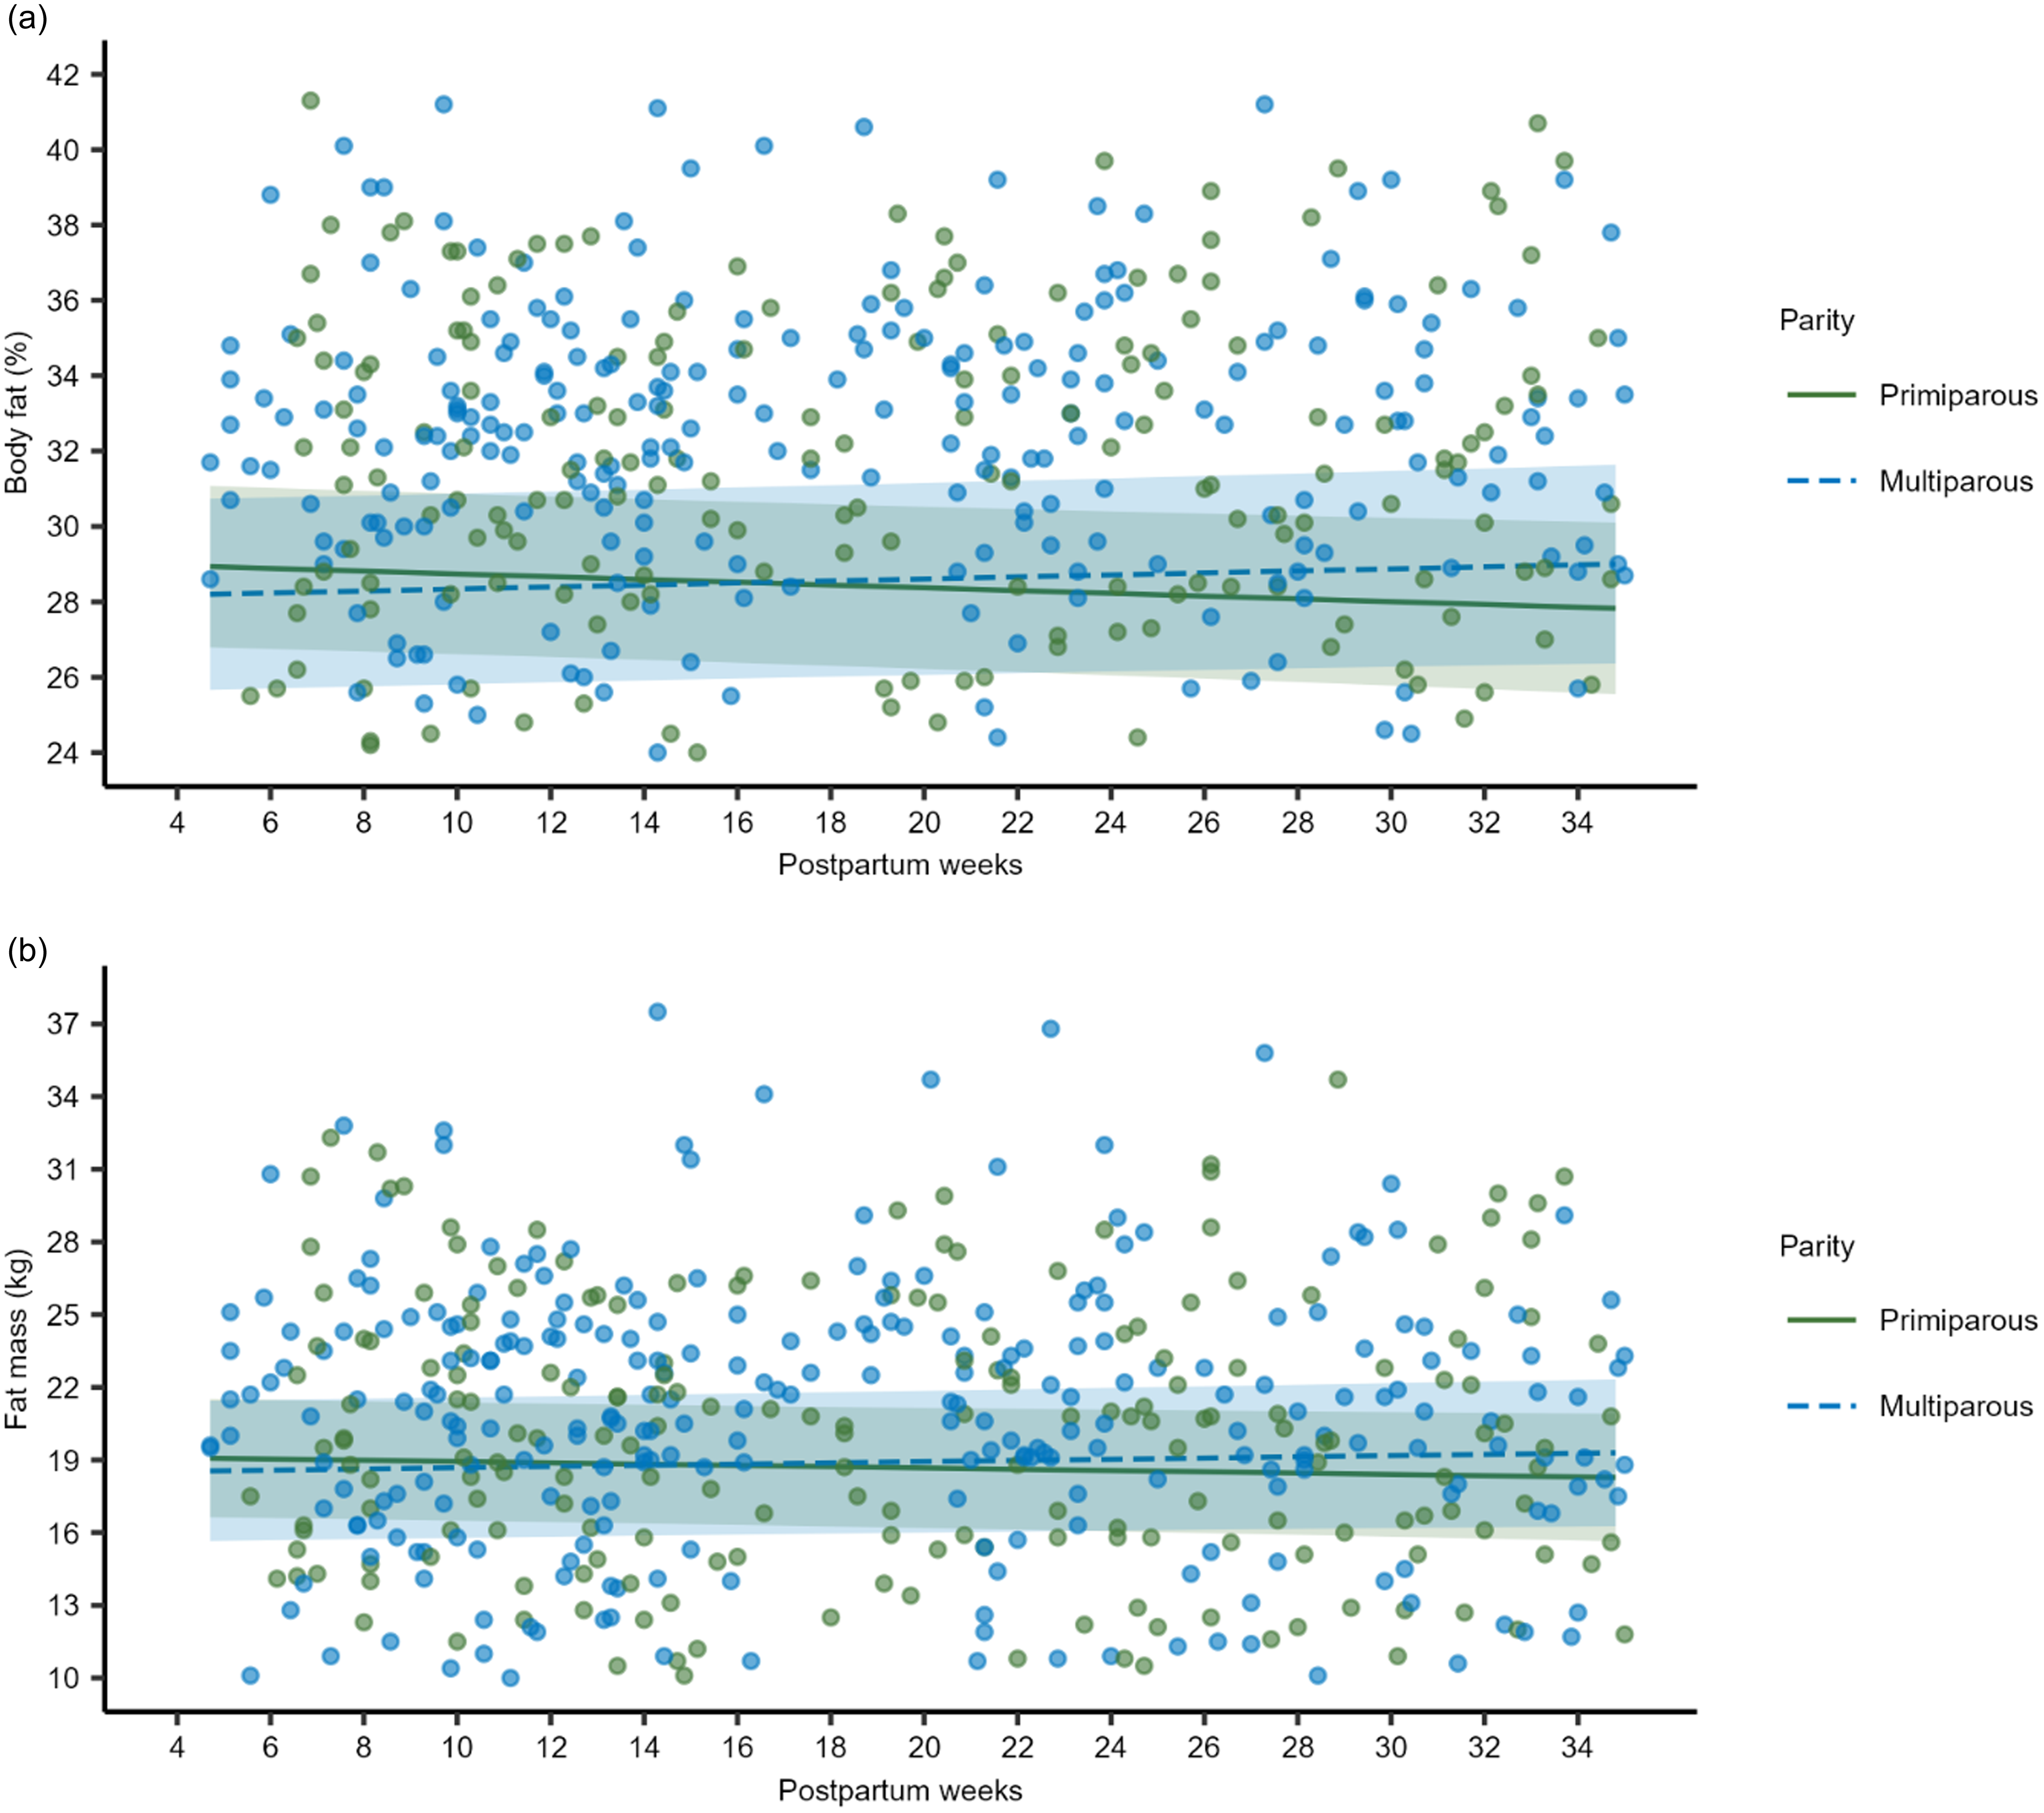
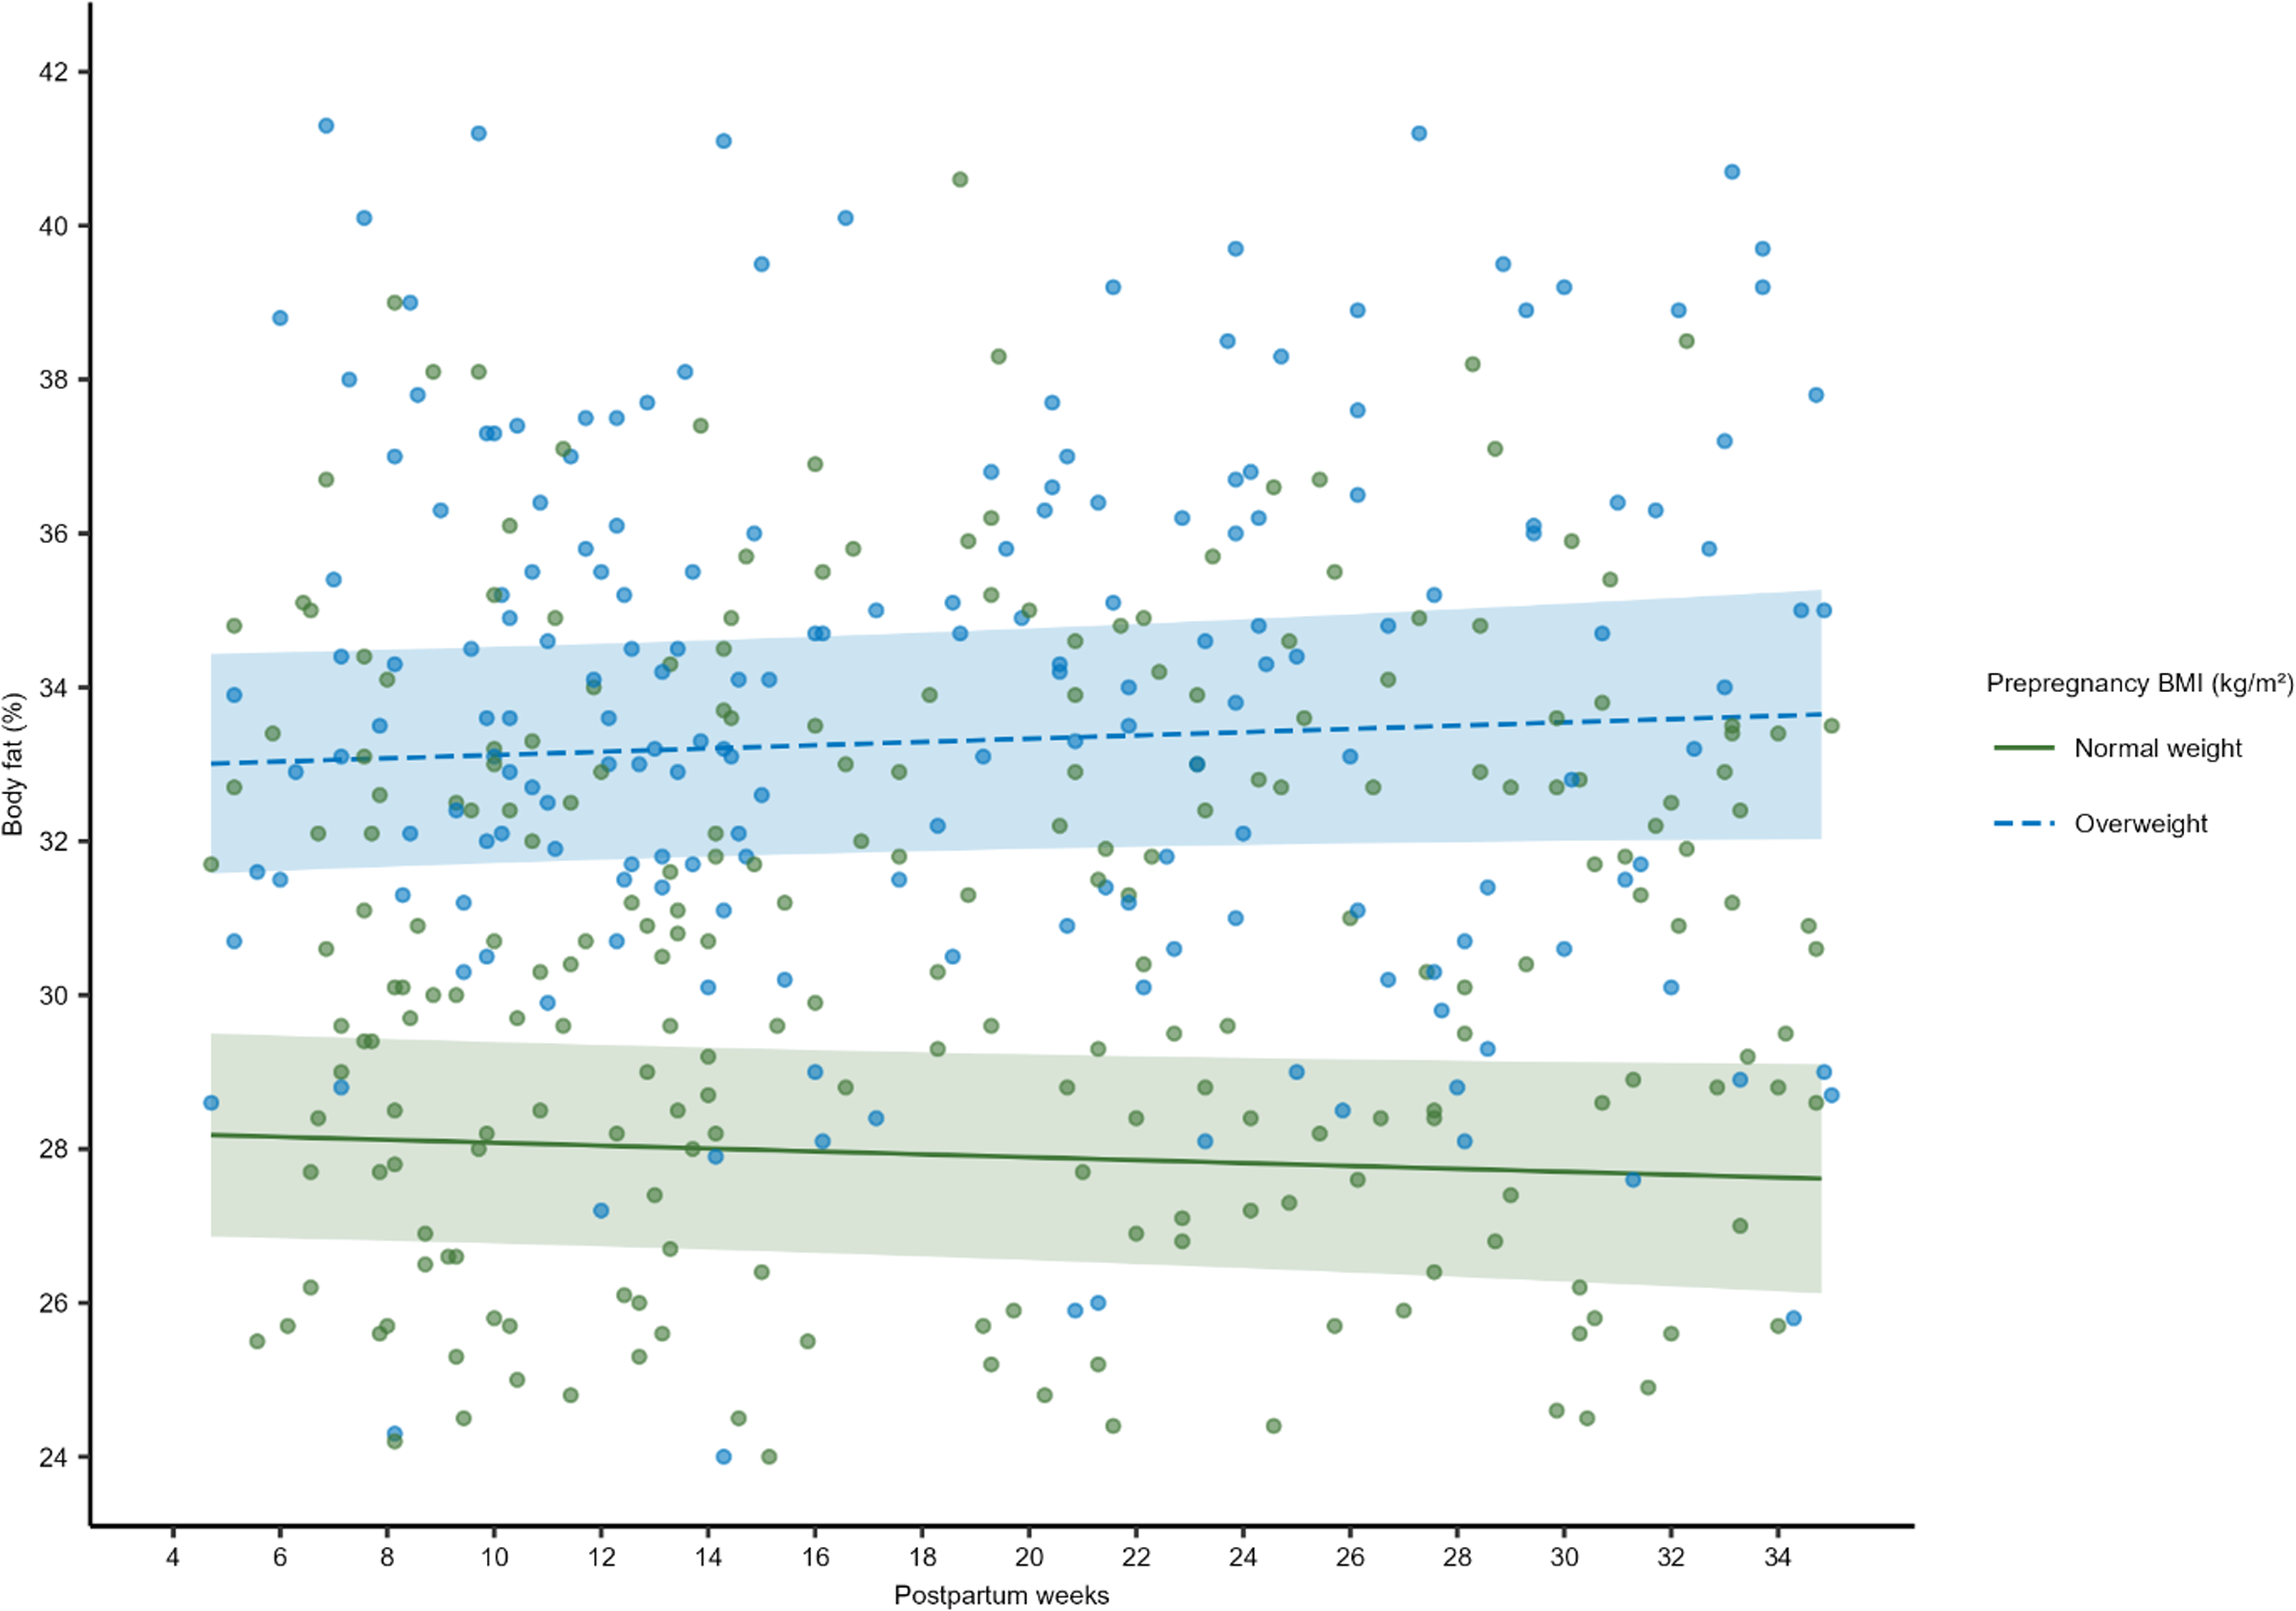
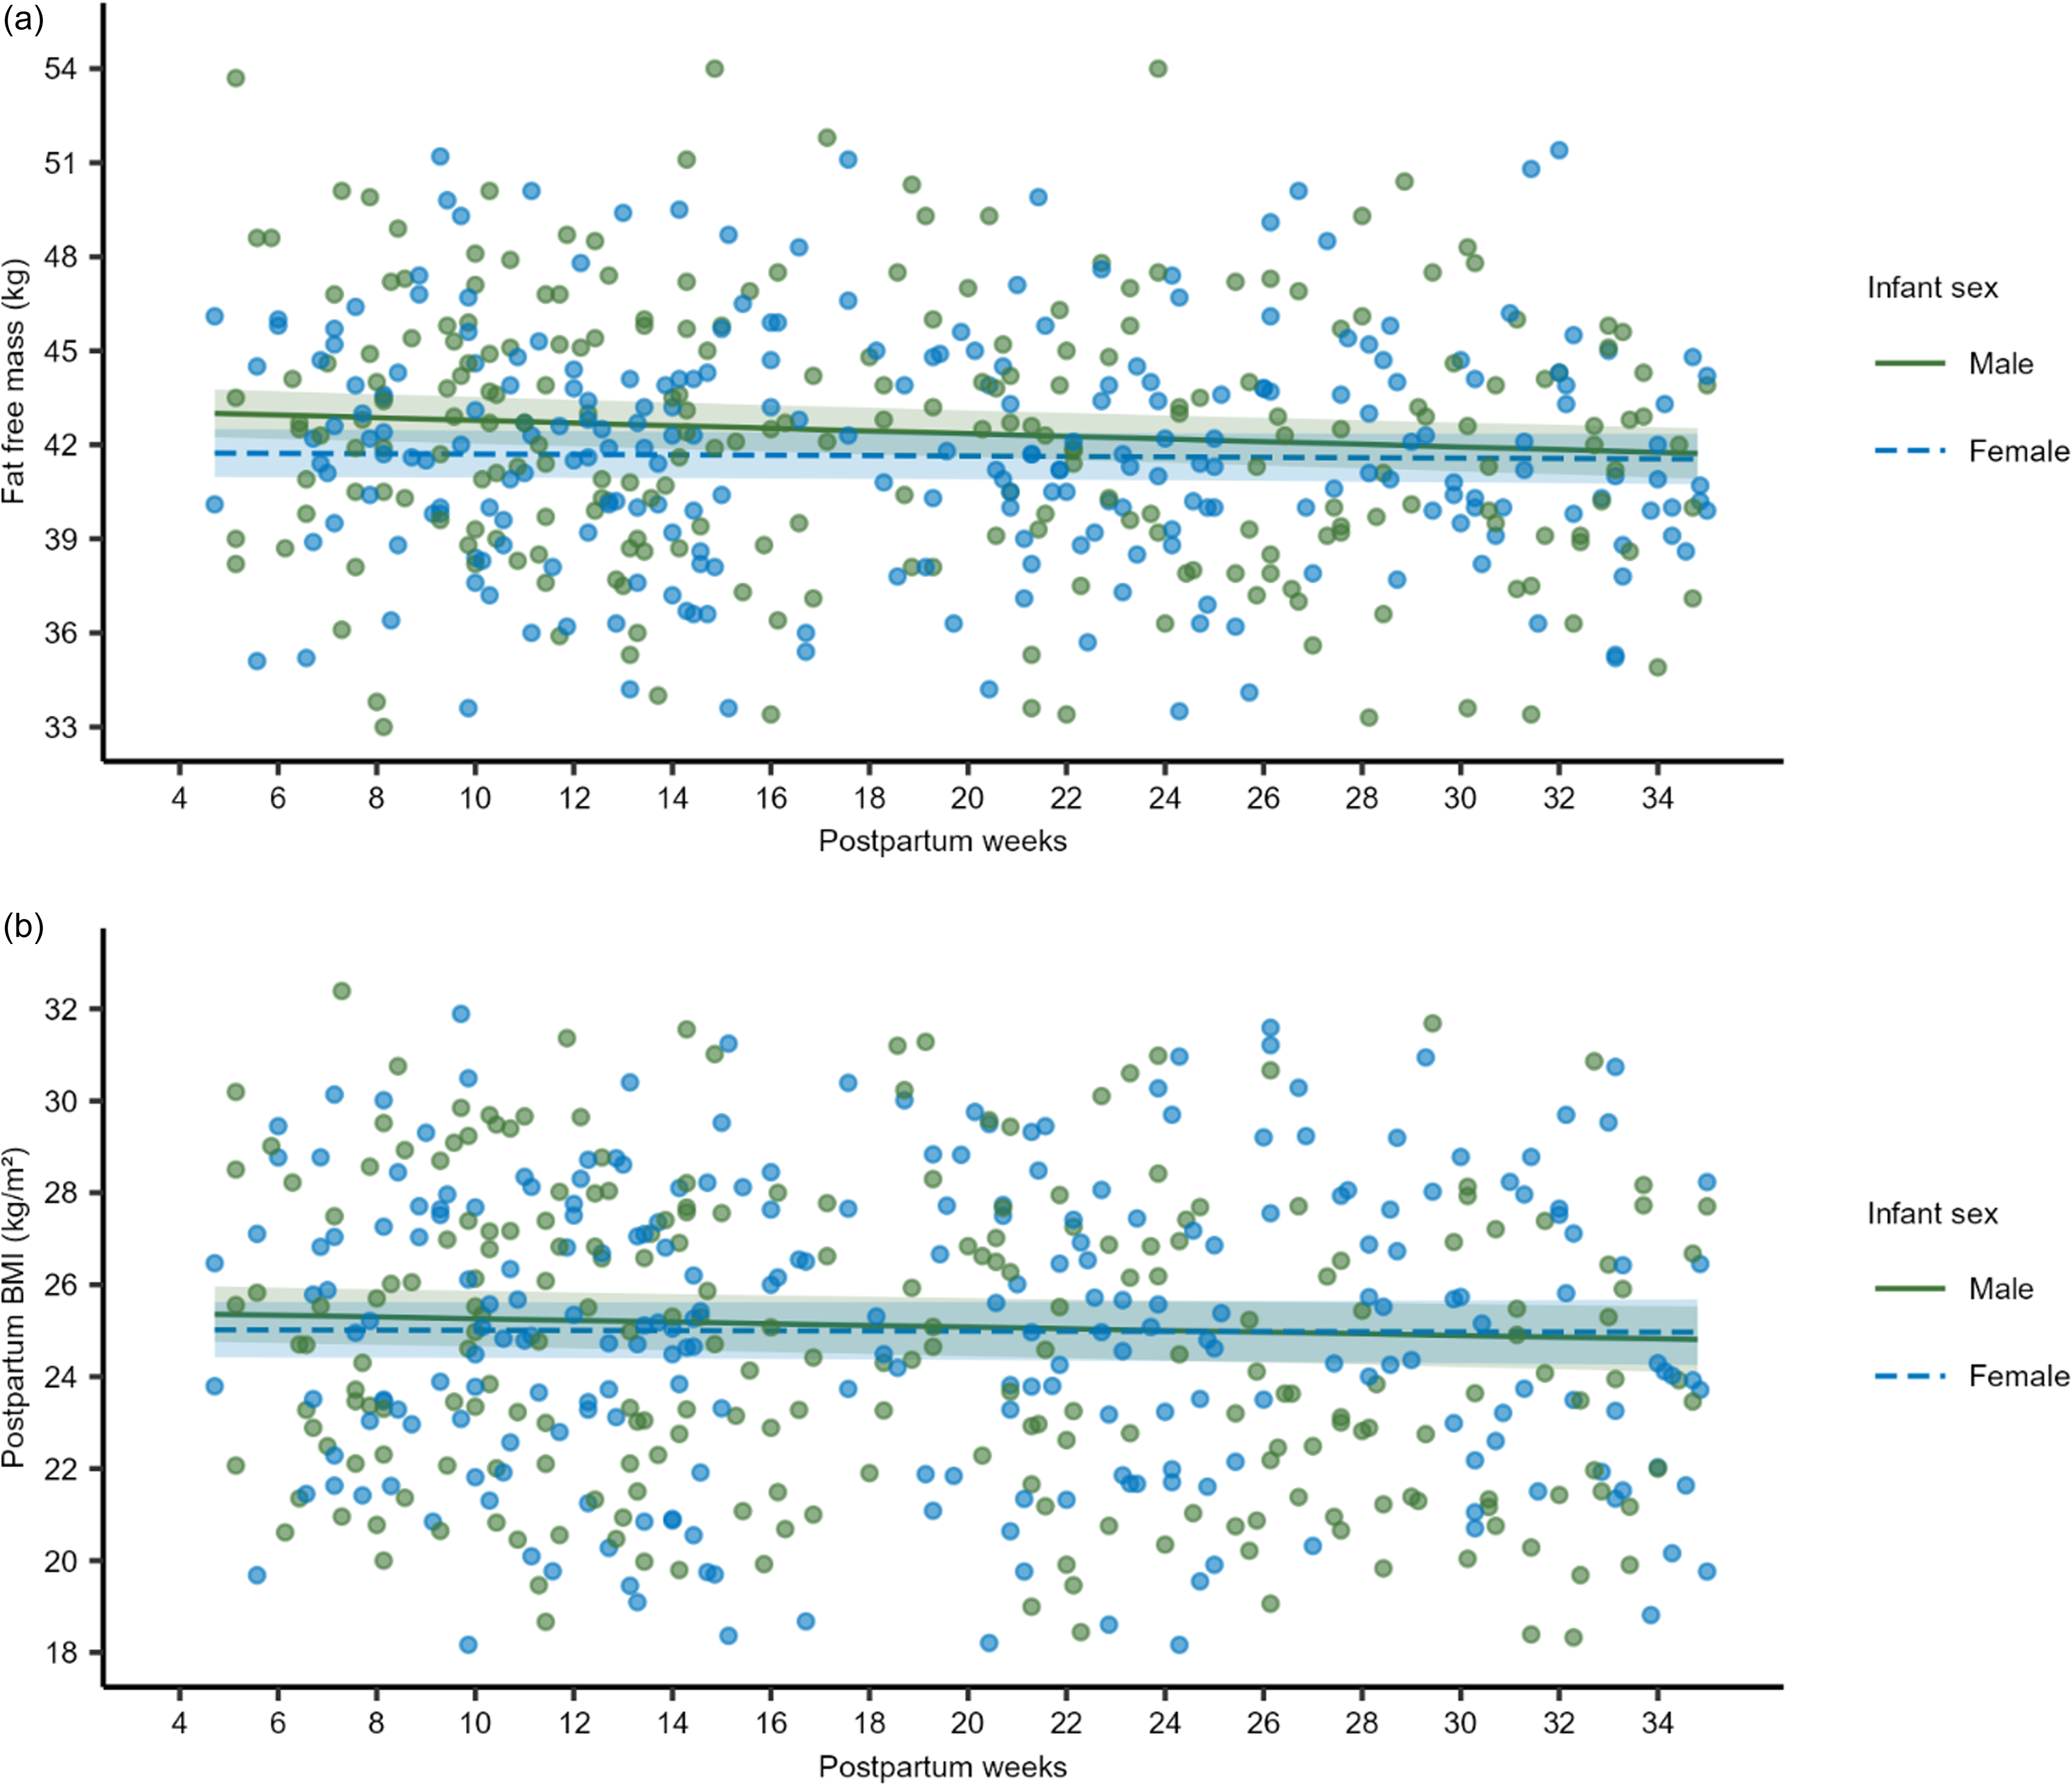
Women aged ≥ 30 years had a greater increase in BF (β interaction = 0·10%; 95% CI 0·02, 0·19; P = 0·01) and FM (β interaction = 0·09 kg; 95% CI 0·00, 0·18; P = 0·03) per week throughout the study period compared with those in the ≤19 years group (Fig. 3, online Supplementary Table 2). Women from the highest income quartile at baseline exhibited a reduction in BF (β interaction = −0·06%; 95% CI –0·13, −0·00; P = 0·03) and an increase in FFM (β interaction = 0·03 kg; 95% CI 0·00, 0·07; P = 0·02) per week compared with those in the lowest quartile (Fig. 4) (online Supplementary Table 3). Multiparous women showed an increase in BF (β interaction = 0·06 %; 95% CI 0·01, 0·10; P < 0·01) and FM (β interaction = 0·05 kg; 95% CI 0·00, 0·10; P = 0·04) per week compared with primiparous women (Fig. 5, online Supplementary Table 4). Additionally, women who were overweight pre-pregnancy experienced a significant increase in BF (β interaction = 0·04 %; 95% CI –0·00, 0·08; P = 0·08) per week compared with pre-pregnancy normal-weight women (Fig. 6, online Supplementary Table 5). The mothers who delivered a girl had a more pronounced increase in FFM (β interaction = 0·03 kg; 95% CI 0·01, 0·05; P < 0·01) and BMI (β interaction = 0·01 kg/m2; 95% CI –0·00, 0·03; P = 0·09) per week compared with those who gave birth to boys (Fig. 7, online Supplementary Table 6). Delivery mode and EBF status did not reveal any significant interactions with changes in BC and BMI over time (online Supplementary Tables 7 and 8).
Longitudinal predictions of maternal body fat (%) and fat mass (kg) between 1 and 8·5 months postpartum according to maternal ages, Brazil (n 234). Notes: Longitudinal linear mixed-effect models for maternal body components were performed. Beta-coefficient interactions (β interaction) and 95 % CI were estimated. These parameters were utilised to assess maternal age’s effect on each body component’s trajectory. (a) Body fat (%): β interaction = 0·10 (0·02, 0·19); P-value = 0·01. (b) Fat-free mass (kg): β interaction = 0·09 (0·00, 0·18); P-value = 0·03. Number of observations of body composition and BMI: from 4 to 14 weeks (M1): n 217; from 15 to 24 weeks (M2): n 167; from 16 to 34 weeks (M3): n 131. Number of participants between 18 and 19 years old: n 25. Number of participants between 20 and 29 years old: n 145. Number of participants between 30–40 years old: n 64.

Longitudinal predictions of maternal body fat (%) and fat-free mass (kg) between 1 and 8·5 months postpartum according to quartiles of total family income, Brazil (n 234). Notes: Longitudinal linear mixed-effect models for maternal body components were performed. Beta-coefficient interactions (β interaction) and 95 % CI were estimated. These parameters were utilised to assess the effect of family income (US dollar, USD) on the trajectory of each body component. (a) Body fat (%): β interaction = −0·06 (–0·13, −0·00); P-value = 0·03. (b) Fat-free mass (kg): β interaction = 0·03 (0·00, 0·10); P-value = 0·02. Number of participants: from 4 to 14 weeks (M1): n 217; from 15 to 24 weeks (M2): n 167; from 16 to 34 weeks (M3): n 131. Number of participants in 1st quartile (39–235 USD): n 62. Number of participants in 2nd quartile (245–372 USD): n 48. Number of participants in 3rd quartile (374–490 USD): n 57. Number of participants in 4th quartile (509–2156 USD): n 52.

Longitudinal predictions of maternal body fat (%) and fat mass (kg) between 1 and 8·5 months postpartum according to parity, Brazil (n 234). Notes: Longitudinal linear mixed-effect models for maternal body components were performed. The models were adjusted for family income and maternal age. Beta-coefficient interactions (β interaction) and 95 % CI were estimated by comparing changes in maternal body composition of multiparous to primiparous. These parameters were utilised to assess parity’s effect on each body component’s trajectory. (a) Body fat (%): β interaction = 0·06 (0·01, 0·10); P-value < 0·01). (b) Fat mass (kg): β interaction = 0·05 (0·01, 0·10), P-value = 0·04. Number of participants: from 4 to 14 weeks (M1): n 217; from 15 to 24 weeks (M2): n 167; from 16 to 34 weeks (M3): n 131. Number of multiparous: n 136. Number of primiparous: n 97.

Longitudinal predictions of maternal body fat (%) between 1 and 8·5 months postpartum according to pre-pregnancy BMI, Brazil (n 234). Notes: Longitudinal linear mixed-effect model for body fat (%) was performed. The model was adjusted for parity and family income. Beta-coefficient interactions (β interaction) and 95 % CI were estimated. These parameters were estimated to assess the effect of pre-pregnancy BMI on maternal body fat (%) trajectory, comparing women who began pregnancy overweight (BMI ≥ 25 kg/m2) with those who began with normal weight (BMI ≥ 18·5 kg/m2 and ≤ 24·9 kg/m2). (a) Body fat (%): β interaction = 0·04 (–0·00, 0·08); P-value = 0·08. Number of observations of body fat (%): from 4 to 14 weeks (M1): n 217; from 15 to 24 weeks (M2): n 167; from 16 to 34 weeks (M3): n 131. Number of participants with pre-pregnancy overweight: n 95. Number of participants with pre-pregnancy normal weight: n 139.

Longitudinal predictions of maternal fat-free mass (kg) and BMI between 1 and 8·5 months postpartum according to infant sex, Brazil (n 234). Notes: Longitudinal linear mixed-effect model for fat-free mass and BMI were performed. Beta-coefficient interactions (β interaction) and 95 % CI were estimated. These parameters were estimated to assess the effect of infant sex on maternal fat-free mass and BMI trajectories, comparing women who gave birth to females with those who gave to males. (a) Fat-free mass (kg): β interaction = 0·03 (0·01, 0·05); P-value < 0·01. (d) BMI (kg/m2): β interaction = 0·01 (–0·00, 0·03); P-value = 0·09. Number of observations of fat-free mass and BMI: from 4 to 14 weeks (M1): n 217; from 15 to 24 weeks (M2): n 167; from 16 to 34 weeks (M3): n 131. Number of males: n 117. Number of females: n 117.

Discussion
Our findings revealed that FFM and BMI significantly reduced over the first 8·5 months of lactation. Moreover, pre-pregnancy overweight, multiparity, delivery by caesarean section, infant sex and non-EBF were associated with maternal BC and BMI changes. We also identified that maternal age ≥ 30 years, higher family income, multiparity, pre-pregnancy overweight and infant sex are factors that can modify the effect of time on maternal BMI and BF, FM and FFM.
The observed decrease in maternal BMI seems modest (∼0·8 %), but it holds clinical significance, as even small reductions can have long-term health benefits. It is estimated that a 1 % reduction in BMI could reduce the risk of obesity-related complications over 20 years(Reference Wang, McPherson and Marsh28). Additionally, this reduction was expected since our cohort exclusively breastfed for at least 3·5 months and continued some breastfeeding until their final study visit (6–8·5 months). Similar results have been observed in other studies with samples from Morocco(Reference Rabi, Benjeddou and Idrissi29) and Turkey(Reference Aydin and Yalçin30). Previous findings from the literature have described that breastfeeding is a predictor of postpartum weight loss(Reference Kac, Benício and Velásquez-Meléndez31,Reference da Silva, Oliveira Assis and Pinheiro32) , which contributes to the reduction in maternal BMI.
We observed a reduction in FFM in the study sample (0·720 kg on average from 1 to 8·5 months postpartum); however, we found no significant modification in BF and FM. Our findings contrast with those reported in the literature, including data from Moroccan(Reference Choua, El Kari and El Haloui33) and Swedish samples(Reference Sohlström and Forsum34), which observed a reduction in FM and an increase in FFM during the first 6 months postpartum in lactating women. On the other hand, Rabi et al. (2021)(Reference Rabi, Benjeddou and Idrissi29), in another Moroccan study which tracked breastfeeding women for a similar duration to our study, found a significant reduction in Fat Mass Index between the first and 12th months and in Fat-Free Mass Index between the first and third months. These results confirm that the metabolic demands imposed by lactation exhibit high variability(Reference Butte and Hopkinson10).
The women who were overweight before pregnancy showed an increase in the mean of all BC components and BMI over time. These findings agree with those observed in other studies, where ppBMI has been linked to the pattern of maternal BF accumulation, distribution and retention(Reference Soltani and Fraser7,Reference Subhan, Shulman and Yuan35) . Previous studies using data from a US sample have also demonstrated that women with pre-pregnancy overweight experience slower and less weight loss compared with those with pre-pregnancy normal weight, while those with pre-pregnancy obesity gain weight. At 1 year postpartum, regardless of infant feeding practices (lactating or non-lactating), mothers with pre-pregnancy normal weight experience BMI reduction, whereas those with pre-pregnancy obesity undergo BMI gain(Reference Smethers, Trabulsi and Stallings36).
The mechanisms behind these variations in fat accretion among women starting pregnancy with different BMI remain unclear. However, these differences may be attributed to metabolic adaptations during pregnancy, such as decreased insulin sensitivity and altered lipid metabolism(Reference Lain and Catalano37). These changes, in turn, may influence gestational weight gain, which has been associated with postpartum FM retention(Reference Butte, Ellis and Wong38). In early pregnancy, women undergo a decline in insulin sensitivity, leading to increased lipogenesis and fat storage to meet energy requirements for maternal and fetal needs. As pregnancy progresses, insulin sensitivity decreases, and women with less adipose tissue display a smaller overall reduction. In addition, obese women show a negative correlation between reduced insulin sensitivity and increased FM(Reference Iva39).
There are no studies describing that women who delivered through caesarean section had an increase in postpartum BMI and FFM means over time compared with women who had a vaginal delivery. However, the delivery mode has been associated with postpartum weight retention, and its role in BMI trajectory can’t be ruled out(Reference Kapinos, Yakusheva and Weiss40). In a study that followed primiparous women from delivery to 3 years after birth, it was observed that women who gave birth through caesarean section were more likely to retain > 4·5 kg at the end of 12 months postpartum compared with those who had a vaginal delivery(Reference Legro, Lehman and Kjerulff17). In addition, the caesarean section is associated with longer recovery time due to abdominal surgery and anaesthesia(Reference Mawson, Bumrungphuet and Manonai41) and a reduction in EBF duration(Reference Hobbs, Mannion and McDonald42,Reference Wu, Wang and Huang43) , which is recognised as a contributor to postpartum weight loss(Reference Tahir, Haapala and Foster44). The sum of the greater risk of retaining weight with the early EBF interruption may be the reason behind the positive association between caesarean delivery and BMI trajectory.
The multiparous women experienced an increase in mean BF over time. They also gained on average, more FM per week than primiparous women. The available literature on its association with maternal BC trajectory remains limited. A cross-sectional study including women from the USA revealed that well-nourished women tend to accumulate more BF per reproductive cycle. Also, multiparous women had higher weights and increased body mass and fat with age(Reference Lassek and Gaulin45). In contrast, a study comparing the BF trajectories between primiparous and multiparous mothers, from pregnancy to 6–8 months postpartum, found that primiparous had higher BF gains during pregnancy and were more likely to retain it after 6 months of delivery(Reference To and Wong16). Additionally, current literature describes a positive association between parity and ppBMI(Reference Hill, Bergmeier and McPhie46), its potential role as a risk factor for long-term obesity(Reference Pacyga, Henning and Chiang47) and postpartum weight retention(Reference Hill, McPhie and Skouteris48,Reference Sha, Cheng and Li49) . These results highlight the complexity of parity being directly associated with our outcomes, as it is also associated with other inter-conception factors, such as postpartum weight retention, FM accumulation in each reproductive cycle and increases in ppBMI.
Interestingly, our study revealed that giving birth to girls predicts lower mean values of FM and FFM over time. However, in terms of FFM, although these women had lower average FFM, they gained slightly more FFM per week compared with mothers of boys. One possible explanation for that result could be the different nutritional demands between the sexes, which may alter the composition of breast milk(Reference Galante, Milan and Reynolds50,Reference Hosseini, Valizadeh and Hosseini51) . Given that the mother’s nutritional status influences breast milk composition(Reference Fields, George and Williams52–Reference Young, Faerber and Mehta54), the infant’s nutritional demands may influence changes in maternal BC.
Interruption of EBF showed a negative association with FFM over time. This finding aligns with those highlighting EBF as a predictor of overall postpartum weight reduction(Reference Kac, Benício and Velásquez-Meléndez31,Reference Jiang, Gao and Vinyes-Pares55,Reference Barker56) , which may reflect decreased FFM. The postpartum period is also marked by significant hormonal changes, including a drop in oestrogen and progesterone levels. These hormones play a central role in modulating muscle metabolism and strength, and their reduction may contribute to FFM loss(Reference Kodete, Thuraka and Pasupuleti57,Reference Ikeda, Horie-Inoue and Inoue58) . On the other hand, this result may also be partially explained by the BIA analysis. Despite its widespread use, BIA is sensitive to hydration changes during postpartum(Reference Biddulph, Holmes and Kuballa13). Evidence shows that early introduction of complementary feeding or non-nutritious liquids decreases breast milk production(Reference Haisma, Coward and Albernaz59), which BIA may estimate as a reduction in FFM.
Another finding is that women aged ≥ 30 had a more pronounced increase in the BF and FM means per week than women aged ≤ 19. This finding agrees with previous studies conducted in different countries, even for shorter follow-up periods(Reference Caire-Juvera, Casanueva and Bolaños-Villar18,Reference Kyle, Schutz and Dupertuis60,Reference Marques-Vidal, Pécoud and Hayoz61) . This result likely reflects the biological ageing of maternal adipose tissue, which may increase its efficiency for energy storage as fat(Reference Going, Williams and Lohman62–Reference Wehrli, Bural and Houseni64).
The women in the highest income quartile experienced a greater decrease in BF per week and an increase in the mean FFM per week compared with women in the lowest quartile. Unexplored factors in this study, such as food insecurity, poor maternal diet quality and physical activity practice, may explain these results. It has been reported that postpartum food insecurity is associated with ∼1 BMI unit increase at 12 months postpartum among overweight women(Reference Laraia, Vinikoor-Imler and Siega-Riz65) and negatively affects FM, FFM and abdominal skinfold thickness(Reference Rosen, Settel and Irvine66). Additionally, lower socio-economic status and educational attainment are associated with poorer dietary patterns, including more ultra-processed food consumption during pregnancy and postpartum(Reference Pervin, Emmett and Northstone67). Along with food insecurity, this poor diet quality elevates obesity risk(Reference Nettle, Andrews and Bateson68). Furthermore, physical activity promotes healthy weight maintenance and muscle strength during the postpartum(Reference Evenson, Brown and Brinson69), and women with higher education and income levels are more likely to engage in regular physical activity(Reference Tornquist, Tornquist and Mielke70). These disparities in health determinants underscore the complexity of weight management during and after pregnancy.
This study’s main strength lies in its longitudinal design, which allows for assessing maternal BC at three different time points. Another key strength is its focus on a Brazilian population, a group underrepresented in longitudinal studies examining these associations in lactating women. However, our work has some limitations. First, the BC data were obtained directly from the BIA equipment. The specific equations used by the manufacturer were not disclosed, and these may not be validated for the early postpartum period. It is well-documented that the hydration status of lactating women may take up to 3 months to normalise(Reference Biddulph, Holmes and Kuballa13). Additionally, the amount of breast milk produced can potentially affect the BIA accuracy. Furthermore, BIA methods may overestimate FM during lactation compared with more precise techniques(Reference Medoua, Nana and Essa’a71). It is important to note that no longitudinal studies compare the use of BIA with another reference method that covers the time range of our study. Moreover, our analyses were limited by the absence of data on participants’ physical activity, a key factor influencing BC changes.
In summary, we found that FFM and BMI decreased significantly over time. Furthermore, multiparity, caesarean delivery, pre-pregnancy overweight BMI, giving birth to girls and non-EBF appeared to be predictors of these changes. Maternal age, family income, parity and infant sex could also change the effect of time on BF, FM, FFM and BMI trajectories. While these results are intriguing, it is premature to infer causality or make exaggerated claims based on our findings. Nevertheless, these results offer valuable insights into the factors influencing postpartum body changes beyond breastfeeding. They also emphasise the importance of considering multiple factors for managing maternal nutritional status postpartum.
Supplementary material
For supplementary material/s referred to in this article, please visit https://doi.org/10.1017/S0007114525000935.
Acknowledgements
The authors gratefully acknowledge the Brazilian dyads enrolled in the MILQ study and the research team members for their dedication and perseverance. The authors also thank the hospital and its staff for their invaluable support.
This work was funded by the Bill & Melinda Gates Foundation (grant nos.: OPP1148405 and INV-002300), intramural USDA-Agricultural Research Service project 5306-51000-004-00D and the Federal University of Rio de Janeiro.
A. D. S. C.: Conceptualisation, methodology, data curation, formal analysis, writing – original draft and had primary responsibility for the final content. L. H. A., K. F. M., C. M. and G. K.: funding acquisition, conceptualisation, project administration, writing – review and editing. D. B. M.: project administration, writing – review and editing. G. T. S., A. L. L. F., A. C. C. F., B. C. S., A. Y. K., J. I. L. and S. H. C.: writing – review and editing. G. K.: supervision. All authors have read and agreed to the published version of the manuscript.
All authors declare no conflict of interest.