

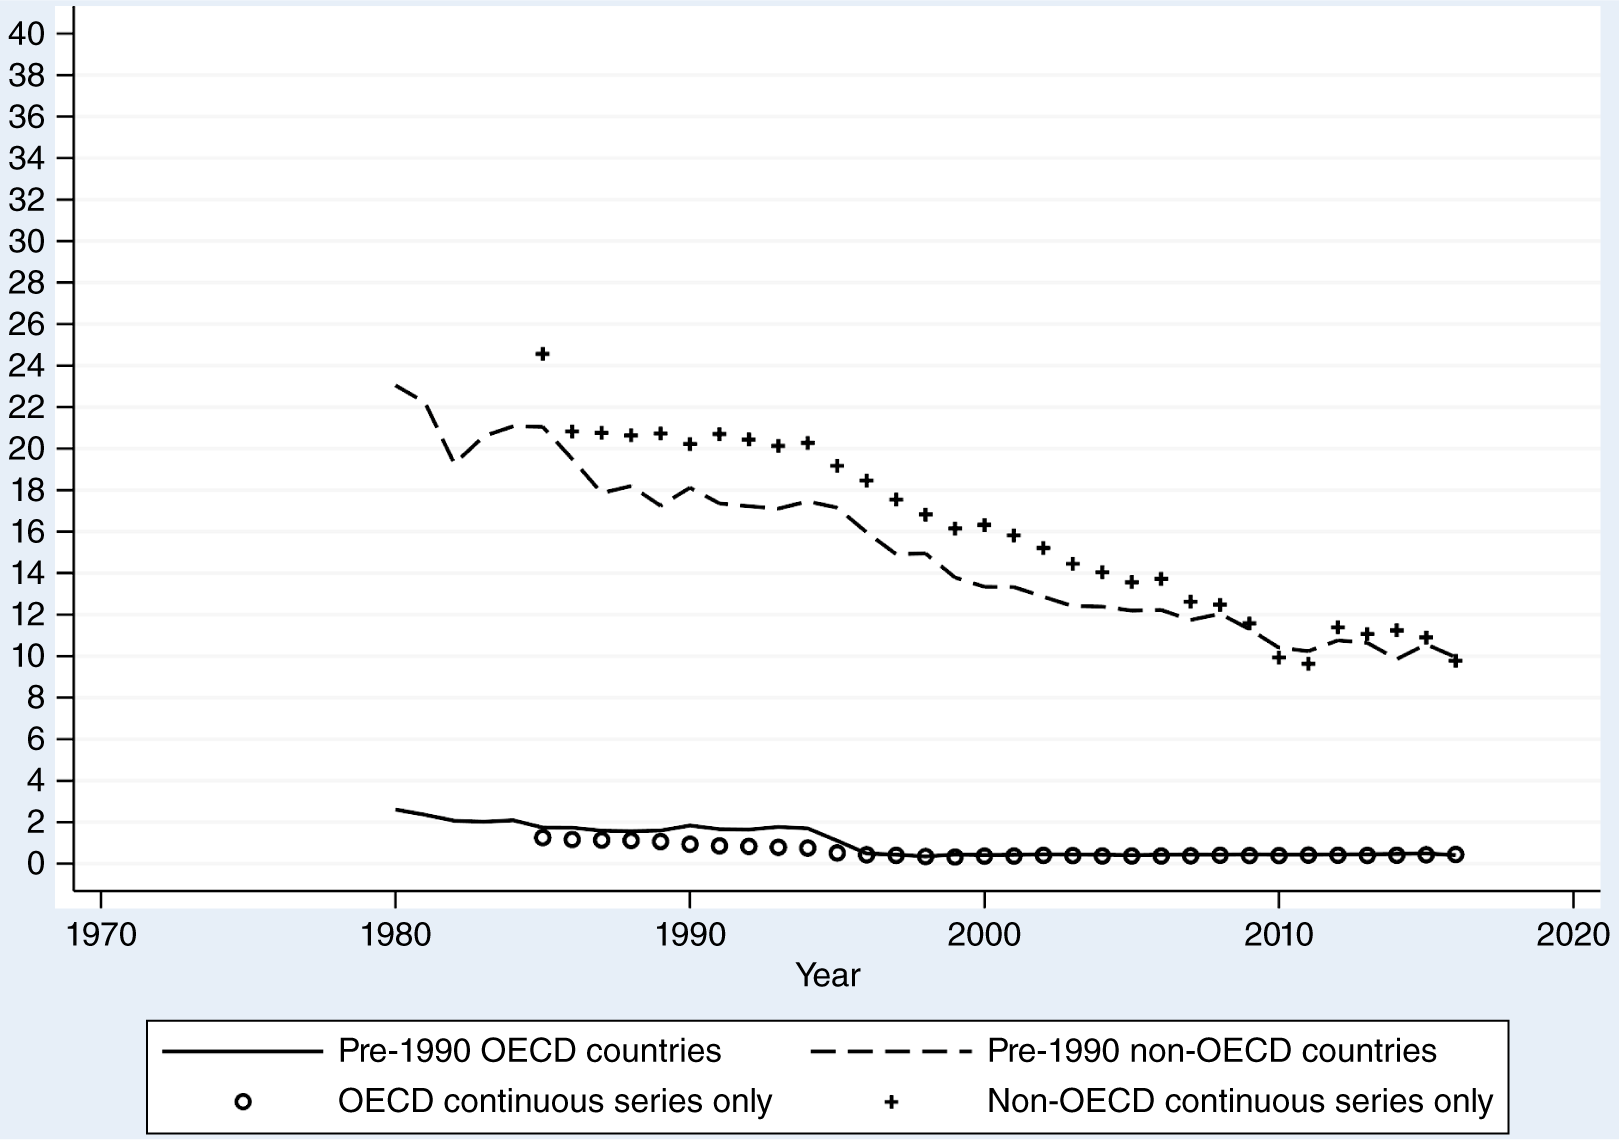
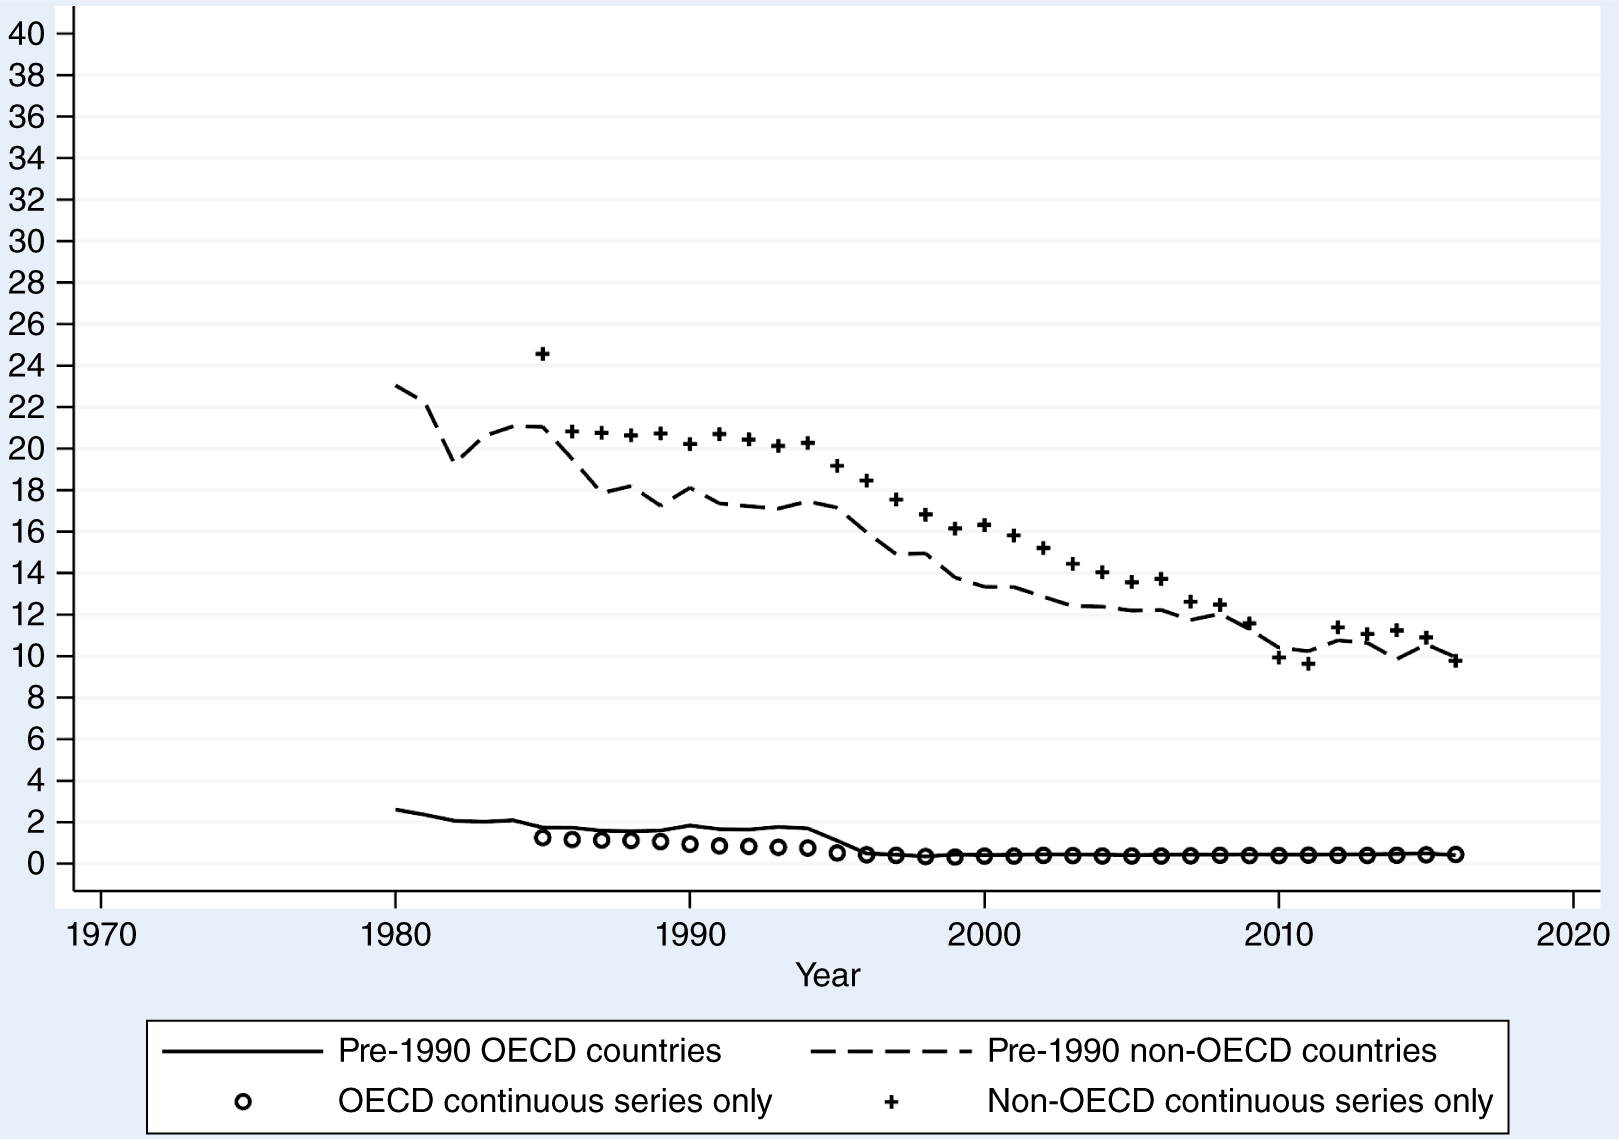
In their recent book, Democracies in Peril: Taxation and Redistribution in Globalizing Economies (DiP), Bastiaens and Rudra (Reference Bastiaens and Rudra2018) claim that as governments embraced trade liberalization in the 1990s, they experienced a revenue shock and that democratic governments found it more difficult to repair the breach than authoritarian governments. As a result, they argue, contemporary trade liberalizations pose a danger to democracy by starving it for funds, thereby forcing vulnerable governments to resort to politically unpopular policies at a time when they need more revenue to advance their development goals. The book contains marvelously rich descriptions of tax politics, especially in India, and smart analysis of why it plays out the way it so often does. Its focus on developing countries also makes sense. In the most recent period of globalization, developed countries began the period with low tariffs, while most developing countries greatly reduced theirs, and this was reflected in the evolution of trade-tax revenues. This is shown in figure 1, which distinguishes between the country members of the Organisation for Economic Co-operation and Development (OECD) as of 1990 and all other countries.
Revenue from Taxes on Trade as a Percentage of Total Revenue, OECD Countries as of 1990 and Others, Annual Averages (ICTD)
Unfortunately, the book does not provide firm support for the claim of a serious revenue shock or for the idea that democracies performed worse than non-democracies in responding to it. This review considers first the authors’ choice of data, because it bears on other questions, before addressing the matter of the revenue shock and the claim of a weaker revenue response among democracies. The article concentrates on the book’s graphs and charts before briefly addressing the modeling and data analysis.
Unfortunately, the book does not provide firm support for the claim of a serious revenue shock or for the idea that democracies performed worse than non-democracies in responding to it.
THE CHOICE OF DATASET
The authors of DiP chose to use the World Development Indicators (WDI)—which draws mainly on the International Monetary Fund (IMF) Government Finance Statistics Yearbook—for their fiscal variables rather than the then-new dataset from the International Centre for Tax and Development (ICTD).Footnote 1 They relegated the latter to a robustness check (see DiP appendix B), citing its authors’ acknowledgment of imperfections (Bastiaens and Rudra Reference Bastiaens and Rudra2018, 44–45). This, I believe, underestimates the problems with the WDI data and the achievements of the ICTD group.
Wilson Prichard (Reference Prichard2016), leader of the ICTD effort, mentions two such problems. The first was the inconsistent and misleading treatment of revenue from state-owned natural-resource operations. Some countries treat most of this as state-property income (i.e., nontax revenue), others as income tax on corporations (CIT). As he notes:
When employing data from the IMF GFS [Government Finance Statistics], Angola reports tax collection ranging from 30% to 50% of GDP [gross domestic product] depending on the year—among the highest in the world. However, while accurate in an accounting sense, this is deeply misleading for much research: non-resource tax revenue amounts to around 5% of GDP in Angola—among the lowest in the world. This type of discrepancy is not uncommon across resource-rich states (Prichard Reference Prichard2016, 49; emphasis in original).
Likewise, consider the revenue statistics of Trinidad and Tobago, published by the OECD: for 2010, they reported total tax revenue (in Trinidad and Tobago dollars) as USD $39,720 million, of which USD $21,659 million came from the CIT; of this, USD $13,834 million was from “oil companies.” For 2016, the report listed figures of USD $33,984 million, $8,608 million, and $1,036 million, respectively, in these categories (Inter-American Center of Tax Administrations, and Economic Commission for Latin America 2023). This change appears in the 2024 WDI series for the country as a shift from income-tax revenue (64.3% of revenue in 2011) to the categories of “other revenues” and “other tax revenues” between 2011 and 2017—even as total revenue varies much less.
This matters because natural-resource income from state-owned property has a different political meaning—it is the foundation of a rentier state—than income taxes on private corporations and households. This is even more the case because the WDI—and DiP—combine corporate (CIT) and personal (PIT) income taxes into one statistic.
The second problem that Prichard (Reference Prichard2016, 49) identifies is the periodic rebasing of GDP figures and, as a result, spurious shifts in any variable expressed as a percentage of GDP. As he notes:
Rebasing in Ghana in 2010 resulted in a 60% “increase” in GDP, while rebasing in 2014 in Zambia and Nigeria resulted in “increases” of 25% and 90%, respectively….international sources reporting GDP for the same country, but using different base years, can result in huge jumps in GDP from one year to the next and correspondingly sharp (and entirely illusory) declines in tax-to-GDP ratios as a result.
In the current WDI data, this problem is less egregious but it persists. For example, Cyprus increased its total government revenue (ex-grants) from 27.8% to 47.2% of GDP from 1989 to 1990 due to a corresponding increase in total tax revenue (World Bank 2024). Tellingly, this increase does not appear in any of the major tax categories because they are expressed as a percentage of total revenue and proceed smoothly between the two years—which makes it mysterious how the substantial increase in the total could be fiscally possible. Later in the series, the revenue figure decreases suddenly from 65.6% to 35.8% of GDP between 2008 and 2009, and the figure for tax revenue as a percentage of GDP again mirrors the decrease.
How does this affect the analyses in DiP? It is obvious that Cyprus is an outlier in the book’s figure 1.2 and, because a similar problem affects the data for Malta from 1990 to 2007, both Cyprus and Malta are notable outliers in figures 3.6a and 3.7a. Cyprus is an influential outlier in figure 3.1a, as discussed herein. These examples suggest that there may be other spurious shifts in data values that could affect regression estimates, especially those using country fixed effects (as DiP does). The ICTD data had none of these problems. In addition, if Bastiaens and Rudra (Reference Bastiaens and Rudra2018) had used the ICTD data more fully, they would have been able to distinguish between CIT and PIT, as well as having a direct measure of fiscal resource rents, rather than relying on an imperfect WDI proxy: fuel exports.
DATA PRESENTATION AND ANALYTICAL CHARTS
DiP argues that developing countries suffered a revenue shock when they liberalized trade and that democracies especially struggled to fill this void because of the political difficulty of raising other tax revenues. Logically, the book needed to demonstrate three patterns in the data: (1) a decline in total revenue simultaneous with a decline in trade-tax revenues; (2) a weaker subsequent domesticFootnote 2 tax-revenue performance among democracies compared to non-democracies; and (3) no significant interference with these patterns from nontax revenues, which would add to total revenues without the putative political risks of increasing domestic-tax revenue. Unfortunately, the book does not accomplish this.
A Revenue Shock?
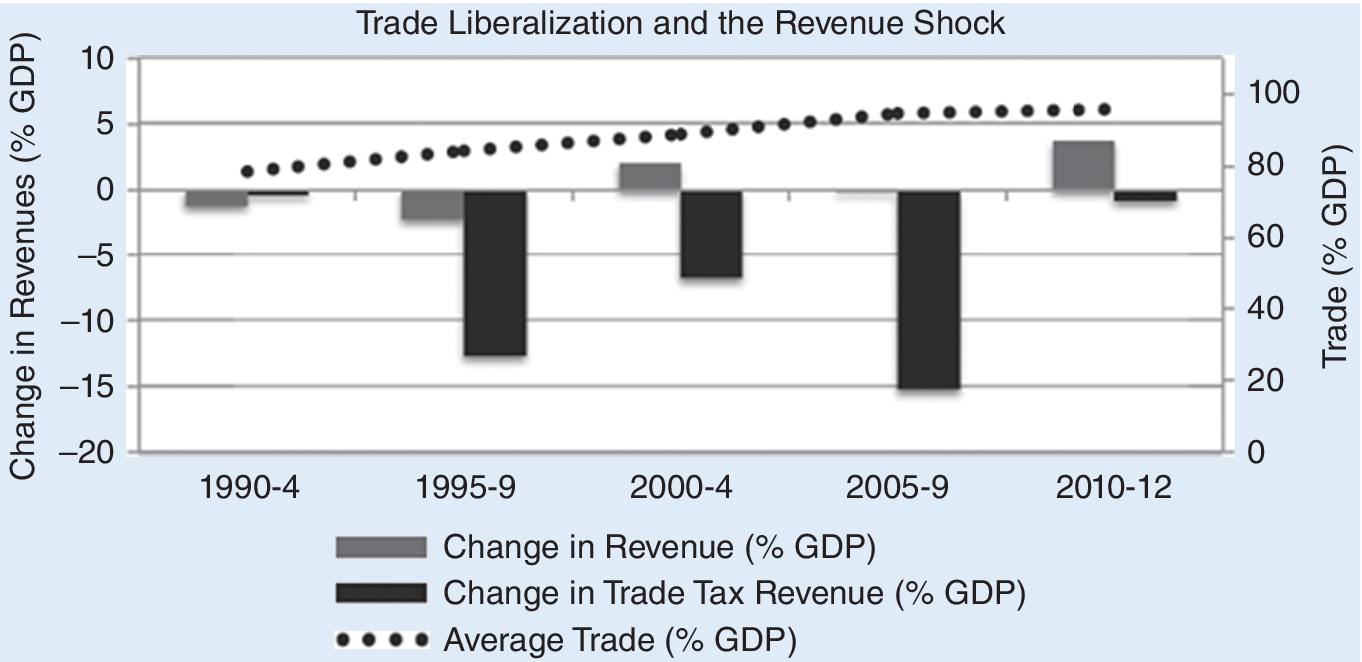
In chapter 1, Bastiaens and Rudra (Reference Bastiaens and Rudra2018) posit a severe loss of revenue suffered by developing countries on liberalization, leading with figure 2.
Copy of Democracies in Peril, Figure 1.1
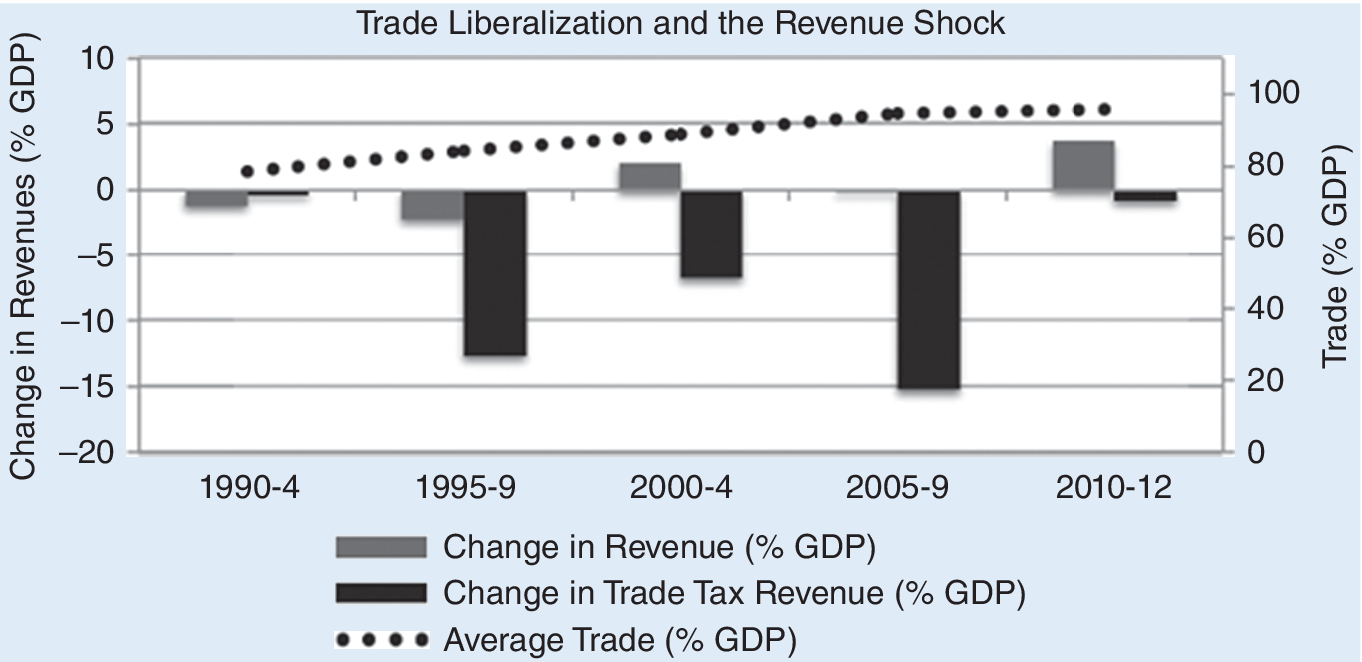
The losses of trade-tax revenue appear dramatic, amounting to more than 35% of GDP during the interval. It is obvious that this is impossible. Most developing countries’ total revenues are much less. The authors apparently confused losses of trade-tax revenue as a percentage of total revenue with losses in terms of GDP. In addition, text references to declining trade-tax revenues unfortunately are ambiguous, leaving the misconception uncorrected.Footnote 3 Fortunately, the error does not appear in subsequent figures.
Fiscal-Policy Response of Democracies and Non-Democracies
Bastiaens and Rudra (Reference Bastiaens and Rudra2018) then discuss what they claim is the divergent revenue response between democracies and non-democracies. Their figures 1.2 and 1.3 present scatterplots and fit lines for the difference between two two-year averages (i.e., 1990–1991 and 2011–2012) of values of several variables by country. Why only two years? This is not sufficient to control for business cycles (economists typically opt for at least five-year averages), making the exercise sensitive to the choice of periods. Moreover, 1990–1991 was an unusual time in fiscal terms for many countries represented in the chart. These were transitional years in post-Communist countries, with tax and total revenue figures rendered imprecise by the decay of socialist pricing and rapid changes of ownership, as governments tried to create modern fiscal systems from scratch.Footnote 4 Nicaragua was coming out of a civil war, burdened by inflation and short-term debt; its revenues decreased by about 50% between 1990 and 1991.
However, a deeper problem with these figures stems from their design. Consider first the weight they carry in the argument. In discussing their results with ICTD data in a subsequent footnote, the authors observe:
Some differences exist, but the puzzle in figures 1.2 and 1.3 (chapter 1) still holds among the sample of longstanding democratic and non-democratic nations that depend on taxable income (rather than oil rents)….for democracies, positive improvements in domestic revenues get smaller as countries lose trade tax revenue, while in the non-democracies, domestic revenues are increasing with liberalization (Bastiaens and Rudra Reference Bastiaens and Rudra2018, 45, n17).
That is, these figures are used to illustrate the puzzling difference between democracies and non-democracies in post-liberalization revenue performance.
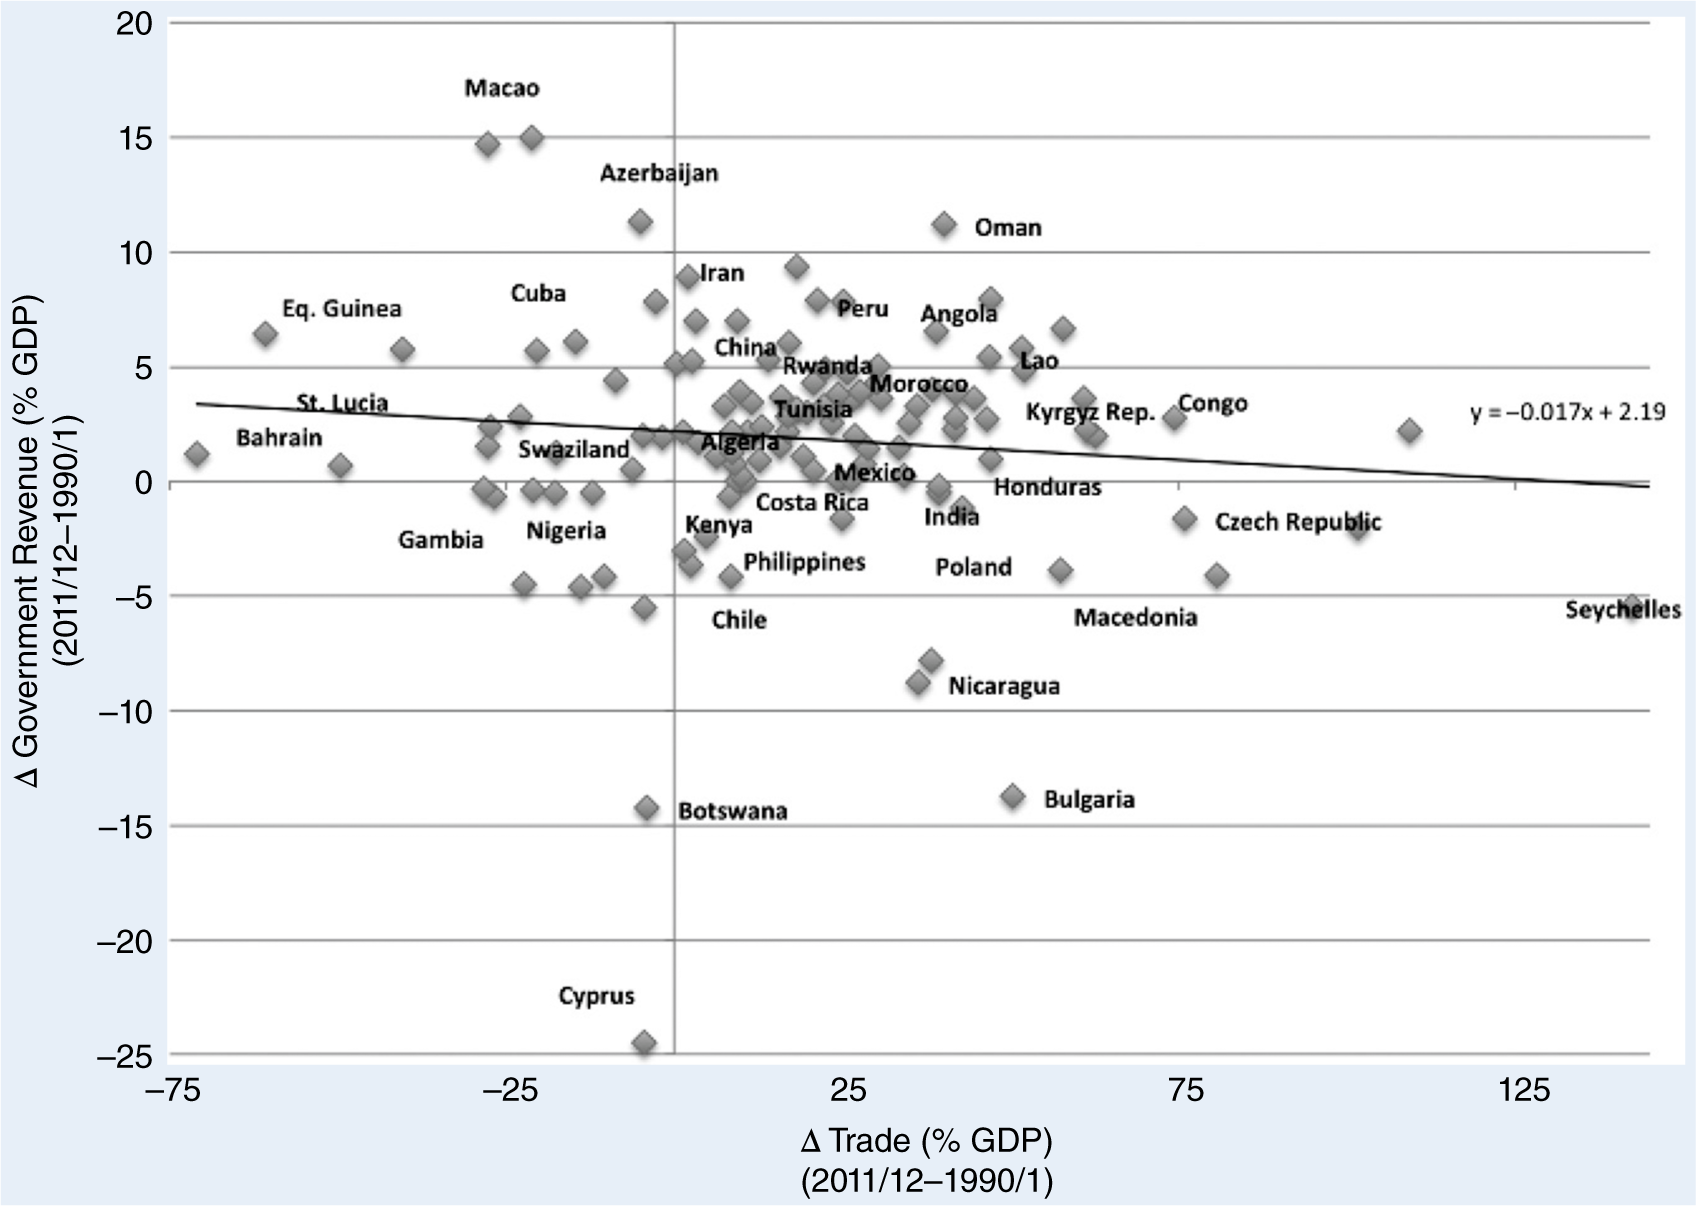
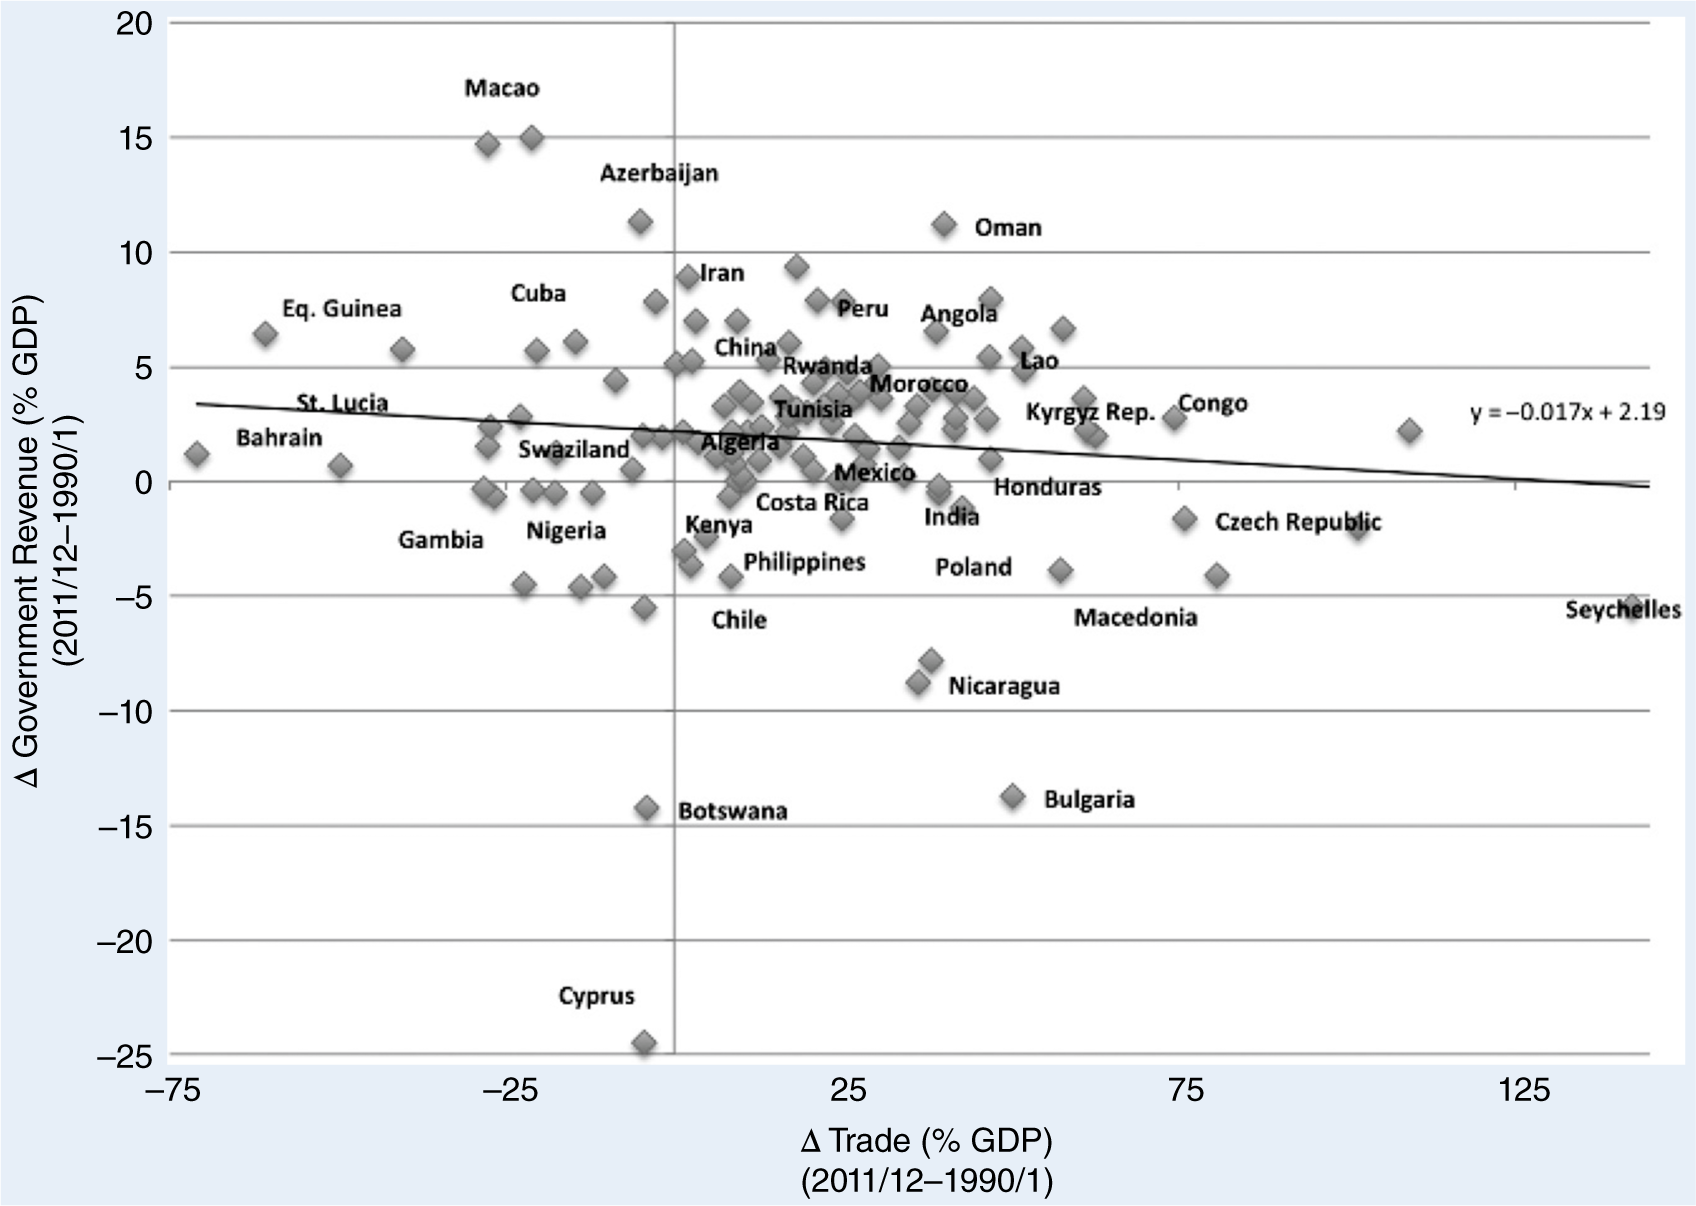
However, they do not; neither illustration depicts regime type. The book’s figure 1.2 plots changes in government revenue against changes in trade as a percentage of GDP, not against trade-tax revenues (figure 3). Yet, trade-tax revenues generally do not fall or rise monotonically with rates or trade volume. Granted, trade as a percentage of GDP could be an indirect and imperfect proxy for tariff revenue, if a direct measure were not available. However, the authors use such a direct measure in their next figure.
Copy of Democracies in Peril, Figure 1.2
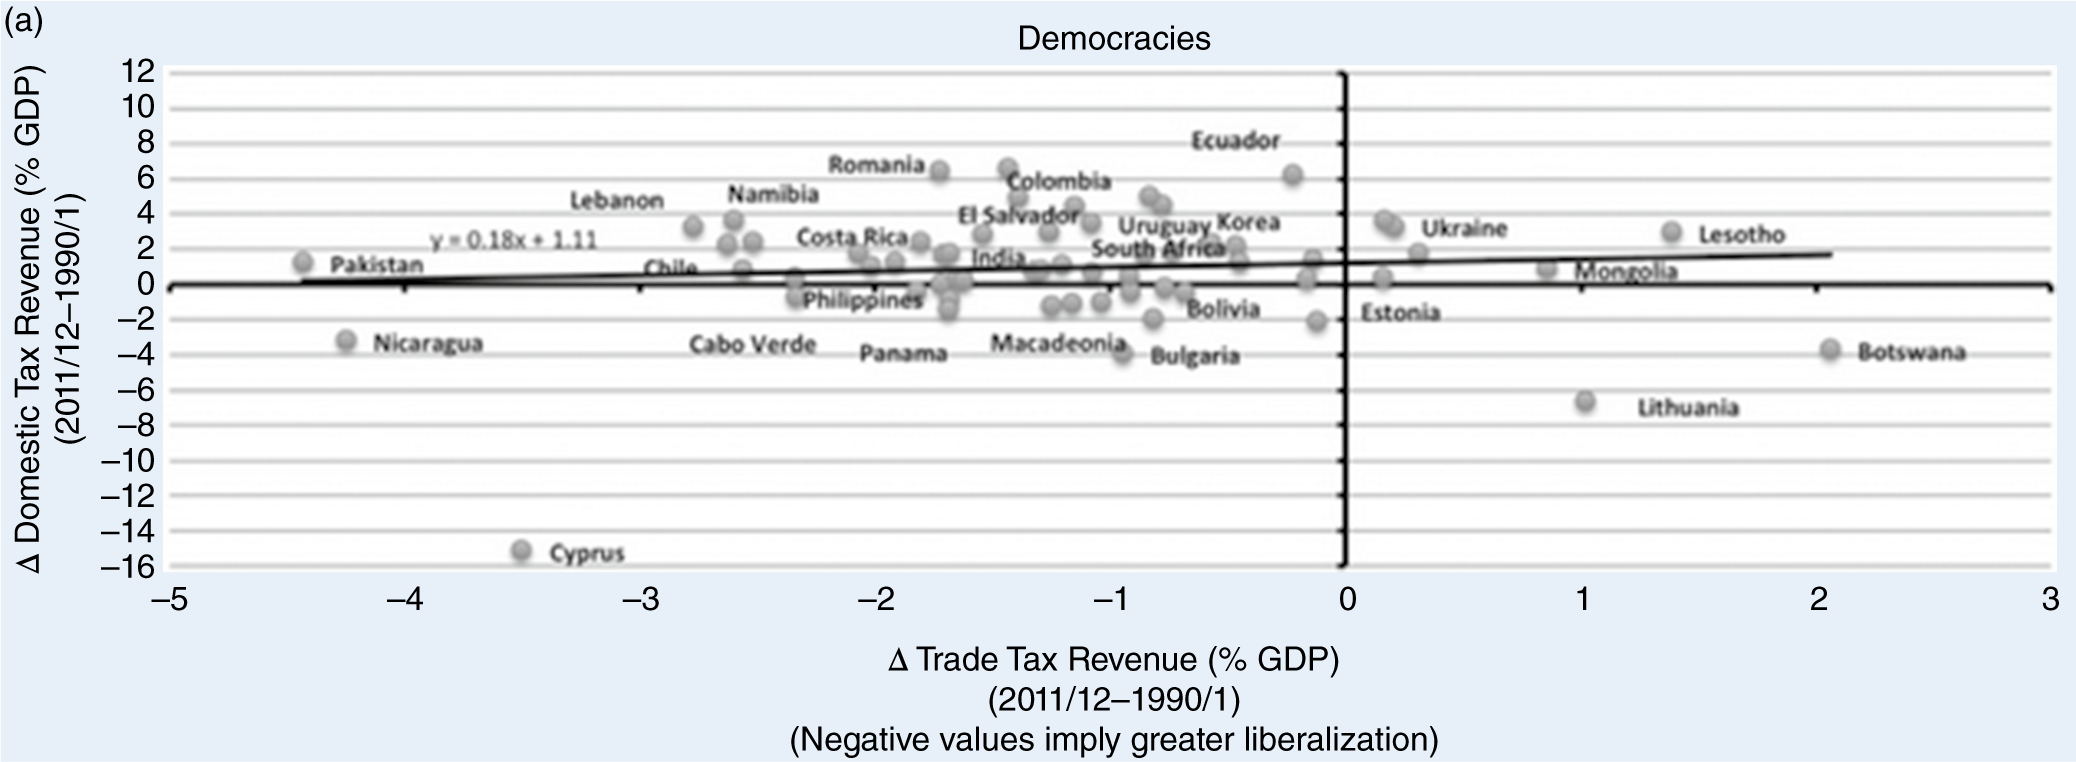
The figure in question (DiP, figure 1.3) plots changes in domestic-tax revenues against changes in trade-tax revenues. However, recall that the authors define domestic-tax revenue as total-tax revenue minus trade-tax revenue; therefore, the meaningful variation observed is that of total tax revenue, along with a negative bias.Footnote 5
Bastiaens and Rudra (Reference Bastiaens and Rudra2018) later distinguish by regime type across several figures in chapter 3. Discussing the first two (DiP figures 3.1a and 3.1b), they assign great significance to the difference in their fitted line slopes:
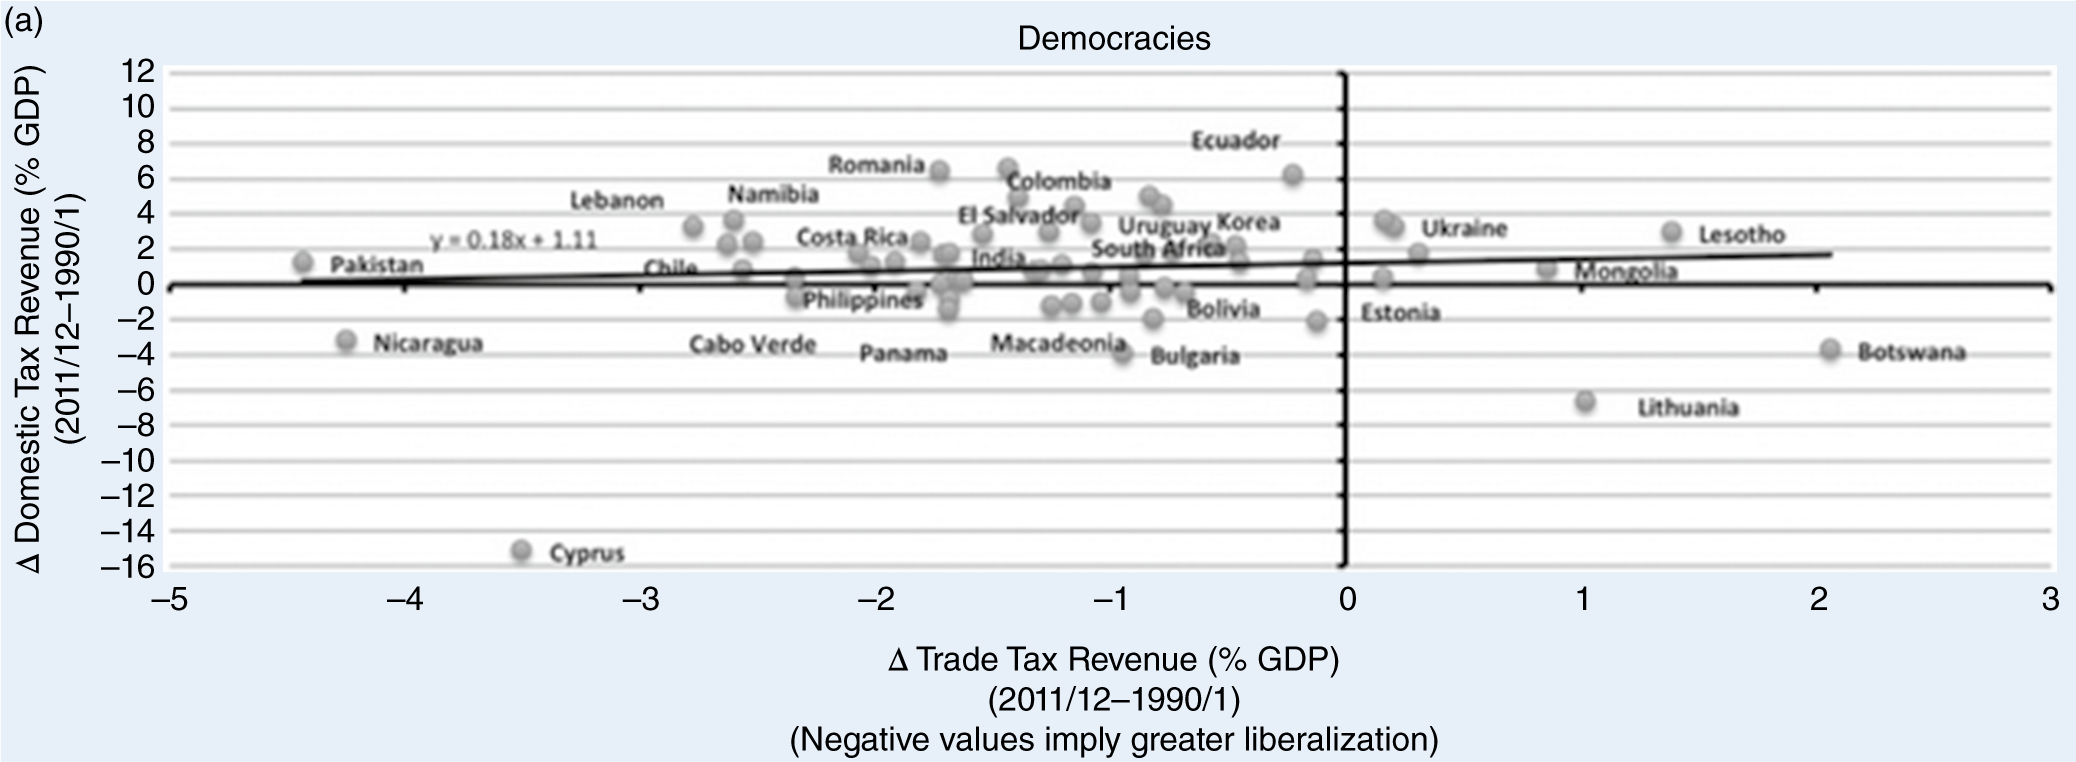
Figure 3.1. and 3.1b illustrate the contrast in domestic-tax revenue collection between liberalizing democracies and authoritarian regimes. In the former (figure 3.1a), the change in domestic-tax revenues appears to stagnate and even slightly decline as democratic countries lose trade-tax revenue (i.e., move left on the x-axis), while in non-democracies (figure 3.1b), domestic-tax revenues are clearly increasing with liberalization (Bastiaens and Rudra Reference Bastiaens and Rudra2018, 36).
The problem is that the first figure shows Cyprus as an influential outlier, arguably nudging the almost horizontal fitted line into the zone of “stagnation” (figure 4). Scatterplots with gentle slopes and several outliers are sensitive to minor changes in periods or data values—and, as this figure illustrates, the latter occur spuriously in the WDI data.
Copy of Democracies in Peril, Figure 3.1a
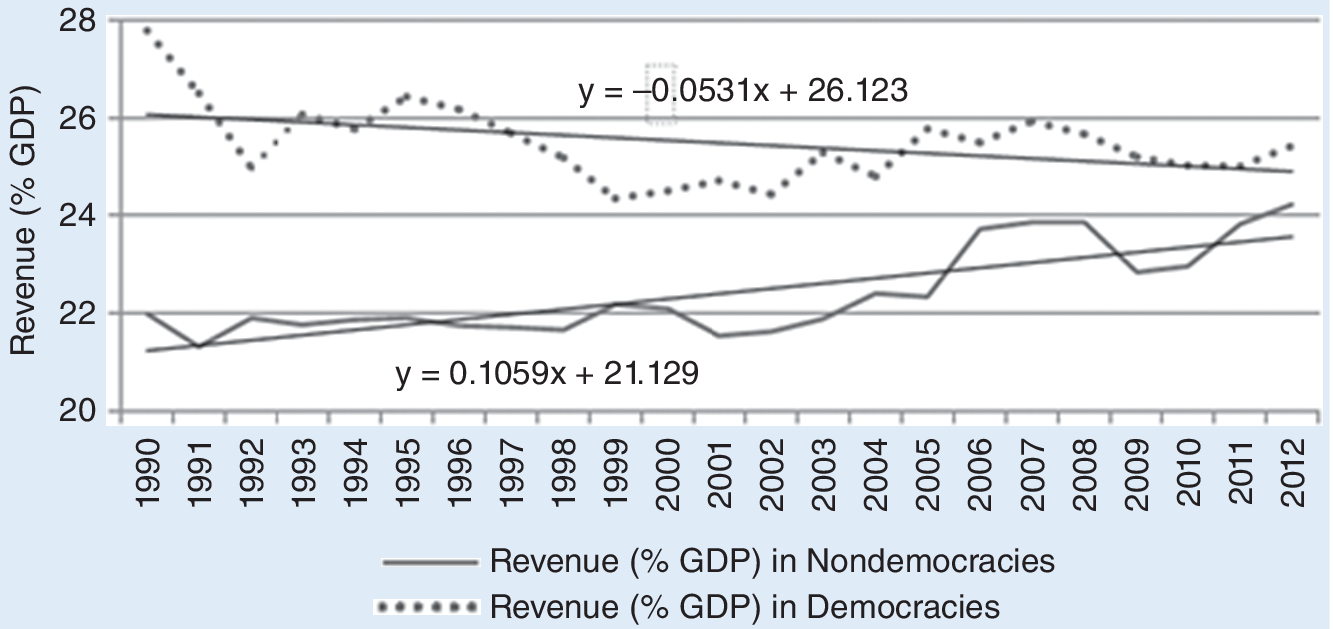
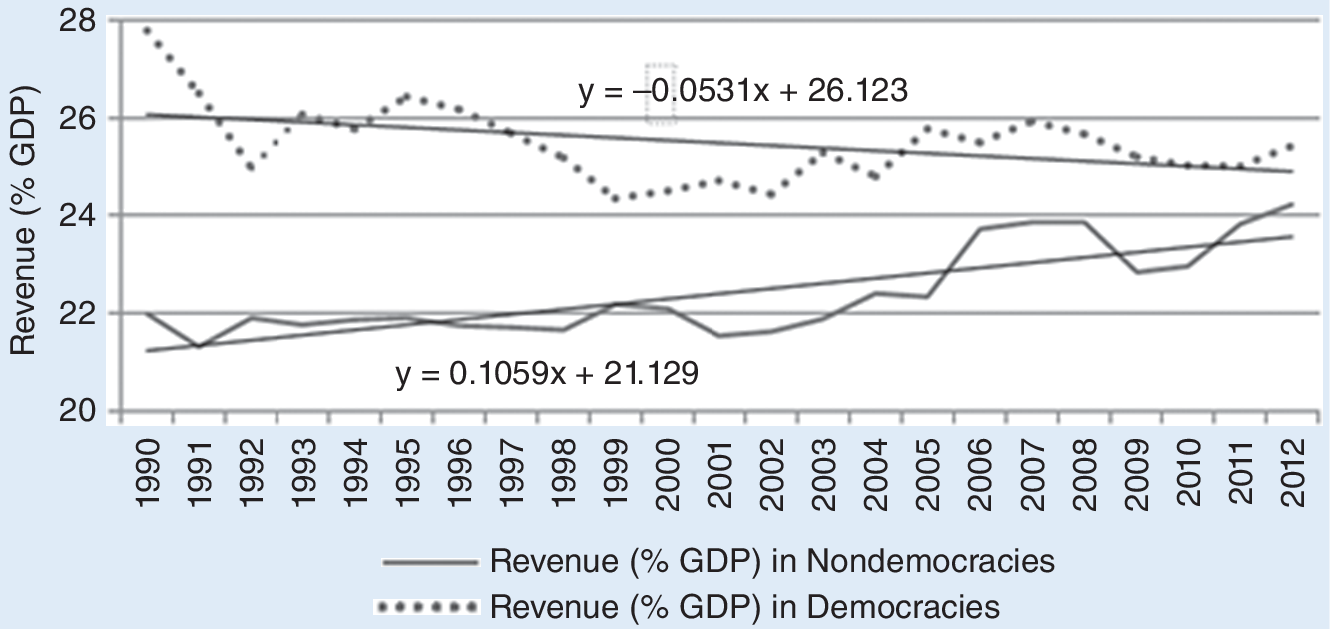
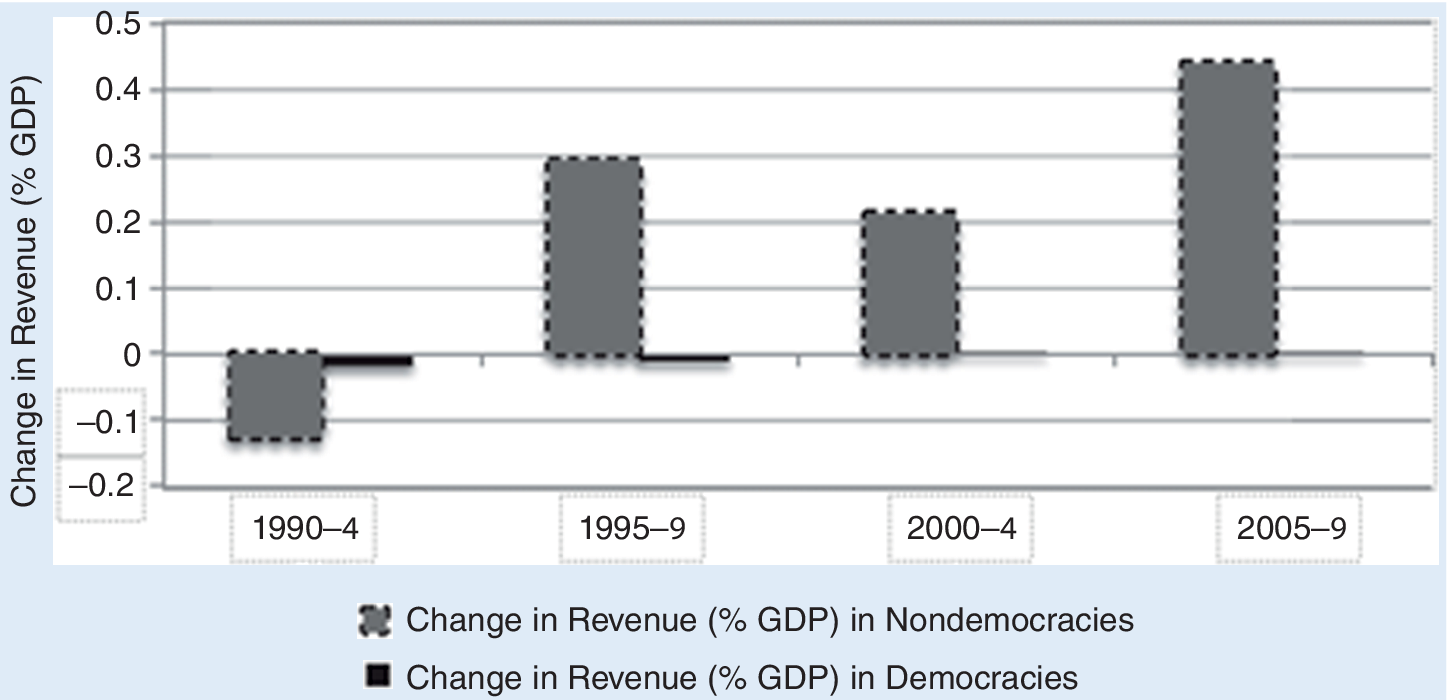
Subsequent charts also distinguish between democracies and non-democracies. Although the book’s argument is about the politics of domestic-tax mobilization, the authors now focus entirely on total revenue (figures 5.1 and 5.2). However, this statistic includes nontax revenues, most prominently from natural-resource operations. This matters, especially after 2003, when many resource-rich countries (including many non-democracies) experienced a boom in commodity prices.
Copy of Democracies in Peril, Figure 3.4
Copy of Democracies in Peril, Figure 3.5
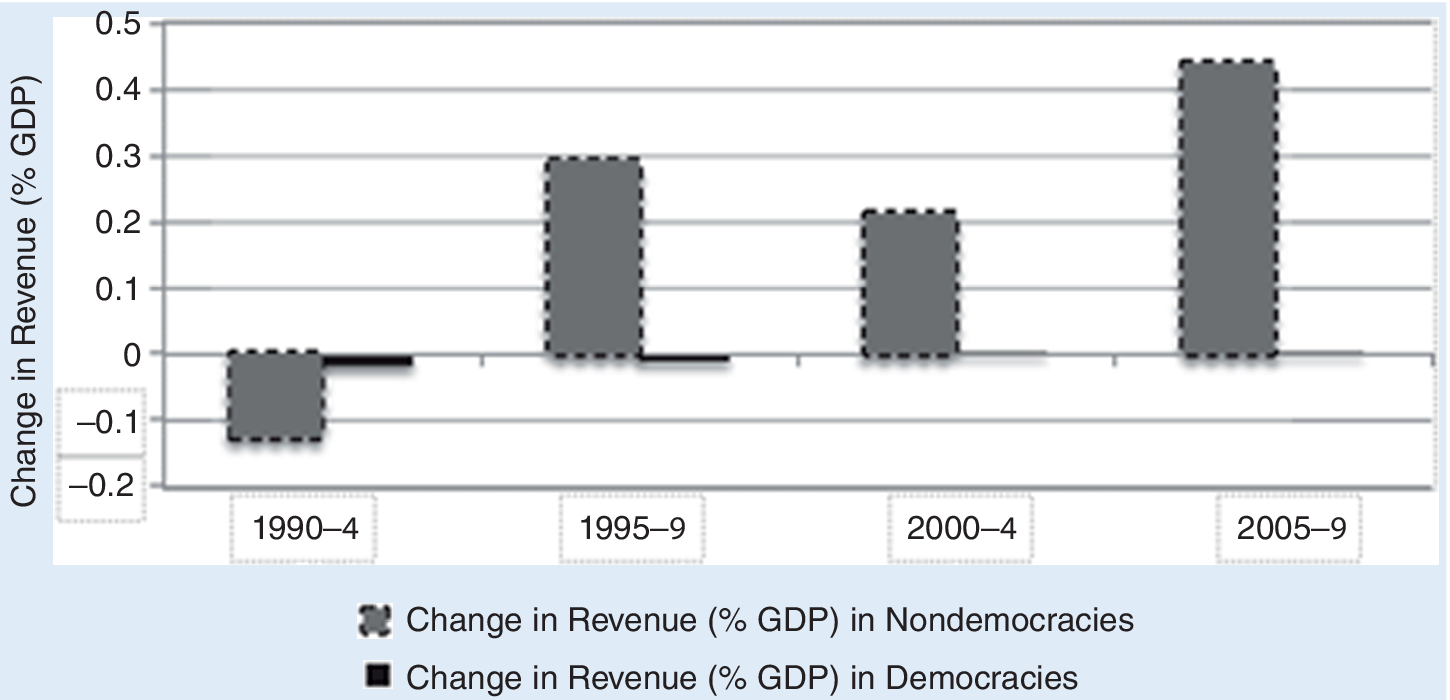
Other than the mistaken focus on total revenues and the mismatch between the two figures with regard to the 1990s, the exercise is obviously sensitive to the choice of period.
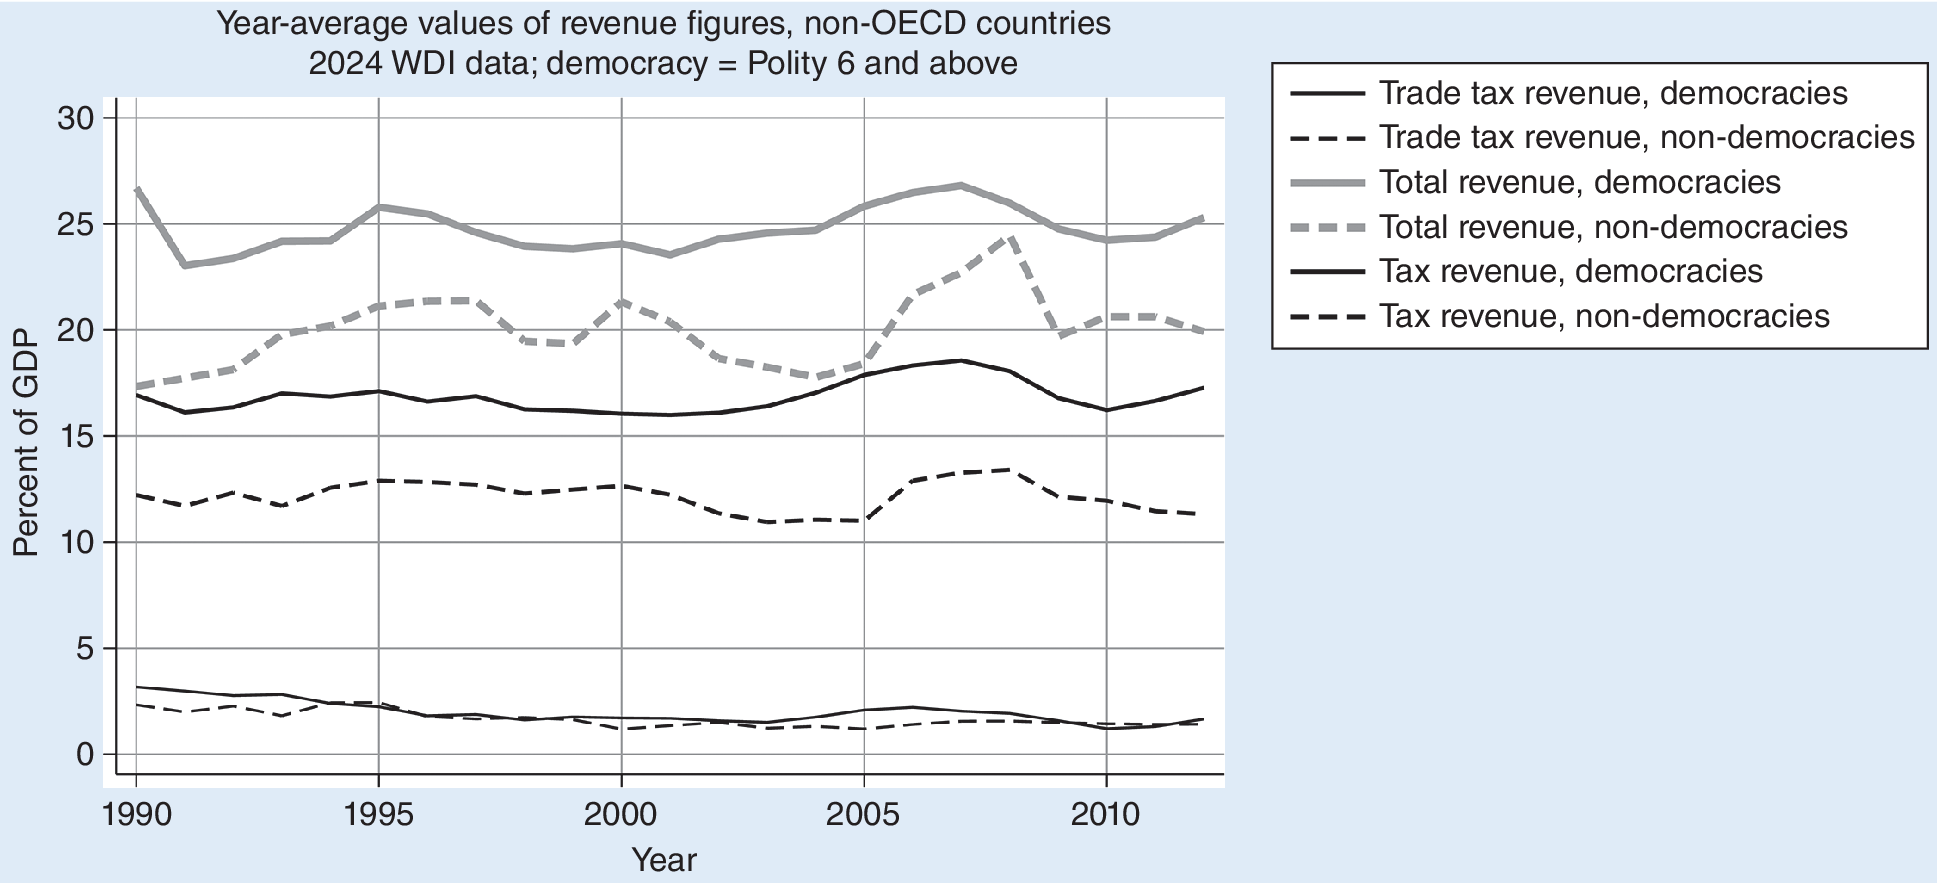
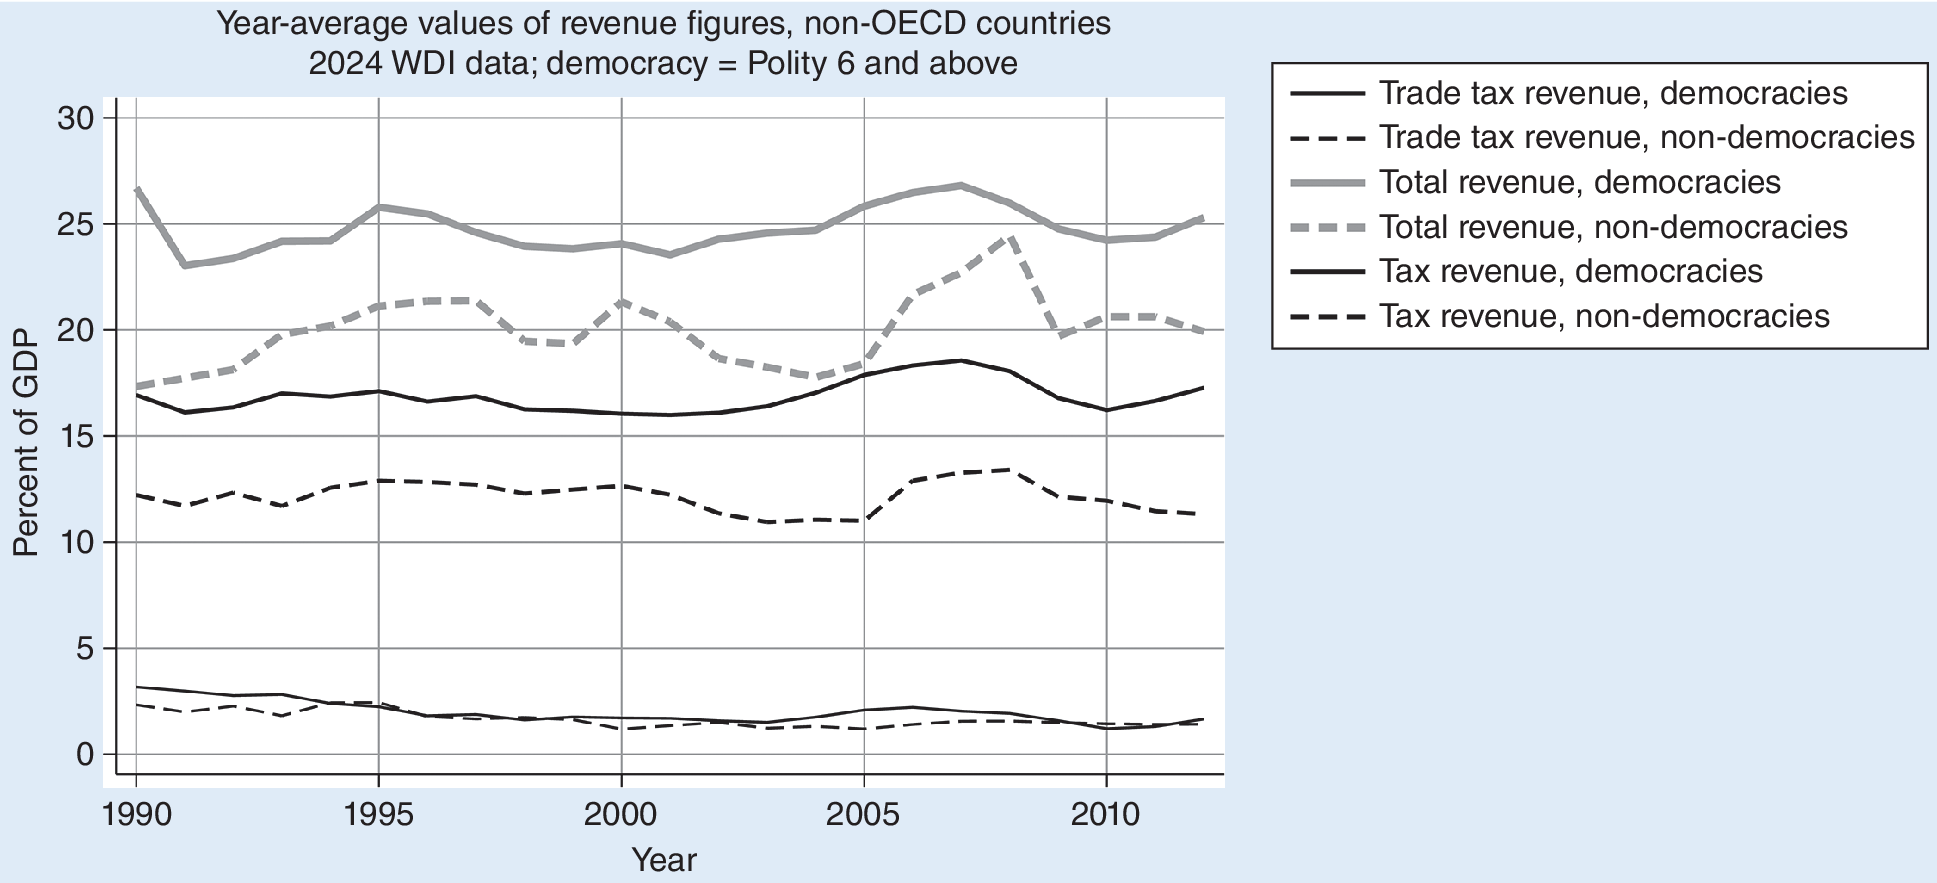
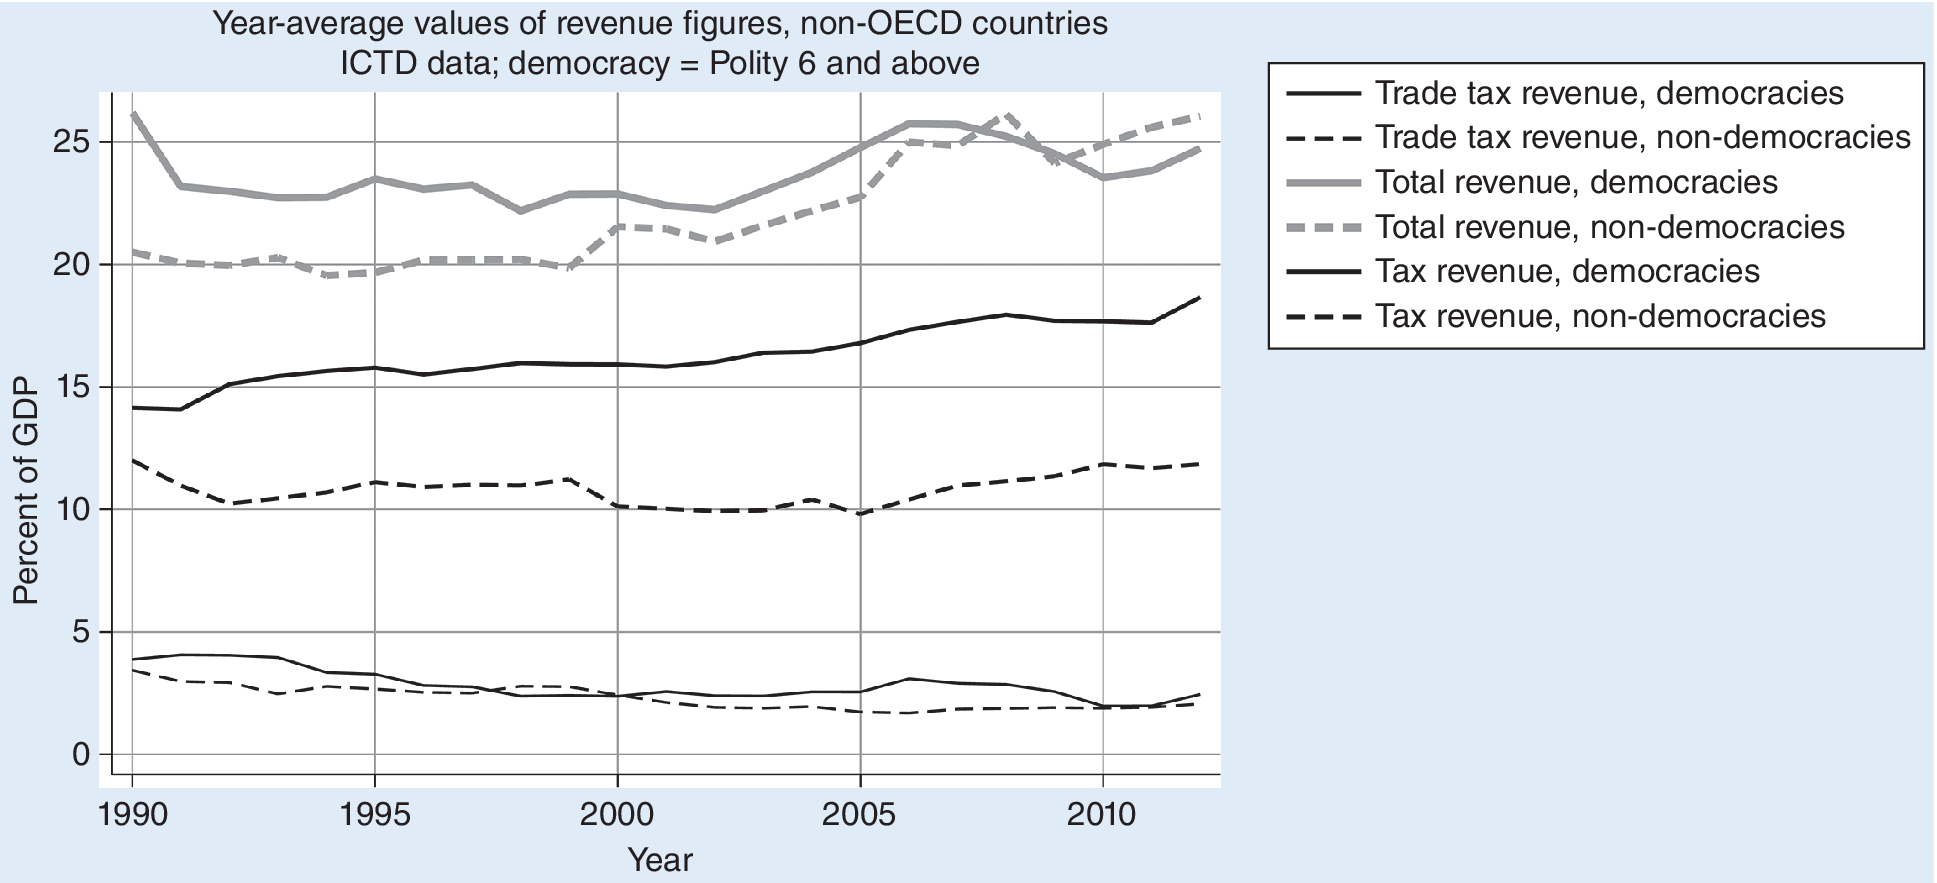
To illustrate, figure 6 presents average revenue figures from WDI (2024 version). Using these figures, suppose we begin the period in 1991 rather than 1990. Now draw fitted lines like those in DiP figure 3.4, but for tax revenues (more appropriately) rather than total revenues. The result: the slope of the line for democracies is equally or more positive than the slope for non-democracies. More important, the divergence is much greater in the ICTD dataset, the authors of which were careful to remove resource rents from the domestic-tax statistic (figure 7).
Average Revenue Figures, Non-OECD Countries, WDI
Average Revenue Figures, Non-OECD Countries, ICTD
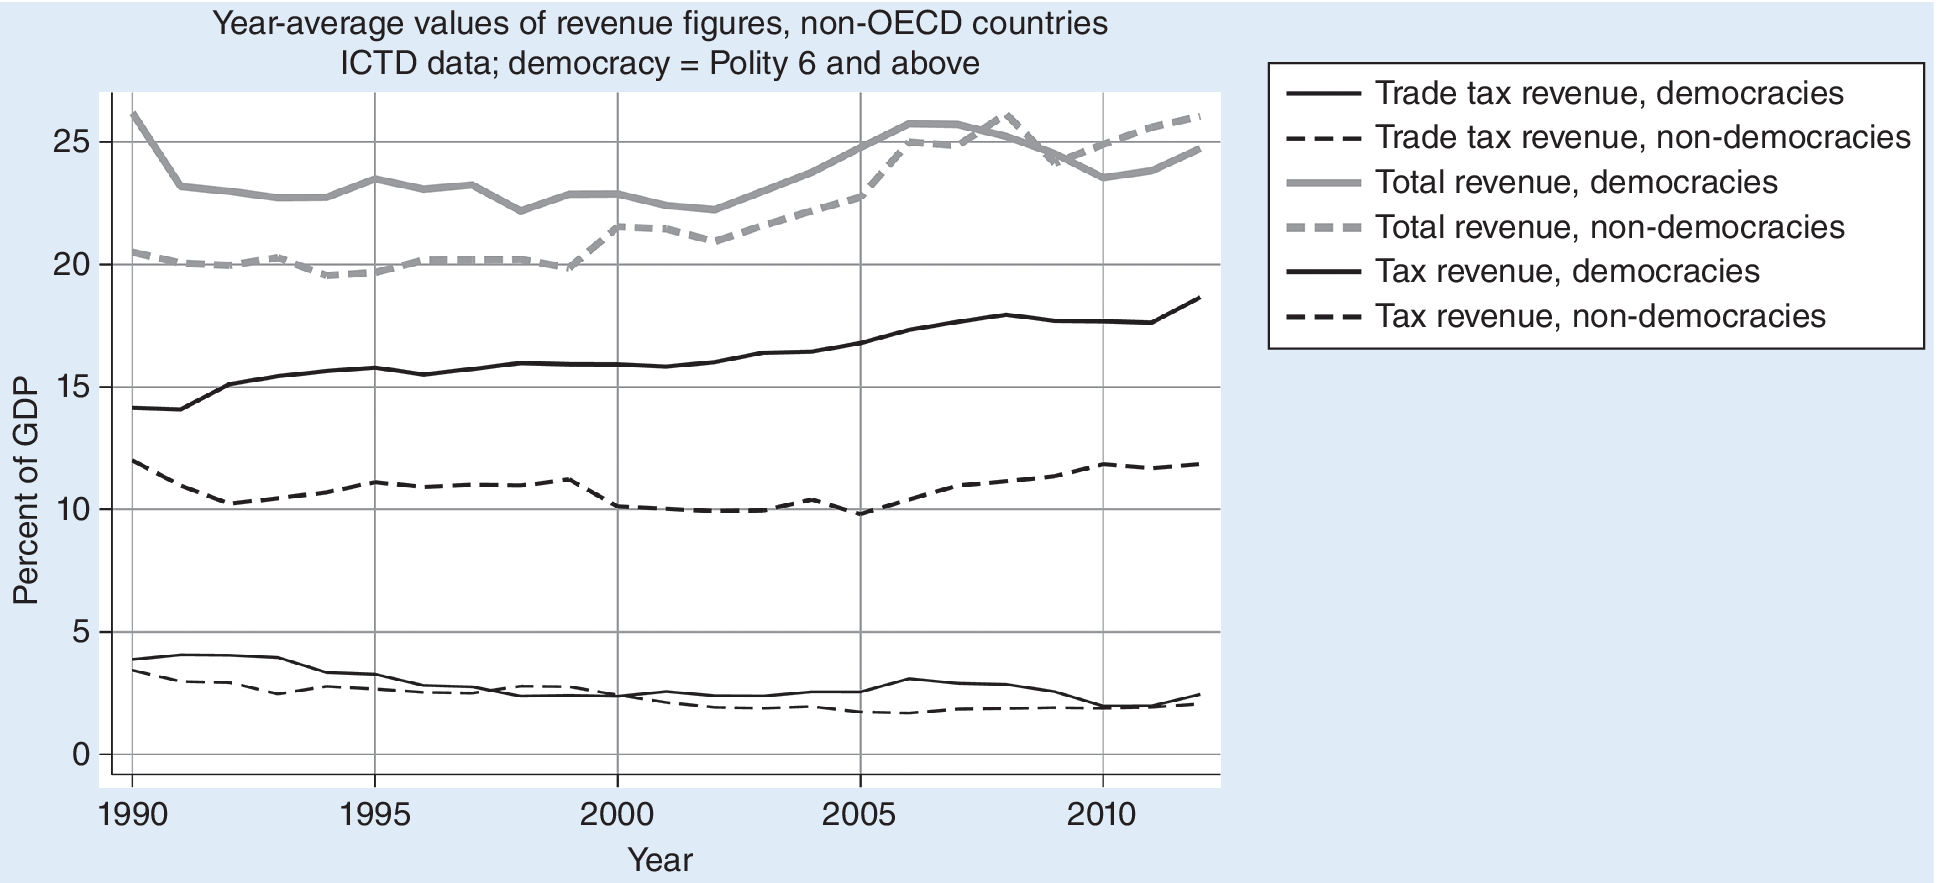
To summarize, the book’s charts do not provide support for its major premises. Trade-tax revenues declined steadily but, given their relatively small size and the greater changes in the rest of the fiscal landscape, they did not produce a major revenue shock for either democracies or non-democracies. For both, the magnitude of the total revenue variance overwhelms the variance in trade-tax revenues. Democracies’ revenues, driven largely by their domestic taxes, declined around 2007–2008 and stabilized in 2010, along with the global economic cycle. However, as observed in the more reliable ICTD data, the non-democracies experienced a large increase in nontax revenues (shown in the difference between the tax and revenue lines) from 2002 to 2008.Footnote 6 Consistent with many political observers as far back as Montesquieu, it appears that these developing-country democracies performed better than their non-democracy contemporaries—at least in these years—with regard to obtaining tax revenue.Footnote 7
ECONOMETRIC MODELING AND DATA ANALYSIS
Having established that the “revenue shock” from trade liberalization was about 1/30th of what Bastiaens and Rudra (Reference Bastiaens and Rudra2018) asserted graphically in chapter 1, it seems that the stakes on their data analyses have been greatly diminished. Nevertheless, a few charts do not represent the precise relationship, and the substantial quantitative parts of DiP nevertheless merit a brief mention.
The main issue with the quantitative analyses is related to model specification. After citing Bueno de Mesquita et al. (Reference Bueno de Mesquita, Smith, Siverson and Morrow2005) for a model of tax revenue that includes (log) GDP per capita and (log) population, the authors inserted only the first of these in their baseline model, including instead capital account openness and fuel exports. The latter is meant to control for oil-rich rentier states, which is useful—although it omits the companion WDI series for ores and metals exports. In justifying the choice of these and another five covariates (which include population), the authors refer to the “broader tax-revenue literature” (Bastiaens and Rudra Reference Bastiaens and Rudra2018, 46), with discussion and a citation attached. They do not report common information criteria (e.g., Akaike and Bayesian) or discuss the risk of overfitting. More seriously, although both the baseline and the additional covariates severely truncate the data, readers are not shown how the truncation versus the added variables affected the estimates. Granted, the authors conduct a series of robustness checks and well-conceived adjustments to the data, and their results appear to be robust. However, in the analyses that bear on the book’s central claims (presented in DiP appendices A and B), the same eight covariates remain.
Because overfitted models often prove unreliable when extended to new data, I examine how DiP’s baseline performs when applied to newer (2024) WDI and 2018 ICTD/UNU-WIDER data, using similar evaluation tools and specifications.Footnote 8 I then use information criteria to make small adjustments to the model.
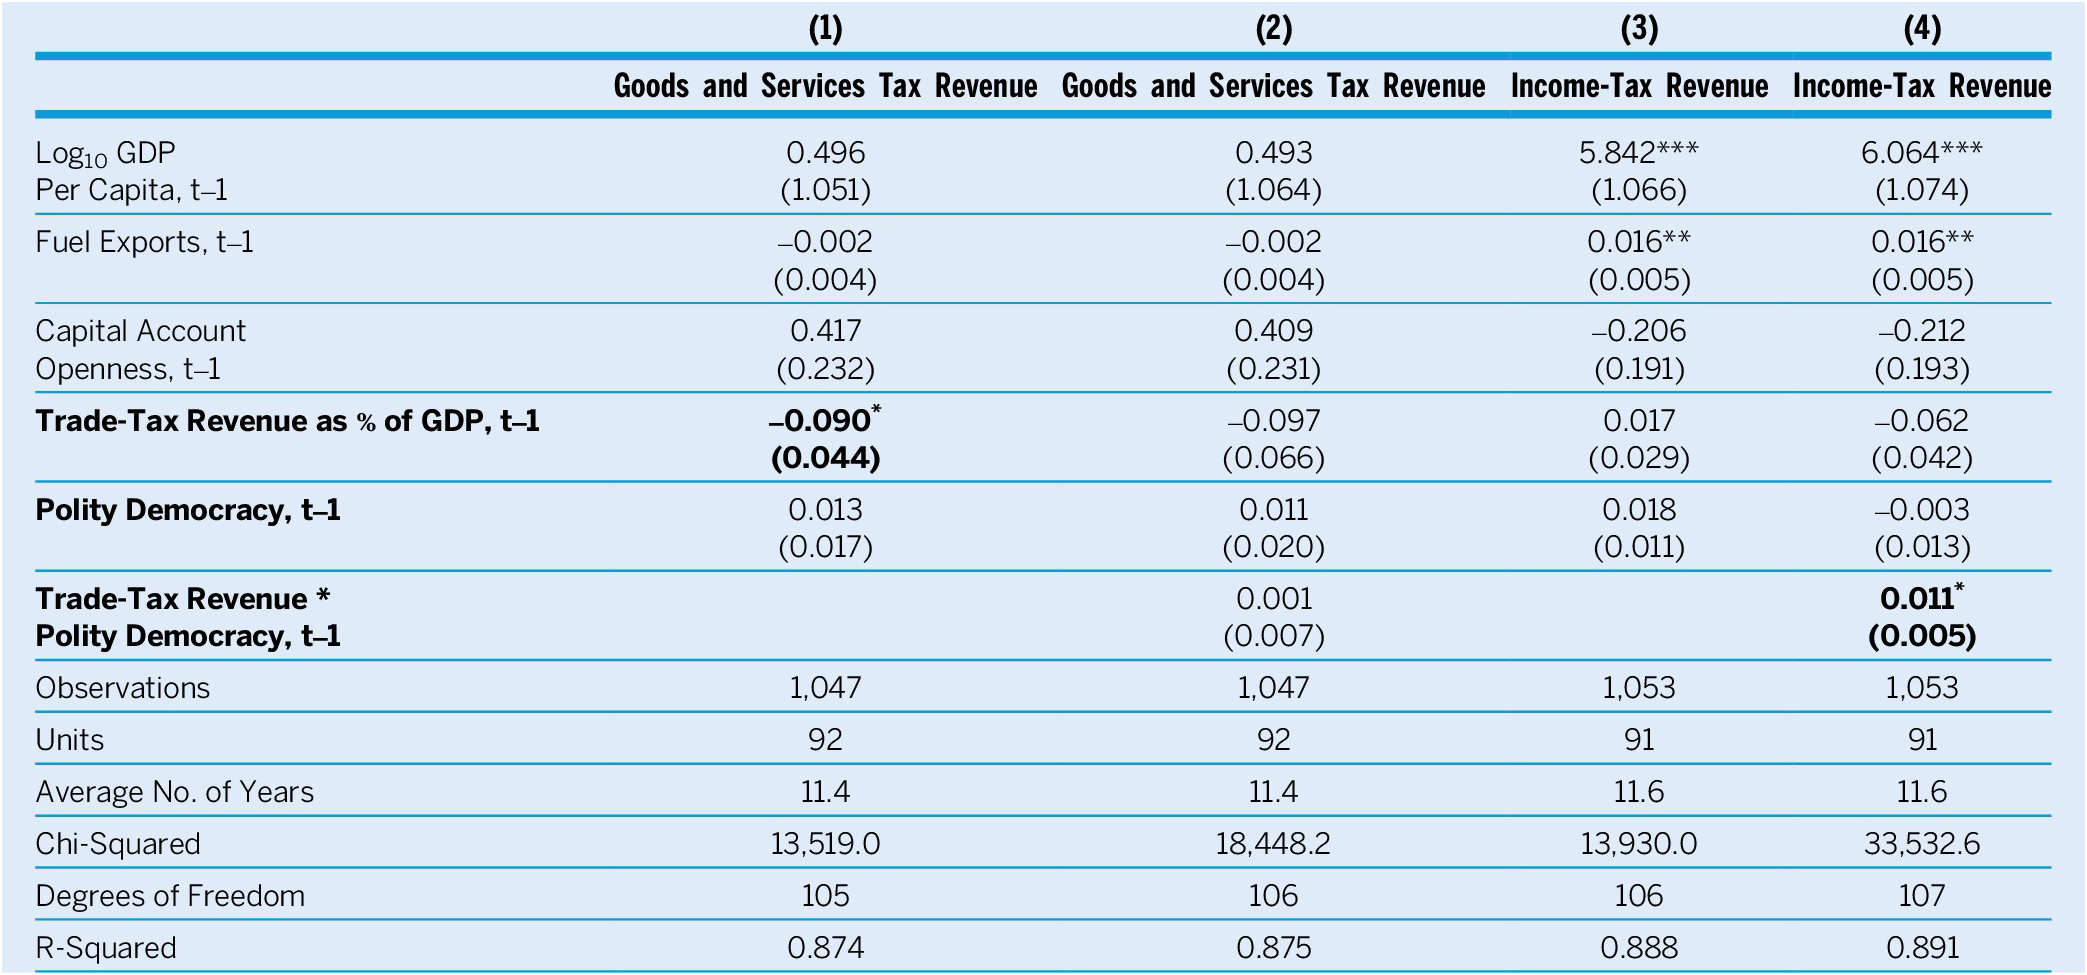
Table 1 reproduces the book’s table A1, equations 3 and 4, with current (but still problematic) WDI data in equations 1 and 2, with consumption-tax revenue as the outcome. There is a single negative coefficient on trade-tax revenue in equation 1, which gives the expected (but, with regard to DiP’s argument, neutral) result that lower trade-tax revenues predict higher consumption-tax revenues. Using income-tax revenues as the outcome (right half of table 1), there is a significant and positive estimate on the interaction term in equation 4. This would support the book’s argument: as trade-tax revenue in the previous period declines, lower values of the democracy variable predict higher gains in income-tax revenues. This result would suggest that revenues from income taxes remain politically more difficult to raise than those derived from indirect consumption taxes—which would be consistent with the literature on the origins and contemporary politics of income taxes (Andersson Reference Andersson2023; Bastiaens and Rudra Reference Bastiaens and Rudra2018, 52, 56; de la Cuesta et al. Reference de la Cuesta, Martin, Milner and Nielson2023).
Consumption-Tax and Income-Tax Revenues (WDI 2024 Data) on Trade-Tax Revenue and Democracy
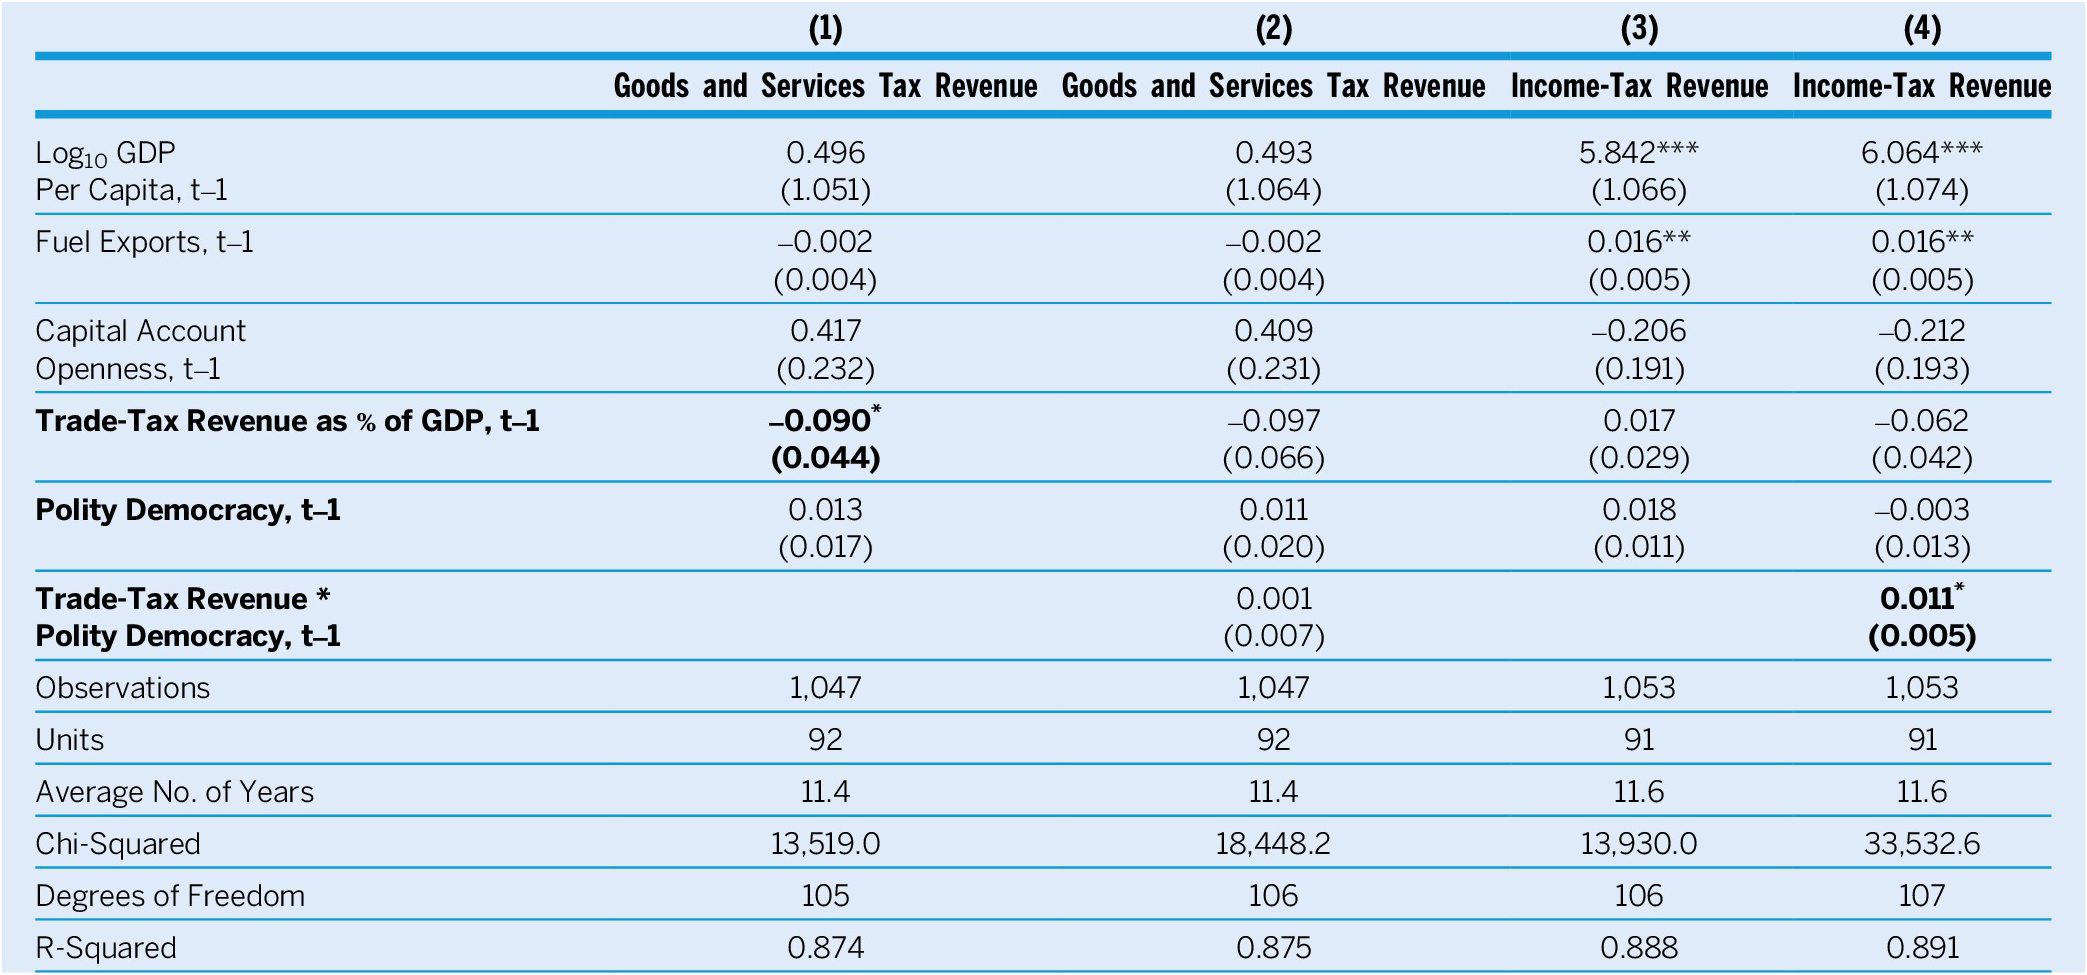
Notes: Standard errors are in parentheses.*p<0.05, **p<0.01, ***p<0.00. Equation 1, 113 coefficients; Equation 3, 114 coefficients. Specification follows the DiP baseline model (DiP table A.1, equations 3 and 4). Revenue stated as percentages of GDP. Democracy index from Polity V (Marshall, Gurr, and Jaggers Reference Marshall, Gurr and Jaggers2020). As controls: log GDP per capita from Penn World Table (Feenstra, Inklaar, and Timmer Reference Feenstra, Inklaar and Timmer2015); fuel exports from World Development Indicators; capital account openness is the normalized Chinn–Ito index (Chinn and Ito Reference Chinn and Ito2006). Ordinary least squares with panel-corrected standard errors. No members of the OECD as of 1990; years 1990–2012. All equations include unit and time dummies.
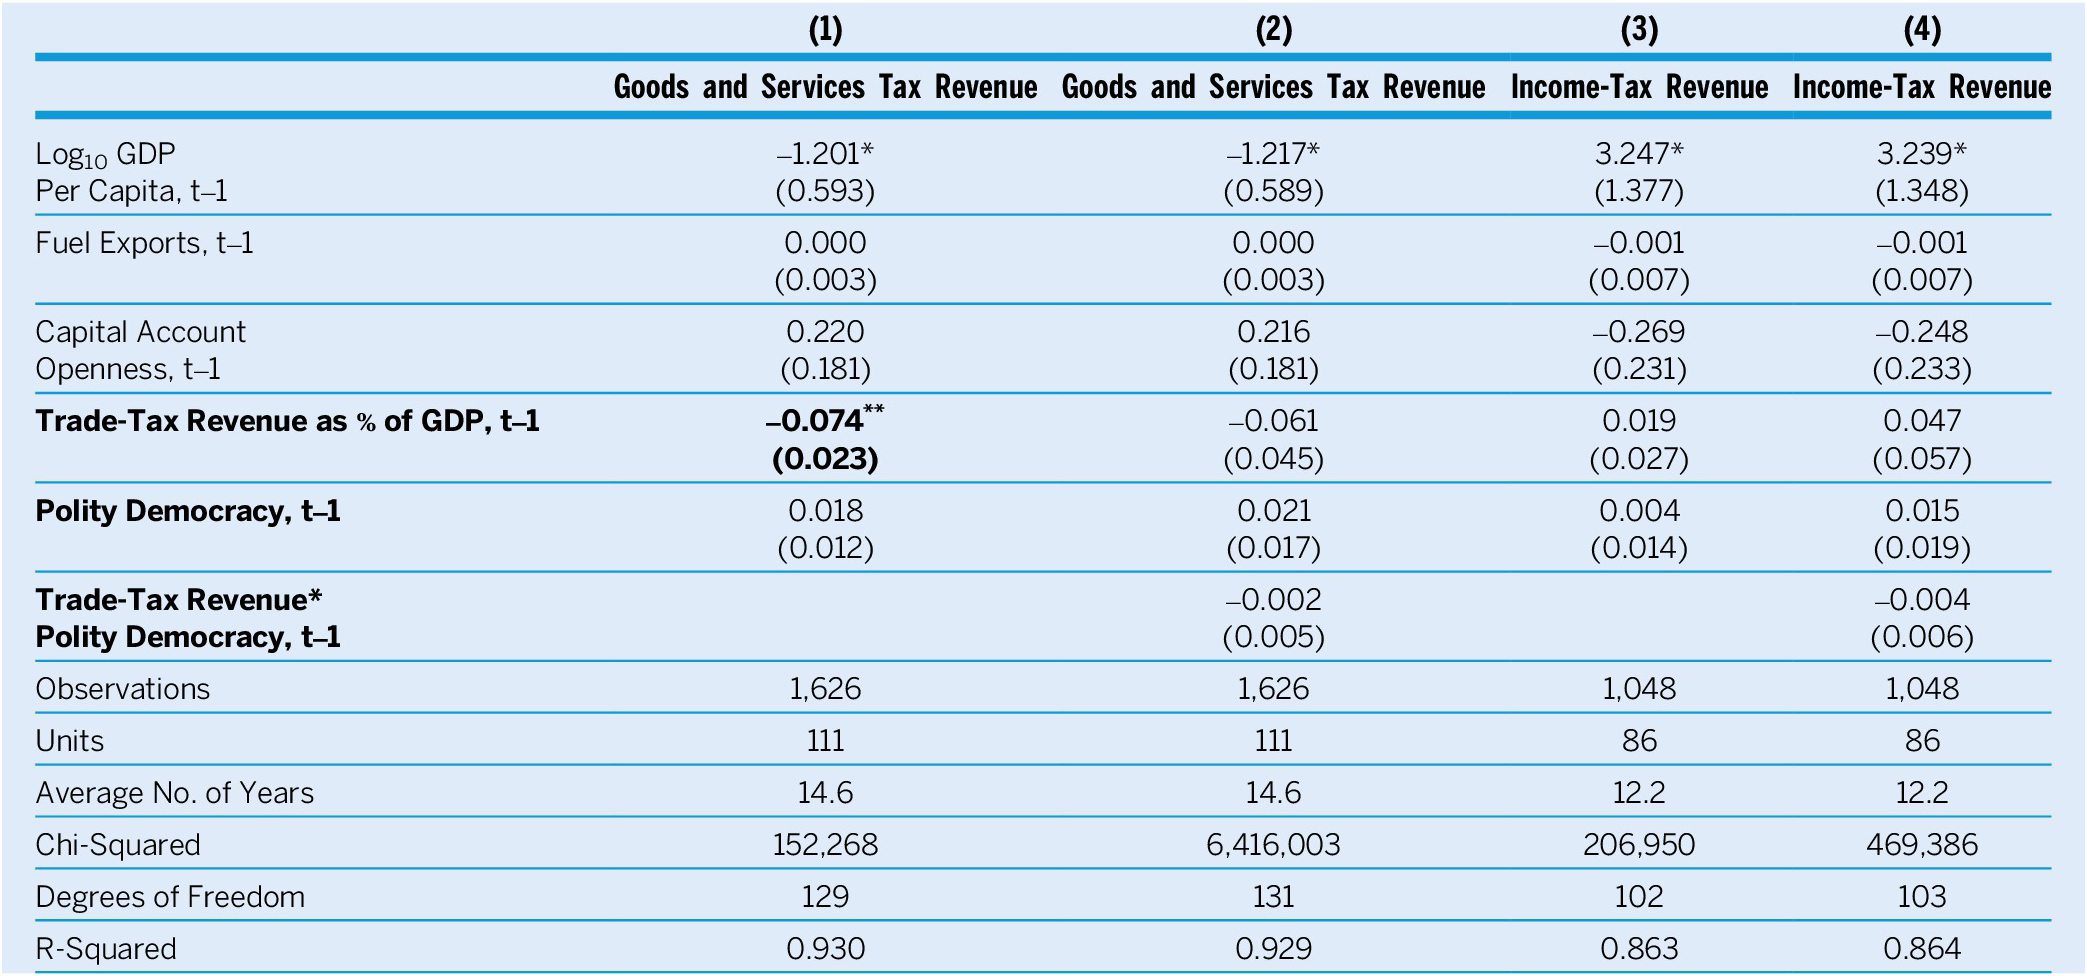
Do these results persist with better data? Table 2 depicts the same analyses with ICTD fiscal data after its first UNU-WIDER Government Revenue Dataset update (2018). It also shows a significant negative coefficient on trade-tax revenue with consumption-tax revenue as the outcome (equation 1). Losses in trade-tax revenue again predict higher revenues from goods and services in the next year—that is, the expected recovery of tax revenues during the fiscal transition. However, the weak democracy and interaction coefficients indicate no discernable influence on these revenue gains coming from regime type.
Consumption-Tax and Income-Tax Revenues (ICTD 2018 Fiscal Data) on Trade-Tax Revenue and Democracy
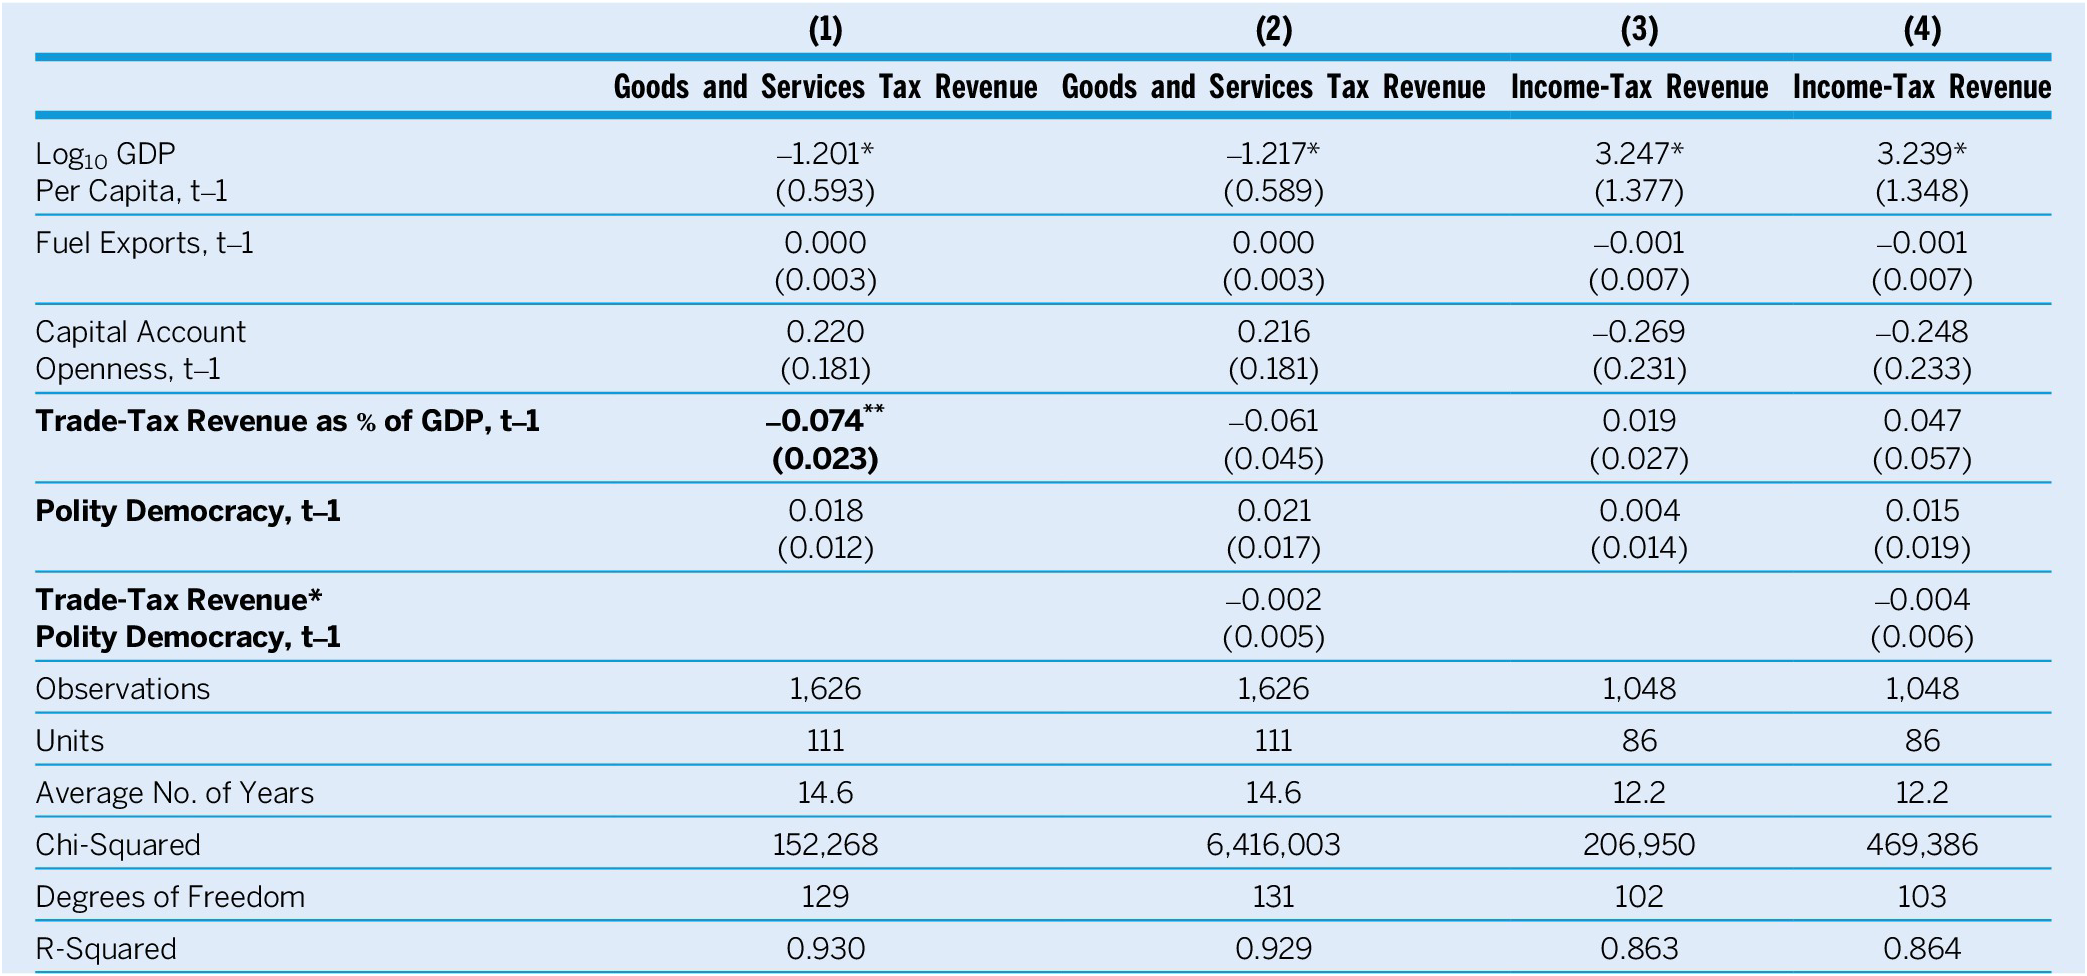
Notes: Standard errors are in parentheses.*p<0.05, **p<0.01, ***p<0.001. Equation 1, 134 coefficients; Equation 3, 132 coefficients. Specification follows the DiP baseline model (DiP table A.1, equations 3 and 4). Revenue stated as percentages of GDP. Democracy index from Polity V (Marshall, Gurr, and Jaggers Reference Marshall, Gurr and Jaggers2020). As controls: log GDP per capita from Penn World Table (Feenstra, Inklaar, and Timmer Reference Feenstra, Inklaar and Timmer2015); fuel exports from World Development Indicators; capital account openness is the normalized Chinn–Ito index (Chinn and Ito Reference Chinn and Ito2006). Ordinary least squares with panel-corrected standard errors. No members of the OECD as of 1990; years 1990–2012. All equations include unit and time dummies.
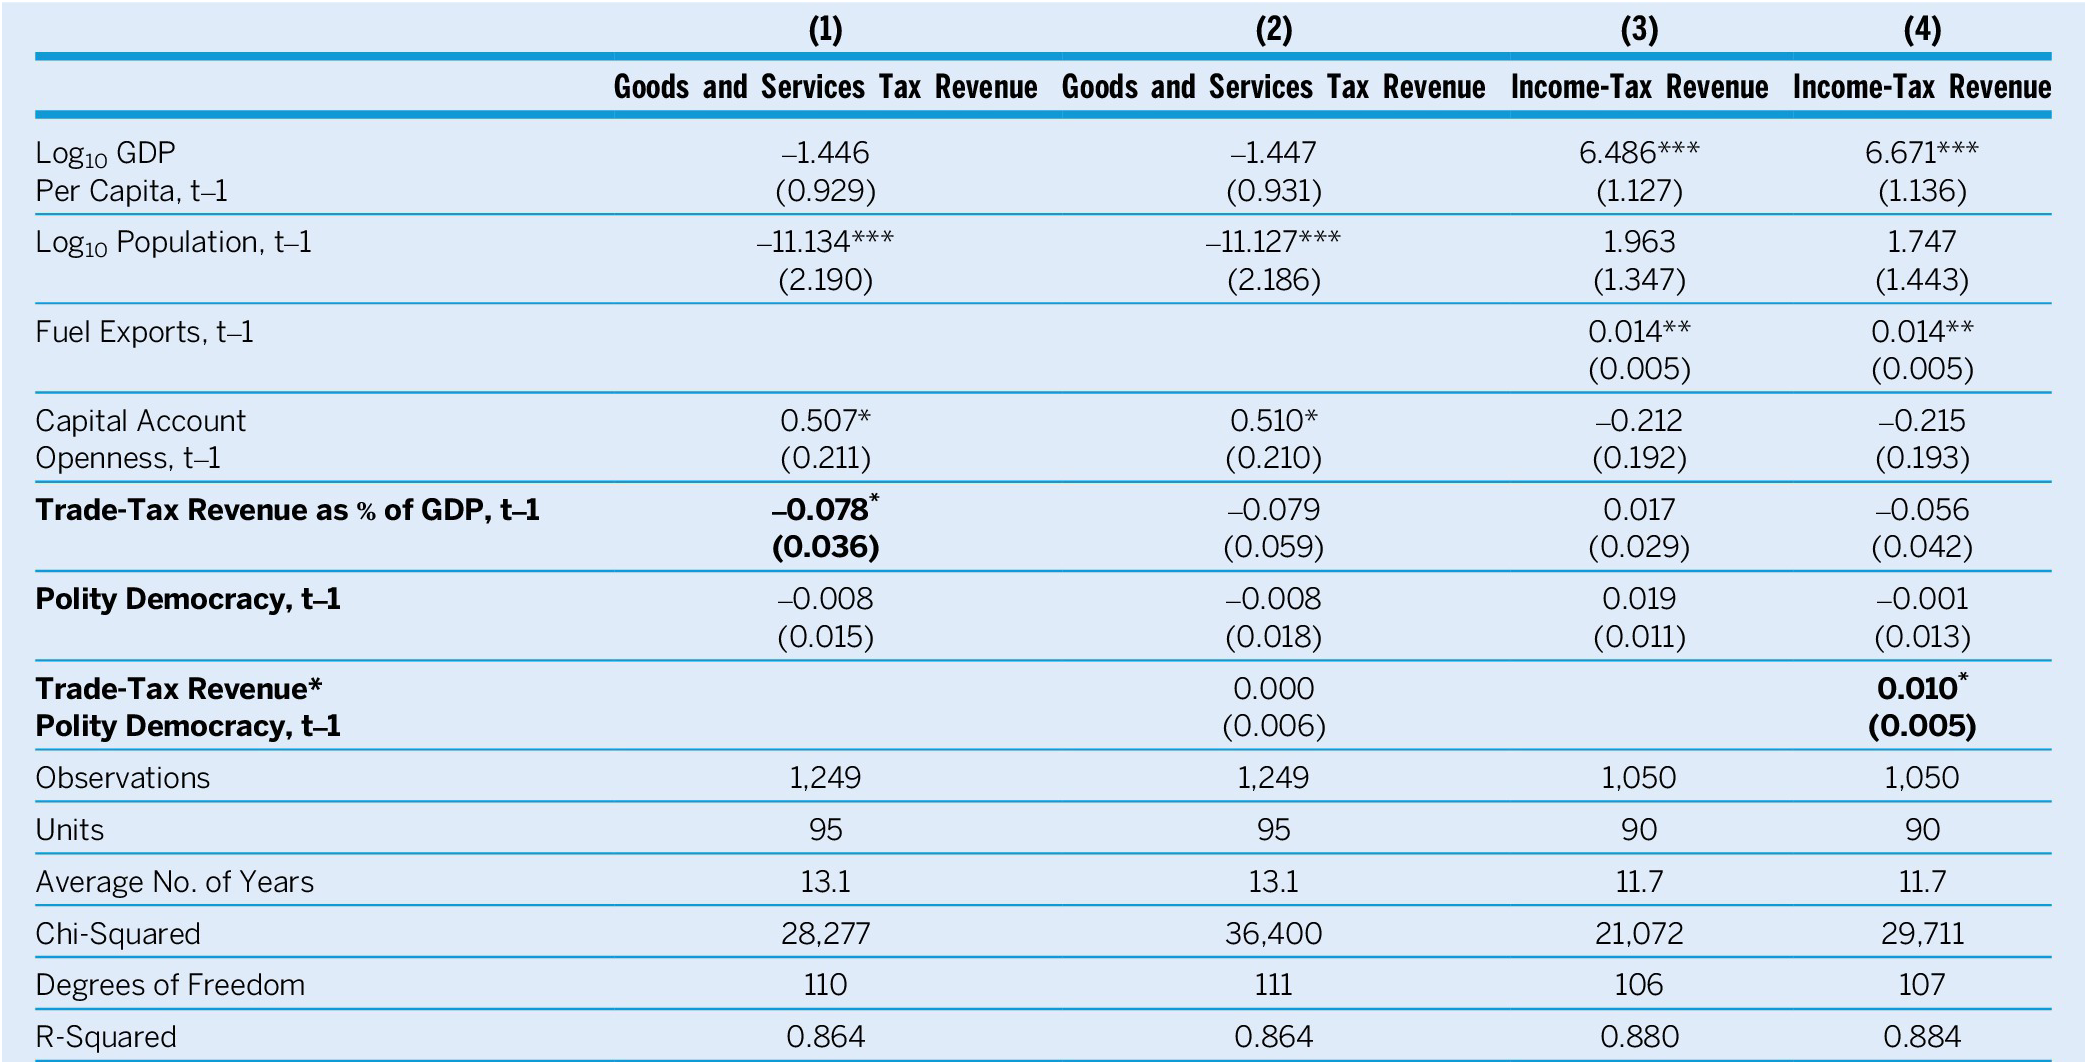
Table 3 presents a third set of regressions, which reproduces table 1 but adjusts the set of covariates based on tests with Akaike and Bayesian information criteria (see appendix tables A.4a and A.4b). These tests recommend omitting fuel exports from regressions with consumption-tax revenues as the outcome and adding the log of population to both pairs of regressions. The results with the adjusted model almost match those in table 1.
Consumption-Tax and Income-Tax Revenues (WDI 2024 Data) on Trade-Tax Revenue and Democracy
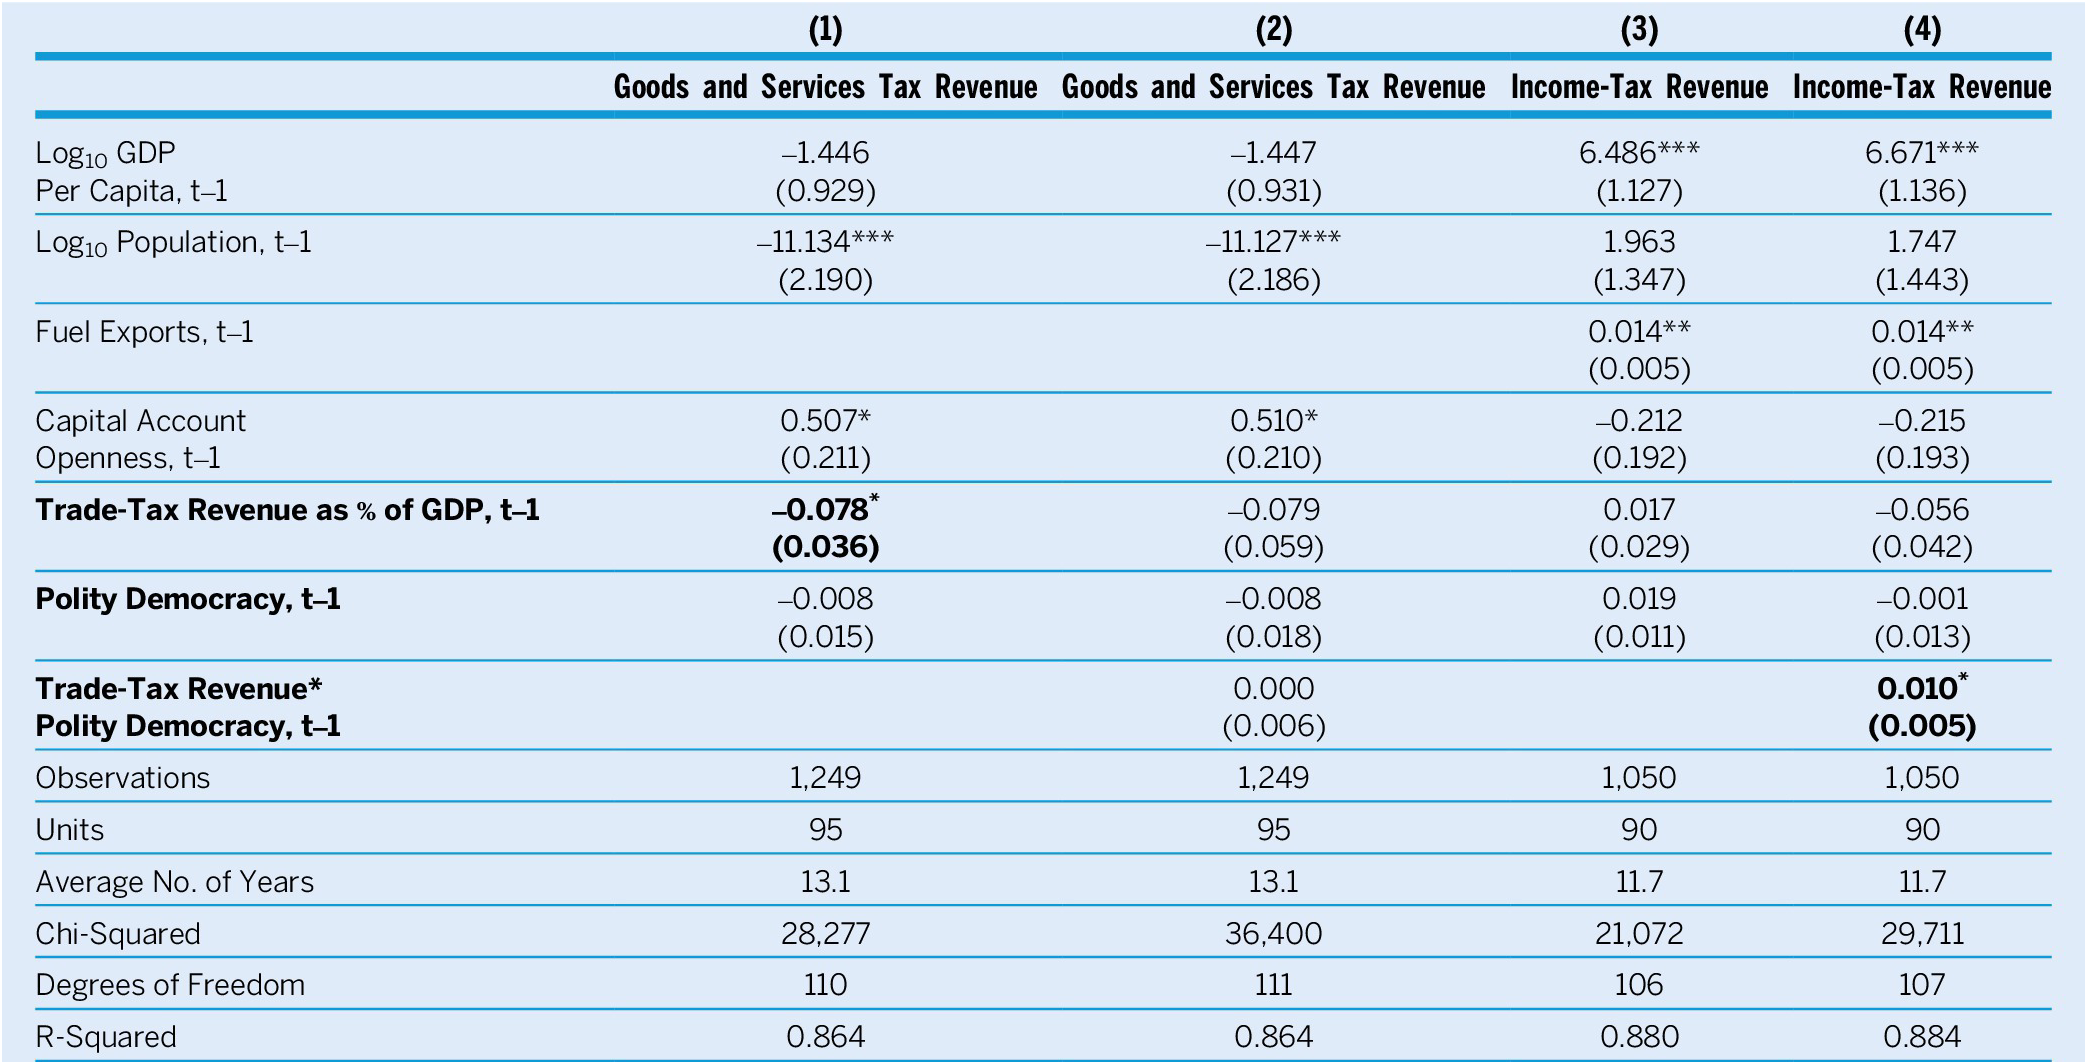
Notes: Standard errors are in parentheses. *p<0.05, **p<0.01, ***p< 0.001. Equation 1, 117 coefficients; Equation 3, 115 coefficients. Specification follows the DiP baseline model (DiP table A.1, equations 3 and 4), adjusted on the basis of information criteria (tables A.4a and A.4b). Revenue stated as percentages of GDP. Democracy index from Polity V (Marshall, Gurr, and Jaggers Reference Marshall, Gurr and Jaggers2020). As controls: log GDP per capita from Penn World Table (Feenstra, Inklaar, and Timmer Reference Feenstra, Inklaar and Timmer2015); log population and fuel exports from World Development Indicators); and capital account openness is the normalized Chinn–Ito index (Chinn and Ito Reference Chinn and Ito2006). Ordinary least squares with panel-corrected standard errors. No members of the OECD as of 1990; years 1990–2012. All equations include unit and time dummies.
Overall, DiP’s argument receives support from these tests but only when using problematic WDI data and when relating to gains of income-tax revenues. These results are not confirmed when applying the book’s baseline model to the more reliable ICTD/UNU-WIDER data.Footnote 9 The data problem seems to have been more severe than the model-specification problem.
CONCLUSION
Bastiaens and Rudra (Reference Bastiaens and Rudra2018) have written a rich, comprehensive, and valuable book about the fiscal politics of developing countries undergoing trade liberalization. Yet, their book does not sustain its major premises. They allege a substantial and damaging “revenue shock” from liberalization, but the damage actually amounted to an average of 1% or 2% of GDP in a decade. These countries’ other revenues varied more significantly, greatly outweighing the effect of liberalization on government income. Moreover, democracies—as evidenced in the graphs of their average revenue performance or in the regression analyses described herein—do not seem to have performed worse than non-democracies in replacing the revenue lost to tariff cuts. They still may have trouble increasing income-tax revenues, but VATs are powerful fiscal tools (in part because they also strike imports), and liberalizing democracies usually have imposed or strengthened them successfully. Although trade liberalization surely has disturbed politics for many reasons, it did not bring an unmanageable revenue shock across developing countries. In this regard, at least, it did not put democracies in peril.
Bastiaens and Rudra (Reference Bastiaens and Rudra2018) allege a substantial and damaging “revenue shock” from liberalization, but the damage actually amounted to an average of 1% or 2% of GDP in a decade.
Although trade liberalization surely has disturbed politics for many reasons, it did not bring an unmanageable revenue shock across developing countries.
SUPPLEMENTARY MATERIAL
To view supplementary material for this article, please visit http://doi.org/10.1017/S1049096525000435.
DATA AVAILABILITY STATEMENT
Research documentation and data that support the findings of this study (Mahon Reference Mahon2025) are openly available at the PS: Political Science & Politics Harvard Dataverse at https://doi.org/10.7910/DVN/FMUVTK.
CONFLICTS OF INTEREST
The author declares that there are no ethical issues or conflicts of interest in this research.


 Open access

