


INTRODUCTION
The Altai Mountains are located in the northern part of central Asia within the territories of Russia, Mongolia, China, and Kazakhstan. The Altai Mountains consist from northwest to southeast of the Russian, the Mongolian, the Chinese, and the Gobi Altai. Two main circulation systems are controlling the climate conditions here at the border between the cold-humid Siberian taiga in the north and the arid Gobi Desert in the south (Wesche et al., Reference Wesche, Ambarlı, Kamp, Török, Treiber and Dengler2016). In the summer, the cyclonic circulation system delivers wet air masses via the westerlies from the Atlantic Ocean, producing most of the annual precipitation. A dry season starts in autumn. During the winter, the Siberian high-pressure cell persists over Siberia and Mongolia, driving cold and dry Artic air masses into the region that induce dry climate and minor snowfall (Böhner, Reference Böhner2006). The position, the seasonal movement, and the intensity of these two Northern Hemisphere climatic systems are responsible for the distribution of regional effective moisture conditions (Herzschuh, Reference Herzschuh2006; Rudaya et al., Reference Rudaya, Tarasov, Dorofeyuk, Solovieva, Kalugin, Andreev, Daryin, Diekmann, Riedel and Tserendash2009). The vegetation pattern, the mountain glaciation, and the endorheic lake levels reflect the local conditions of effective moisture in the semihumid to arid regions of Mongolia. A shift in these landscape elements documents climate changes (Klinge and Sauer, Reference Klinge and Sauer2019). The western part of the (Russian) Altai Mountains receives high precipitation via the westerlies and has humid conditions in summer. In contrast, the eastern part of the Mongolian Altai is situated in the rain shadow and is arid (Klinge et al., Reference Klinge, Böhner and Lehmkuhl2003; Rudaya et al., Reference Rudaya, Tarasov, Dorofeyuk, Solovieva, Kalugin, Andreev, Daryin, Diekmann, Riedel and Tserendash2009). The study area is one of the most continental regions on Earth, having a high annual range of temperatures and low precipitation. Internal drainage exists, and the main rivers run into the terminal lakes of the large basin in the east of the Altai Mountains, called the “Valley of Great Lakes.” Due to this endorheic drainage, mountain glaciation and terminal-lake levels are closely linked and are suitable indicators of local and regional climate development (Gunin et al., Reference Gunin, Vastokova, Dorofeyuj, Tarasov and Black1999; Grunert et al., Reference Grunert, Lehmkuhl and Walther2000; Peck et al., Reference Peck, Khosbayar, Fowell, Pearce, Ariunbileg, Hansen and Soninkhishig2002; Fowell et al., Reference Fowell, Hansen, Peck, Khosbayar and Ganbold2003; Lehmkuhl et al., Reference Lehmkuhl, Klinge, Rother and Hülle2016, Reference Lehmkuhl, Grunert, Hülle, Batkhishig and Stauch2018; Blomdin et al., Reference Blomdin, Stroeven, Harbor, Gribenski, Caffee, Heyman and Rogozhina2018; Klinge and Sauer, Reference Klinge and Sauer2019).
The spatial extension of recent and past glaciations can be mapped by fieldwork, satellite images, aerial photos, and topographic maps (Klinge, Reference Klinge2001; Blomdin et al., Reference Blomdin, Heyman, Stroeven, Hättestrand, Harbor, Gribenski and Jansson2014; Kamp et al., Reference Kamp, Krumwiede, McManigal, Pan, Walther and Dashtseren2013a; Reference Kamp, McManigal, Dashtseren and Walther2013b). The modern glaciation in the Altai Mountains is restricted to the highest peaks in the centers of mountain massifs and consists of plateau glaciers and ice caps with triangular glacial tongues, cirque glaciers, and small valley glaciers. On the basis of satellite images, Yabuki and Ohata (Reference Yabuki and Ohata2009) have identified a total of 578 Mongolian glaciers covering an area of 423 km2. The glaciated area decreases to the southeast, while the climatic snowline increases from 2600 m above sea level (asl) in the western Russian Altai to 3700 m asl in the southeastern Mongolian Altai (Klinge, Reference Klinge2001; Klinge et al., Reference Klinge, Böhner and Lehmkuhl2003; Lehmkuhl, Reference Lehmkuhl2012). Former glaciations are determined and distinguished by glacial deposits and erosion landforms (Grunert et al., Reference Grunert, Lehmkuhl and Walther2000; Klinge, Reference Klinge2001; Lehmkuhl et al., Reference Lehmkuhl, Klinge, Stauch, Ehlers and Gibbard2004, Reference Lehmkuhl, Klinge, Stauch, Ehlers, Gibbard and Hughes2011; Blomdin et al., Reference Blomdin, Heyman, Stroeven, Hättestrand, Harbor, Gribenski and Jansson2014; Ganyushkin et al., Reference Ganyushkin, Chistyakov, Volkov, Bantcev, Kunaeva, Brandová, Raab, Christl and Egli2018). Glacial deposits are represented by till and sediments from different types of moraines. Cirques, U-shaped valleys, and small lakes in depressions formed by glacial confluence and erosion indicate landforms of glacial erosion. Several mountain glaciations with large valley glaciers, which partly stretched into the basins, occurred in the westernmost part of the Mongolian Altai during the Pleistocene. In contrast, most of the Pleistocene glaciation in western Mongolia was limited due to the precipitation reduction from west to east. Both Pleistocene and present-day climatic snowlines have a rising gradient toward the east. According to Lehmkuhl et al. (Reference Lehmkuhl, Klinge, Stauch, Ehlers, Gibbard and Hughes2011), the gradient of the snowlines toward arid regions was steeper during glacial times. Snowline depressions during the Pleistocene glaciations were more than 1000 m in the wettest parts of the western Russian Altai but only 800 to 400 m in the eastern part of the Russian Altai and in the Mongolian Altai, respectively (Lehmkuhl et al., Reference Lehmkuhl, Klinge, Stauch, Ehlers, Gibbard and Hughes2011).
It is commonly accepted that the two maximum glacial stages in western Mongolia are clearly distinguished by the distribution of well-defined groups of moraine ridges (Klinge, Reference Klinge2001; Lehmkuhl et al., Reference Lehmkuhl, Klinge, Stauch, Ehlers and Gibbard2004, Reference Lehmkuhl, Klinge, Rother and Hülle2016). In front of the terminal moraines of these stages, remnants of a third moraine unit, which are strongly denuded, can be identified occasionally as the maximum stage of an older glacial period. These moraines were classified by geomorphological evidence, such as weathering criteria and connection to glaciofluvial terraces, as M0 and M1a/b for the last glacial period (MIS 5d–2) and as M2 for the penultimate glaciation (Grunert et al., Reference Grunert, Lehmkuhl and Walther2000; Lehmkuhl et al., Reference Lehmkuhl, Klinge, Stauch, Ehlers and Gibbard2004). While the maximum extension of the late Pleistocene glaciation is widely identified, the exact timing of the local last glacial maximum (lLGM) is still a matter of debate. The first classifications of the glacial stages were based on morphostratigraphic correlations to the Siberian glacial system (Arkhipov et al., Reference Arkhipov, Isayeva, Bespaly and Glushkova1986; Grunert et al., Reference Grunert, Lehmkuhl and Walther2000; Lehmkuhl et al., Reference Lehmkuhl, Klinge, Stauch, Ehlers and Gibbard2004). Two main glacial stages (M1a/b) were correlated to the Sartan and early Zyrianka glaciations, which correspond to MIS 2 and 4, respectively. The older M2 was assigned to the Taz or Somarova glaciations of mid-Pleistocene age, whereas late glacial stages were assigned to M0 (Lehmkuhl et al., Reference Lehmkuhl, Klinge, Stauch, Ehlers and Gibbard2004). Since the 1990s, radiometric dating by 14C analysis and the luminescence method were used to determine the numerical ages for the glacial deposits (Lehmkuhl and Lang, Reference Lehmkuhl and Lang2001; Lehmkuhl et al., Reference Lehmkuhl, Klinge, Stauch, Ehlers, Gibbard and Hughes2011, Reference Lehmkuhl, Klinge, Rother and Hülle2016; Ganyushkin et al., Reference Ganyushkin, Chistyakov, Volkov, Bantcev, Kunaeva, Brandová, Raab, Christl and Egli2018). Organic matter from paleosols, wood, and peat can be dated with the first method, eolian and occasionally fluvial and lacustrine sediments with the latter. However, these methods are not suitable for direct examination of the glacial till, because the development of organic material and the total bleaching of grains seldom occur simultaneously with its deposition. The ages provide just a temporal framework, but may not reflect the accurate age for the deposition of a moraine or the timing of the corresponding glacial period. The 10Be surface-exposure dating method (cosmogenic radionuclide) represents a valuable tool to determine the ages of erratic boulders placed upon the moraines and the baring of roche moutonées. However, the morphological history of a boulder transported, deposited, and retransported by glacial and periglacial processes does not lead to a total resetting of the radiometric clock in every case. Thus, several samples from one moraine are necessary to detect outliers from the central time range (Heyman et al., Reference Heyman, Stroeven, Harbor and Caffee2011).
A review of the state of investigations about dating of glacial moraines in Mongolia has been published by Khandsuren et al. (Reference Khandsuren, Seong, Oh, Rhee, Sandag and Yu2019). To summarize, the MIS 2 glaciation was the most explicit stage of the last glacial period found in every mountain region of Mongolia, whereas the timing of a previous stage varies among MIS 3, 4, and late 5. A late glacial stage was widespread in the Mongolian mountains and is generally reported for the period between 18 and 15 ka in the beginning of the late-glacial period (LGP; 18–11.5 ka). The MIS 3 glacial advance was attributed to a wet phase under cool climate conditions, whereas the MIS 2 glacial stage represents the coldest and dry period of the last glaciation (Rother et al., Reference Rother, Lehmkuhl, Fink and Nottebaum2014; Batbaatar et al., Reference Batbaatar, Gillespie, Fink, Matmon and Fujioka2018; Khandsuren et al., Reference Khandsuren, Seong, Oh, Rhee, Sandag and Yu2019). The temperature generally increased after the LGM (MIS 2; Clark et al., Reference Clark, Dyke, Shakun, Carlson, Clark, Wohlfarth, Mitrovica, Hostetler and McCabe2009), and the last distinct glacial advance occurred during a global cooling event around 16 ka (Khandsuren et al., Reference Khandsuren, Seong, Oh, Rhee, Sandag and Yu2019). However, Batbaatar et al. (Reference Batbaatar, Gillespie, Fink, Matmon and Fujioka2018) provided evidence, based on glacial advances during wet climate periods in the Holocene, that regional glaciation is not only controlled by coldness but also by higher precipitation and seasonality of temperature.
Higher paleolake levels, often interpreted as periods of increased effective moisture, were reported in a local context in the Mongolian Altai for different periods in the late Pleistocene (Devyatkin, Reference Devyatkin1981; Naumann, Reference Naumann1999; Walther, Reference Walther1999; Grunert et al., Reference Grunert, Lehmkuhl and Walther2000; Klinge and Lehmkuhl, Reference Klinge and Lehmkuhl2013). Although there are several systems of beach walls and strandlines detectable around the terminal lakes in western Mongolia, radiometric dating of these landscape elements is rare. High lake levels were reported for the Uvs Nuur basin (nuur means “lake” in the Mongolian language) (Fig. 1) in the LGP between 13 and 11 ka, whereas very low lake levels or desiccation occurred at the end of LGM in the transition to the LGP (20–16 ka) (Grunert et al., Reference Grunert, Lehmkuhl and Walther2000). Based on these findings and concordant with other research in the region, Grunert et al. (Reference Grunert, Lehmkuhl and Walther2000) assumed a wet-cold period between 32 and 25 ka during glacial build up (anaglacial phase), and a dry-cold period between 24–15 ka of the LGM, when the glaciers persisted at their maximum extensions (kataglacial phase) (Hövermann, Reference Hövermann1998; Lehmkuhl and Haselein, Reference Lehmkuhl and Haselein2000). The low lake level of Uvs Nuur during the LGM was induced by dry conditions, whereas meltwater and increased precipitation led to rising lake levels at the end of the LGP. For the Achit Nuur basin (Fig. 1), which drains into the Valley of Great Lakes via the Khovd Gol (gol means “river” in the Mongolian language), Agatova and Nepop (Reference Agatova and Nepop2019) hypothesized episodically high lake levels induced by cataclysmic outburst floods from glacier- and moraine-dammed lakes in the Mogen-Buren depression in the north before 11 ka.
(color online) Areas of investigation in the Mongolian Altai. The map shows the glaciated area during the late Pleistocene and the expansion of high lake levels during the late glacial period. (SRTM digital elevation model 90m, Projection UTM Zone 46 North). (A) Khoton Nuur and Khurgan Nuur; (B) Tsagaan Gol; (C) Ekhen Nuur; (D) Munkh Khairkhan. Box in the inset map indicates the extent of the main map. LGM, last glacial maximum.

In particular, changing climate influences the growing conditions and density of the vegetation cover in the semiarid regions. Increasing precipitation leads to a higher density of steppe vegetation, whereas the effect of cool temperature on the vegetation cover is more differentiated. Cool summers may reduce the occurrence of drought events, but they also may reduce the growing season due to a decrease in frost-free days. Pollen records from different archives provide information on past vegetation distribution and paleo-environmental conditions. Most of the pollen records from the Mongolian Altai and western Mongolia are of Holocene age (Gunin et al., Reference Gunin, Vastokova, Dorofeyuj, Tarasov and Black1999; Fowell et al., Reference Fowell, Hansen, Peck, Khosbayar and Ganbold2003; Rudaya et al., Reference Rudaya, Tarasov, Dorofeyuk, Solovieva, Kalugin, Andreev, Daryin, Diekmann, Riedel and Tserendash2009; Unkelbach et al., Reference Unkelbach, Dulamsuren, Punsalpaamuu, Saindovdon and Behling2017, Reference Unkelbach, Kashima, Enters, Dulamsuren, Punsalpaamuu and Behling2019). Pollen records from periods older than the MIS 2 (LGM) are exclusively reported by Ma et al. (Reference Ma, Liu, Feng, Meng, Sang, Wang and Zhang2013). Pollen records from lake sediments were investigated by Sun et al. (Reference Sun, Feng, Ran and Zhang2013) from the Achit Nuur, reaching back until 22.6 ka, and by Tian et al. (Reference Tian, Herzschuh, Telford, Mischke, van der Meeren, Krengel and Richardson2014) from the Bayan Nuur, starting around 15.6 ka. At Khoton Nuur (Fig. 1), a glacial lake impounded by a terminal moraine upstream of the Khurgan Nuur, Rudaya et al. (Reference Rudaya, Tarasov, Dorofeyuk, Solovieva, Kalugin, Andreev, Daryin, Diekmann, Riedel and Tserendash2009) and Rudaya and Li (Reference Rudaya and Li2013) analyzed pollen, diatoms, and organic elements. The authors inferred a cold and dry LGP before 11.5 ka, based on pollen spectra indicating dry steppe vegetation and diatoms pointing to cold lake water. Thereafter, the climate changed to warm and humid during the early Holocene. Eolian sediments, reported for the LGP from various sites in the Altai Mountains (Grunert et al., Reference Grunert, Lehmkuhl and Walther2000; Feng, Reference Feng2001; Peck et al., Reference Peck, Khosbayar, Fowell, Pearce, Ariunbileg, Hansen and Soninkhishig2002; Feng et al., Reference Feng, Zhai, Ma, Huang, Wang, Zhang, Khosbayar, Narantsetseg, Liu and Rutter2007; Yang et al., Reference Yang, Preusser and Radtke2006) are commonly regarded as indicators for enhanced dust transport under dry conditions. Increasing intensity of wind gustiness (Roe, Reference Roe2009) may also amplify eolian transport. In addition, high dust supply from silty sediments, which are exposed to deflation due to retreating glaciers and desiccating lakes, may cause enhanced eolian deposition.
The often contradicting evidence from glacial advances, lake stands, vegetation changes, and climate reconstructions for the late Pleistocene make analysis of specific local driver(s) behind environmental changes challenging. As described earlier, common agreement for a cold and dry climate during the LGM around 20 ka exists, but the climate reconstructions before (MIS 3) and after (LGP) are still a matter of debate. Against this regional background, we present new data for lake and vegetation development derived from small catchments in the Mongolian Altai during these periods. We hypothesize that increased effective moisture led to the glacial expansion in the initial phase (anaglacial) starting at the end of MIS 3, with glaciers persisting during the cold and dry LGM, whereas rising temperature and evaporation induced the rapid depletion of glaciers and melting of permafrost during the late phase (kataglacial) in the second half of the LGP. We discuss our findings with regard to existing paleo-data to decipher the complex interconnections among lakes, vegetation, glaciers, and climate.
STUDY AREA
The Mongolian Altai is located in western Mongolia and consists of separated mountain massifs, reaching up to more than 4000 m asl. The Khovd Gol drains the northwestern part of the Mongolian Altai into the Valley of Great Lakes. The great lakes Khar Us Nuur, Khar Nuur, and Khyargas Nuur are distributed in this endorheic basin to the east of the Mongolian Altai. The northernmost part belongs to the catchment of the Uvs Nuur basin. Furthermore, several closed basins with small catchments occur due to the arid climate in the lee of the Russian Altai and tectonic activity. The climate in the region is highly continental, varying between semiarid in the mountains and arid to hyperarid in the basins. The mean annual air temperature ranges between −11°C in the mountains and 3°C in the basins, and large annual amplitudes between 45 and 60 K of mean monthly air temperatures exist (Karger et al., Reference Karger, Conrad, Böhner, Kawohl, Kreft, Soria-Auza, Zimmermann, Linder and Kessler2017). In winter, the Siberian high-pressure cell results in cold and dry conditions with mean air temperatures between −15°C and −35°C, with extreme temperatures of −56°C in the Uvs Nuur depression (Barthel, Reference Barthel1983; Batima et al., Reference Batima, Natsagdorj, Gombluudev and Erdenetsetseg2005). The main precipitation derives from cyclones and occurs when the westerlies carry humid air masses along the Siberian lowlands. Thus, about 85% of the precipitation occurs in summer between April to September. The growing season ends with a dry period in autumn. The winter is mostly dry with little snowfall (Lehmkuhl and Klinge, Reference Lehmkuhl and Klinge2000). The mean annual precipitation in the Mongolian Altai is more than 500 mm in the high mountains and less than 50 mm in the interior basins (Barthel, Reference Barthel1983; Batima et al., Reference Batima, Natsagdorj, Gombluudev and Erdenetsetseg2005; Böhner, Reference Böhner2006; Karger et al., Reference Karger, Conrad, Böhner, Kawohl, Kreft, Soria-Auza, Zimmermann, Linder and Kessler2017). The basins and valleys are covered by steppe and desert–steppe vegetation. In some parts of the mountains, a lower vegetation belt of forest steppe exists. In the forest–steppe ecotone, forests of mostly Larix sibirica occur on north-facing slopes, whereas mountain steppe covers south-facing slopes (Schlütz et al., Reference Schlütz, Dulamsuren, Wieckowska, Mühlenberg and Hauck2008). In the high mountains, an alpine belt with dense shrub vegetation and meadows leads to the periglacial zone of frost debris. Along the rivers, dense meadows and trees like poplar, willow, and larch occur (Hilbig, Reference Hilbig1995).
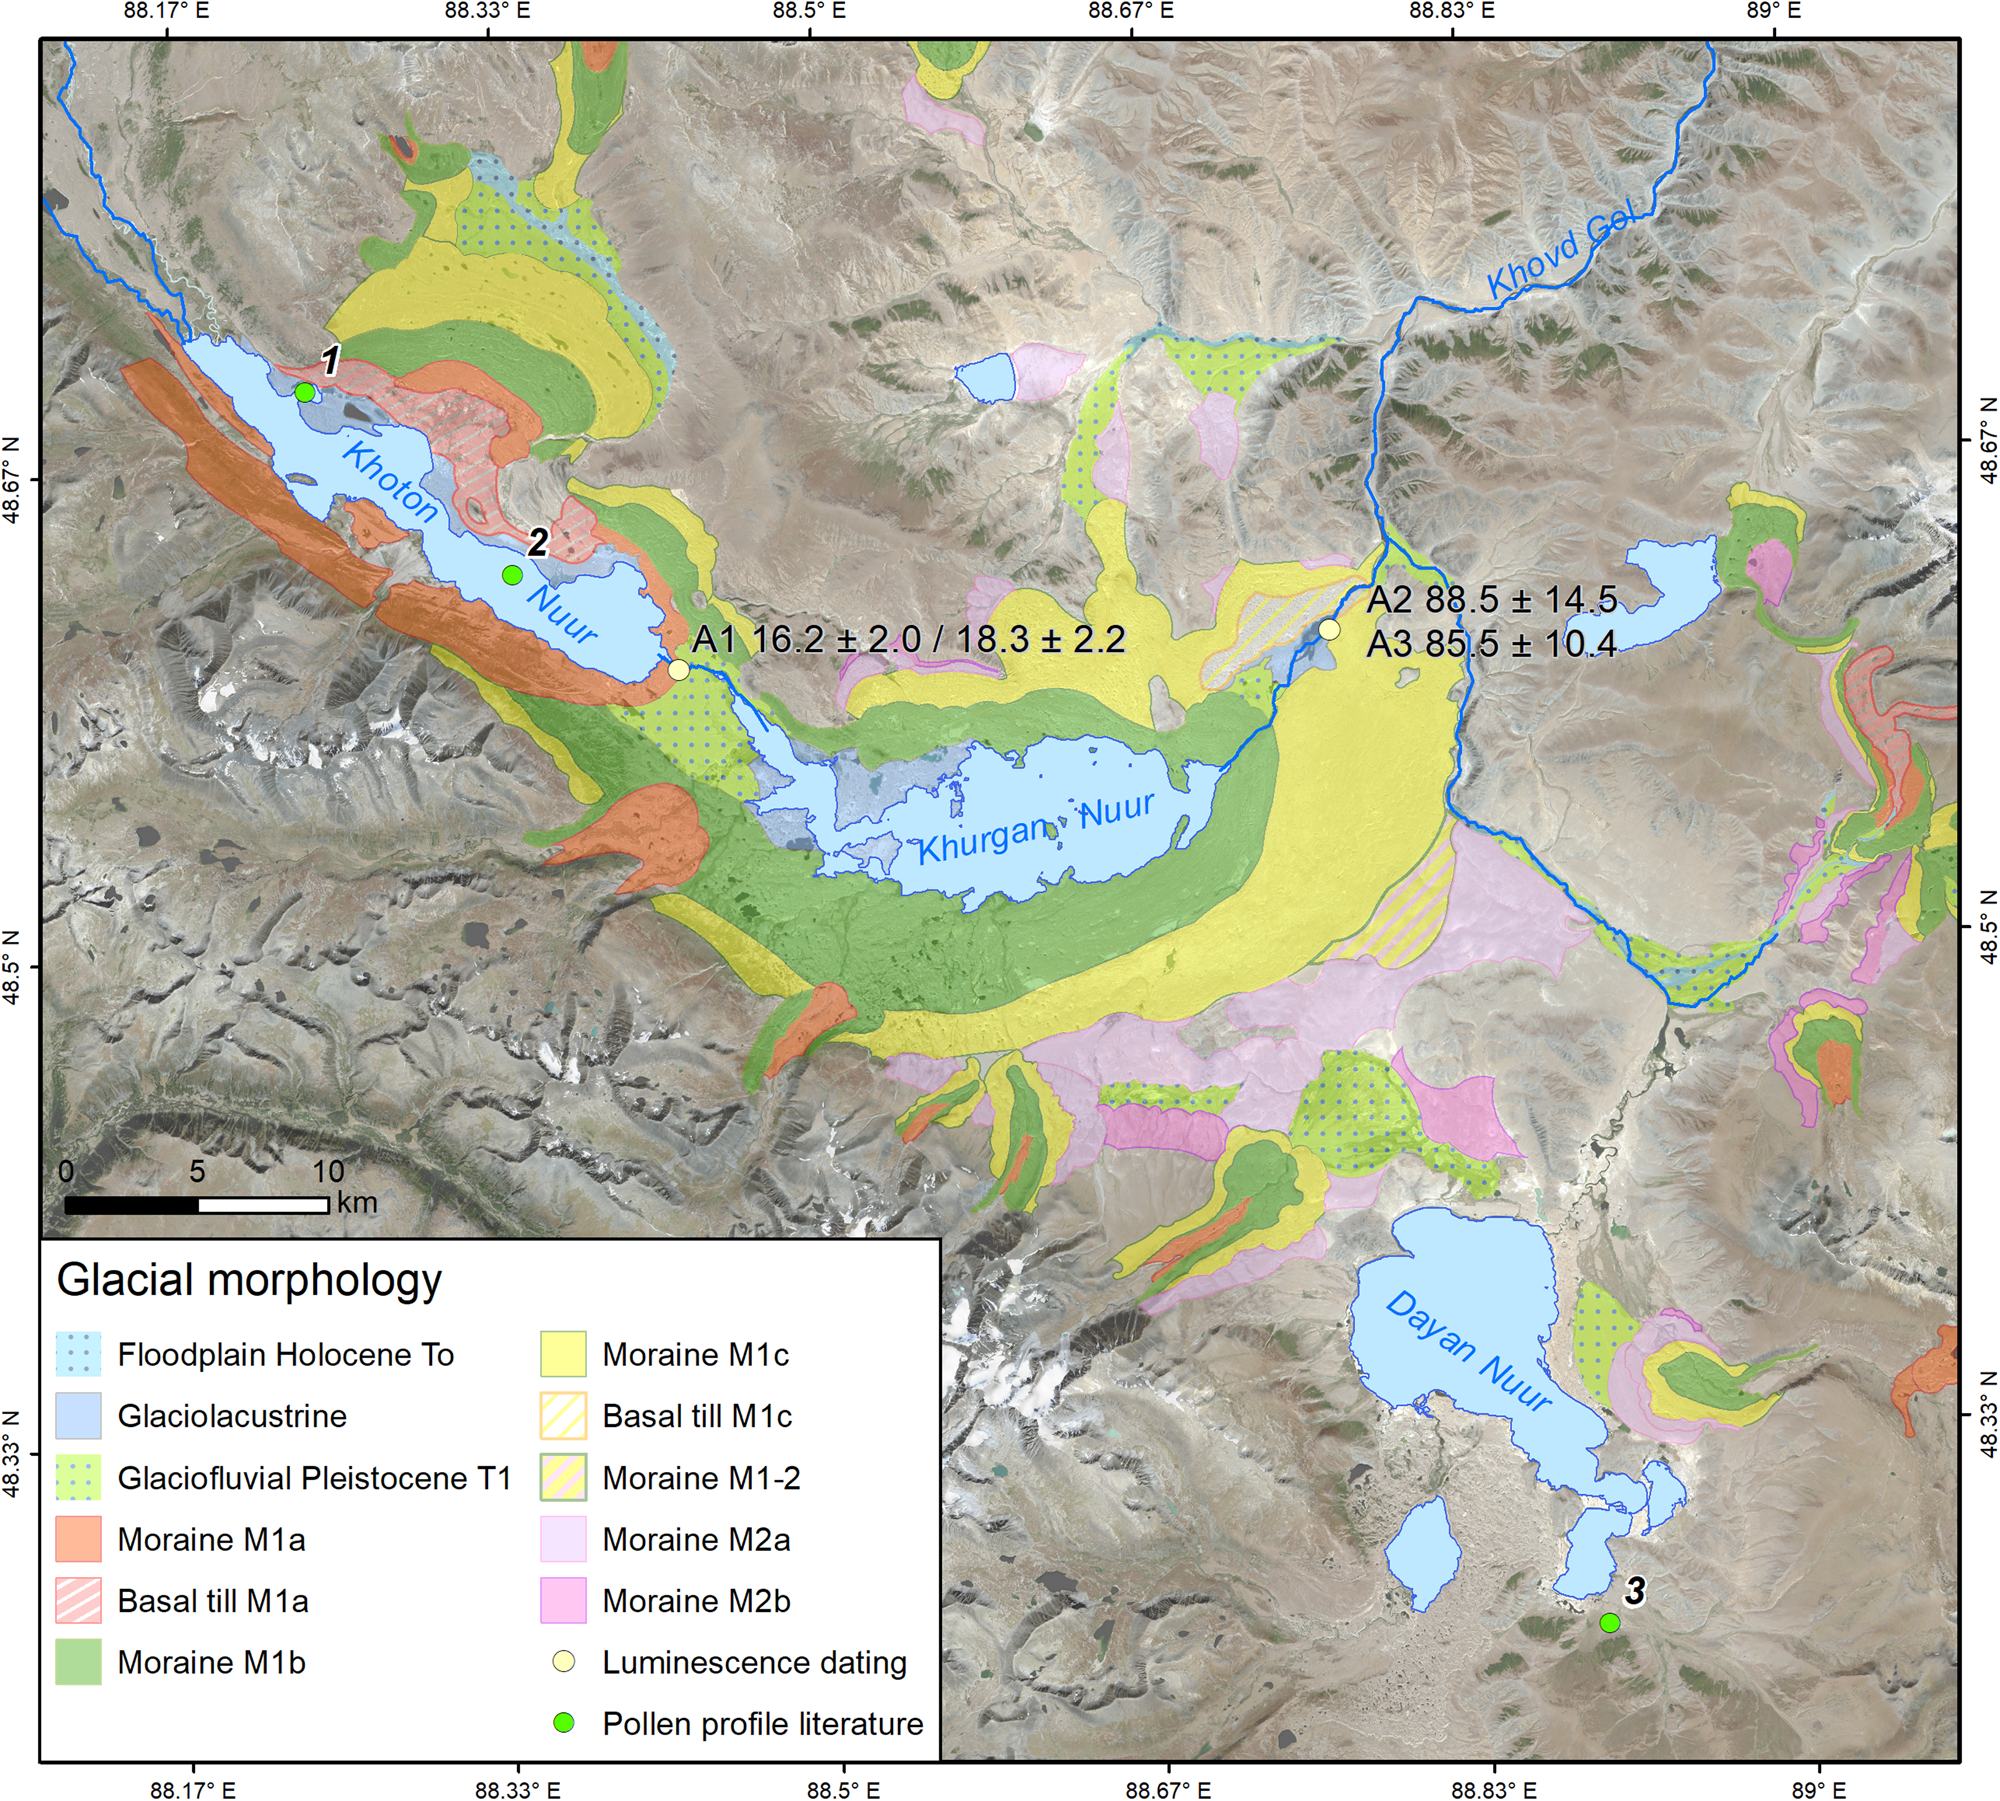
The detailed investigations focus on four study sites (Fig. 1, sites A–D). Two sites are located at large glacial terminal moraine complexes in the western Mongolian Altai connected to the highest Mongolian peak, Tavan Bogd (4374 m asl). The Khoton Nuur (Fig. 2, site A1) and Khurgan Nuur (Fig. 2, sites A2 and A3) terminal moraines lie in a wide intermountain basin drained by the Khovd Gol. Study site B is situated in front of a terminal moraine near the tectonic valley of the Tsagaan Gol. The Ekhen Nuur (site C) lies in a small intermountain basin. The high-altitude site Munkh Khairkhan (site D) is located in the southern part of the Mongolian Altai, with the investigated lake dammed in a closed basin by a lateral moraine.
Glacial morphology and sampling sites at Khoton Nuur (A1) and Khurgan Nuur (A2, A3). New luminescence ages (in ka ± 1σ error) are indicated by yellow dots. The drilling sites of (1) Gunin et al. (Reference Gunin, Vastokova, Dorofeyuj, Tarasov and Black1999), (2) Rudaya et al. (Reference Rudaya, Tarasov, Dorofeyuk, Solovieva, Kalugin, Andreev, Daryin, Diekmann, Riedel and Tserendash2009) and Rudaya and Li (Reference Rudaya and Li2013), and (3) Unkelbach et al. (Reference Unkelbach, Dulamsuren, Punsalpaamuu, Saindovdon and Behling2017, Reference Unkelbach, Kashima, Enters, Dulamsuren, Punsalpaamuu and Behling2019) are indicated by green dots. The background Landsat 8 satellite image was recorded on August 31, 2014. (For interpretation of the references to color in this figure legend, the reader is referred to the web version of this article.)
The palynological analyses were done at sites C and D. The landscape around the Ekhen Nuur (site C; 2115 m asl) is dominated by steppes rich in Poaceae (Agropyron cristatum, Stipa krylovii, etc.) accompanied by Caryophyllaceae (Arenaria meyeri, A. capillaris, Silene repens), Potentilla sericea, Artemisia frigida, and other Asteraceae, Apiaceae, and Lamiaceae. The vegetation of the desert steppes (semideserts) to the east in the Achit Nuur basin consists of Stipa glareosa, Stipa gobica, several Chenopodiaceae (Anabasis brevifolia, Eurotia ceratoides, Chenopodium frutescens), Artemisia xerophytica, and other Asteraceae (Ajania, Asterothamnus). The Munkh Khairkhan site (site D) (2730 m asl) is situated near the upper border of the mountain steppe with a variety of Poaceae that grades to alpine vegetation rich in Cyperaceae like Kobresia humilis and Carex rupestris. The endemic Caryophyllaceae Stellaria pulvinata grows between 2600 and 3300 m asl, and Potentilla nivea is found from the mountain steppes up to about 3000 m asl (Bocharnikov et al., Reference Bocharnikov, Ogureeva and Miklyaeva2015). The very restricted forests of the Mongolian Altai are dominated by Siberian larch (L. sibirica). The forest belt has a small vertical extension (400–0 m) between its lower boundary at 2000–2400 m asl and the upper treeline at about 2400–2600 m asl (Klinge et al., Reference Klinge, Dulamsuren, Erasmi, Karger and Hauck2018). The closest modern occurrences of L. sibirica to the palynological sites are open stands with isolated trees that are at least 20 km away. Siberian spruce (Picea obovata) and Siberian pine (Pinus sibirica) grow at a very few sites in the northwestern part of the mountain range near to the borders with China and Russia. Dark taiga with Siberian fir (Abies sibirica) is restricted today to the Khentei Mountains in northeastern Mongolia (Dulamsuren et al., Reference Dulamsuren, Welk, Jäger, Hauck and Mühlenberg2005; Grubov, Reference Grubov2011). The nearest stands of A. sibirica to the study sites lie to the north in the Russian taiga. Based on dated charcoals, spruce but also fir were growing together with larch in the southern part of the Mongolian Altai around 4000 yr BP (Dinesman et al., Reference Dinesman, Kiseleva and Knyazev1989), and at least larch even reached the Gobi Altai during the wetter middle Holocene (Miehe et al., Reference Miehe, Schlütz, Miehe, Opgenoorth, Cermak, Samiya, Jäger and Wesche2007).
METHODS
Fieldwork and mapping
Sediment profiles at several terminal lakes with small catchment areas were examined and sampled for pollen analysis and radiocarbon and luminescence dating during fieldwork in western Mongolia (Fig. 1, Table 1). The geomorphological maps illustrating the stratigraphic positions of the investigation sites were compiled from field mapping, Landsat 8 satellite images, and the SRTM digital elevation model.
Description of sediment profiles.

14C dating
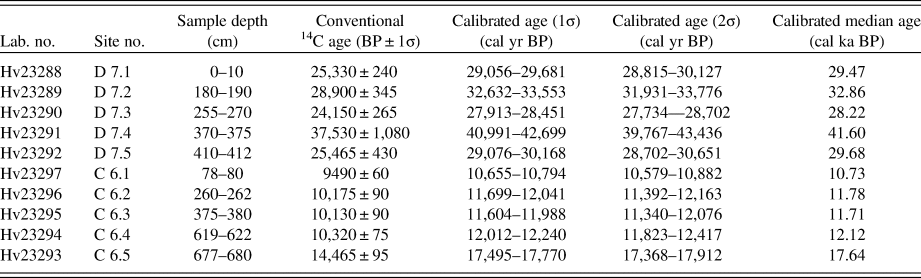
Radiocarbon dates on sampled plant remains were determined by the conventional 14C method at the laboratory of the Joint Geoscientific Research Institute in Hanover, Germany (Table 2). The radiocarbon ages are calibrated with the Calib Rev 7.0.4 Software (Stuiver and Reimer, Reference Stuiver and Reimer1993) using the IntCal13 data set (Reimer et al., Reference Reimer, Bard, Bayliss, Beck, Blackwell, Ramsey and Buck2013) and presented in cal ka BP in the text.
Results of 14C dating.

Luminescence dating
Optically stimulated luminescence (OSL) and infrared stimulated luminescence (IRSL) dating was applied on five samples from five sections to determine the timing of deposition. Quartz has been shown to bleach much faster than potassium feldspar (Colarossi et al., Reference Colarossi, Duller, Roberts, Tooth and Lyons2015; Thomsen et al., Reference Thomsen, Murray, Jain and Bøtter-Jensen2008) and is therefore often preferred for luminescence dating. Unfortunately sand-sized quartz from Mongolia is often conjoined with feldspar inclusions, which usually compromises the reliability of quartz OSL dating (Hülle et al., Reference Hülle, Hilgers, Radtke, Stolz, Hempelmann, Grunert, Felauer and Lehmkuhl2010; Lehmkuhl et al., Reference Lehmkuhl, Klinge, Rother and Hülle2016). The majority of luminescence dating studies from Mongolia therefore focus on sand-sized potassium feldspar, but the lacustrine sediments of this study do not contain any sand-sized minerals. Therefore, 4–11 μm polymineral and quartz fractions were used for dating. The standard chemical treatment for sample preparation was applied, and the 4–11 μm fraction was extracted by means of a centrifuge (Frechen et al., Reference Frechen, Schweitzer and Zander1996). To extract pure quartz from these polymineral sample extracts, about half of the mass was etched for 7 days in 34% H2SiF6. The other half was not further treated. The samples were pipetted from a suspension of demineralized water (1.0 mg/ml) on stainless-steel discs.
All measurements were carried out on an automated Risø TL/OSL reader (TL-DA-20) equipped with a 90Sr/90Y ß-source for irradiation and a EMI9235 photomultiplier tube for luminescence detection (Bøtter-Jensen et al., Reference Bøtter-Jensen, Andersen, Duller and Murray2003). Infrared (IR; 870Δ80 nm) and blue (470Δ20 nm) LEDs were used for stimulation, and the signal was detected through a D410 LOT Oriel interference filter (IRSL) and a Hoya U340 filter (OSL). Two different protocols were applied for equivalent dose (De) determinations of the polymineral fine-grain fraction: (1) a standard IRSL protocol (IR50) with a low-temperature IR measurement at 50°C after a preheat of 250°C; and (2) an elevated temperature post–IR-IRSL (pIRIR290) single-aliquot regenerative-dose (SAR) protocol (Buylaert et al., Reference Buylaert, Murray, Thomsen and Jain2009) with a pIR measurement at 290°C after a first IR measurement at 50°C and a preheat at 320°C (Thiel et al., Reference Thiel, Buylaert, Murray, Terhorst, Hofer, Tsukamoto and Frechen2011) for samples where the standard IR50 protocol failed to recover a given dose. The stimulation at elevated temperatures also minimizes the effect of anomalous fading (Wintle, Reference Wintle1973), which can cause age underestimation. To check for this interfering signal loss, specific fading tests were carried out according to Huntley and Lamothe (Reference Huntley and Lamothe2001) and used to correct the IR50 ages for fading. A preheat plateau protocol with SAR-OSL measurements at 125°C (Murray and Wintle, Reference Murray and Wintle2000) and preheat temperatures between 200 and 240°C was applied to the according fine-grained quartz samples (C-L3596, C-L3598, C-L3599). With regard to the better bleaching properties of quartz, a comparison between quartz OSL and pIRIR290 measurements can give information about the reliability of the polymineral fine-grain data. IR-depletion ratios (Duller, Reference Duller2003) within 10% unity were determined for all fine-grained quartz samples (Table 3). Acceptance criteria for De determination were set to 10% for recycling ratios, recuperation, and test-dose uncertainties, and the central age model (Galbraith et al., Reference Galbraith, Roberts, Laslett, Yoshida and Olley1999) was used for the final De determination. Environmental dose rates are based on laboratory high-resolution gamma-spectrometry measurements using ~400 g of bulk homogenized material. The software DRAC v1.2 (Durcan et al., Reference Durcan, King and Duller2015) was applied for dose-rate and age calculation. Natural water content was calculated relative to the dry mass following Nelson and Rittenour (Reference Nelson and Rittenour2015), and the cosmic dose-rate contribution was evaluated following Prescott and Hutton (Reference Prescott and Hutton1994). An internal potassium content of 12.5 ± 0.5% (Huntley and Baril, Reference Huntley and Baril1997) was assumed.
Luminescence dating results, radio nuclide contents, and dose rates.
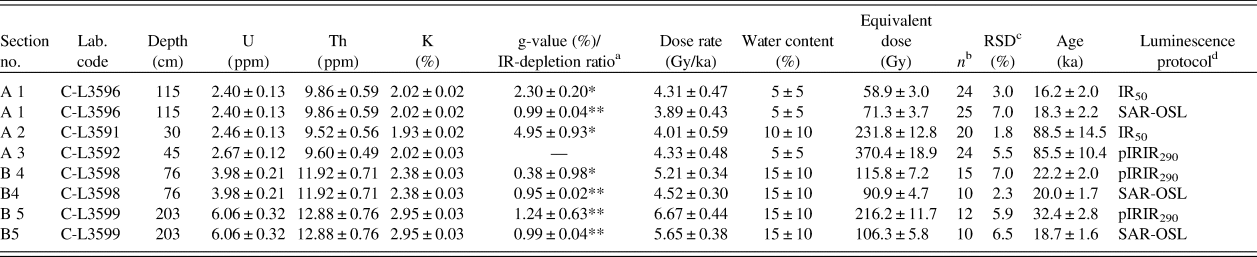
a g-values (*, %/decade) were determined for the 4–11 μm polymineral and infrared (IR)-depletion ratios for the quartz fraction (**).
b n = number of measured aliquots.
c RSD is the relative standard deviation of the data set.
d The central age model was used for equivalent dose (De) determination and the IRSL protocol (IR50) ages are fading corrected (Huntley and Lamothe, Reference Huntley and Lamothe2001). SAR, single-aliquot regenerative-dose; OSL Optically stimulated luminescence.
Pollen analysis
Palynological results are presented from two natural cliff profiles eroded into sediments of former lake high stands that consist of clays, silts, and carbonates. In the 6.5-m-high cliff of the Ekhen Nuur (Fig. 1, site C), samples were taken from sections exhibiting plant material. The Munkh Khairkhan cliff (Fig. 1, site D) was sampled from 2 m to 6.2 m depth. During the preparation for palynological analyses, a few grams of sediment per sample were treated with hydrochloric acid, potassium hydroxide, hydrofluoric acid, and acetolysis mixture (acetic anhydride with sulfuric acid, 10:1), then microsieved (6 μm) and stored in glycerol. A total of at least 330 terrestrial pollen grains were identified for each sample, except one. The pollen identification is based on the literature (Wang et al., Reference Wang, Chien, Zhang and Yang1995) and a collection of about 5000 type slides. The standard magnification was 500×, whereas ambiguous objects were viewed at 1250× with oil immersion. All presented finds of pollen grains, spores, and algae are calculated as percentages of the sums of the terrestrial pollen grains. Plotting was done with C2 software (Juggins, Reference Juggins2007). Morphological pollen and spore types were inferred from Beug (Reference Beug2015) and Moore et al. (Reference Moore, Webb and Collinson1991) with taxonomic adaptation to the Mongolian flora (Grubov, Reference Grubov2011). Plant families in the text and diagrams do not include separated types; for instance, Chenopodiaceae does not include counts of the Haloxylon-type and Poaceae does not include the Cerealia-type.
RESULTS
Geomorphological findings
Khoton Nuur and Khurgan Nuur (site A)
The geomorphological settings and the sediment sections at the Khurgan Nuur and Khoton Nuur (48°36′N, 88°45′E, 2050 m asl; Fig. 2) were described by Lehmkuhl et al. (Reference Lehmkuhl, Klinge, Rother and Hülle2016). In addition, new fading-corrected luminescence ages provide additional numerical dating for these findings. Both lakes are impounded by terminal moraines, which were formed by a large Pleistocene valley glacier flowing from the Tavan Bogd peak (4374 m asl) in a southeasterly direction. Voluminous morainic sediments of an extensive ice-marginal zone cover an intermountain tectonic basin and create a hummocky terrain around the Khurgan Nuur. These sediments incorporate large amounts of laminated glaciolacustrine clay and silt, which provide evidence for a proglacial lake. This paleolake must have existed during the late Pleistocene ice advances and glacial oscillations. Samples A2 and A3 were taken from a section in laminated lacustrine sediments, which are exposed within the outer moraine M1c (Fig. 3c). These lake sediments show micro-fault structures and are likely to have been transported en bloc, possibly as a frozen slab, and merged into the till. IR50 and pIRIR dating of these sediments yielded fading-corrected ages of 88.5 ± 14.5 (silt) and 85.5 ± 10.4 ka (clay) (Table 3). These ages are strong evidence for the timing of the development of the proglacial lake during brief retreats and readvances of moraine M1c at Khurgan Nuur between the late MIS 5 and MIS 4 in an early state of the last glacial period.
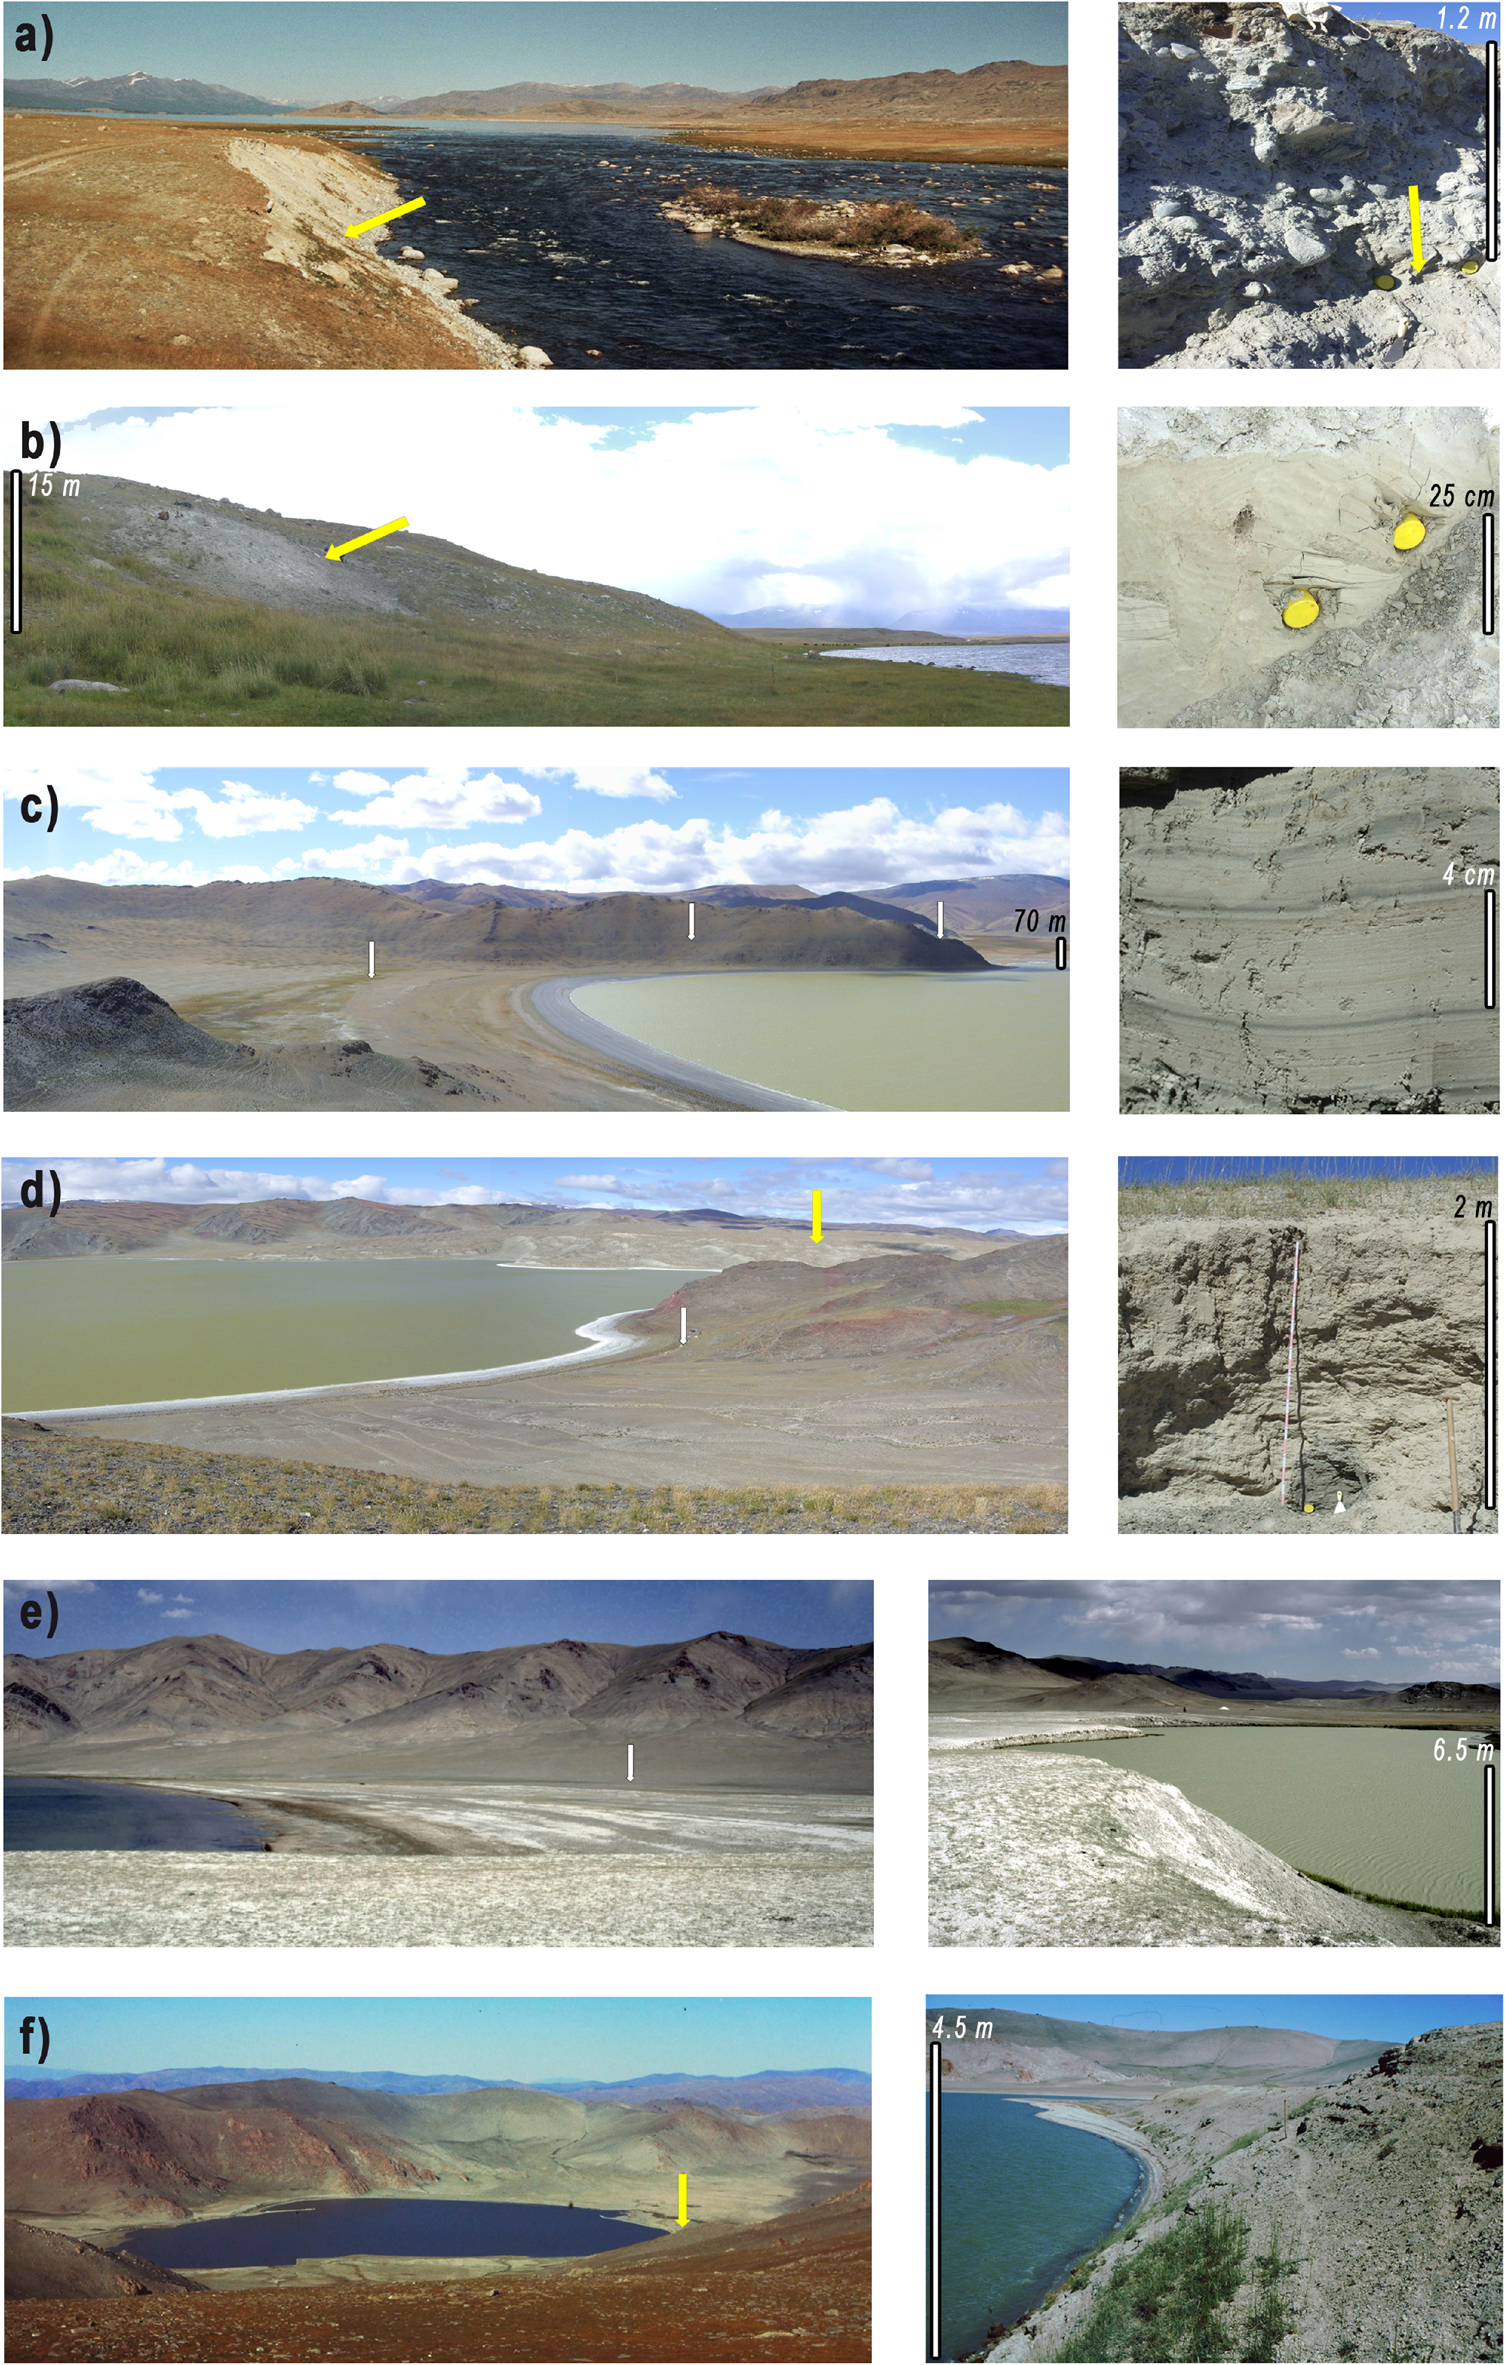
Photographs showing the landscape and the sedimentary sections at the different investigation sites. The yellow arrows indicate the position of the dated sediment profiles. The yellow tubes in the pictures on the right are the luminescence sampling tubes (6 cm diameter). The white arrows indicate the position of the cliff and the highest shoreline. (a) Site A1: terminal moraine at Khoton Nuur. (A1) Layer of aeolian sediment within till (48°35.8′N, 88°25.5′E). (b) Site A2: Terminal moraine at Khurgan Nuur. (A2, A3) Lacustrine sediments within till (48°46.7′N, 88°46′E). (c) Site B: Cliff and shorelines at the lake in the closed basin at Tsagaan Gol (view to south). (B4) Stratified lacustrine sediments (49°0.8′N, 88°33.8′E). (d) Site B: Terminal moraine damming the lake at Tsagaan Gol (view to west). (B5) Lacustrine sediments upon terminal moraine (49°0.8′N, 88°33.8′E). (e) Site C: Lacustrine sediments with plant remains and strandlines at Ekhen Nuur basin (49°25.5′N, 89°45′E). (f) Site D: Lake in closed basin dammed by a lateral moraine at Munkh Khairkhan with stratified sediments (view to north) (46°56.5′N, 91°37′E). (For interpretation of the references to color in this figure legend, the reader is referred to the web version of this article.)
The Khoton Nuur lies a few kilometers upstream of Khurgan Nuur and is dammed by a terminal moraine M1a. Profile A1 is located at a section where the river cuts a 13-m-deep channel across the terminal moraine (Fig. 3a). A layer of eolian silt and sand (Table 1, A1) occurs in between the till, 1.2 m below the surface. A sample from this layer was dated by IR50 and OSL and provided ages of 16.2 ± 2.0 (fading corrected) and 18.3 ± 2.2 ka (Table 3, A1). This dating demonstrates that the M1a moraine formed during the LGP, while the M1b moraine was deposited during or before MIS 2. After the LGP, the glacier retreated, and the lake developed before 11.5 ka, as inferred by the sediment record of Rudaya et al. (Reference Rudaya, Tarasov, Dorofeyuk, Solovieva, Kalugin, Andreev, Daryin, Diekmann, Riedel and Tserendash2009).
Tsagaan Gol (site B)
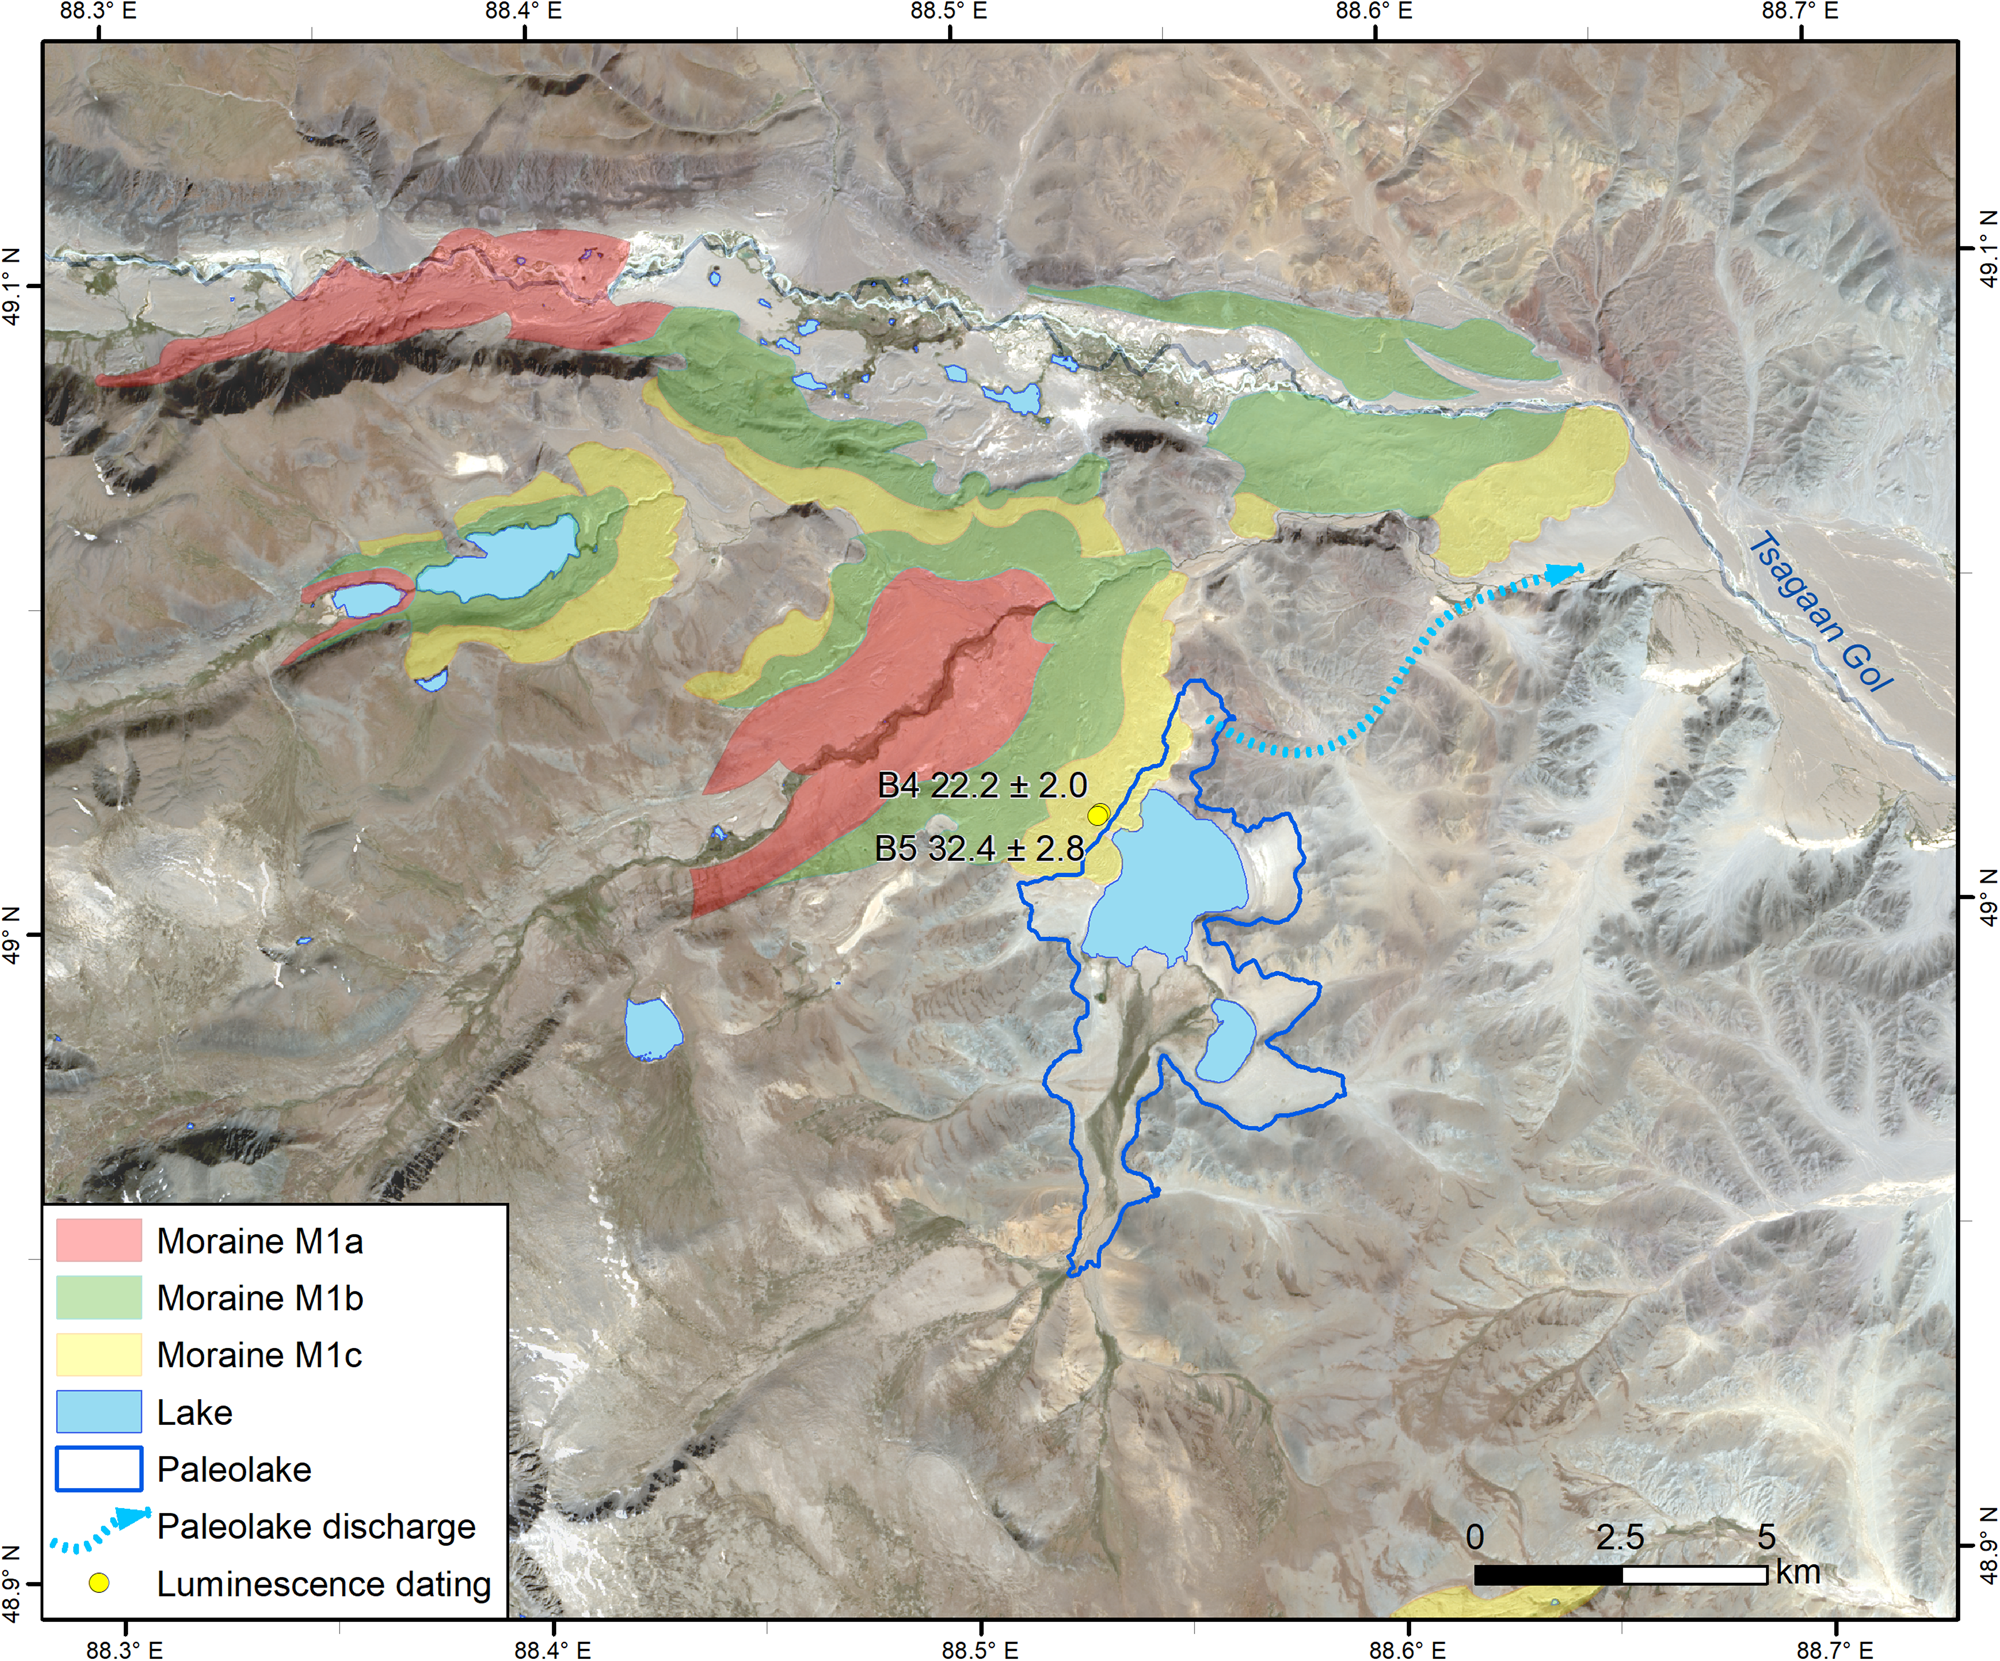
The Tsagaan Gol runs from the Potanin glacier at the Tavan Bogd peak eastward into the Khovd Gol. The terminal moraine of the main valley (49°01′N, 88°32′E, 2420 m asl; Fig. 4) merges with terminal moraines from two southern side valleys. The terminal moraine blocks up a side valley and creates a closed basin with the investigated saline terminal lake. The lacustrine pebbles at the beach ridges are covered by a white crust. The various beach ridges and strandlines below and up to 20 m above the present lake level (2310 m asl) were created by an oscillating lake level during an overall decreasing phase. Furthermore, the highest lake level (70 m above the recent level) is indicated by a distinct cliff in the surrounding mountains (Fig. 3c). In the northern part of the closed basin, a depression in the crest line, which is at the same altitude as the cliff, represents the former overflow of the paleolake (Fig. 4). The gentle slope at this spillway indicates that the outflow of this paleolake was not strong and minimal erosion occurred. Laminated lacustrine sediments of clay and silt lie upon the exterior side of the terminal moraine M1c, (Fig. 3d). The sediment package of more than 4 m shows softly deformed layers. A nearly frozen soil at the bottom of the sections indicates the recent occurrence of permafrost. These lacustrine sediments have the same altitude as the cliff and therefore correspond to the highest lake level. Samples for luminescence dating were taken from the bottom of the lacustrine sediments at two different sections (Table 1, B) and provided ages between 32.4 ± 2.8 and 22.2 ± 2.0 ka for pIRIR and between 20.0 ± 1.7 and 18.7 ± 1.6 ka for SAR-OSL (Table 3, B4 and B5). Three of the four ages are in perfect agreement within 1σ error, but the pIRIR age of C-L3599 is overestimated, which implies partial bleaching for the lower sediments. These results date the high lake level into the initial phase of the LGM (MIS 2) and indicate a minimum age of the outer moraine complex M1c.
(color online) Glacial morphology and sampling site B in a southern side valley of the Tsagaan Gol. The background Landsat 8 satellite image was recorded on August 31, 2014.
Ekhen Nuur (site C)
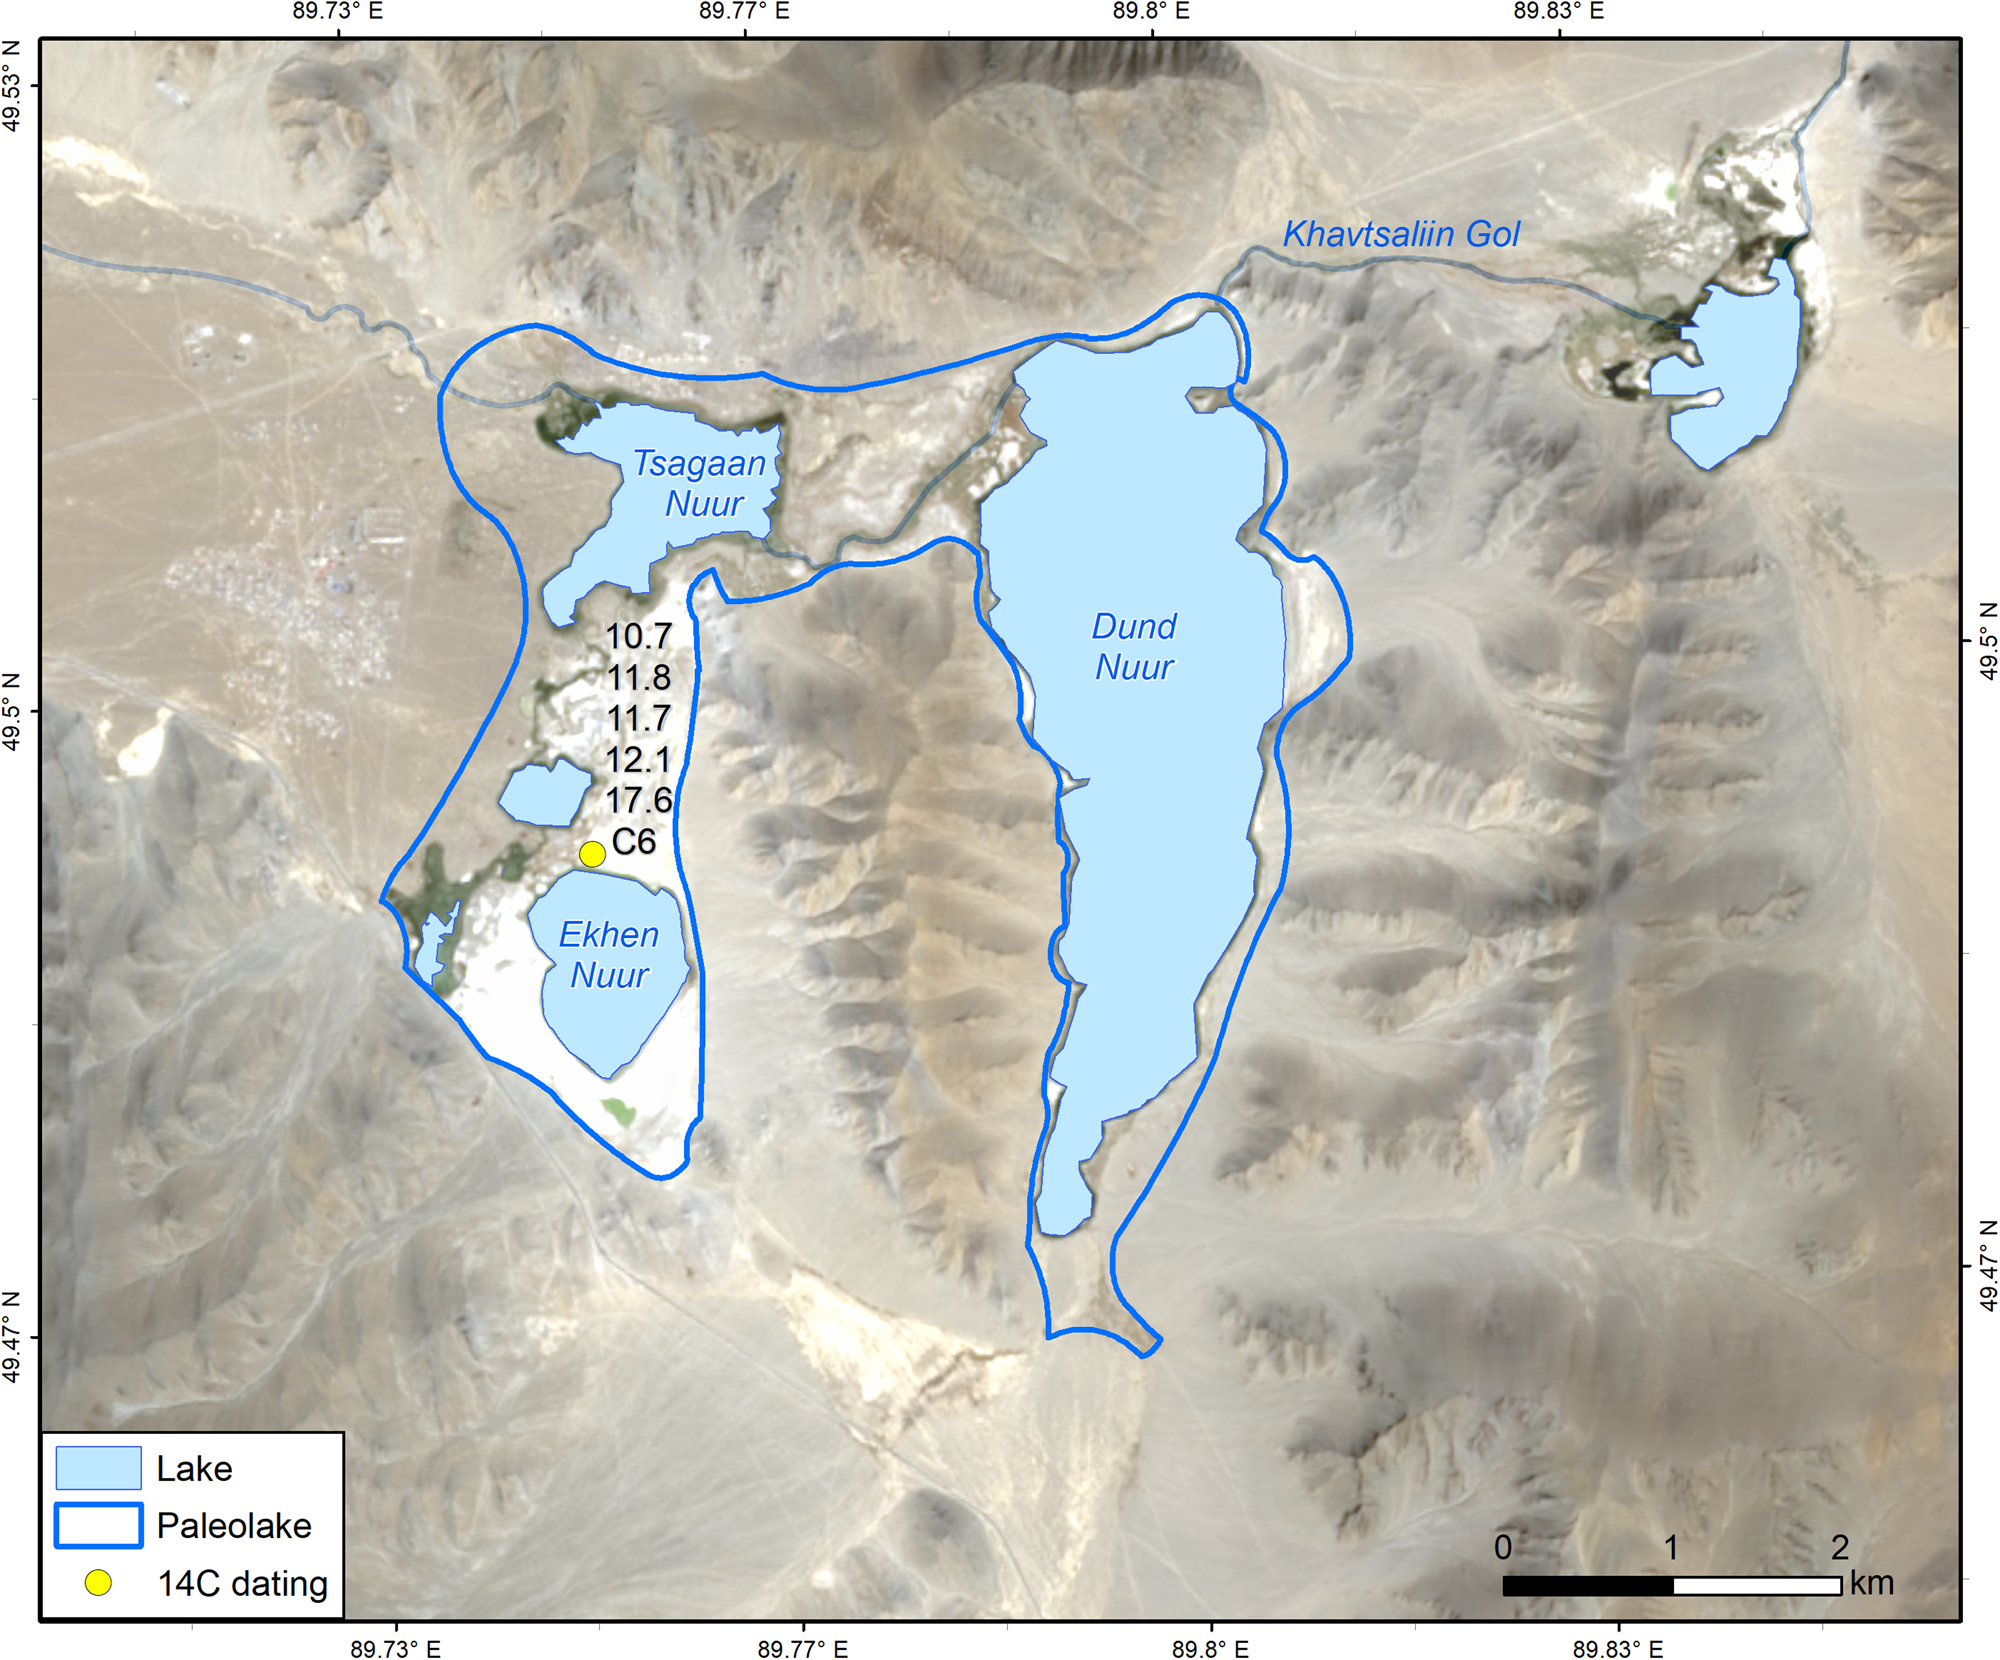
The Ekhen Nuur is located in a tectonic depression near the settlement Tsagaannuur (49°30′N, 89°45′E, 2100 m asl; Fig. 5) in the northwestern part of the Mongolian Altai. Several small lakes are drained via the Khavtsaliin Gol eastward into the Achit Nuur basin. As indicated by strandlines about 6.5 m above the recent lake level, these lakes were formerly joined to a common large lake. Up to 6.8-m-thick lacustrine sediments with many layers of 0.5 to 1 cm thickness containing plant remains separate the Ekhen Nuur from the neighboring lakes (Fig. 3e). We sampled the peat layers systematically for pollen analysis and 14C dating (Table 1, C). Permafrost ice was found at a depth of 6.4 m below the sediment surface. The 14C dating provided consistent ages, which showed that the upper 6 m developed between 12.4 and 10.6 cal ka BP, whereas the base of the exposed section has an age of ~17.9 cal ka BP (Table 2, C6). These results evidence a late glacial paleolake and put the high lake level into the transition period from the LGP to the early Holocene, when a high input of eolian sediments also occurred (Grunert et al., Reference Grunert, Lehmkuhl and Walther2000; Grunert and Lehmkuhl, Reference Grunert, Lehmkuhl, Smykatz and Felix-Henningsen2004; Klinge et al., Reference Klinge, Lehmkuhl, Schulte, Hülle and Nottebaum2017).
(color online) Map showing the lake level change of +6.5 m from late glacial to Early Holocene at the Ekhen Nuur site C. Samples for palynology and 14C dating (in cal ka BP) were sampled from a cliff near Ekhen Nuur. The background Landsat 8 satellite image was recorded on August 31, 2014.
Munkh Khairkhan (site D)
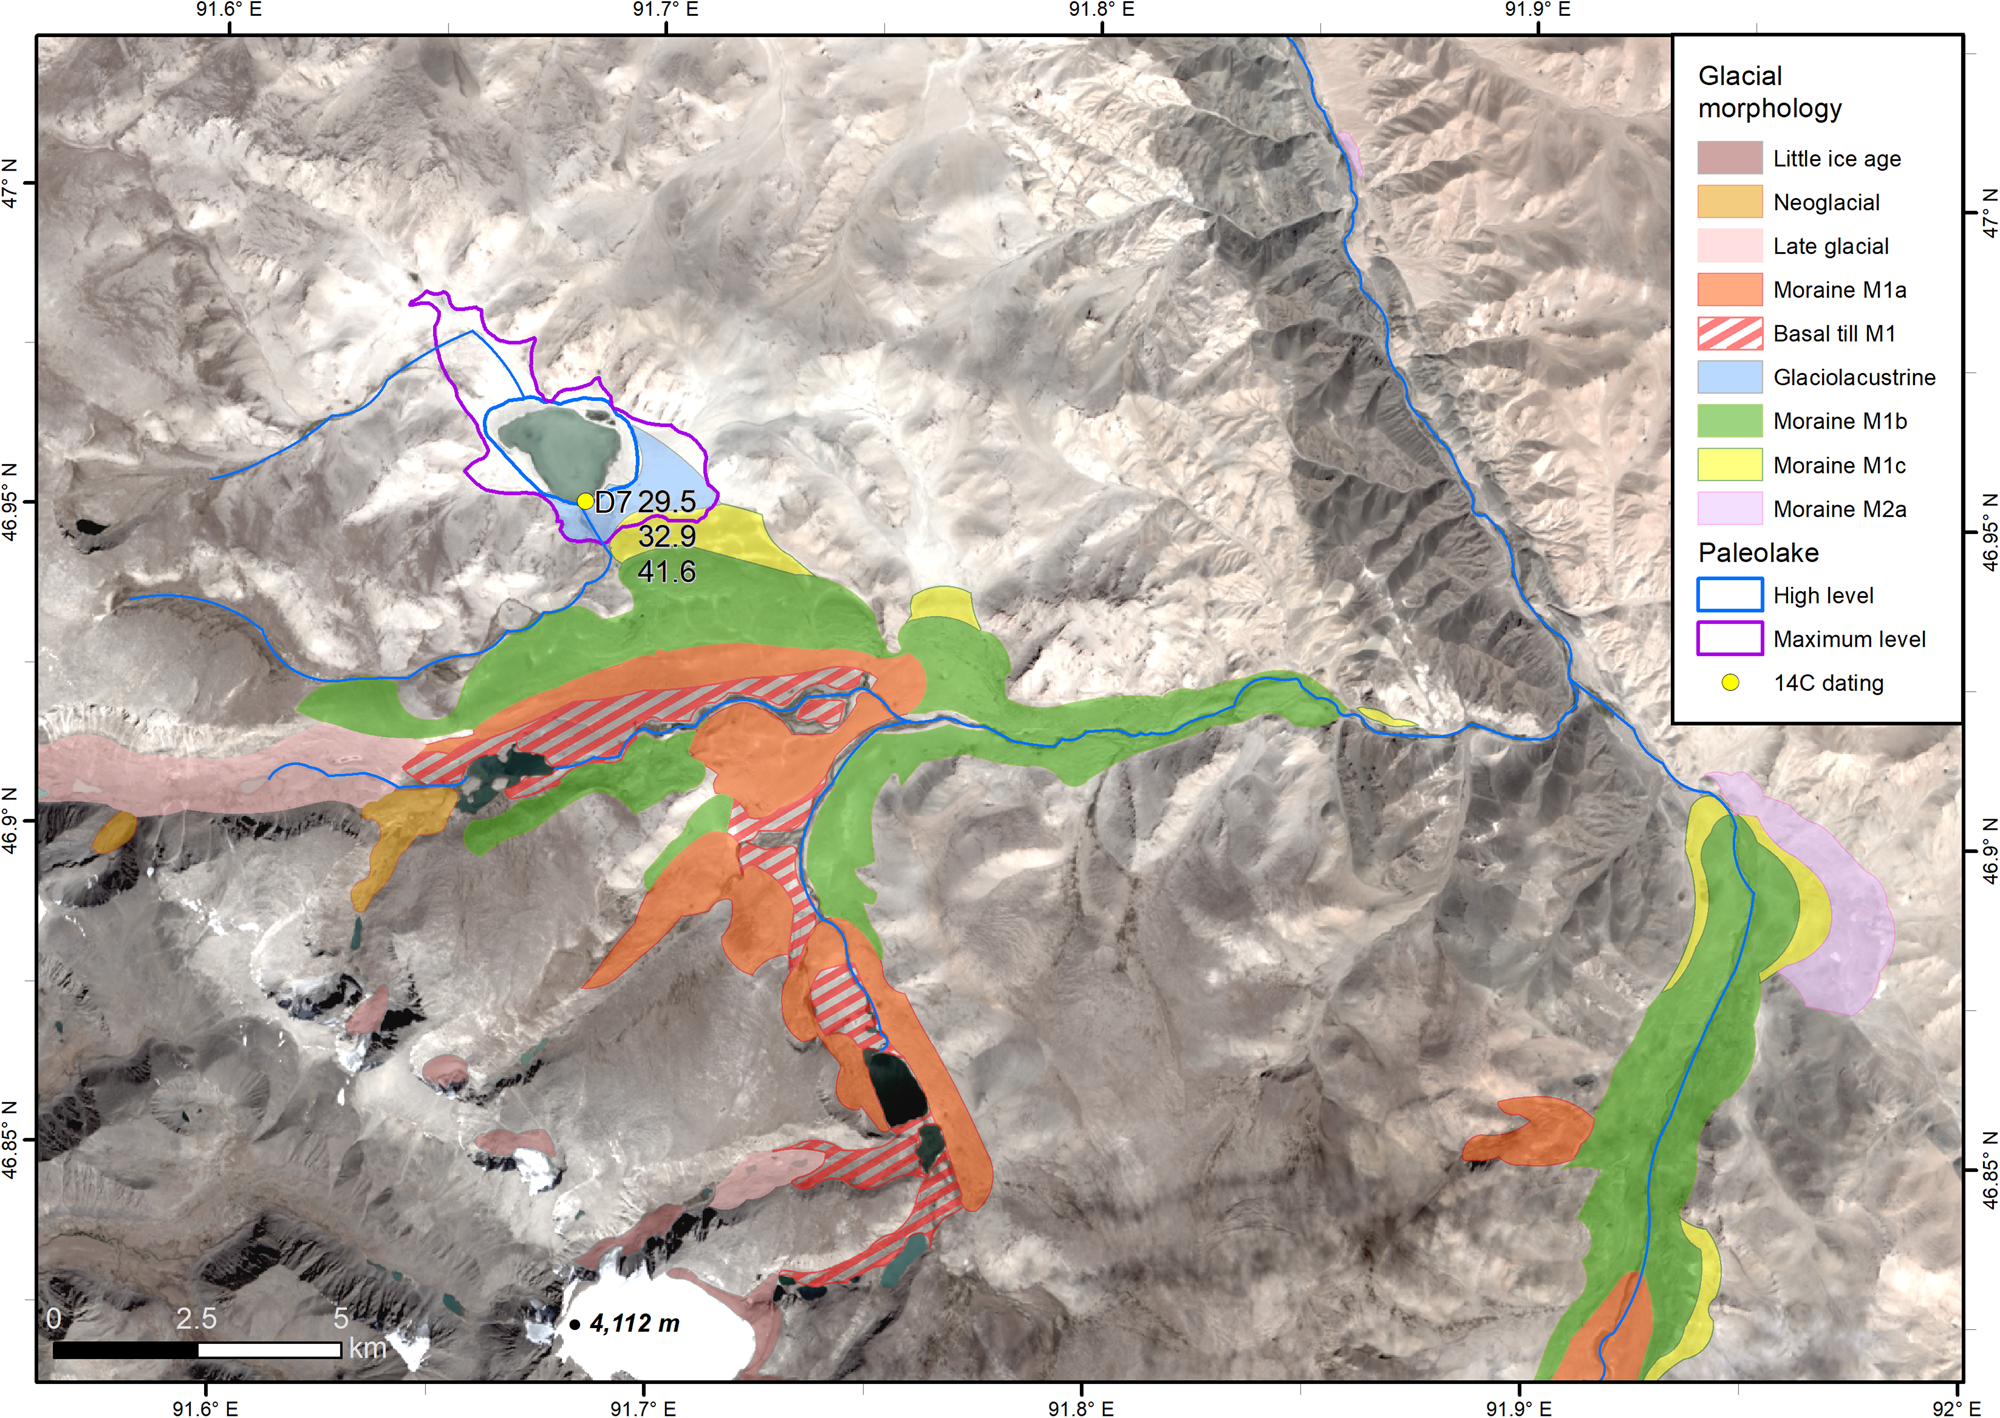
The geomorphological evidence from the glacial terminal moraines at the eastern side of Munkh Khairkhan (46°57′N, 91°41′E, 2730 m asl; Fig. 6) were described by Klinge (Reference Klinge2001) and Lehmkuhl et al. (Reference Lehmkuhl, Klinge, Stauch, Ehlers and Gibbard2004). Here, a side valley was dammed by a lateral moraine, which created a small closed basin with a terminal lake. A sediment package of more than 4.5 m occurs between the lake and the moraine, whereas the top of the sediments correlates with a high paleolake level. The sediments consist of alternating layers of lacustrine clay, clayey limestone, silt, and layers rich in plant remains. Section D7 is a cliff eroded in these sediments by the lake (Fig. 3f). The plant-rich layers were sampled systematically for pollen analysis and 14C dating (Table 1, D). The 14C dates (43.4–27.7 cal ka BP) are all MIS 3 (see Table 2, D7), but exhibit low age–depth relation. As no carbonate bedrock exists in the area, the scattering ages may indicate a reservoir effect by carbonates from eolian silt material. For carbonate in lacustrine sediments at Gun Nuur in northern Mongolia, Feng et al. (Reference Feng, Wang, Guo, Khosbayar, Narantsetseg, Jull, An, Li, Zhang and Ma2005) reported a carbon reservoir effect of 1200 yr.
(color online) Glacial morphology and sampling site (D7) at the east of the Munkh Khairkhan. Samples for palynology and 14C dating (in cal ka BP) were sampled from a cliff near a small moraine-dammed lake. The background Landsat 8 satellite image was recorded on September 2, 2014.
Palynological results from Ekhen Nuur and Munkh Khairkhan
In total, we identified 70 pollen, 6 spore, and 3 algae taxa. A selection of taxa is presented in Figures 7 and 8. The diagram for the Ekhen Nuur (Fig. 7) is divided into two local pollen zones (LPZ) due to changes in taxon presence and sedimentology. In the Munkh Khairkhan diagram (Fig. 8), four humid pulses are interpreted.
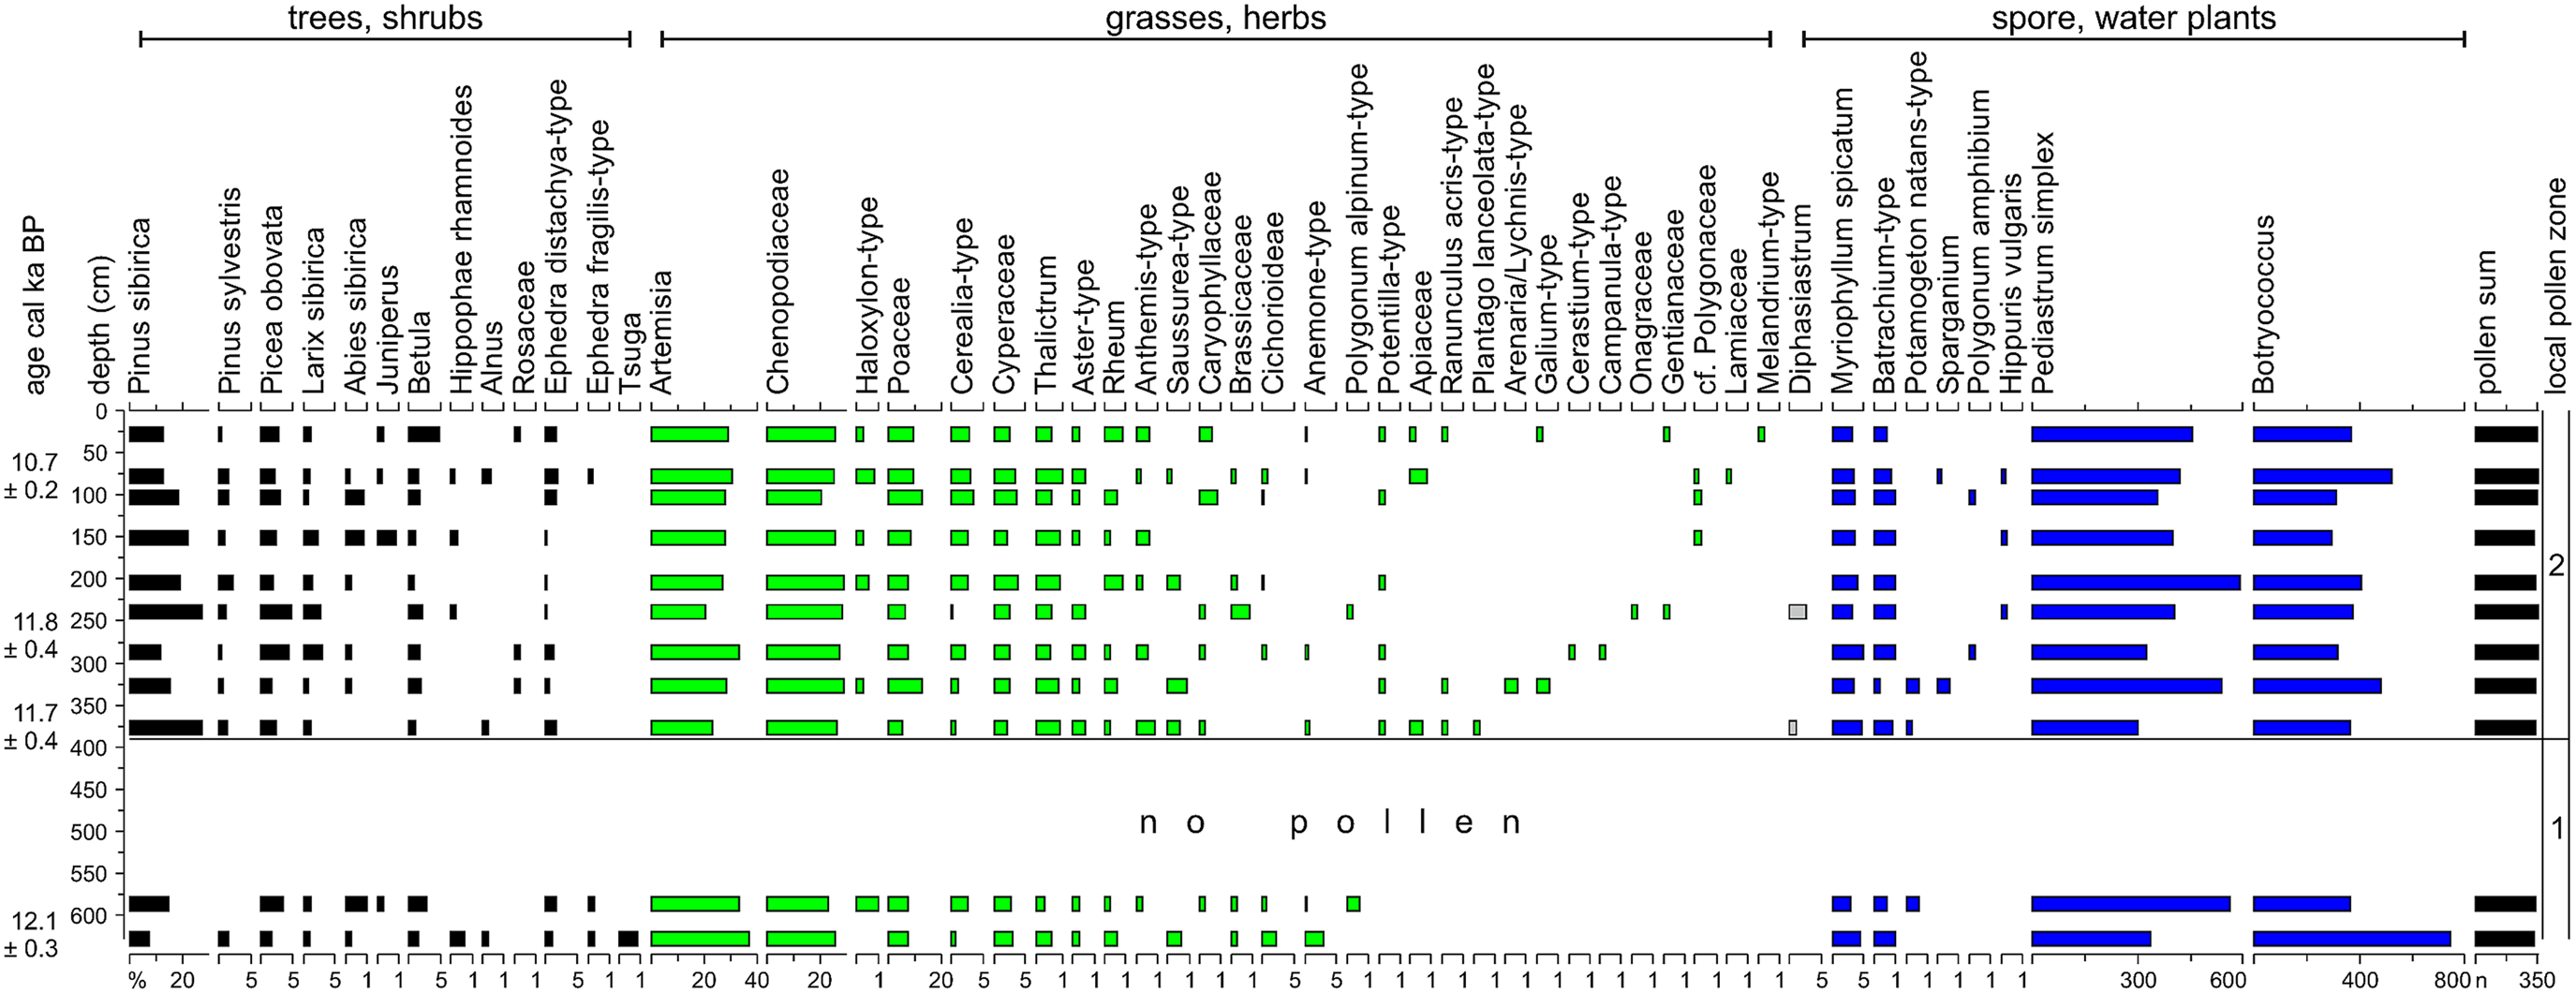
Pollen diagram from the Ekhen Nuur cliff, at 2115 m asl (Fig. 5, C6) Plant groups are denoted by color: black, trees/shrubs; green, grasses/herbs; and gray/blue, spore/water plants. (For interpretation of the references to color in this figure legend, the reader is referred to the web version of this article.)
Pollen diagram from the Munkh Khairkhan study site, at 2730 m asl (Fig. 6, D7). Plant groups are denoted by color: black, trees/shrubs; green, grasses/herbs; and gray/blue, spore/water plants. Selected dating represent the approximate time frame of the archive. (For interpretation of the references to color in this figure legend, the reader is referred to the web version of this article.)

Like dating from many other lake sediments in Mongolia and arid Asia, the 14C ages exhibit the well-known phenomenon of not being free from inconsistencies, most probably relating to reservoir effects (Yan et al., Reference Yan, Xu, Xin, Yang, Wang, Yan and Chen2011; Felauer et al., Reference Felauer, Schlütz, Murad, Mischke and Lehmkuhl2012; Wang et al., Reference Wang, Zhu, Wang, Peng, Ma, Haberzettl, Kasper, Matsunaka and Nakamura2017; Yu et al., Reference Yu, Lehmkuhl, Schlütz, Diekmann, Mischke, Grunert, Murad, Nottebaum, Stauch and Zeeden2019). The 14C reservoir ages of water plants taken over a few years from the same site can vary up to 1 ka and are dependent on precipitation (Philippsen and Heinemeier, Reference Philippsen and Heinemeier2013). The age variation in the Munkh Khairkhan may refer to unstable water conditions expressed in strong fluctuation of water plant composition and wet pulses (see “Palynological Results from Ekhen Nuur and Munkh Khairkhan”). When the one extremely old age is discarded as an outlier, the Munkh Khairkhan pollen data represent some millennia around 30 ka. At Ekhen Nuur, the dating perfectly matches the Younger Dryas (YD) age of the sand layer and reach to the top 1 ka into the early Holocene.
Ekhen Nuur (site C)
The pollen spectra are dominated by P. sibirica (average 17%, up to nearly 28%), Artemisia (29%, 37%), Chenopodiaceae (26%, 29%), and Poaceae (8.5%, 13%) (Fig. 7). The two pollen spectra of LPZ 1 represent the late Pleistocene shortly before the start of the YD. The YD is represented by sandy sediments, which separate the lower part of the section from the upper one. Due to the overall climatic situation and the climate needs of conifer trees, the pollen grains of Pinus, Picea, and Abies in the lake sediments most probably do not reflect trees that were local or regional at that time; their origins are more likely from long-distance transport or a redeposition of older sediments of possibly early Pleistocene age, as exemplified by Tsuga (Grichuk, Reference Grichuk, Aguirre, Pasini, van Couvering and Alekseev1997). The increase of the tree species L. sibirica and P. obovata and the later increase of P. sibirica and especially A. sibirica point to a gradual expansion of dark boreal taiga into the Mongolian Altai from the north during the Early Holocene (LPZ 2). The spores of Diphasiastrum support the interpretation of taiga expansion, as these clubmosses are widely spread in the Siberian taiga and are found in Mongolia today only in areas with Abies sibirica. As A. sibirica is the most moisture demanding, and therefore the most-restricted coniferous tree in Mongolia, the climate must have been considerably wetter during the Early Holocene. The occurrence of dark taiga with A. sibirica hints at about 200–300 mm more precipitation in the Mongolian Altai than today, which is a precipitation increase already claimed for the southern Mongolian Altai and the Gobi Altai during the Mid-Holocene (Jäger, Reference Jäger2005; Miehe et al., Reference Miehe, Schlütz, Miehe, Opgenoorth, Cermak, Samiya, Jäger and Wesche2007). This means an approximate doubling of precipitation compared with today (Academy of Sciences of Mongolia and Academy of Sciences of USSR, 1990). The resulting higher water runoff may have favored Hippophae rhamnoides growing as a shrub or small tree on unconsolidated sand and pebble along active watercourses. As steppes (Poaceae, Thalictrum) and desert steppes (Chenopodiaceae) existed throughout the late Pleistocene to Early Holocene without major shifts, the dark taiga may have formed some kind of forest–steppe, with forests restricted to more humid sites. Pollens like the Myriophyllum spicatum- (3.8%, 5.3%) and Batrachium-type (1.1%, 2.4%) indicate plant communities in a permanent water body of about 0.5 m depth (Hilbig, Reference Hilbig1995), accompanied in the beginning by Potamogeton. The later appearance of Sparganium, Polygonum amphibium, and Hippuris may relate to temperature amelioration. Colonies of the green algae Pediastrum simplex were very common in the lake. This Pediastrum species tolerates salt- and carbonate-rich waters, pointing to alkaline conditions and possibly a more or less endorheic situation of the lake under strong evaporation (Lenarczyk et al., Reference Lenarczyk, Kołaczek, Jankovská, Turner, Karpińska-Kołaczek, Pini, Pędziszewska, Zimny, Stivrins and Szymczyk2015).
Munkh Khairkhan (site D)
The wind-transported pollen from Artemisia (average 62%, maximum 69%), Chenopodiaceae (19%, 25%), and Poaceae (5.6%, 14%) dominate the spectra; P. sibirica (0.3%, 0.9%), and other conifers appear infrequently with low values (Fig. 8). In contrast, the plants of Nitraria, Atraphaxis, Calligonum, and the Limonium-type are insect pollinated. Of these taxa, only the Nitraria has pollen reported with some regularity from Mongolian paleo-archives (Felauer et al., Reference Felauer, Schlütz, Murad, Mischke and Lehmkuhl2012; Sun et al., Reference Sun, Feng, Ran and Zhang2013; Yu et al., Reference Yu, Lehmkuhl, Schlütz, Diekmann, Mischke, Grunert, Murad, Nottebaum, Stauch and Zeeden2019). Nitraria, Atraphaxis, and Calligonum are typical shrubs or semishrubs of the desert steppes and especially of the Mongolian full deserts (Hilbig, Reference Hilbig1995). Representatives of Nitraria and the Limonium-type (Limonium, Goniolimon) grow on salty and alkaline soils (Grubov, Reference Grubov2011). The climatic conditions near the study site must have been much drier than today. The (semi-)arid vegetation belt that exists today in the nearby Achit Nuur basin was shifted upward by about 500 m to the Ekhen Nuur. Considering the influence of low temperatures close to the LGM on the water balance, the precipitation must have been reduced drastically, most possibly by more than 200–300 mm compared with today. As is typical for desert environments, precipitation may have varied much over time, with prevailing very dry conditions alternating with relatively wet pulses. Synchronously higher values of H. rhamnoides, growing along active watercourses, and of the water algae Botryococcus (13, 268, and 402 cm) may indicate the heavy rainfall events typical of such episodes. Another possible moisture pulse (166 cm) can be inferred from the highest increase in Poaceae, Cyperaceae, and Cichorioideae (Asteraceae with fenestrate pollen grains). The absence of vascular water plants might point to unstable water conditions and/or low winter temperatures causing long ice covers on the lake.
DISCUSSION
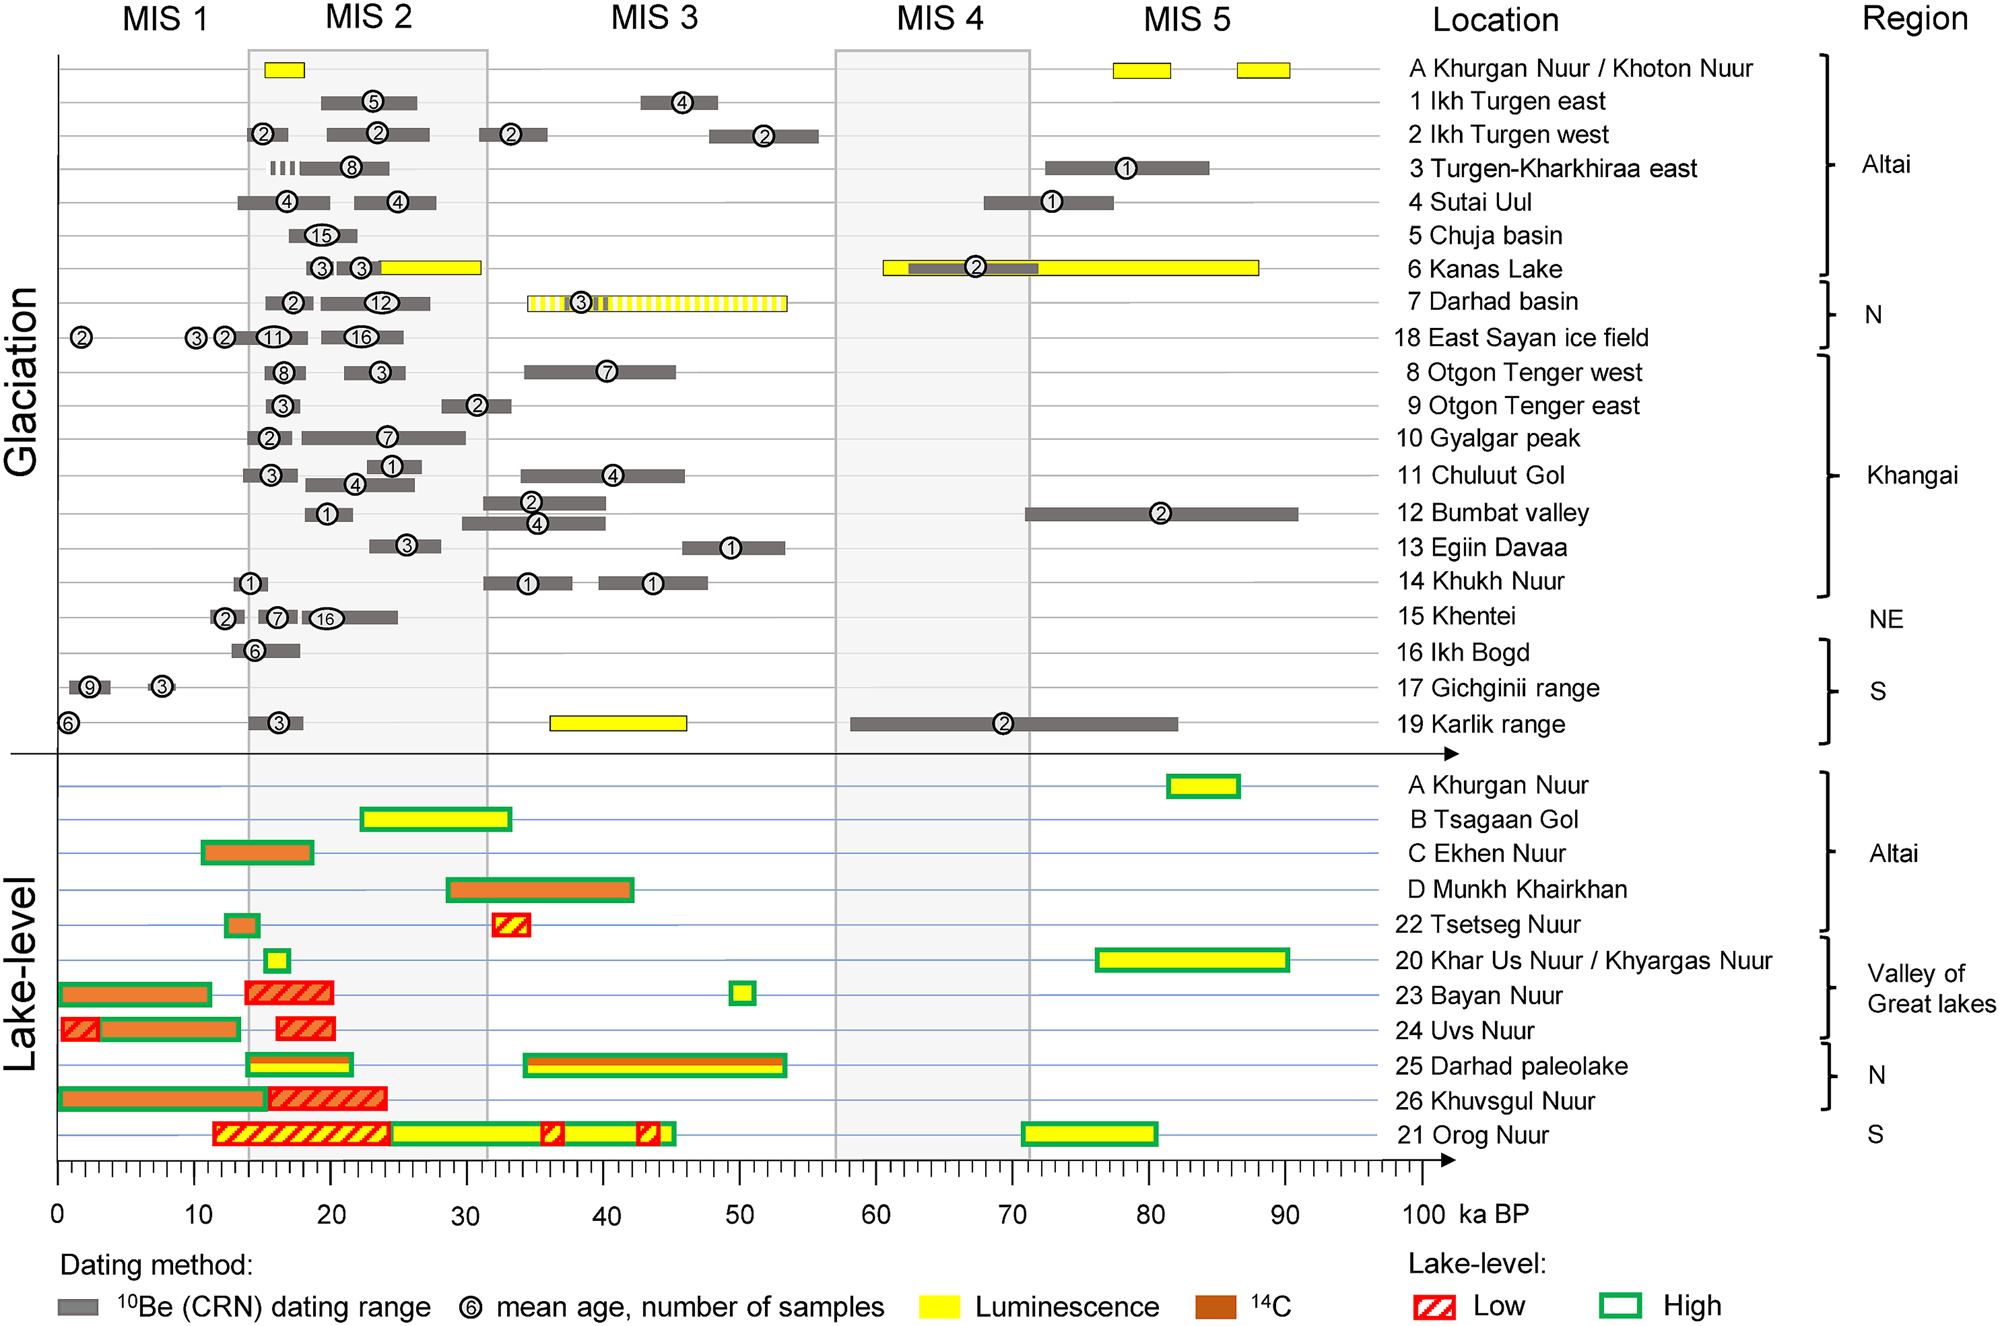
The maximum glaciated area of the late Pleistocene in Mongolia, as delineated from satellite images and based on field experience, and the locations discussed in the following text are shown in Figure 9. The temporal distribution of glaciation and paleolakes reported in the literature is illustrated in Figure 10. In the following text, the numbers in the parentheses after the locations refer to the numbers in Figures 9 and 10.
(color online) Late Pleistocene glaciation and paleolake levels in Mongolia. The Pleistocene glaciated area in the region of Mongolia was mapped on the basis of satellite images (Landsat and Sentinel), whereas the glaciation of the western Altai and southern Siberia was taken from Ehlers et al. (Reference Ehlers, Gibbard and Hughes2011). The site numbers and letters refer to locations mentioned in the text and in Fig. 10. (1,2) Ikh Turgen, (3) Turgen-Kharkhiraa, (4) Sutai Uul, (5) Chuja basin, (6) Kanas Lake, (7) Darhad basin, (8,9) Otgon Tenger, (10) Gyalgar peak, (11) Chuluut Gol, (12) Bumbat valley, (13) Egiin Davaa, (14) Khukh Nuur, (15) Khentei, (16) Ikh Bogd, (17) Gichiginii range, (18) East Sayan Mountains, (19) Karlik range, (20) Khar Us Nuur/Khyargas Nuur (great paleolake), (21) Orog Nuur, (22) Tsetseg Nuur, (23) Bayan Nuur, (24) Uvs Nuur, (25) Darhad paleolake, (26) Khusgul Nuur, (A) Khurgan Nuur/Khoton Nuur, (B) Tsagaan Nuur, (C) Ekhen Nuur, (D) Munkh Khairkhan.

(color online) The temporal distribution pattern of dating for glacial extents and paleolake levels for different regions of Mongolia. The horizontal bars cover the total period framed by the time range of the dated samples, excluding specified outliers. The gaps between the indicated states are due to missing data. The numbers of the different sites correspond with Fig. 9 and refer to the text. The capital letters refer to the study sites referenced in Fig. 1 and in the text. Vertically striped bars indicate indirect age determination.
Regional timing of late Pleistocene glaciations in Mongolia
As shown in this study and reported by Lehmkuhl et al. (Reference Lehmkuhl, Klinge, Rother and Hülle2016), the terminal moraine complex of Khurgan Nuur consists of three main stages between 88 and 16 ka. 10Be dating of glacial deposits in the Ikh Turgen massif in the northwestern part of the Mongolian Altai were performed by Blomdin et al. (Reference Blomdin, Stroeven, Harbor, Gribenski, Caffee, Heyman and Rogozhina2018). For two moraine complexes of maximum stages at the eastern side of the mountains (1), the authors reported ages of 45 and ~23 ka. In contrast, a wide scatter of ages between 53 and ~14 ka from samples of two moraine complexes at the hummocky terrain on the western side of Ikh Turgen (2) did not provide distinct information for the timing of mean glacial stages. Poetsch (Reference Poetsch2017) performed 10Be analyses on boulders of moraines and roche moutonée at the eastern side of the Turgen-Kharkhiraa Mountains, which are located in the northeastern part of the Mongolian Altai (3). The author reported a maximum glacial expansion around 81–78 ka corresponding to MIS 5a and a major ice advance between 26 and 20 ka. The last maximum terminal glacial position occurred between 19 and 16 ka during the first part of the LGP before the glacier completely retreated. Here, no evidence for a MIS 3 glacial stage was found. Glacial deposits in the Sutai range (4), which is located in the southeastern part of the Mongolian Altai in the transition region to the Gobi Altai, were examined for 10Be dating by Batbaatar et al. (Reference Batbaatar, Gillespie, Fink, Matmon and Fujioka2018). For moraines of maximum glacial extension, the authors reported ages of ~27–22 ka on the eastern side of range and ~19–14 ka on the western side. Additional 10Be investigations exist for the neighboring regions of the Mongolian Altai. In the Chuja basin to the west (5), Gribenski et al. (Reference Gribenski, Jansson, Lukas, Stroeven, Harbor, Blomdin and Ivanov2016) reported MIS 2 for the LGM, with deglaciation around 19 ka. In addition, Reuther et al. (Reference Reuther, Herget, Ivy-Ochs, Borodavko, Kubik and Heine2006) reported cataclysmic outburst floods from a big lake, which existed in the Chuja basin due to glacial damming, around 18 ka (Gribenski et al., Reference Gribenski, Jansson, Preusser, Harbor, Stroeven, Trauerstein and Blomdin2018). Gribenski et al. (Reference Gribenski, Jansson, Preusser, Harbor, Stroeven, Trauerstein and Blomdin2018) examined glacial deposits around the Kanas Lake (6), which is situated in the southwestern part of the Altai within Chinese territory. The authors reported MIS 2 for the lLGM and another glacial advance around late MIS 5/MIS 4, but they could not confirm the assumed MIS 3 advance by Zhao et al. (Reference Zhao, Yin, Harbor, Lai, Liu and Li2013) and Xu et al. (Reference Xu, Yang, Dong, Wang and Miller2009). Moreover, Gribenski et al. (Reference Gribenski, Jansson, Preusser, Harbor, Stroeven, Trauerstein and Blomdin2018) disputed in general the evidence of a pronounced MIS 3 glacial advance for all of central Asia.
In the Darhad basin (7), which is located in northern Mongolia, Gillespie et al. (Reference Gillespie, Burke, Komatsu and Bayasgalan2008) and Batbaatar and Gillespie (Reference Batbaatar and Gillespie2016b) reported glacial advances between ~53–35 and 27–19 ka. The advancing glaciers from the East Sayan Mountains had dammed the Maly Yenisei River and a deep lake existed in the Darhad basin between 21 and 17 ka. Subsequently, the deep lake persisted episodically until ~14 ka, probably dammed by the outwash plain of the readvancing Tengis glacier, until Darhad basin fell largely dry after ~10 ka. At the eastern Sayan Mountains in southern Siberia (18), Arzhannikov et al. (Reference Arzhannikov, Braucher, Jolivet, Arzhannikova, Vassallo, Chauvet, Bourlès and Chauvet2012) and Batbaatar and Gillespie (Reference Batbaatar and Gillespie2016b) performed 10Be dating on moraines in four different main valleys running to the east. The authors reported glaciations at ~22, ~16, and between 12 and 10 ka. Several investigations on glacial sediments with 10Be dating exist for the Khangai Mountains in central Mongolia, which provide ages between MIS 3, MIS 2, and the LGP. From the western side of Otgon Tenger peak (8), Rother et al. (Reference Rother, Lehmkuhl, Fink and Nottebaum2014) reported maximum glacial extents between 44 and 33, ~23, and 17–16 ka, whereas Batbaatar et al. (Reference Batbaatar, Gillespie, Fink, Matmon and Fujioka2018) reported ages of ~33–28 and ~17–16 ka for moraines at the eastern side of Otgon Tenger (9). 10Be dating from moraines in the eastern part of the Khangai Mountains are reported for the Gyalgar peak (10) by Batbaatar and Gillespie (Reference Batbaatar and Gillespie2016b), with ages between 30 and 17 ka (average 24 ka) and by Smith et al. (Reference Smith, Wegmann, Ancuta, Gosse and Hopkins2016) with ages of ~15 ka; for the Chuluut Gol (11), by Smith et al. (Reference Smith, Wegmann, Ancuta, Gosse and Hopkins2016) with ages of ~22 ka and by Poetsch (Reference Poetsch2017) with mean ages between 41 and 16 ka; for the nearby Bumbat valley (12), by Batbaatar et al. (Reference Batbaatar, Gillespie, Fink, Matmon and Fujioka2018) with ages of ~39–31 ka; for the Egiin Davaa area (13), mean ages of 49 and 26–25 ka by Poetsch (Reference Poetsch2017); and for the Khukh Nuur (14), by Smith et al. (Reference Smith, Wegmann, Ancuta, Gosse and Hopkins2016) ages between 44 and 14 ka. In the Khentei Mountains (15), which are located in the northeastern part of Mongolia, Khandsuren et al. (Reference Khandsuren, Seong, Oh, Rhee, Sandag and Yu2019) reported 10Be ages from boulders upon moraines of ~21–19 and 18–16/12 ka. Batbaatar et al. (Reference Batbaatar, Gillespie, Fink, Matmon and Fujioka2018), who performed 10Be dating from moraines in the Gobi Altai, reported late glacial ages (~17–13 ka) for the Ikh Bogd (16) and Holocene ages at the Gichginii range (17). At the Karlik range in the southern Gobi (19), Chen et al. (Reference Chen, Li, Wang, Zhang, Cui, Yi and Liu2015) reported four major glaciation events. Three moraine stages were dated by 10Be analysis to ~0.8, 14–18, and 60–79 ka, whereas one stage was dated by OSL between 37.4 and 44.2 ka.
Summarizing the investigations and the data about maximum glacial advances in the region of Mongolia shows diverging periods for the oldest stage of the last glacial period that can range between MIS 5a (Turgen-Kharkhiraa, Khurgan Nuur, Kanas Lake, Chuluut Gol), and MIS 3 (Ikh Turgen, Khangai Mountains, Karlik range). A MIS 4 age is reported for the Kanas Lake moraine. The two main moraines of LGM and the LGP are generally present in every mountain range. In the next step, we will discuss the findings about paleolake-level distribution and paleo-vegetation with respect to the delineation of climate conditions during the different glacial stages of the late Pleistocene.
Evaluation of late Pleistocene periods of environmental change
Glacial advances before the LGM (MIS 5a–b)
The proglacial lacustrine sediments at Khurgan Nuur (Figure 2, A2), which probably had been eroded and incorporated into an advancing glacier, indicate a glacial stage before and after 88–85 ka. In combination with the moraine ages reported by Poetsch (Reference Poetsch2017; 81–78 ka) from the Turgen-Kharkhiraa Mountains and by Gribenski et al. (Reference Gribenski, Jansson, Preusser, Harbor, Stroeven, Trauerstein and Blomdin2018; 79–63 ka) at Kanas Lake, these glacial advances can be classified into the period MIS 5a–b. Devyatkin (Reference Devyatkin1981) assumed a high paleolake level at Khyargas Nuur (20) between 90 and 76 ka. A high lake level at Orog Nuur (21) in the Gobi Desert to the southeast between 80 and 70 ka was reported by Lehmkuhl and Lang (Reference Lehmkuhl and Lang2001) and Lehmkuhl et al. (Reference Lehmkuhl, Grunert, Hülle, Batkhishig and Stauch2018). No climatic evidence from pollen records and further high lake levels exist for this period in the region of western Mongolia. Inferred from the documented glacial advances, which represent a maximum extension of the last glacial period (M1c) and the occurrence of paleolakes, this period can be correlated to cold and humid conditions at the current stage of knowledge.
Anaglacial glacial advances (MIS 3/2)
The high levels of the proglacial paleolakes at the Tsagaan Gol (B4, B5) between 32 and 22 ka and at Munkh Khairkhan (D7) between 42 and 29 ka occurred in the transition period between MIS 3 and 2. During the phase of glacier buildup and advance, the lacustrine sediments were deposited upon the till of the M1c moraines. The large amount of sediment input from slopewash and eolian silt and the precipitation of carbonate indicate dry conditions in this mountain region for that period. The desert-like vegetation inferred from palynology (Fig. 8) underlines a dry climate. The overall dry conditions were interrupted by short phases of enhanced effective moisture. Regarding the arboreal desert elements (Nitraria, Atraphaxis, Calligonum), including H. rhamnoides, the mean temperature of the coldest month at the Munkh Khairkhan might have been at minimum around −20°C, that of the warmest month about 6°C to 10°C, and the minimum annual precipitation during the growing season could have been as low as about 20–30 mm. Overall, the taxa mentioned allow a potential evapotranspiration in a range of up to 300–900 mm (Fang et al., Reference Fang, Wang and Tang2011).
For the Tsetseg Nuur Basin (22) in the southern Mongolian Altai, Klinge and Lehmkuhl (Reference Klinge and Lehmkuhl2013) reported a low lake level around 33 ka, which was indicated by the accumulation of eolian sand in the basin and interpreted as a dry period. For the period between 45 and 24 ka, Yu et al. (Reference Yu, Lehmkuhl, Schlütz, Diekmann, Mischke, Grunert, Murad, Nottebaum, Stauch and Zeeden2019) reported higher lake levels at Orog Nuur (21) in the Gobi Desert, which they related to increased precipitation, interrupted by lake desiccations at ~43 and ~36 ka. For the Bayan Nuur (23) in the east of the Uvs Nuur, Naumann (Reference Naumann1999) and Grunert et al. (Reference Grunert, Lehmkuhl and Walther2000) reported a high lake level around 50 ka. Gillespie et al. (Reference Gillespie, Burke, Komatsu and Bayasgalan2008) and Batbaatar and Gillespie (Reference Batbaatar and Gillespie2016a) reported that a deep lake existed intermittently in the Darhad basin during MIS 3 (53–35 ka) in northern Mongolia, based on 14C and luminescence dating of lake sediments at a high shoreline. Based on pollen analysis from the Shaamar eolian–paleosol section in northern Mongolia, Ma et al. (Reference Ma, Liu, Feng, Meng, Sang, Wang and Zhang2013) assumed a wet period between 38 and ~30 ka and cold and dry conditions for the following period of ~30–23 ka.
A general change from humid to drier conditions occurred during this cold period, but with spatial disparity. The different evolution of lake levels is obviously evident for different environmental settings in the catchment areas. Tsetseg Nuur has a large catchment reaching into the high mountain environments, where developing glaciers and permafrost accumulated a large portion of water and reduced the discharge into the basins. Bayan Nuur is situated in relatively low elevation in the basin (932 m asl), and the proglacial lakes in the mountains have only small catchments where no extensive glaciation existed. Although precipitation decreased, with mostly dry conditions indicated by the vegetation in the surrounding area, higher lake levels could have developed due to low evaporation and cool temperatures. With the exception of the terminal lakes in the Valley of Gobi lakes, which are fed by rivers from the Khangai Mountains, the paleolakes in the southernmost Gobi region did not have extensive high mountainous areas or glaciation in the catchment area. Thus, the higher lake levels could have been due to low evaporation as well as to a diverging precipitation regime.
LGM 26–18 ka (middle of MIS 2)
The most obvious glacial advance M1b in Mongolia, which is indicated by well-preserved moraines, occurred between 26 and 18 ka and was generally accompanied by low lake levels. Grunert et al. (Reference Grunert, Lehmkuhl and Walther2000) reported very low lake levels and even desiccation at Uvs Nuur (24) between 20 and 16 ka, and Bayan Nuur (23) did not exist until 14 ka (Naumann, Reference Naumann1999). During the LGM, the Khuvsgul Nuur (26) in northern Mongolia was at its lowest stand, about 100 m below the recent level, and had no outflow (Prokopenko et al., Reference Prokopenko, Kuzmin, Williams, Gelety, Kalmychkov, Gvozdkov and Solotchin2005), which points to dry conditions and water retention in glacier ice and ground ice. The contempory existence of a large and deep lake in the Darhad basin (25) since ~21 until 14 ka (Gillespie et al., Reference Gillespie, Burke, Komatsu and Bayasgalan2008), which was impounded by a glacier dam, resulted independent of climate. In contradiction, Sun et al. (Reference Sun, Feng, Ran and Zhang2013) inferred wet conditions for the period 22.6–13.2 ka based on pollen spectra from Achit Nuur sediments interpreted as forest–steppe. However, the extreme low pollen concentration reported for that period compared to the Holocene pollen concentration seems to contradict a well-developed vegetation cover under a quite humid climate.
Proxy data from southern Mongolia also point to a dry climate in that region. Based on the OSL dating of eolian sands from Zavkhan Gol, which drains the Khangai Mountains to the west, and from Bayan Tukhumiin Nuur, a desiccated lake in the Gobi, a dry phase was reported by Lehmkuhl et al. (Reference Lehmkuhl, Grunert, Hülle, Batkhishig and Stauch2018) for the MIS 2. After 24 ka, the Orog Nuur desiccated and remained a shallow saline lake until 11 ka (Yu et al., Reference Yu, Lehmkuhl, Schlütz, Diekmann, Mischke, Grunert, Murad, Nottebaum, Stauch and Zeeden2019).
The lLGM represents the culmination of cooling and drying of the last glaciation. The increasing gradient of the glacial snowline from west to east provides evidence for the depletion of effective moisture supply mainly controlling the strong aridity in that region (Lehmkuhl et al., Reference Lehmkuhl, Klinge, Stauch, Ehlers, Gibbard and Hughes2011). However, the few existing investigations on vegetation distribution for that period point to a change from arid to more humid conditions already occurring around 23 ka. The temporal shift between the proxy data for precipitation derived from vegetation, lake levels, and glaciation could be explained by a more rapid adaptation to climate change of the vegetation in the basins than the glaciers in the mountains. Vegetation is more sensitive to changes in precipitation and temperature than glaciers and lake levels. Interference from different archives can originate from different response times of the corresponding proxies. As inferred from the pollen archive of the Munkh Khairkhan, the precipitation would have varied much over time, including during wet pulses and prevailing desert conditions before the LGM. Minimally higher but more reliable precipitation during the vegetation periods around the turn to the LGM could have caused noticeable changes in vegetation, possibly without distinct budget changes of lakes or glaciers at the outset.
LGP (18–11 ka)
The eolian layer (site A1) dated to 18–16 ka, which we found in between the till of the Khoton Nuur, classifies the terminal moraine M1a as occurring in the early part of the LGP. The glacial advance reflects a cold stage, and the deposition of eolian sand and silts upon the glacier terminus indicates a sparse vegetation cover. The general glacial retreat after 16 ka, which was probably caused by a general trend of climate warming after the LGM (Klinge and Sauer, Reference Klinge and Sauer2019), led to lake development in the tongue basin at the end of the LGP. Glacial processes and deposits controlled the development of the Khoton Nuur, whereas the concurrent high paleolake level at Ekhen Nuur in the Tsagaan Nuur basin (C6) reflects a water surplus. The intense input of eolian sediments is evidence for sparse vegetation cover in the surrounding landscape and extensive deflation from exposed paraglacial and postglacial sediments. Thus, the higher lake level occurred in the beginning under persistent cool conditions with decreased evaporation. With the onset of the Holocene, higher temperatures increased the evaporation. However, under an accompanying higher precipitation indicated by taiga forest expansion and possibly increased amount of melting water, it took about 1000 yr for the lake to dry up at the investigated site.
The melting of glacier ice and permafrost ice was responsible for the high lake level of the Uvs Nuur between 13 and 11 ka (Grunert et al., Reference Grunert, Lehmkuhl and Walther2000). Using a pollen record from the Bayan Nuur, Tian et al. (Reference Tian, Herzschuh, Telford, Mischke, van der Meeren, Krengel and Richardson2014) reconstructed high precipitation around 15.6 ka, whereas the lowest precipitation occurred between 12.4 and 11.9 ka. Based on eolian processes and sediments, Naumann (Reference Naumann1999) reconstructed cold and dry conditions and desiccation of Bayan Nuur until around 14.2 ka. Then, a shallow, endorheic, and periodic lake developed, and the water level steadily rose until 11 ka, when it reached up to 48 m above the present-day level and started to cut an outflow channel into the damming dune field. At Achit Nuur, Sun et al. (Reference Sun, Feng, Ran and Zhang2013) reported desert and steppe vegetation indicating mild and dry conditions from 13.2 to 6.4 ka. Ma et al. (Reference Ma, Liu, Feng, Meng, Sang, Wang and Zhang2013) stated that the climate became warmer and somewhat drier in northern Mongolia during the LGP until 11 ka based on their investigations at the Shaamar section. At Khuvsgul Lake, the lake level start to rise beginning around 15.4 ka, and outflow occurred at the beginning of the Holocene, which was interpreted by Prokopenko et al. (Reference Prokopenko, Kuzmin, Williams, Gelety, Kalmychkov, Gvozdkov and Solotchin2005) to be due to increased precipitation during the LGP. At Tsetseg Nuur, a high lake level was inferred for the LGP from a 14C date of 13 cal ka BP of mollusks and was attributed to the meltwater supply under the increasing temperature after the LGM (Klinge and Lehmkuhl, Reference Klinge and Lehmkuhl2013). A high lake level after 17 ka was also reported from the Khar Us Nuur, one of the three lakes in the southern Valley of Great Lakes (Lehmkuhl et al., Reference Lehmkuhl, Klinge, Rother and Hülle2016).
Paleoclimatic interpretations for the LGP diverge more concordant with the increasing number of investigated sites. The spatial and temporal variability of environmental conditions and sensitivity to climatic changes between different localities is due to regional settings such as relief, topography, catchment area, soil, geology, altitude, and latitude. Nevertheless, a trend of rising temperature is a common phenomenon for the LGP. On one hand, increasing temperatures caused the melting of glaciers and permafrost, which supplements the discharge into the basins. On the other hand, evapotranspiration also increases, leading to more arid conditions. The steep gradient of the modern snowline from 2600 m asl in the western Altai to more than 3700 m asl in the southeast indicates decreasing precipitation was the main parameter for limiting the glacier distribution and causing the aridity of the region (Lehmkuhl et al., Reference Lehmkuhl, Klinge, Stauch, Ehlers, Gibbard and Hughes2011). Thus, it is more likely that the last glacial advance, M1a during the early LGP, was driven by increasing precipitation. However, the possibility of local precipitation formation resulting from the large expansion of interior lakes is one of the questions that should be addressed by further research. It might be one of the missing pieces of the puzzle needed to better understand the apparent conflict among paleo-archives during this period.
CONCLUSIONS
The current state of knowledge about the paleoclimatic evolution of the Mongolian Altai during the late Pleistocene is scarce. The oldest remnants of late Pleistocene glacial deposits show that temperature decreased since at least 88 ka (MIS 5b), and a significant warming did not occur until the second half of the LGP (~13 ka). High precipitation induced the formation and advance of glaciers in the early part of the last glacial period (~50–30 ka) and also the persistence of glaciers during the early part of the LGP (18–14 ka). The main glacial advances of the LGM (26–21 ka) were triggered by the coldest temperatures under dry conditions. The interpretation of lake levels in terms of climate conditions needs to be cross-checked against environmental factors like hydrological connections to the high mountains, vegetation density, and geomorphological processes and events. More effective moisture can be caused by higher precipitation, but especially under dry continental conditions, the humidity determining evapotranspiration is also strongly related to the temperature regime. Thus, temperature plays an important part in lake levels and vegetation cover.
At present, it remains a challenge to deduce detailed paleoclimatic reconstructions for the Mongolian Altai during the late Pleistocene from the few and seemingly contradicting archives. Further research is needed to understand pre–anthropogenically forced (natural) climate change in this part of continental Eurasia.
ACKNOWLEDGMENTS
The authors would like to thank the Deutsche Forschungsgemeinschaft (HI 1398/3-1, LE 730/31-1, Schl 527/1-2) for their financial support. Fieldwork was supported by the Institute of Geography of the Mongolian Academy of Sciences. We thank A. Hilgers, D. Falk, H. Rother, S. Pötsch, and M. Walther for their support during the fieldwork and scientific discussions.


 Open access