


Introduction
Hadrosaurs, commonly known as duck-billed dinosaurs, were the dominant large-bodied terrestrial herbivores in many latest Cretaceous ecosystems (Horner et al. Reference Horner, Weishampel, Forster, Weishampel, Dodson and Osmólska2004). They had a nearly global geographic distribution (Lund and Gates Reference Lund, Gates, Lucas and Sullivan2006; Prieto-Márquez Reference Prieto-Márquez2010b) that included latitudinal extremes (Case et al. Reference Case, Martin, Chaney, Reguero, Marenssi, Santillana and Woodburne2000; Gangloff and Fiorillo Reference Gangloff and Fiorillo2010) and were one of the most diverse and abundant dinosaur groups in the Late Cretaceous (e.g., Horner et al. Reference Horner, Weishampel, Forster, Weishampel, Dodson and Osmólska2004; Prieto-Márquez Reference Prieto-Márquez2010a,b). Their fossil record exceeds 60 named species and includes numerous articulated skeletons (e.g., Horner et al. Reference Horner, Weishampel, Forster, Weishampel, Dodson and Osmólska2004; Prieto-Márquez Reference Prieto-Márquez2010a) and monodominant bonebeds (e.g., Christians Reference Christians1991, Reference Christians1992; Horner et al. Reference Horner, de Ricqles and Padian2000; Colson et al. Reference Colson, Colson and Nellermoe2004; Lauters et al. Reference Lauters, Bolotsky, van Itterbeeck and Godefroit2008; Scherzer and Varricchio Reference Scherzer and Varricchio2010; Woodward et al. Reference Woodward, Fowler, Farlow and Horner2015; Ullmann et al. Reference Ullmann, Shaw, Nellermoe and Lacovara2017) covering wide ontogenetic ranges (e.g., Varricchio and Horner, Reference Varricchio and Horner1993; Horner et al. Reference Horner, de Ricqles and Padian2000; Lauters et al. Reference Lauters, Bolotsky, van Itterbeeck and Godefroit2008; Evans et al. Reference Evans, Eberth and Ryan2015; Woodward et al. Reference Woodward, Fowler, Farlow and Horner2015; Wosik et al. Reference Wosik, Goodwin and Evans2017b), as well as eggs and embryos for some taxa (e.g., Horner and Makela Reference Horner and Makela1979; Horner and Currie Reference Horner, Currie, Carpenter, Hirsch and Horner1994; Horner Reference Horner1999; Dewaele et al. Reference Dewaele, Tsogtbaatar, Barsbold, Garcia, Stein, Escuillie and Godefroit2015). This makes hadrosaurs an ideal dinosaurian clade with which to conduct investigations of life-history characteristics to elucidate their growth strategies and paleoecology.
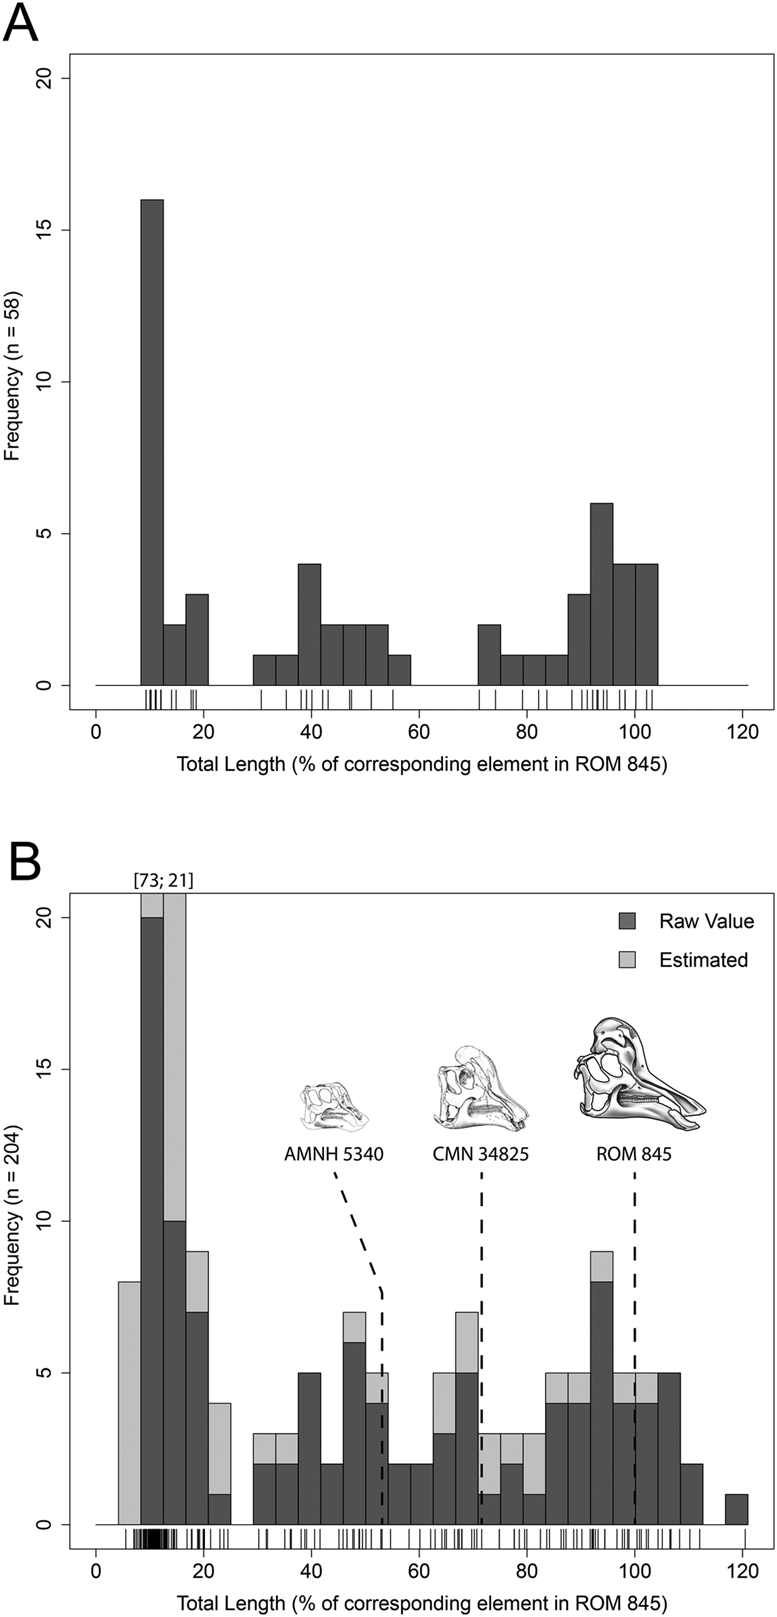
To investigate growth patterns of hadrosaurids from the Dinosaur Park Formation (DPF) (Fig. 1) of Alberta, Brinkman (Reference Brinkman, Eberth and Evans2014) considered the entire DPF as a single attritional, or time-averaged, sample and generated a size–frequency distribution of hadrosaurid long bones based on isolated elements and associated skeletons (Fig. 2A). Three distinct size–frequency peaks were identified and interpreted as discrete size classes. Two of these size–frequency peaks were attributed to juveniles and subadults, whereas the broad third size–frequency peak was inferred as a clustering of overlapping size classes of adult individuals found within the DPF sample. Assuming a closely correlated relationship between size and age, this study suggested that hadrosaurids from the DPF attained asymptotic body size within 3 years of age.
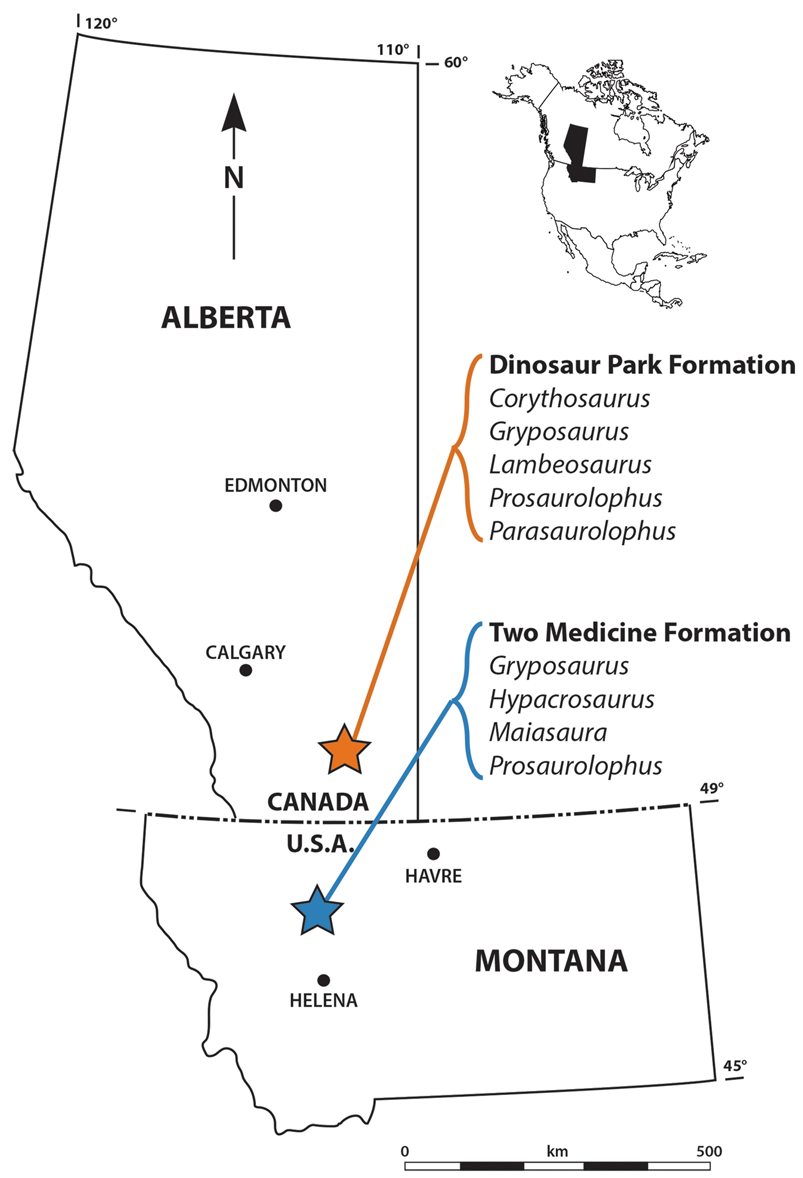
Geographic map distinguishing hadrosaurid taxa between the Dinosaur Park Formation, Alberta, Canada, and the Two Medicine Formation, Montana, USA.
Combined size–frequency distributions of hadrosaurids from the Dinosaur Park Formation, Alberta, Canada. Tick marks below each size–frequency distribution correspond to individual bones. A, Original size–frequency distribution from Brinkman (Reference Brinkman, Eberth and Evans2014) scaled to ROM 845 (Corythosaurus casuarius). N = 58 femora and tibiae. B, Updated size–frequency distribution from our study scaled to ROM 845. N = 204 isolated humeri, femora, and tibiae. Dark shade represents raw measurement values; light shade represents estimated values based on an ordinary least squares regression between total length and minimum diaphyseal circumference (Supplementary Table 3, Supplementary Fig. 1C,D). Ontogenetic progression of Corythosaurus was included for visual reference of well-known associated skeletons. Skull progression was used to represent approximate size classes (modified from Evans Reference Evans2010). Illustration of ROM 845 done by D. Dufault.
However, this interpretation conflicts with osteohistological estimates of 6+ years for penecontemporaneous hadrosaurid dinosaurs from the Two Medicine Formation (TMF) (Fig. 1) of Montana (Campanian ~83–71 Ma) (Horner et al. Reference Horner, de Ricqles and Padian1999, Reference Horner, de Ricqles and Padian2000; Cooper et al. Reference Cooper, Lee, Taper and Horner2008; Freedman Fowler and Horner Reference Freedman Fowler and Horner2015; Woodward et al. Reference Woodward, Fowler, Farlow and Horner2015). Osteohistology has often been utilized to ontogenetically age individuals using growth marks observed in transverse cross sections of limb bones (e.g., Chinsamy-Turan Reference Chinsamy-Turan2005; Huttenlocker et al. Reference Huttenlocker, Woodward, Hall, Padian and Lamm2013; and references therein). These “tree-like growth rings,” which are present in all major vertebrate groups (e.g., Peabody Reference Peabody1961; Halliday and Verrell Reference Halliday and Verrell1988; de Buffrenil and Castanet Reference de Buffrenil and Castanet2000; Chinsamy-Turan Reference Chinsamy-Turan2005; Bourdon et al. Reference Bourdon, Castanet, de Ricqles, Scofield, Tennyson, Lamrous and Cubo2009; Woodward et al. Reference Woodward, Horner and Farlow2011; Köhler et al. Reference Köhler, Marin-Moratalla, Jordana and Aanes2012), denote putatively annual decelerations or complete cessations of bone growth and thereby provide quantitative ontogenetic assessments of individual fossil specimens. Using osteohistology, Cooper et al. (Reference Cooper, Lee, Taper and Horner2008) developed arithmetic modeling techniques to assess growth rates of fossil taxa and provided supporting evidence for a longer growth period (10–12 years) in hadrosaurid dinosaurs from the TMF.
Collectively, these studies suggest either extreme variation of growth rates among closely related hadrosaurid species living in close geographic proximity or that size–frequency distributions and/or osteohistology and growth modeling inaccurately estimate ontogenetic age. Clarification of the biological meaning of the hadrosaurid DPF size–frequency pattern presented by Brinkman (Reference Brinkman, Eberth and Evans2014) is important not only because it has implications for understanding variation in hadrosaurid growth strategies, but because it may also provide further insight about taphonomic biases and potentially seasonal preservation patterns in the DPF system. The objectives of the present study were (1) to evaluate whether body size and ontogenetic age were strongly correlated in hadrosaurid dinosaurs from the DPF and (2) to further test the hypothesis of a potentially rapid growth rate in hadrosaurids from the DPF relative to those from the TMF. We considerably expanded the sample size of Brinkman (Reference Brinkman, Eberth and Evans2014) and subjected it to an osteohistological examination to independently assess ontogenetic age.
Materials and Methods
The sample size of hadrosaurid long bones from the DPF was increased from a total of 58 femora and tibiae (Brinkman Reference Brinkman, Eberth and Evans2014) to 417 across all six major limb bones from isolated elements and associated skeletons: 84 humeri, 39 radii, 43 ulnae, 92 femora, 111 tibiae, and 48 fibulae. Isolated elements in our dataset generally exhibited surface abrasions indicative of reworking and were thus assumed to be derived from different individuals. Locality data were evaluated to eliminate specimens from the dataset that originated from outside of the DPF but were insufficient to distinguish between the upper and lower DPF “faunal zones” (Ryan and Evans Reference Ryan, Evans, Currie and Koppelhus2005) for the majority of specimens. Total length and minimum diaphyseal circumference measurements were gathered personally (MW and DCE) and from published literature (Appendix 1 in the Supplementary Material). Linear measurements under 30 cm were taken with digital calipers, while those over 30 cm and all circumferences were taken using a fabric tape measure. Where complete data from left and right elements from the same specimen were available, the measurements were averaged before analysis. Ontogenetic size classes were identified on the basis of Horner et al. (Reference Horner, de Ricqles and Padian2000), who defined ontogenetic growth stages in the hadrosaurid dinosaur Maiasaura peeblesorum based on osteohistological criteria, body size, and egg, nest, and adult associations.
Specimens for osteohistological sectioning were derived from the Royal Tyrrell Museum collections, and additional specimens were collected from Dinosaur Provincial Park (Bonebed 50), Alberta, during a 2016 field season and accessioned at the Royal Tyrrell Museum.
Institutional Abbreviations
AMNH, American Museum of Natural History, New York, New York; CMN, Canadian Museum of Nature, Ottawa, Ontario; MCSNM, Museum Civico di Storia Naturale di Milano, Milan, Italy; ROM, Royal Ontario Museum, Toronto, Ontario; TMP, Royal Tyrrell Museum of Palaeontology, Drumheller, Alberta; UALVP, University of Alberta Laboratory of Vertebrate Paleontology, Edmonton, Alberta.
Regression Analyses
To generate a combined size–frequency distribution of different stylopodial and zeugopodial elements from the forelimb and hindlimb following Brinkman (Reference Brinkman, Eberth and Evans2014), a sample of associated skeletons (n = 25; Supplementary Table 1) from the entire DPF dataset was analyzed using standard (reduced) major axis (SMA) regressions for any potentially differentiating allometric trajectories between individual elements that may confound concatenation of percent adult size data for each element. Each variable was plotted against the reference datum, femur length. Femur length is an appropriate standard variable for this study, because it is frequently used as a size proxy in allometric studies of the appendicular skeleton in terrestrial vertebrates (e.g., Anderson et al. Reference Anderson, Hall-Martin and Russell1985; Campione and Evans Reference Campione and Evans2012), and unlike the forelimb, the hindlimb is typically used in locomotion in terrestrial vertebrates (e.g., Campione and Evans Reference Campione and Evans2012). SMA regressions were used because they assume that both variables contain error from inaccurate measurements (Warton et al. Reference Warton, Wright, Falster and Westoby2006). In addition, ordinary least squares (OLS) regressions between the total length and minimum diaphyseal circumference of complete elements from the entire DPF dataset of each respective limb element were used to estimate the size of the corresponding variable for incomplete elements. The purpose of this was to include valuable data from incompletely preserved or obstructed limb bones (e.g., wall-mounted skeletons) and subsequently increase the overall sample sizes used for each individual size–frequency distribution.
Linear data were log-transformed before analysis using natural log (ln). SMA (Supplementary Table 2) and OLS (Supplementary Table 3) regressions were used to determine the slopes, intercepts, 95% confidence intervals, and correlation coefficients for each comparison. Each comparison was then evaluated using two-tailed p-values using a significance level of 0.05 for correlation between variables. The results of each SMA regression were assigned as positively allometric (95% confidence interval of slope is greater than 1), negatively allometric (95% confidence interval of slope is less than 1), or isometric (95% confidence interval of slope includes 1). The regressions and statistical analyses were performed in R (R Development Core Team 2016) with the package lmodel2 (Legendre Reference Legendre2008).
Size–Frequency Distributions
Individual size–frequency distributions of total length and minimum diaphyseal circumference were generated in R (R Development Core Team 2016) using the entire dataset for each respective limb element. For relative scale, ROM 845 (Corythosaurus intermedius) was used to represent a presumably morphologically adult-sized specimen with an approximate body length of 9.0 m. This specimen was selected due to its near-complete preservation with minimal deformation providing more accurate proportions of limbs for an adult individual and its high taxonomic abundance relative to other hadrosaurids from the DPF (Ryan and Evans Reference Ryan, Evans, Currie and Koppelhus2005; Mallon et al. Reference Mallon, Evans, Ryan and Anderson2013). The dataset used in Brinkman (Reference Brinkman, Eberth and Evans2014) was reanalyzed and scaled to ROM 845. The dataset for the combined size–frequency distribution in our study only considered isolated specimens to eliminate biases related to preservation (Brown et al. Reference Brown, Campione and Evans2013a,Reference Brown, Evans, Campione, O'Brien and Eberthb,Reference Brown, Evans, Ryan and Russellc) and selecting or ranking elements from associated skeletons.
Size–frequency distributions can be sensitive to the amount and size of bins. Therefore, an attempt to optimize bin size was made using a technique developed by Shimazaki and Shinomoto (Reference Shimazaki and Shinomoto2007, Reference Shimazaki and Shinomoto2010) that utilizes the mean integrated squared error, which is a measure of the goodness of fit of a histogram to the unknown rate. The cost function for each individual sample was assessed to find a range of optimum values. These ranges were then overlapped among all of the size–frequency distributions to find a range of overlapping values, which resulted in a general average of approximately 30 bins. Peaks in the generated size–frequency distributions were identified qualitatively based on observations of the distribution and are by nature somewhat subjective, as in the original analysis of Brinkman (Reference Brinkman, Eberth and Evans2014).
Osteohistology
A total of 35 isolated elements consisting of 7 humeri, 8 femora, and 20 tibiae from the TMP collections spanning the entire ontogenetic size range from nestlings to presumably mature adults were histologically thin sectioned at the minimum diaphyseal circumference to assess ontogenetic age. The minimum diaphyseal circumference was selected (1) to maintain consistency of the sectioning location through ontogeny, (2) to correlate with body-mass estimations (Campione and Evans Reference Campione and Evans2012), and (3) to compare with previously published literature of other hadrosaurid taxa (Horner et al. Reference Horner, de Ricqles and Padian1999, Reference Horner, de Ricqles and Padian2000; Cooper et al. Reference Cooper, Lee, Taper and Horner2008; Freedman Fowler and Horner Reference Freedman Fowler and Horner2015; Woodward et al. Reference Woodward, Fowler, Farlow and Horner2015). Specimens for histological sectioning were selected from each size–frequency peak based on the size of the minimum diaphyseal circumference to assess the correlation between size and age. Thin sections were made and imaged at the ROM Palaeohistology Laboratory, and all molding and casting materials and thin sections are reposited at the TMP.
Ontogenetic series of thin sections from the minimum diaphyseal circumference of humeri, femora, and tibiae were compared to assess the osteohistological differences through ontogeny for each element. Histological terminology follows that of Francillon-Vieillot et al. (Reference Francillon-Vieillot, de Buffrenil, Castanet, Geraudie, Meunier, Sire, Zylberberg, de Ricqles and Carter1990). Cross-polarized filters were used to diagnose the orientation of collagen fibers (e.g., lamellar, parallel fibered, woven fibered). Vascular orientation is used to describe how the long axes of vascular canals are oriented in the bone matrix (e.g., longitudinal, radial, reticular, plexiform, laminar). Cyclical growth marks were diagnosed based on a variation or pause in the rate of bone growth and were used to determine the age and growth rates of sampled individuals. Lines of arrested growth (LAGs), a type of cyclical growth mark, were identified based on an attenuation or complete cessation in bone deposition, which would be visible along the circumference of the section. A zone represented the region of bone deposition between sequential growth marks.
Before sectioning, specimens were mechanically prepared with pneumatic and hand tools to remove rock matrix and later followed by an inspection of external surfaces around the diaphyseal region for damage resulting from preparation, for which nothing substantial was seen. Each specimen was measured and photographed. Three-dimensional models were generated using traditional molding and casting as well as photogrammetric (Agisoft PhotoScan) and laser-scanning (ScanStudio) techniques. Complete transverse cross-sectional pucks that contained the minimum diaphyseal circumference were extracted using a Well Diamond Wire Saw 9000 series or Buehler IsoMet 1000 Precision Cutter low-speed saw depending on the size of the specimen. The pucks were molded and cast, and casts were then reinserted into the original bone. The pucks were completely embedded in Castolite polyester resin, ground on a lapwheel, and polished on a glass block using a sequential grit series of 600 and 1000. They were then submerged in a sonic vibration bath to remove excess grit and allowed to air dry for 24 hours before being mounted on 2- to 3-mm-thick plexiglass slides with either PSI 122/124 resin for large specimens (diameter >3 cm) or CA-40 cyanoacrylate (diameter <3 cm). The blocks were cut away from the slide on the IsoMet and subsequently ground down to an appropriate thickness using either a Hillquist Thin Sectioning Machine or a grinding lap wheel based on size and necessity. Complete cross-sectional slides were finished by hand polishing on a glass plate with 600 followed by 1000 silicon carbide grit and again bathed in a sonic vibration bath.
Thin-section images were photographed at the ROM Palaeohistology Laboratory using a Nikon DS-Fi1 camera mounted to a Nikon AZ-100 microscope under plain-polarized and cross-polarized light. Images were processed and assembled using Nikon NIS-Elements Basic Research v. 3.13 imaging software. Images were captured at various magnifications dependent on the size of the cross section, 1280 × 960 resolution, 2–8 ms exposure, and set on Dynamic contrast with ≥40% overlap. Johnson & Johnson baby oil was added to the surface of each slide to increase optical clarity during imaging. Multiple images were taken for slides that exceeded the focal dimensions of the imaging stage and later stitched together using the Photomerge function in Adobe Photoshop. Further processing of images (e.g., text, scale bars) was completed using Adobe Photoshop and Illustrator. Retrodeformation of histological images for elements suffering from taphonomic distortion (e.g., crushing, flattening) was performed manually using Adobe Photoshop to account for a more accurate size and shape of cross-sectional areas.
Age Determination and Growth Modeling
The mid-diaphysis of tibiae preserves the most complete growth record in hadrosaurid dinosaurs (Horner et al. Reference Horner, de Ricqles and Padian1999), but growth marks, herein considered to correspond with annual cycles or annuli (e.g., Köhler et al. Reference Köhler, Marin-Moratalla, Jordana and Aanes2012), can be progressively obliterated due to bone remodeling and the expansion of the medullary region through ontogeny (Erickson Reference Erickson2014). To account for the entire growth history, age retrocalculation was performed on specimens with the longest growth record from our osteohistological sample to identify any potentially missing growth marks (see Table 1 for list of specimens). We generally followed the age retrocalculation method described by Cooper et al. (Reference Cooper, Lee, Taper and Horner2008) and Lee and O'Connor (Reference Lee and O'Connor2013) implemented in R (R Development Core Team 2016). For tibia circumference of hatchling hadrosaurid individuals, 25 mm was used based on osteohistological evaluation (Wosik et al. Reference Wosik, Whitney, Rogers, Woodward, Evans, Pellegrini and Parris2017c, Reference Wosik, Whitney, Rogers, Woodward and Evans2018). Because corrected Akaike information criteria (AICc) used to evaluate the best-fit model for each specimen was not necessarily large enough to confidently choose one particular model over another, and the preferred growth models for each analyzed specimen were not consistent among our sample, growth model parameters used for the age retrocalculation were averaged based on AICc weights (Burnham and Anderson Reference Burnham and Anderson2002). Based on the results of age retrocalculation, tibia circumference and body-mass growth curves were generated using averaged Richards-family growth models based on AICc weights. Corrected AICc values were used to account for small sample sizes consisting of a single element for each taxon using R package MuMIn (Bartoń Reference Bartoń2017).
Summary of parameter values and results for averaged age retrocalculation growth models along with estimated values for the age of first recorded growth mark (Est GM 1 age) and estimated values for the minimum diaphyseal circumference of the estimated first growth mark (Est GM 1 circ). Abbreviations: m, slope; A, asymptote; K, constant; I, inflection point, DPF, Dinosaur Park Formation.

Each sampled tibia used to generate growth curves had attained asymptotic body size and provided a base to estimate body masses for each respective taxon using an interspecific equation for quadrupedal vertebrates (Campione and Evans Reference Campione and Evans2012: Equation 1). The body-mass equation requires the sum of humerus and femur minimum diaphyseal circumferences as a dependent variable, so the tibial circumferences were converted to the sum of humerus and femur circumferences based on associated skeletons from the DPF (n = 6, R 2 = 0.99). The estimated values of the combined humerus and femur circumferences were cross-checked with associated skeletons of each respective taxon when available. Developmental mass extrapolation (Erickson and Tumanova Reference Erickson and Tumanova2000) was then used to convert each growth mark circumference to body mass to account for deviations from the body-mass equation for juvenile individuals. Age was also cross-checked via section stacking of growth marks, or annuli (Bybee et al. Reference Bybee, Lee and Lamm2006), from the histological samples in this study whenever possible.
Transverse cross-section periosteal surfaces (outer circumferences) and circumferences of growth marks were traced in Adobe Illustrator. Data for tibiae of hadrosaurids used for comparison were obtained from published literature for Maiasaura (MOR 758 NC-7-4-96-‘T46’; Woodward et al. Reference Woodward, Fowler, Farlow and Horner2015) and Hypacrosaurus (MOR 549; Cooper et al. Reference Cooper, Lee, Taper and Horner2008), whereas those for Probrachylophosaurus (MOR 2919; Freedman Fowler and Horner Reference Freedman Fowler and Horner2015) were remeasured in Adobe Illustrator after minor digital reconstruction of the original histological image to account for a more accurate size and shape of the transverse cross-sectional area. Freedman Fowler and Horner (Reference Freedman Fowler and Horner2015) interpreted LAG 8 in Probrachylophosaurus (MOR 2919) as a zone of one to five closely spaced lines, which is maintained herein for consistency and comparison.
Results
To assess life-history characteristics of hadrosaurids from the DPF, a multitaxic approach was undertaken following Brinkman (Reference Brinkman, Eberth and Evans2014) due to the lack of a suitable monodominant hadrosaurid bonebed from the DPF (Eberth et al. Reference Eberth, Evans, Lloyd, Eberth and Evans2014; Eberth Reference Eberth2015). The taxonomic diversity of resident hadrosaurids consisted of five genera, with each taxon reaching comparable adult size with approximate body lengths of 9.0–10 m (Lull and Wright Reference Lull and Wright1942; Ryan and Evans Reference Ryan, Evans, Currie and Koppelhus2005; Mallon et al. Reference Mallon, Evans, Ryan and Anderson2013). Therefore, it is important to acknowledge that our results may be based on sample sizes consisting of multiple genera, similar to Brinkman (Reference Brinkman, Eberth and Evans2014) (Fig. 2A).
Of the 417 hadrosaurid limb bones measured for this study, 260 were classified as isolated and belonging to separate individuals, and 157 were from a total of 34 associated skeletons. Twenty-five of the 34 associated skeletons were taxonomically identifiable to genus, with 18 attributable to lambeosaurines and 7 to hadrosaurines. Corythosaurus dominated the lambeosaurine sample with 10 identifiable individuals. Complete total length and minimum diaphyseal circumference measurements were both preserved in 186 bones, and individually in 292 and 314 bones, respectively. The tibia generally exhibited the largest sample size for each categorical measure and had the best preservation of complete elements, which may be attributed to its robust morphology and thick cortical bone providing more resistance to taphonomic destruction (Horner et al. Reference Horner, de Ricqles and Padian1999). Nestling-sized hadrosaurid radii, ulnae, and fibulae (1) can be difficult to accurately identify and distinguish from similarly sized elements of other penecontemporaneous dinosaur groups due to their simple morphologies and (2) were poorly represented, if at all, in our sample. Therefore, these poorly represented limb elements were excluded from further analyses in this study to avoid biases from uneven sampling, and they did not contribute to ontogenetic stages when the entire dataset was combined into a single size–frequency distribution.
Regression Analyses
Results of the SMA regression analyses (Supplementary Table 2, Supplementary Fig. 1A,B) indicated a largely isometric relationship of the limb length proportions through ontogeny, which allowed us to combine elements into a single size–frequency distribution. Coefficients of determination (R 2) associated with the regressions were generally high (>0.86), correlation between variables was significant based on low p-values (p < 8.37e−05), slopes were constrained between 0.96 and 1.12, and confidence intervals contained 1.0 for all comparisons.
Sample sizes of the OLS regression analyses (Supplementary Table 3, Supplementary Fig. 1C,D) ranged from 22 (radius, fibula) to 40 (femur, tibia) individually complete specimens with stylopodial elements typically exhibiting larger sample sizes. All comparisons had high coefficients of determination (R 2 > 0.86) and significant correlation between variables based on low p-values (p < 5.41e−10). Therefore, estimation of incomplete elements could be confidently executed using the corresponding OLS regression model.
Size–Frequency Distributions
The combined size–frequency distribution (Fig. 2B) consisted of a total of 204 isolated hadrosaurid long bones from the DPF and revealed four relatively distinct size–frequency peaks along a generally positive parabolic distribution consistent with a long-term, time-averaged depositional origin (Olson Reference Olson1957).
The smallest size class included individuals that ranged from ~4% to 25% of the linear dimensions of ROM 845, with a size–frequency peak in the ~8–12% size range. Articular surfaces were poorly defined, and the periosteal surface was punctuated with a porous surface texture due to the anastomosing of vascular canals providing independent morphological evidence for an early stage of ontogenetic development. Individuals in this size class would have had a body length ranging from 36 to 225 cm and corresponded with the nestling and early juvenile size classes as defined in Horner et al. (Reference Horner, de Ricqles and Padian2000). It is important to note that the frequency of the first peak may be inflated as a result of collection bias favoring the ease of excavating small material.
The second size class may contain two individual size–frequency peaks, but we interpreted this as a single size class that aligned with juvenile individuals that ranged from ~29% to 54% of the linear dimensions of ROM 845, with size–frequency peaks within the ~37–42% and ~46–50% size ranges, and body lengths of 261–486 cm. Articular surfaces were more defined but not rugose, and surface textures followed a striated pattern that provided a base for microcracks to form from diagenetic processes.
The third size class was consistent with subadults that ranged from ~58% to 75% of the linear dimensions of ROM 845, with a size–frequency peak in the ~67–71% size range, and body lengths of 522–675 cm. Periosteal surface textures ranged from striated to smooth, muscle attachment sites such as the fourth trochanter of the femur (Dilkes Reference Dilkes2000) were well developed, and articular surfaces exhibited rugose patterns.
The fourth size class was broader than the others and likely represented an accumulation of adult-sized individuals attaining asymptotic body size. It ranged between ~75% and 121% of the linear dimensions of ROM 845, with a size–frequency peak within the 92–96% size range. Here, articular surfaces were fully developed with strong rugosities; periosteal surfaces were very smooth, emitting a natural sheen; and robust muscle scars were clearly observed, particularly along the midshafts of the humeri and femora.
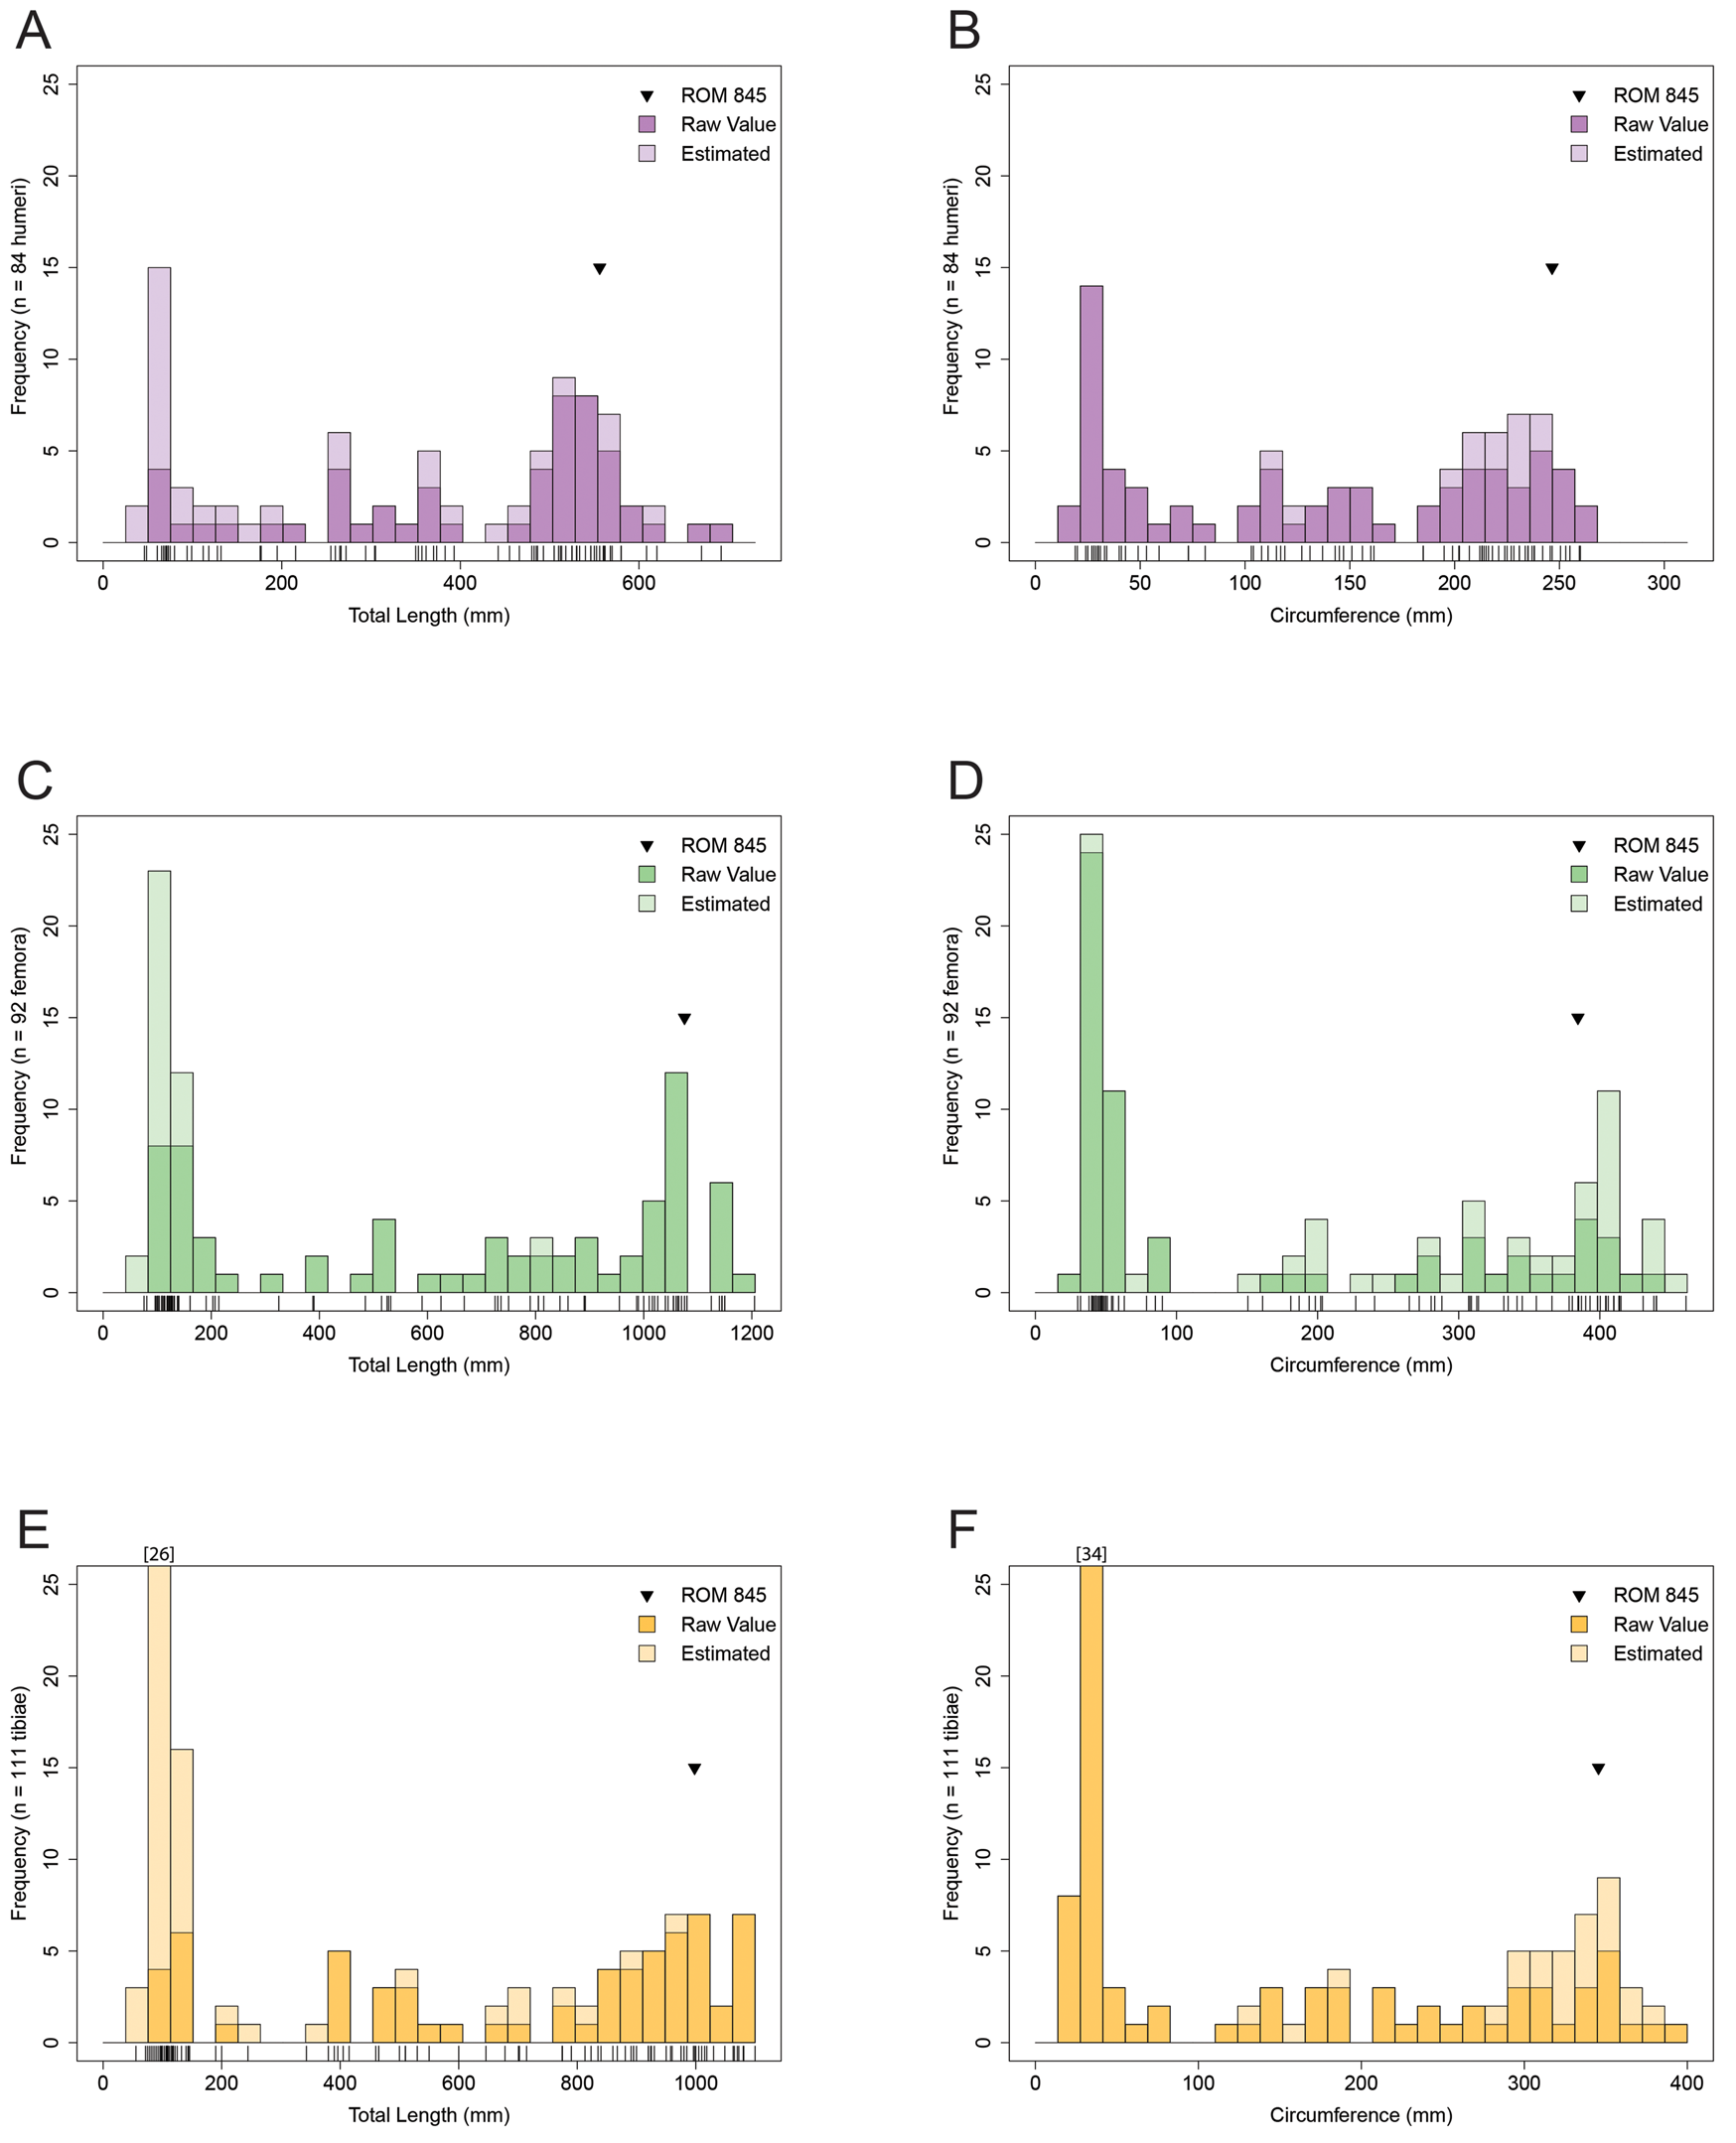
When the dataset for the combined size–frequency distribution was partitioned into individual elements for total length and minimum diaphyseal circumference (Fig. 3), it became difficult to distinguish consistent size–frequency peaks across the individual size–frequency distributions. Only in the humerus could three distinct size–frequency peaks and/or size classes be recognized for both the total length and minimum diaphyseal circumference size–frequency distributions (Fig. 3A,B). Elements with smaller sample sizes (38 < N < 49; radius, ulna, fibula) (Supplemental Fig. 2) tended to only recover the adult cluster, whereas the humerus, femur, and tibia (83 < N < 112) (Fig. 3) ranged between three to four potentially distinct size–frequency peaks and/or size classes.
Size–frequency distributions of hadrosaurid humeri (A, B), femora (C, D), and tibiae (E, F) from the Dinosaur Park Formation, Alberta, Canada. A, C, E, Total length. B, D, F, Minimum diaphyseal circumference. Tick marks below each size–frequency distribution correspond to individual bones. Dark shade represents raw measurement values; light shade represents estimated values based on an ordinary least squares regression between total length and minimum diaphyseal circumference (Supplementary Table 3, Supplementary Fig. 1C,D).
Osteohistology
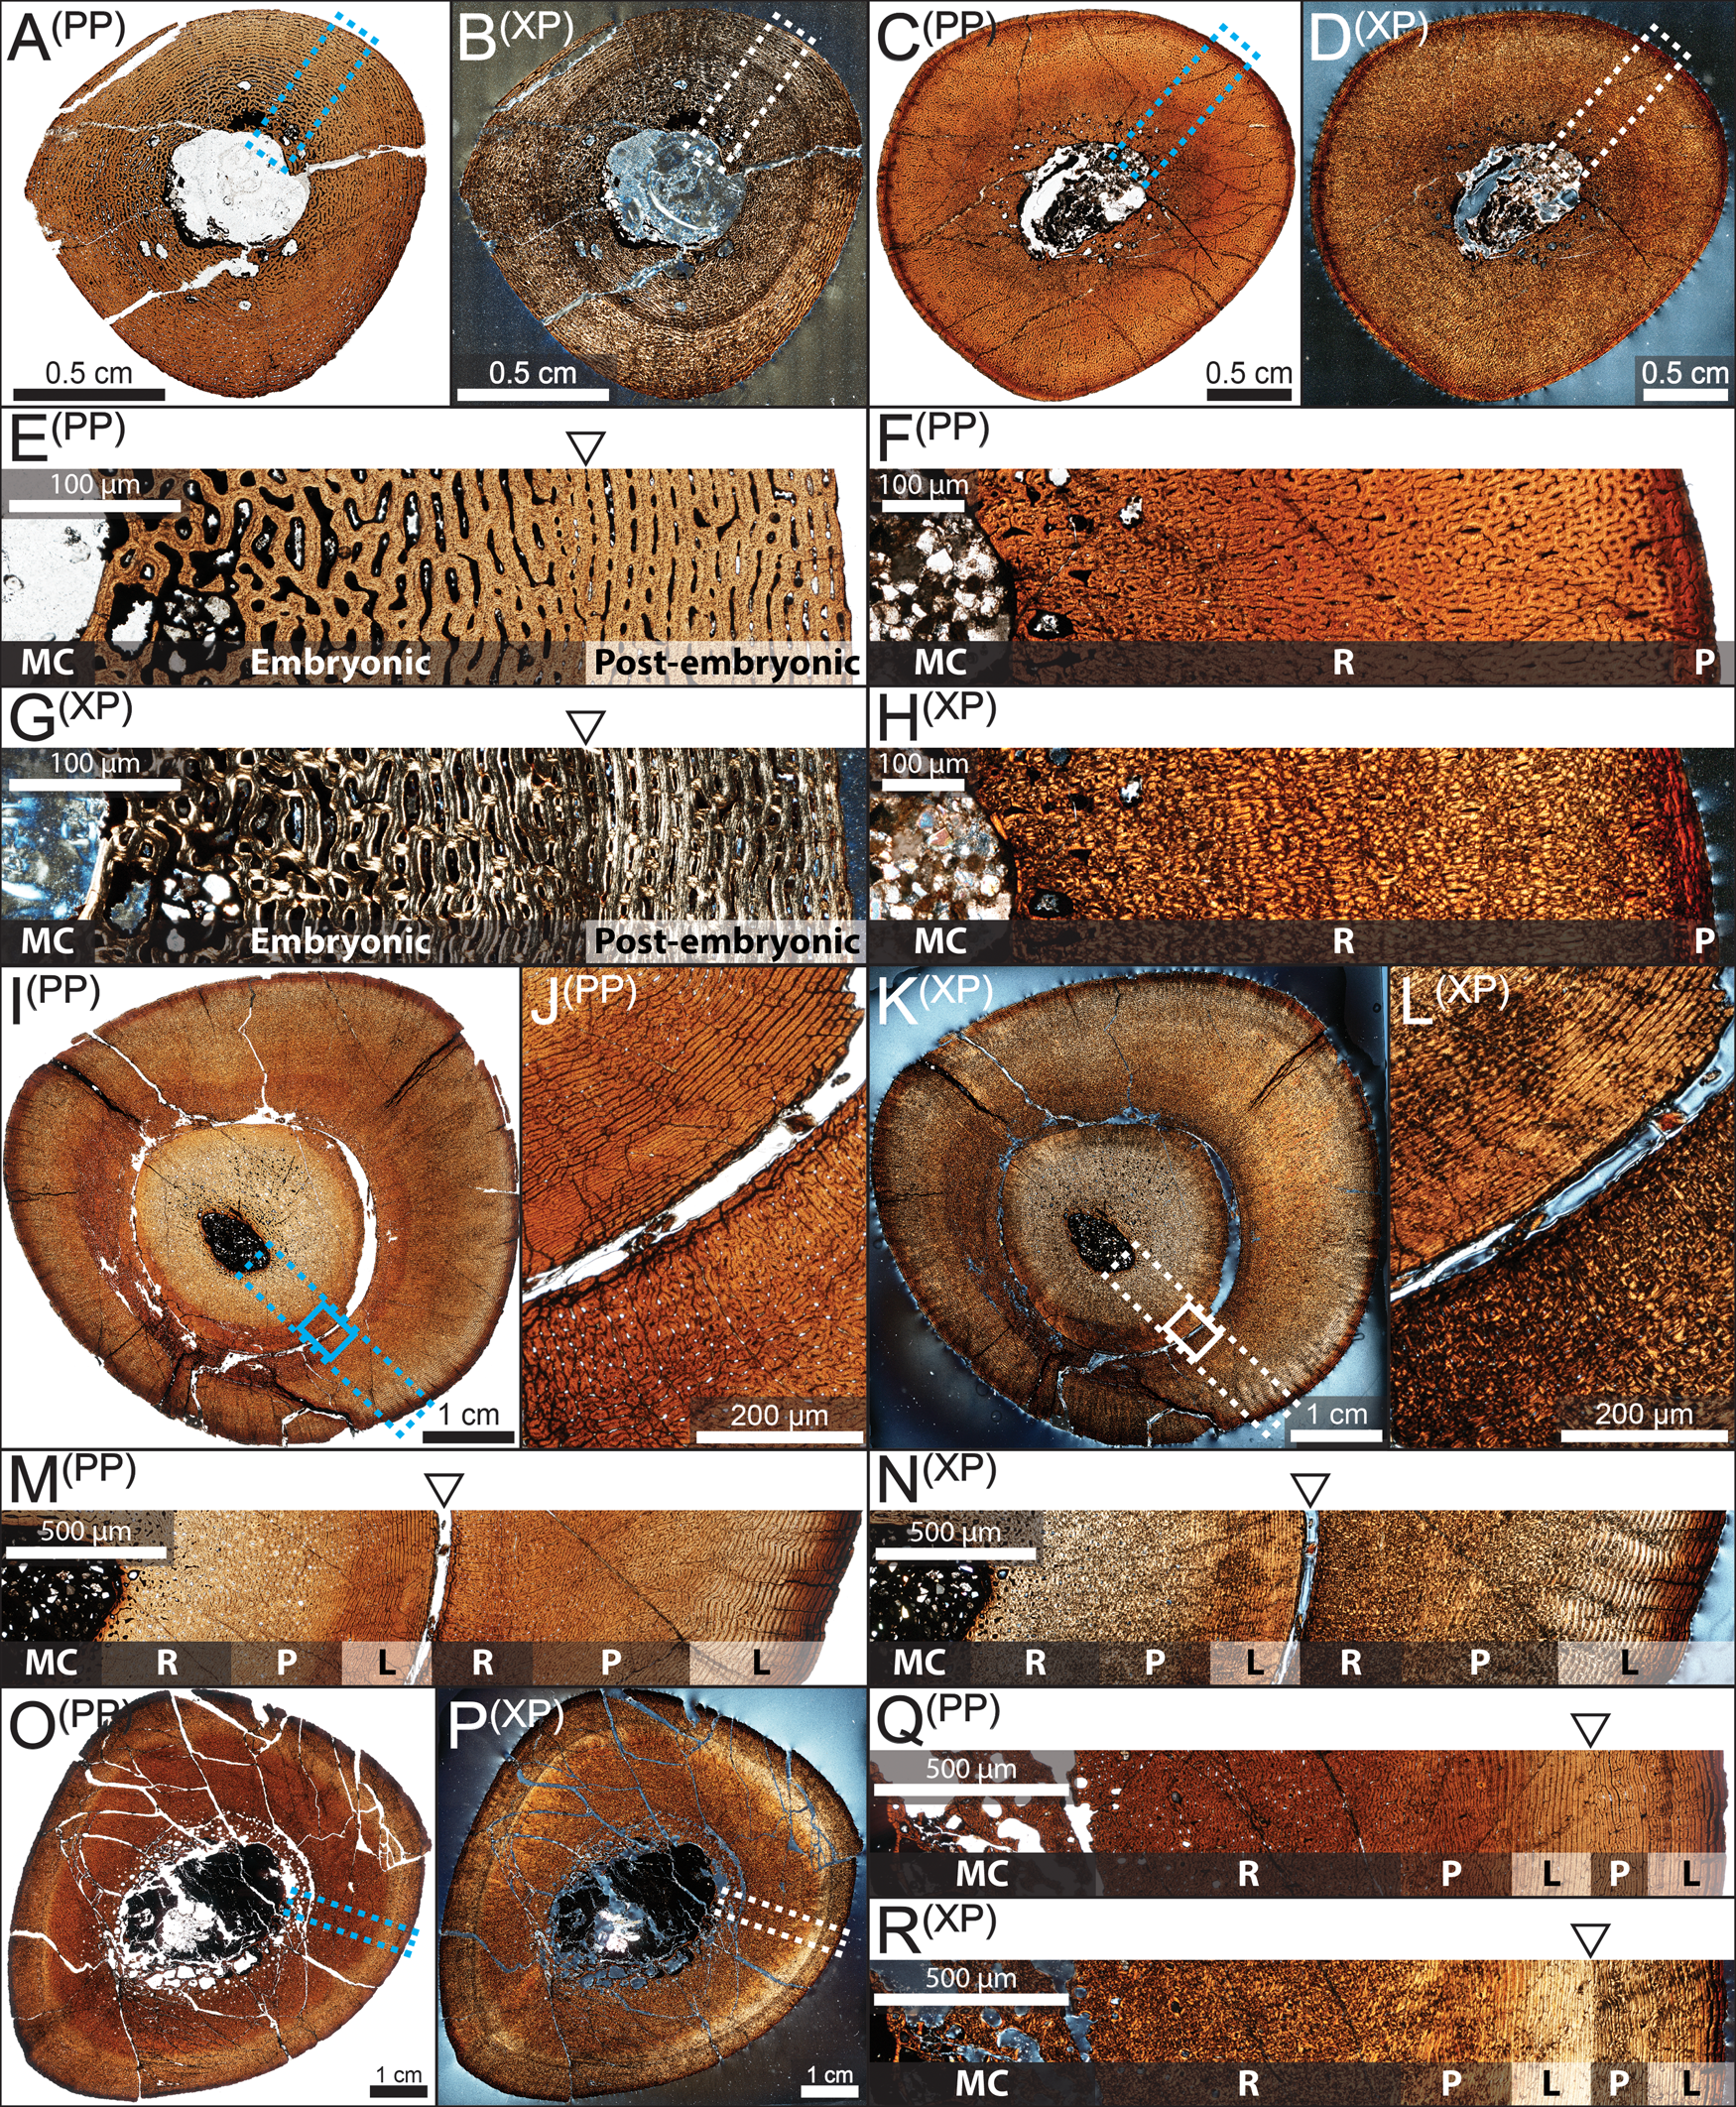
Neonate individuals exhibited a highly disorganized matrix that primarily consisted of woven-fibered bone with localized concentrations of parallel-fibered bone (Fig. 4A,B). Late nestlings began to transition to fibrolamellar bone with longitudinally or radially oriented vascular canals and preserved a narrow zone of reduced vascularity typically coinciding with a darkened band (Fig. 4E–G). This circumferentially oriented zone likely partitioned the embryonic and perinatal bone regions, although with some degree of circumferential variation, and may be an osteohistological indicator of the hatching period (Curry Rogers et al. Reference Curry Rogers, Whitney, D'Emic and Bagley2016; Whitney et al. Reference Whitney, Wosik, Doran, Curry Rogers, Woodward, Evans, Pellegrini and Parris2017; Wosik et al. Reference Wosik, Whitney, Rogers, Woodward, Evans, Pellegrini and Parris2017c, Reference Wosik, Whitney, Rogers, Woodward and Evans2018). Early juveniles reflected the bone microstructure of late nestlings, but the medullary cavity had already expanded beyond and/or remodeled over the osteohistological indicator of hatching (Fig. 4C,D, F–H). Late juveniles were all composed of primary bone tissues exhibiting a relatively small medullary cavity surrounded by a highly vascularized complex of woven-fibered and parallel-fibered bone within the inner cortex (Fig. 4I–N). Secondary bone remodeling was minimal in the outer cortex, except for the anterolateral border near a muscle attachment site, which has been similarly observed in the ornithopods Tenontosaurus (Werning Reference Werning2012), Dysalotosaurus (Hübner Reference Hübner2012), and other hadrosaurids (Freedman Fowler and Horner Reference Freedman Fowler and Horner2015; Woodward et al. Reference Woodward, Fowler, Farlow and Horner2015). The vascular orientation of the outer cortex largely consisted of zonal bone, transitioning from reticular/plexiform into laminar vascular canal orientation within each zone (Fig. 4M,N). Subadults preserved the woven/parallel-fibered inner cortex but began to increase the area of the medullary cavity relative to the entire cross-sectional area (Fig. 4O–R). Adults had numerous well-developed secondary osteons, and the non-zonal outermost cortex was composed almost solely of circumferentially oriented lamellar bone (Fig. 5A,C,D,F). Only the largest individuals exhibited a pronounced stacking of LAGs in close proximity to one another near the periosteal surface (Fig. 5B,C,E,F), whereas late juveniles and subadults exhibited a more predominant zonal bone pattern, with consistent shifts between reticular and laminar fibrolamellar bone (Fig. 4M,N,Q,R), than adults in the sample.
Osteohistology of nestling through subadult hadrosaurid tibiae from the Dinosaur Park Formation, Alberta, Canada, under plain polarized (PP) and cross-polarized (XP) light microscopy. A, B, E, G, Nestling (TMP 1997.012.0216). C, D, F, H, Early juvenile (TMP 1991.036.0783). I–N, Late juvenile (TMP 1979.014.0308). O–R, Subadult (TMP 1994.012.0870). A–D, I, K, O, P, Full transverse cross sections. E–H, M, N, Q, R, Close-up of dotted boxed region with arrows indicating visible growth marks and general bone vasculature orientation. J, L, Close-ups of solid boxed regions from I and K, respectively, showing the yearling growth mark. Abbreviations: L, laminar; MC, medullary cavity; P, plexiform; R, reticular.
Osteohistology of adult hadrosaurid tibiae from the Dinosaur Park Formation, Alberta, Canada. A–C, TMP 1979.014.0020. D–F, TMP 2016.012.0192. A, D, Full transverse cross sections in plain polarized light. B, E, Traced growth marks with extent of medullary cavity and/or secondary osteon development outlined in dotted central region. C, F, Close-up of boxed regions from A and D, respectively, with arrows indicating visible growth marks and general bone vasculature orientation in plain polarized light. Abbreviations: L, laminar; MC, medullary cavity; P, plexiform; R, reticular.
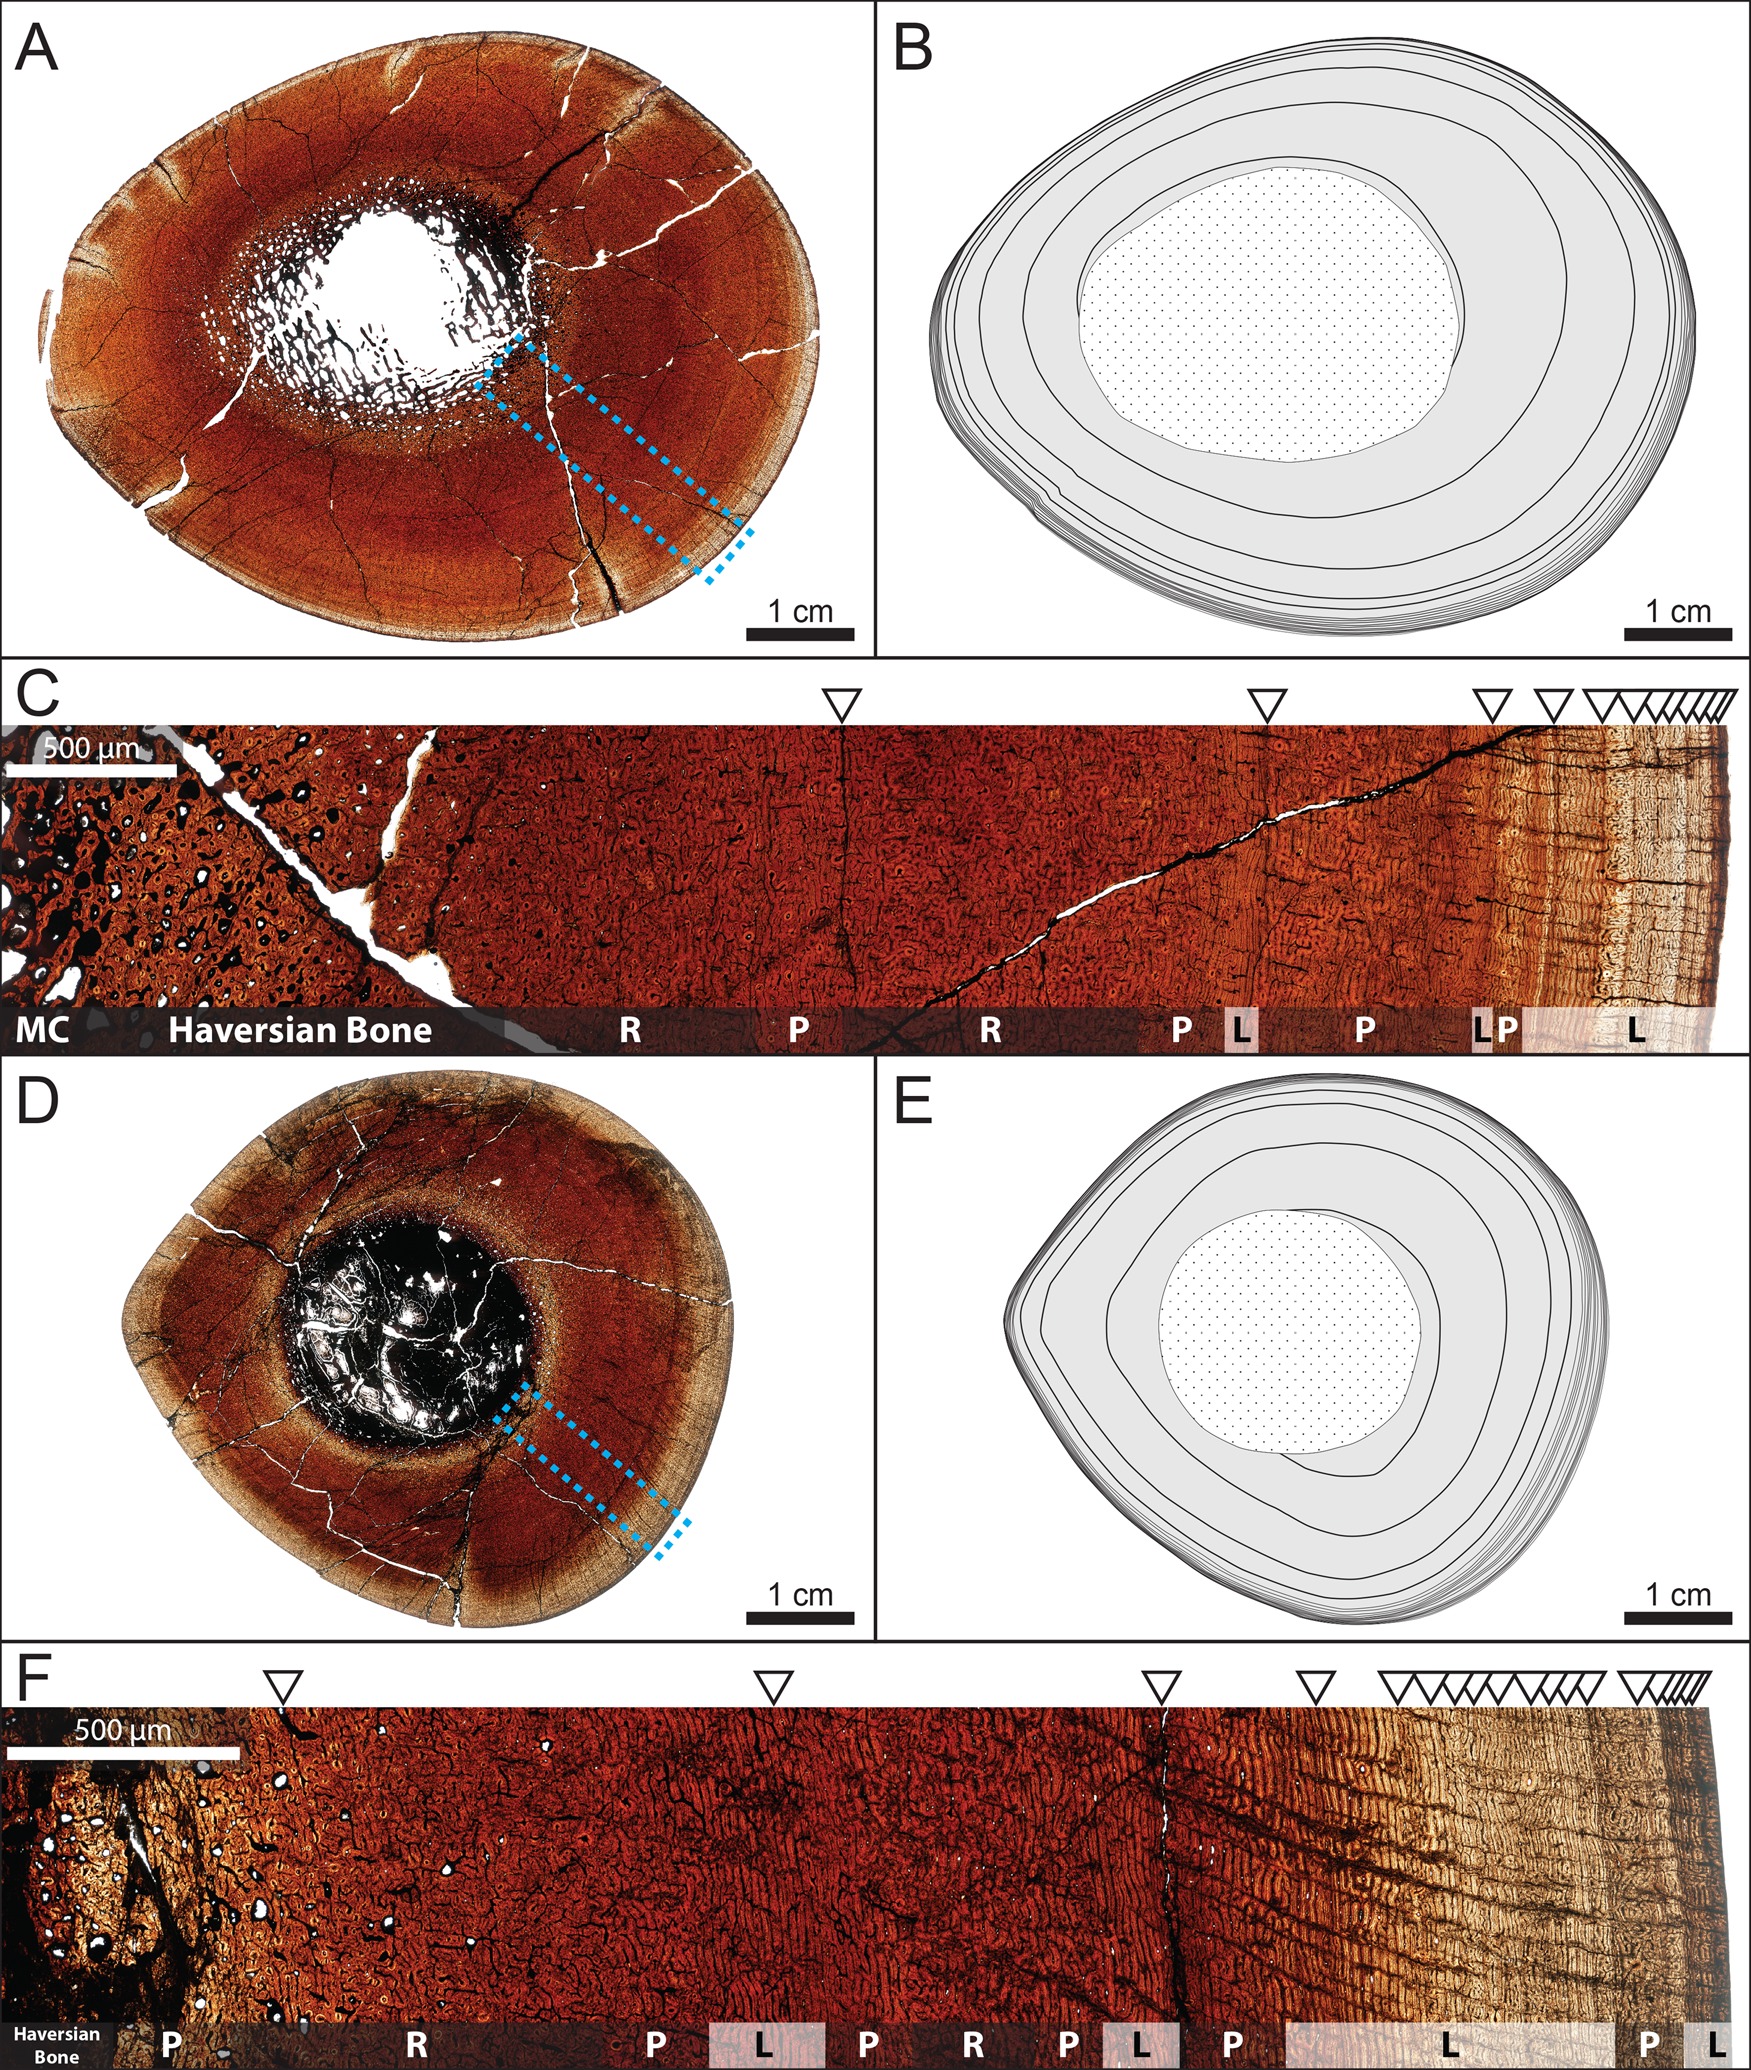
When comparing growth marks to the periosteal (outer) circumferences of the sequential size classes, the growth marks were offset and generally larger than the outer circumferences of individuals belonging to the previous size–frequency peak. For example, the growth mark circumference of the subadult TMP 1994.012.0870 (192.5 mm) was larger than the outer circumference of the late juvenile TMP 1979.014.0308 (174.5 mm) (Fig. 6). Individuals sampled from the first size–frequency peak did not record any growth marks beyond the potential indicator of hatching (Fig. 6). Most of the sampled individuals from the second size–frequency peak only showed a layering of laminar (circumferential)-oriented vascular canals near the periosteal surface (outer circumference) that was interpreted as the imminent deposition of a cyclical growth mark (Fig. 4M,N). However, several specimens preserved a growth mark nested closer to the inner cortex in addition to the layering of laminar vascular canals near the periosteal surface (Fig. 4M,N). The extent to which the entire circumference of this growth mark was preserved ranged from complete (TMP 1979.014.0308 [tibia]) to partial (e.g., TMP 1993.036.0382 [humerus], TMP 1999.055.0350 [femur], TMP 1994.012.0872 [tibia]) due to a varying degree of secondary remodeling. Therefore, the second size–frequency peak was interpreted as representing hadrosaurids nearing 2 years of age. Individuals from the third size–frequency peak consistently preserved one growth mark in addition to the layering of laminar vascular canals near the periosteal surface (Fig. 4O–R). The circumferences of this growth mark corresponded with the outer circumferences of specimens from the second size–frequency peak (Fig. 6). When the growth mark from the second size–frequency peak was superimposed onto sections of specimens from the third size–frequency peak, it placed deep within the medullary cavity region and was absent because it had already been obliterated through medullary cavity expansion (Fig. 6). Therefore, the third size–frequency peak represented hadrosaurids nearing 3 years of age. The histological sample of the broad fourth size–frequency peak consisted only of humeri and tibiae and revealed that the size ranges of growth marks corresponding with each individual ontogenetic age began to overlap with size ranges of other ontogenetic ages, particularly in the tibiae. A pronounced stacking of LAGs in close proximity to one another near the periosteal surface was present in several of the largest specimens, although in different places in the size range (e.g., TMP 2016.012.0193 [humerus], TMP 1979.014.0020 [tibia], TMP 2016.012.0192 [tibia]) and can be regarded as an external fundamental system (Horner et al. Reference Horner, de Ricqles and Padian2000) or outer circumferential layer (Chinsamy-Turan Reference Chinsamy-Turan2005), indicating the near cessation of bone growth. The largest element (TMP 1979.012.0020 [tibia]; Fig. 5A–C) preserved a minimum of 15 growth marks.
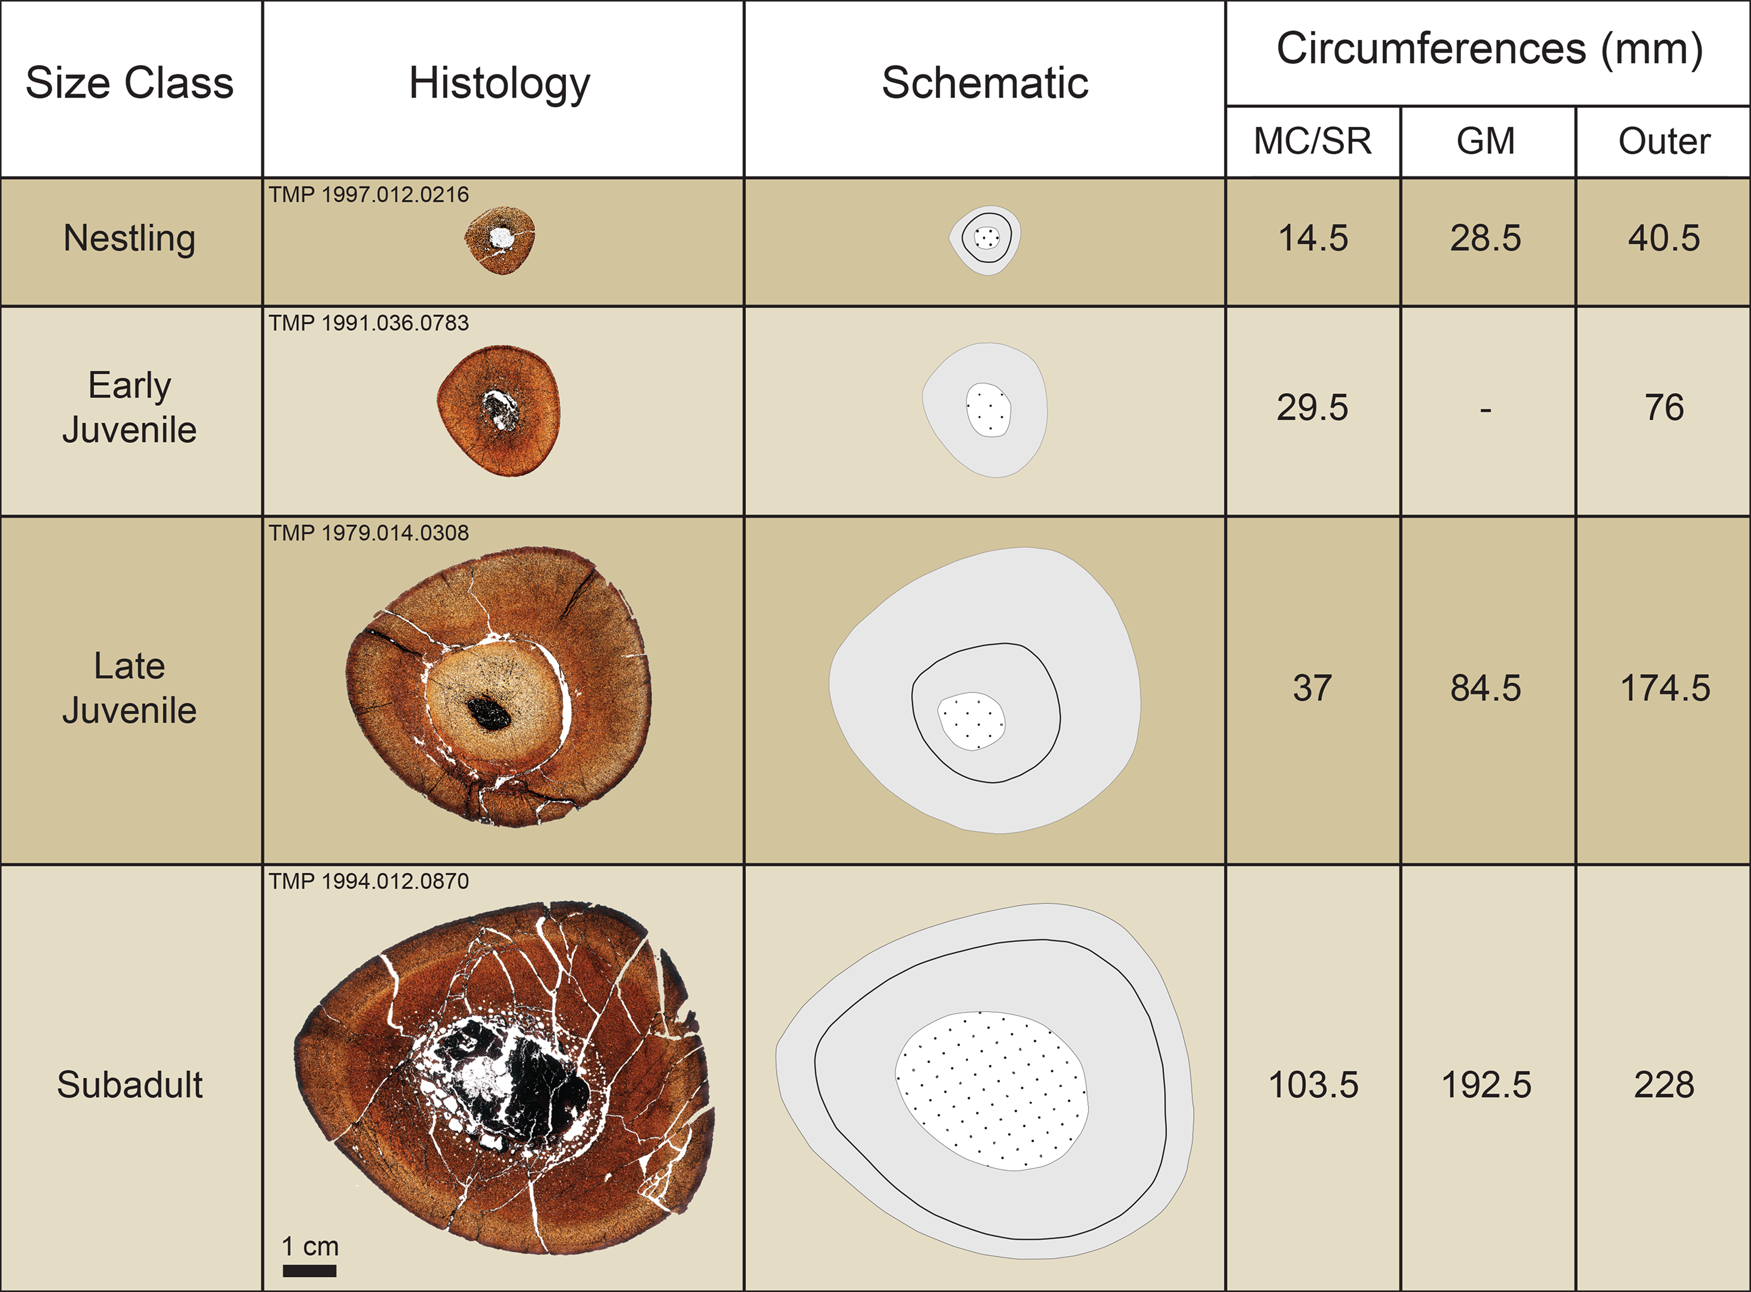
Summary of section stacking of tibiae demonstrating the obliteration of the inner cortex (early ontogeny) via processes of secondary bone remodeling. Schematics highlight cortical bone (solid gray), extent of medullary cavity and/or secondary osteon development (dotted white), and growth marks (solid black line). Circumferences refer to the extent of the medullary cavity and/or extensive inner cortex secondary remodeling (MC/SR), growth mark (GM), and outer/periosteal circumference (Outer).
Age Determination and Growth Modeling
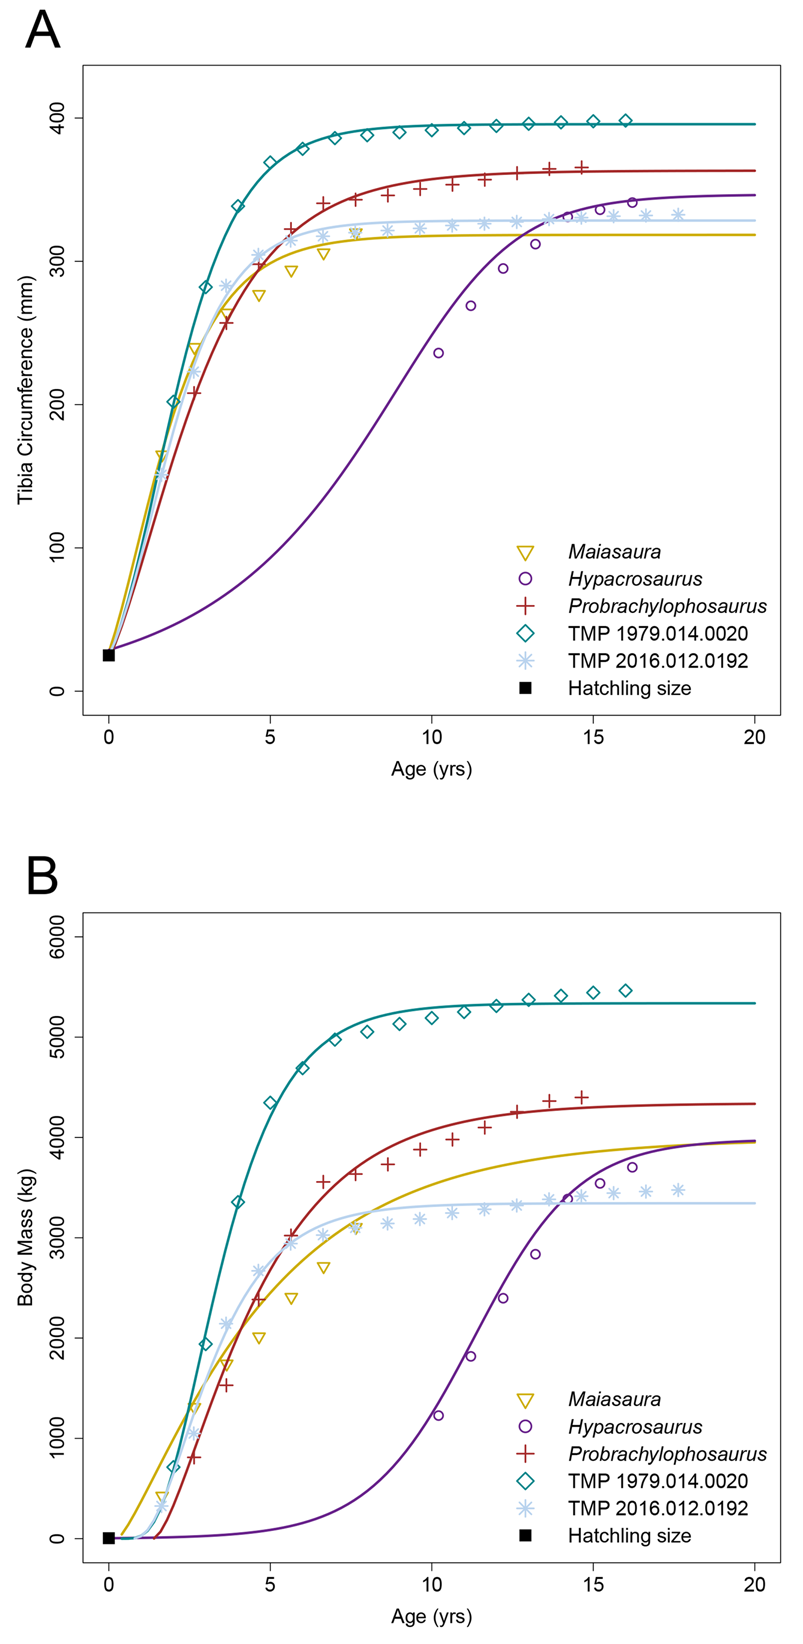
Estimated parameters of the averaged growth models are listed in Table 1, whereas data for the individual models are in Supplementary Tables 4–6 along with AICc scores. Growth mark circumferences for the five tibiae are listed in Table 2 along with a summary of retrocalculated ages of each tibia and estimated body masses for each taxon obtained from the averaged models. Tibia circumference and body-mass growth curves are presented in Figure 7. Retrocalculation and growth modeling were restricted to tibiae so that our data could be compared with previously published growth rates of other hadrosaurids (Cooper et al. Reference Cooper, Lee, Taper and Horner2008; Freedman Fowler and Horner Reference Freedman Fowler and Horner2015; Woodward et al. Reference Woodward, Fowler, Farlow and Horner2015). From our DPF sample, two tibiae (TMP 1979.014.0020, TMP 2016.012.0192) preserved a substantial growth record that was suitable for growth modeling. With the addition of the three tibiae from other hadrosaurids from the literature, the total sample consisted of five individuals from at least four genera including both lambeosaurines and hadrosaurines. When reanalyzing the osteohistological record of Probrachylophosaurus (MOR 2919; Freedman Fowler and Horner Reference Freedman Fowler and Horner2015), our growth mark circumference values were on average ~12% smaller, and an additional partially preserved growth mark was identified from within the inner cortex of the section.
Hadrosaurid growth curves. A, Tibial minimum diaphyseal circumference growth of individuals with longest growth records from each taxon. B, Body mass growth of currently known hadrosaurid growth records. Growth mark data for other hadrosaurid taxa were taken from the literature and reanalyzed (summarized in Table 2): Hypacrosaurus (Cooper et al. Reference Cooper, Lee, Taper and Horner2008), Maiasaura (Woodward et al. Reference Woodward, Fowler, Farlow and Horner2015), and Probrachylophosaurus (Freedman Fowler and Horner Reference Freedman Fowler and Horner2015). Poor estimation of the growth curve of Hypacrosaurus is due to the lack of the early part of its growth record (see “Results: Age Determination and Growth Modeling” for more information).
Summary of retrocalculated ages, growth mark circumferences, estimated body masses using the averaged models, and the estimated growth rate between years of the five hadrosaurid tibiae analyzed in this study. Abbreviations: GM, growth mark, negative (-) values denote missing growth marks based on age retrocalculation; Circ, growth mark circumference; BM, estimated body mass (kg).

Retrocalculation revealed that the preserved growth mark record of each tibia was missing at least the first growth year (Table 2). Using the averaged tibia circumference growth models, the circumference of the growth mark corresponding with the first unrecorded annulus was estimated to range between 62 and 100 mm dependent on the individual. Although our data generally corroborated the results presented for Maiasaura (Woodward et al. Reference Woodward, Fowler, Farlow and Horner2015) and Hypacrosaurus (Cooper et al. Reference Cooper, Lee, Taper and Horner2008) on an individual model basis, the averaged model indicated one missing growth year for Maiasaura MOR 758 ‘T46’, and, unexpectedly, 10 years for Hypacrosaurus MOR 549. To test this large discrepancy, we excluded the first recorded growth mark from the growth record of each of the five tibiae and reran the retrocalculation. When comparing these results with those from the unaltered/complete growth records, retrocalculated ages were inconsistent between the two trials for most specimens (Table 1; see Supplementary Table 5 for complete data). Retrocalculated ages of Maiasaura and Hypacrosaurus increased by 9 and 5 years, respectively, whereas those for the two DPF tibiae did not change. The only altered model that could be considered as potentially recovering a consistent result was that of Probrachylophosaurus, because the retrocalculated age increased by ~1 year (0.61), compensating for the manually removed growth mark. These results demonstrated that at least the second growth mark of the early juvenile growth record was typically required to confidently estimate the accurate age of an individual hadrosaurid via growth modeling. In light of this, we attributed the discrepancy of Hypacrosaurus to its incomplete juvenile growth record, which affected model fitting analagous to that discussed by Myhrvold (Reference Myhrvold2013, Reference Myhrvold2015) for missing asymptotic data points and drove the juvenile portion of the curve to become artificially extended. Therefore, our data for Hypacrosaurus were presented in this paper for consistency, but were not considered when making general statements about hadrosaurid growth, and only contributed to discussions when appropriate comparisons could be made (i.e., asymptotic body size). Further mention of retrocalculated ages for the other four tibiae only considered the values obtained from the unaltered tibia circumference growth models.
In terms of body mass, the transition from growth acceleration to deceleration, or the growth inflection point (I), generally occurred between 2.36 and 2.79 years of age, with the exception of Maiasaura, which occurred at 1.40 years of age based on our reanalysis and had a maximum growth rate of 884 kg/yr between 1.65–2.65 years of age. Probrachylophosaurus had a similar maximum growth rate of 855 kg/yr between 3.64 and 4.64 years of age. TMP 1979.014.0020 had the largest maximum growth rate of our sample at 1227 kg/yr between 2 and 3 years of age rising to 1415 kg/yr between 3 and 4 years of age, whereas TMP 2016.012.0192 had the second largest maximum growth rate at 1095 kg/yr between 2.63 and 3.63 years of age. Using the unaltered averaged models (Table 1), the shape parameter m of the DPF growth curves resembled the shape of the von Bertalanffy model (m = 0.66) for TMP 2016.012.0192 and an intermediate between the von Bertalanffy and Gompertz models (m = 0.80) for TMP 1979.014.0020. The reanalyzed growth curves of Maiasaura and Probrachylophosaurus resembled an intermediate between the monomolecular and von Bertalanffy (m = 0.25–0.40) models. The tibiae from the DPF had the smallest and largest asymptotic body-mass estimates (A) (TMP 2016.012.0192, 3344 kg; TMP 1979.014.0020, 5338 kg), whereas Probrachylophosaurus was estimated at 4341 kg, and Maiasaura and Hypacrosaurus were estimated at ~4000 kg. Estimations for 95% asymptotic body mass ranged between 7 and 9 years of age, with both of the DPF specimens placing on the lower end of this range.
Discussion
Brinkman (Reference Brinkman, Eberth and Evans2014) originally identified two well-defined subadult size–frequency peaks and a broad cluster of adult individuals consisting of two poorly defined size–frequency peaks. The first subadult size–frequency peak was interpreted as consisting of hatchling individuals, or late nestlings following the categorization of Horner et al. (Reference Horner, de Ricqles and Padian2000), and concurred with our results, suggesting a high degree of hatchling/nestling mortality. The abundance of nestling individuals may have also been inflated as a result of collection bias favoring the ease of surface-collecting small material. The second subadult size–frequency peak of Brinkman (Reference Brinkman, Eberth and Evans2014) contains individuals of about 3.5 m in body length and is similar in size to a 1-year-old size class among other hadrosaurid dinosaurs (Varricchio and Horner Reference Varricchio and Horner1993; Horner et al. Reference Horner, de Ricqles and Padian2000), whereas the third broad size–frequency peak consisted of overlapping adult size/age classes as growth slowed into adulthood. Using these data, Brinkman (Reference Brinkman, Eberth and Evans2014) concluded that hadrosaurids from the DPF had a rapid growth rate, attaining adult size within 3 years of age. However, increasing the sample size revealed an additional size–frequency peak between the second and third size classes of Brinkman (Reference Brinkman, Eberth and Evans2014), indicating an initial overestimation of hadrosaurid growth rates by at least 1 year, and better recovered the spread and variation in the data. This additional size–frequency peak corresponds in size to the smaller of the two ill-defined size–frequency peaks from the broad cluster of Brinkman (Reference Brinkman, Eberth and Evans2014) and aligns with the subadult stage (~4.7 m body length) of Horner et al. (Reference Horner, de Ricqles and Padian2000) based on femur length.
The definition of what outlines an adult individual can impact the interpretation of these analyses (for an extensive discussion of this problem, see Hone et al. [Reference Hone, Farke and Wedel2016]). Hadrosaurid dinosaurs possessed a variety of species-specific cranial specializations, particularly the expansion and/or modification of the nasal and premaxilla to form a wide diversity of crests (e.g., Lull and Wright Reference Lull and Wright1942; Dodson Reference Dodson1975; Horner et al. Reference Horner, Weishampel, Forster, Weishampel, Dodson and Osmólska2004; Evans Reference Evans2010; Campione and Evans Reference Campione and Evans2011) as well as potential soft tissue structures (Bell et al. Reference Bell, Fanti, Currie and Arbour2014). These cranial specializations developed progressively through ontogeny and were most prominent in adults, providing an alternative to overall body size by means of visually identifying individuals that had mature ornaments (e.g., Dodson Reference Dodson1975; Evans Reference Evans2010; Campione and Evans Reference Campione and Evans2011; Farke et al. Reference Farke, Chok, Herrero, Scolieri and Werning2013; McGarrity et al. Reference McGarrity, Campione and Evans2013; Drysdale et al. Reference Drysdale, Therrien, Zelenitsky, Weishampel and Evans2019). Evans (Reference Evans2010) modified the categorization of ontogenetic stages from Horner et al. (Reference Horner, de Ricqles and Padian2000) to reflect the cranial series of hadrosaurid dinosaurs. Juveniles were referred to individuals with a skull length less than 50% of the maximum observed for individual taxa of lambeosaurines, subadults were defined as individuals possessing a skull length of 50–85%, and adults were >85% (Evans Reference Evans2010). When applying this method of ontogenetic categorization to our data, the proposed threshold of 85% based on cranial crest development placed beyond the additionally recovered size–frequency peak (Fig. 2), and therefore only individuals in the largest size class would be categorized as adult, which was in agreement with the subadult stage of Horner et al. (Reference Horner, de Ricqles and Padian2000) based on femur length. Therefore, the smaller sample size of Brinkman (Reference Brinkman, Eberth and Evans2014) led to subadult individuals (<85%) being included within the broad “adult” cluster that had not yet developed mature cranial crests.
Integrating the osteohistological growth mark data with the size–frequency distribution revealed a general correlation between size classes and ontogenetic growth stages (Fig. 8; also Supplementary Fig. 3). The sampled nestling individuals did not preserve any annual growth marks, confirming that the first size–frequency peak was indeed correlated with nestling individuals that were under 1 year of age (Brinkman Reference Brinkman, Eberth and Evans2014). However, the histology of juvenile specimens revealed a distinct growth mark (Fig. 4I–N) that fell between the first and second size–frequency peaks. This means that the intermediate size class in Brinkman (Reference Brinkman, Eberth and Evans2014), interpreted as yearlings, more likely represented individuals that were 2 years old, which is discussed further below. Subadults typically preserved two growth marks that corresponded with the second and third size classes, indicating that extensive expansion of the medullary cavity through ontogeny had already obliterated the osteohistological record of the first year of growth, including the first growth mark (Fig. 6). This was further evidenced when superimposing the circumference of the yearling growth mark onto sections of specimens from the third size–frequency peak, because the yearling circumference placed deep within the medullary cavity region and was therefore completely absent (Fig. 6). Subadult growth marks progressively transitioned from localized vascular fluctuations (annuli/zones) early in ontogeny to well-defined LAGs later in ontogeny, a condition that has also been documented in other hadrosaurids (Horner et al. Reference Horner, de Ricqles and Padian2000; Freedman Fowler and Horner Reference Freedman Fowler and Horner2015; Woodward et al. Reference Woodward, Fowler, Farlow and Horner2015; Wosik and Evans Reference Wosik and Evans2015; Wosik et al. Reference Wosik, Chiba and Evans2017a). By 4 years of age, histological age ranges overlapped by more than 50% with subsequent years, which directly correlated with our fourth size–frequency peak (Fig. 8). Although each resident hadrosaurid taxon from the DPF reached comparable adult body lengths of approximately 9 m (Lull and Wright Reference Lull and Wright1942; Ryan and Evans Reference Ryan, Evans, Currie and Koppelhus2005; Mallon et al. Reference Mallon, Evans, Ryan and Anderson2013) and could have exhibited a broadly similar growth strategy, this extensive overlap suggests that hadrosaurids from the DPF may have had a higher degree of intra- and/or interspecific variation in terms of asymptotic body size than previously assumed by Brinkman (Reference Brinkman, Eberth and Evans2014). However, it is also plausible that the very large isolated tibia (TMP 1979.014.0020) from our sample represents an atypical occurrence of an accelerated growth rate relative to other penecontemporaneous hadrosaurids.
Size–frequency distribution of tibial minimum diaphyseal circumference integrated with osteohistology. Estimated values were based on ordinary least squares regressions (Supplementary Table 3, Supplementary Fig. 1C,D).

In general, our combined size–frequency distribution of humeri, femora, and tibiae (Fig. 2B) revealed multiple relatively distinct size–frequency peaks along a positive parabolic distribution consistent with a long-term, time-averaged depositional origin (Olson Reference Olson1957). The ontogenetic osteohistological assessment provided a better resolution for age to maturity, revealing that the yearling age/size class was heavily underrepresented. Ultimately, Brinkman (Reference Brinkman, Eberth and Evans2014) was missing at least 2 years from his initial growth rate estimate of 3 years to maturity. Our data supplement the work of Brinkman (Reference Brinkman, Eberth and Evans2014) and suggest an alternative hypothesis of segregation between adult and juvenile hadrosaurids (e.g., Varricchio and Horner Reference Varricchio and Horner1993) could be further explored, which we discuss below (Supplementary Fig. 4).
Comparison with Other Hadrosaurid Taxa
Retrocalculation of growth marks revealed that the sampled tibiae from Maiasaura and the two DPF specimens were each missing 1 growth year, whereas Probrachylophosaurus was missing 2 years, before the first recorded growth mark. Estimates of the tibial circumference of the growth mark that would have corresponded with the first year of age ranged from 62 to 100 mm depending on the specimen/taxon. This aligned well with the recorded growth mark of 84.5 mm from TMP 1979.014.0308 and suggests that retrocalculation was accurately estimating the missing growth record. Growth modeling estimations indicated that both of the DPF specimens attained 95% asymptotic body mass by 7 years of age, whereas Maiasaura and Probrachylophosaurus did so by 9 years, based on our reanalysis. The maximum growth rate of TMP 2016.012.0192 was ~26% (~225 kg/yr) larger than Maiasaura and Probrachylophosaurus, even though the asymptotic body mass of TMP 2016.012.0192 was estimated to be ~650 kg and ~1000 kg less than Maiasaura and Probrachylophosaurus, respectively, based on results from our averaged body-mass growth models. This truncation of 2 years to attain 95% asymptotic body mass suggests that hadrosaurids from the DPF exhibited a slightly faster growth rate relative to hadrosaurids from the TMF, although these differences may prove to be insignificant and due to small sample size and individual variation. Although it is intriguing that data from both mature tibiae supported this general strategy among hadrosaurids from the DPF, a larger histological sample of long bones from adult individuals of known taxonomic identity is needed to further evaluate this potential difference in growth rate, as well as its consistency across the diverse paleocommunity that existed over the approximately 1.5 Myr (Currie Reference Currie, Currie and Koppelhus2005) represented by our sample.
Socioecology, Population Structure, and Seasonal Preservation Patterns
The shape of the size–frequency distribution recovered in our study reflects a typical attritional assemblage (Olson Reference Olson1957), with high hatchling mortality followed by a peak period of late juvenile (~2 years old) survivorship that culminated in an accumulation of older adults approaching senescence. If this size–frequency distribution is an accurate representation of the mortality rate of hadrosaurids from the DPF, then it appears they followed a Type II survivorship curve (Deevey Reference Deevey1947), similar to extant large-bodied herbivores and to that described in a composite sample composed of at least one catastrophic death assemblage of the penecontemporaneous hadrosaurine Maiasaura peeblesorum (Woodward et al. Reference Woodward, Fowler, Farlow and Horner2015). There is, however, a notable sampling gap in our DPF dataset—the yearling size class was heavily underrepresented across all sampled bone elements (Fig. 3; also Supplementary Fig. 4) and in the combined size–frequency distribution (Fig. 2B). Interestingly, these results paralleled those from the paleodemographic study of Maiasaura that also had a notable underrepresentation of size classes under 30 cm for tibia length (Woodward et al. Reference Woodward, Fowler, Farlow and Horner2015), which would have corresponded with the hatchling to yearling size range from the DPF if it were present.
The rarity of the yearling size class in both the DPF and TMF samples is intriguing and has been noted before from slightly different perspectives in other bonebed studies. For example, catastrophic mass deaths of Edmontosaurus (Christians Reference Christians1991, Reference Christians1992; Colson et al. Reference Colson, Colson and Nellermoe2004; Bell and Campione Reference Bell and Campione2014; Evans et al. Reference Evans, Eberth and Ryan2015; Wosik and Evans Reference Wosik and Evans2015; Ullmann et al. Reference Ullmann, Shaw, Nellermoe and Lacovara2017; Wosik et al. Reference Wosik, Chiba and Evans2017a), Saurolophus (Bell et al. Reference Bell, Evans, Eberth, Fanti and Ryan2018), and Shantungosaurus (Hone et al. Reference Hone, Sullivan, Zhao, Wang, Xu, Eberth and Evans2014) do not contain individuals smaller than what would be expected at 2 years of age (Fig. 9). In a hadrosaurid tracksite from Denali National Park, Alaska, footprints of putatively yearling-sized individuals are excessively rare (n = 4) relative to any other size class (n > 16), including nestlings (Fiorillo et al. Reference Fiorillo, Hasiotis and Kobayashi2014) (Fig. 9). Conversely, monodominant bonebeds consisting only of late juvenile to subadult-sized individuals have also been well documented from North America (Gangloff and Fiorillo Reference Gangloff and Fiorillo2010; Scherzer and Varricchio Reference Scherzer and Varricchio2010; Scott Reference Scott2015; Mori et al. Reference Mori, Druckenmiller and Erickson2016) and eastern Asia (Lauters et al. Reference Lauters, Bolotsky, van Itterbeeck and Godefroit2008) for both hadrosaurine and lambeosaurine hadrosaurids (Fig. 9).
Density comparison of long-bone and tracksite size distributions of hadrosaurid bonebeds. Size for each individual bonebed is scaled based on the percentage of the corresponding element in the largest known adult from the respective taxon. N refers to sample size. Data derived from personal measurements or published literature: 1Wosik et al. Reference Wosik, Chiba and Evans2017a; 2Evans et al. Reference Evans, Eberth and Ryan2015; 3Fiorillo et al. Reference Fiorillo, Hasiotis and Kobayashi2014; 4Woodward et al. Reference Woodward, Fowler, Farlow and Horner2015; 5Bell et al. Reference Bell, Evans, Eberth, Fanti and Ryan2018; 6Hone et al. Reference Hone, Sullivan, Zhao, Wang, Xu, Eberth and Evans2014; 7Varricchio and Horner Reference Varricchio and Horner1993; 8Scherzer and Varricchio Reference Scherzer and Varricchio2010; 9Lauters et al. Reference Lauters, Bolotsky, van Itterbeeck and Godefroit2008.

One explanation of this pattern is that the underrepresentation of yearlings is an artifact of taphonomic biases (e.g., hydraulic winnowing, predation) against the preservation of small-bodied skeletons in fluvial systems (Brown et al. Reference Brown, Campione and Evans2013a,Reference Brown, Evans, Campione, O'Brien and Eberthb,Reference Brown, Evans, Ryan and Russellc; Evans et al. Reference Evans, Schott, Larson, Brown and Ryan2013; Mallon and Evans Reference Mallon and Evans2014). Given that nestling and 2-year-old individuals are well-represented in the DPF and TMF, it is difficult to imagine a taphonomic process that would selectively act against the preservation of yearlings or an intermediate size class between hatchlings and subadults. In addition, our broad dataset provides a comprehensive representation of the current fossil record for more than a century of collecting from the DPF and embodies a time-averaged sample of ~1.5 Myr from a wide range of taphonomic modes (e.g., articulated, associated, disarticulated, isolated), making it improbable that our sample would be missing this specific size class. Second, it may be possible that yearlings experienced very low mortality rates and had abnormally high survivorship, as suggested for Maiasaura (Woodward et al. Reference Woodward, Fowler, Farlow and Horner2015), which, when combined with high juvenile growth rates, resulted in an underrepresentation of this size class in the DPF sample. However, the concept of survivorship is difficult to address for extinct populations, because the initial population has to be assumed (Voorhies Reference Voorhies1969), and modern analogues of hadrosaurids such as ungulates (Carrano et al. Reference Carrano, Janis and Sepkoski1999) may not be comparable because of their differentiating growth strategies and ecologies.
Alternatively, it may be possible that segregation between juveniles and adults occurred as a result of seasonal factors within the DPF paleoenvironment. Mass deaths of ceratopsians from the DPF have been consistently attributed to flood-induced drowning and the taphonomic, geologic, and paleoecological data have supported this interpretation (Currie and Dodson Reference Currie, Dodson, Reif and Westphal1984; Visser Reference Visser1986; Ryan et al. Reference Ryan, Russell, Eberth and Currie2001; Eberth and Getty Reference Eberth, Getty, Currie and Koppelhus2005; Eberth et al. Reference Eberth, Brinkman, Barkas, Ryan, Chinnery-Allgeier and Eberth2010). These seasonal monsoonal floods have also been linked to favorable fossil preservation, such that the attritional sample in the DPF may have a considerable seasonal overprint, as suggested by Eberth et al. (Reference Eberth, Brinkman, Barkas, Ryan, Chinnery-Allgeier and Eberth2010) and Brinkman (Reference Brinkman, Eberth and Evans2014) in their interpretations of the ceratopsid and hadrosaurid components, respectively, of this fossiliferous dinosaur sample. However, most researchers have been hesitant to hypothesize a specific scenario for the events that led to such a large-scale depositional pattern. Eberth and Getty (Reference Eberth, Getty, Currie and Koppelhus2005) suggested that the lowland environment would not have provided significant high ground for large vertebrates such as ceratopsians during severe, seasonal storm induced flooding. They proposed a seasonal preservation pattern related to monsoonal storms for the origin of ceratopsian bonebeds in Dinosaur Provincial Park, which was further supported by data from an integrated climate model and oxygen isotope study (Fricke et al. Reference Fricke, Foreman and Sewall2010). In terms of hadrosaurids, these storms may have driven the more susceptible juveniles away from the area, at least temporarily, until they attained a large enough body size around age 2 or 3 to withstand these environmental pressures.
Interestingly, Henderson (Reference Henderson, Eberth and Evans2014) investigated the resilience of adult ceratopsids and hadrosaurids to drowning during large flood events using a series of three-dimensional models of representatives from both dinosaur groups found in the DPF. He demonstrated that hadrosaurids could have easily held their heads clear of the high-water surface allowing them to breathe more easily than ceratopsians, which would have had their heads fully immersed when floating due to a more anterior center of gravity being weighed down by extensive cranial ornamentations. Adult hadrosaurids had a general height of 2.5 m (Mallon et al. Reference Mallon, Evans, Ryan and Anderson2013) and would have likely been able to stand above most high-water surfaces, whereas yearlings with a height of 0.5–1.0 m (Mallon et al. Reference Mallon, Evans, Ryan and Anderson2013), similar to adult ceratopsians from the DPF, would have been completely submerged if the water surface was above 1 m. If hadrosaurids were capable of floating or swimming to maintain their heads above the water surface, the smaller body mass of yearlings would have been more susceptible to being carried away by the massive flooding. In this scenario, we would expect hadrosaurids of the yearling size class to preserve in large numbers, but our data provide contrary evidence, suggesting that the segregation between yearlings and adults may have been a real biological signal.
Additional evidence that resident hadrosaurids from the DPF (those that had reached 2 years of age and about 50% adult body length) did not perish during the monsoonal storms can be drawn from our osteohistological data using patterns in the bone microstructure. Many animals undergo a significant increase in their growth rate at the start of the warm or wet season (i.e., spring and summer) (Köhler et al. Reference Köhler, Marin-Moratalla, Jordana and Aanes2012 and references therein), which can be directly observed in the osteohistological record via an increase in bone vascularity and deposition. This increase is best observed in juvenile and subadult individuals that have not yet reached skeletal maturity (Huttenlocker et al. Reference Huttenlocker, Woodward, Hall, Padian and Lamm2013). Conversely, change in vascular patterns from reticular to laminar is characteristic of slower growth in hadrosaurids (Horner et al. Reference Horner, de Ricqles and Padian2000; Huttenlocker et al. Reference Huttenlocker, Woodward, Hall, Padian and Lamm2013; Woodward et al. Reference Woodward, Fowler, Farlow and Horner2015). Under this scenario, if death occurred during the warm/wet season, the histological record of skeletally immature individuals should reflect rapid growth closer toward the periosteal surface. However, our entire osteohistological sample of hadrosaurid dinosaurs from the DPF (n = 35), with the exclusion of nestlings (which were undergoing consistent and rapid growth), exhibited some degree of laminar (circumferential) orientation of vasculature at the periosteal surface. Although our osteohistological sample size must be increased before robust conclusions can be made, the current data tentatively indicate that the sampled hadrosaurids would have perished closer to the cold/dry season when growth naturally slows down due to variable resource availability (e.g., Köhler et al. Reference Köhler, Marin-Moratalla, Jordana and Aanes2012), rather than during a period of monsoonal flooding. Therefore, the hadrosaurids that resided in the DPF systems may not seem to have been particularly vulnerable to the monsoonal flooding, supporting Henderson (Reference Henderson, Eberth and Evans2014).
This brings into question the paleoecological residence of yearling groups of hadrosaurids within the DPF biocenose. Our data suggest that hadrosaurid yearlings were not present here between hatching and about 2 years of age (~50% adult body length), at least during times of high preservation potential (e.g., monsoon season with associated flooding). These proposed major flooding events are consistent with isotopic evidence indicating spring/summer movements of moisture-laden air masses from the Western Interior Seaway, as well as climatological simulations of a strong monsoon (Fricke et al. Reference Fricke, Foreman and Sewall2010). Residence in more upland paleoenvironments may have been a possibility for at least a portion of the year, particularly during the flooding season. This may be supported by the large number of juvenile-dominated bonebeds and nesting sites found in more inland depositional settings in the Belly River and Judith River groups (e.g., Horner and Makela Reference Horner and Makela1979; Varricchio and Horner Reference Varricchio and Horner1993; Horner Reference Horner, Carpenter, Hirsch and Horner1994, Reference Horner1999; Horner and Currie Reference Horner, Currie, Carpenter, Hirsch and Horner1994; Scherzer and Varricchio Reference Scherzer and Varricchio2010), although the presence of hatchlings at Dinosaur Provincial Park demonstrates that some taxa nested in lowland areas (Tanke and Brett-Surman Reference Tanke, Brett-Surman, Tanke and Carpenter2001). Yearling-sized juveniles had approximate total body lengths of 2.5 m, which was about a quarter of the size of the average adult from the DPF (~9 m). This is similar in size with other penecontemporaneous small- to mid-sized ornithischian dinosaurs such as hypsilophodontids and pachycephalosaurids (Ryan and Evans Reference Ryan, Evans, Currie and Koppelhus2005) that, based on analyses of vertebrate microfossil assemblages, preferentially lived in terrestrial inland paleoenvironments (Brinkman Reference Brinkman1990; Baszio Reference Baszio1997; Brinkman et al. Reference Brinkman, Ryan and Eberth1998), although a taphonomic study of pachycephalosaurs suggested alluvial and coastal plain settings were similarly common (Mallon and Evans Reference Mallon and Evans2014).
Two general hypotheses have been proposed to explain intraspecific spatial segregation patterns in animals (e.g., Ruckstuhl Reference Ruckstuhl2007; Main Reference Main2008). The social segregation hypothesis focuses on intraspecific interactions. For example, size-based competition for resources has been well-documented in a wide variety of extant taxa (Fayet et al. Reference Fayet, Freeman, Shoki, Padget, Perrins and Guilford2015 and references therein) and proposed for herbivorous dinosaurs from the DPF in terms of feeding-height stratification (Mallon et al. Reference Mallon, Evans, Ryan and Anderson2013). Bramble et al. (Reference Bramble, LeBlanc, Lamoureux, Wosik and Currie2017) reported that hadrosaurids had very dynamic dentition, including anterior–posterior migration of tooth families within the dental batteries through ontogeny. The pattern of that migration, which was hypothesized to be caused by complex forces associated with food processing, changed with age, which might reflect, in part, ontogenetic changes in diet. Intriguingly, Chin et al. (Reference Chin, Feldmann and Tashman2017) analyzed presumably fossilized fecal matter, which was referred to hadrosaurids, and revealed a diet based on decaying logs and crustaceans, indicating that these dinosaurs may have had a more seasonally flexible diet than currently believed. Therefore, the data tentatively support ecological niche partitioning based on age (and size) might have been occurring in hadrosaurids.
Assortment based on phenotypic similarity as reflected in body size, sex, relatedness, and various physiological characters affecting metabolism and locomotory performance has been noted for a variety of extant gregarious species (e.g., Geist Reference Geist1968, Reference Geist1974, Reference Geist1977; Schaffer and Reed Reference Schaffer and Reed1972; Estes Reference Estes, Geist and Walther1974; Jarman Reference Jarman1974, Reference Jarman1983; Wiley Reference Wiley1974; Triesman Reference Triesman1975; Western Reference Western1975; Emlen and Oring Reference Emlen and Oring1977; Fitch and Henderson Reference Fitch and Henderson1977; Molnar Reference Molnar1977; Demment and van Soest Reference Demment and van Soest1985; Godsell Reference Godsell1991). The benefits of grouping with similar conspecifics include, for example, enhanced anti-predator behavior through dilution effects, enhanced vigilance, and increased foraging efficiency (Killen et al. Reference Killen, Marras, Nadler and Domenici2017 and references therein). It is possible that hadrosaurids from the DPF may have had a more complex population structure than previously assumed. Based on numerous occurrences of low-diversity bonebeds, several hadrosaurid species are thought to have formed large-scale gregarious associations for at least a portion of the year (Horner et al. Reference Horner, Weishampel, Forster, Weishampel, Dodson and Osmólska2004). Within that gregarious social framework, could yearlings have formed groups separate from the rest of the population? Forster (Reference Forster1990) noted two occurrences of homogenously sized groups of individuals from the Cloverly Formation of Montana belonging to the ornithopod Tenontosaurus. Individuals in these groups were 50–65% the size of adults (Forster Reference Forster1990), falling well within the expected values for late juveniles in this taxon. Varricchio and Horner (Reference Varricchio and Horner1993) reported a consistent lack of association between small (total body length <3 m) and large-sized individuals in six hadrosaurid assemblages from the TMF. If not due to rapid growth rates, they suggested that juveniles spent a part of their developmental period associating with similarly sized individuals (Varricchio and Horner Reference Varricchio and Horner1993; Varricchio Reference Varricchio2011). Finally, although they did not discuss possible causes, Fiorillo and Gangloff (Reference Fiorillo and Gangloff2001) reported that, of the several thousand specimens recovered from the Liscomb Bonebed from the North Slope of Alaska, the vast majority were referred to Edmontosaurus sp. and matched the size profile of the yearling size class from the DPF.
The second explanation for intraspecific spatial segregation is based on habitat selection. In this scenario sex- or age-related differences in predation pressure and/or nutritional requirements drive changes in habitat selection. Although there is very little research on age-related habitat segregation, some studies suggest that juveniles might inhabit environments that are more dangerous and/or prone to fluctuation than conspecific adults, based primarily on foraging needs. For example, Ficetola et al. (Reference Ficetola, Pennati and Manenti2013) reported that juvenile cave salamanders, Hydromantes strinatii, resided near the cave entrance, while adults preferred the deeper interiors. The entrance habitat represented a trade-off between increased foraging efficiency (higher concentration of invertebrates), suboptimal environmental variables (warmer, higher humidity), and increased predation pressure; increased foraging requirements of juveniles was thought to offset the dangers of inhabiting such a risky environment. Based on our discussion to this point, we propose habitat selection might also be based on age-related differences in susceptibility to seasonal changes in the environment, notably monsoonal flooding. In the case of hadrosaurids in the DPF, the small body size of juveniles rendered them more susceptible to drowning in large-scale coastal flooding events, potentially pressuring them to move inland and/or farther from the proximity of the flooding until they were large enough (~50% adult body size) to withstand this reoccurring environmental challenge. The benefit to yearlings of moving inland is obvious. However, the question that needs to be addressed to examine our suggestion further is what, if any, were the costs of such a change in habitat preference, particularly in terms of food quality and predation pressure?
Taken together, both social and habitat-based factors could have driven the juveniles from the DPF inland and resulted in the formation of juvenile-only groups (Forster Reference Forster1990; Lauters et al. Reference Lauters, Bolotsky, van Itterbeeck and Godefroit2008; Gangloff and Fiorillo Reference Gangloff and Fiorillo2010; Scherzer and Varricchio Reference Scherzer and Varricchio2010; Scott Reference Scott2015; Mori et al. Reference Mori, Druckenmiller and Erickson2016) until they were about 2 years of age (~50% adult body size) and thus capable of joining an adult-dominated herd, or population, on a more permanent basis. Curiously, this is within the size and age ranges that correspond with the inflection point of the growth curves, which marks the transition from growth acceleration to deceleration, and has been of physiological importance, because it generally coincides with the onset of reproductive maturity in ecologically equivalent extant vertebrates (e.g., ungulates) (e.g., Brody Reference Brody1964; Reiss Reference Reiss1989; Cooper et al. Reference Cooper, Lee, Taper and Horner2008; Lee and Werning Reference Lee and Werning2008). Therefore, we postulate that the reintegration of juveniles into the population could have also coincided with the onset of sexual maturity. Further studies are needed to evaluate ecological modes of segregation and niche partitioning, ontogenetic feeding strategies, and the potentially differential distribution of cohorts between environments (e.g., inland vs. coastal).
Conclusion
The newly constructed size–frequency distribution of the DPF hadrosaurid sample revealed four relatively distinct size–frequency peaks that formed a positive parabolic distribution consistent with patterns exhibited by attritional assemblages. When integrated with the osteohistological growth mark data, the size–frequency peaks progressively aligned with growth marks and revealed that the yearling size class was heavily underrepresented in the size–frequency distribution. If not due to preservation, this may suggest that hadrosaurids from the DPF had high survivorship until 2 years of age if they managed to survive the initial high nestling mortality or that juveniles were segregated from the main population or adult-dominated herd and largely not present in the DPF region during this ontogenetic interval. An osteohistological growth-curve analysis revealed asymptotic body size of hadrosaurids from the DPF was attained in approximately 7 years, consistent with the minimum of 5 years determined from the DPF size–frequency distributions, which are faster by 2 years than taxa from the TMF of Montana. This study suggests that size–frequency distributions of attritional samples, particularly those based on small sample sizes, underestimate age and overestimate growth rate. However, when paired with osteohistological data to provide more accurate and precise interpretations of how size relates to age in the sample, size–frequency distributions can provide unexpected and important insights into population paleoecology.
Acknowledgments
Access to specimens was facilitated by C. Mehling and M. Norell (AMNH); M. Currie, J. Mallon, and K. Shepard (CMN); B. Iwama and K. Seymour (ROM); R. Sanchez, D. Brinkman, T. Courtney, G. Housego, and B. Strilisky (TMP); and M. Burns (UALVP). Funding for this project was generously provided by the Dinosaur Research Institute Student Project Grant (to MW), Dinosaur Research Institute CSVP Student Travel Grant (to MW), the Royal Tyrrell Museum Cooperating Society Student Research Program (to MW), and a Natural Sciences and Engineering Research Council of Canada Discovery Grant RGPIN 355845 (to DCE). Fieldwork was assisted by C. Brown, D. Tanke, and TMP staff and volunteers. Discussions with D. B. Brinkman, C. Brown, A. Chinsamy, T. Cullen, D. Eberth, M. LaFlamme, D. McLennan, R. Reisz, A. Reynolds, M. Ryan, M. Silcox, D. Tanke, C. Woodruff, and H. Woodward greatly enhanced the manuscript. We thank N Fröbisch, D. Eberth, and an anonymous reviewer whose suggestions helped improve and clarify this manuscript. We would especially like to thank D. B. Brinkman for his previous work on dinosaurian paleoecology in the DPF system, which laid the foundation for MW's PhD dissertation, including this paper.


 Open access