

British expansion from the seventeenth to the nineteenth centuries established a global empire and set the stage for the emergence of modern economic growth. In those centuries, Britain’s capacity to wage and win wars relied on the expansion of the fiscal capacity of its state (O’Brien Reference O’Brien1988). Where did Britain get the revenue required to pay for its ships and men, and to repay the debts it incurred in fighting its wars? Historical scholarship on the development of the British fiscal-military state—most notably Brewer’s (1989) Sinews of Power—has emphasized the importance of increased indirect tax revenue, in particular excise revenue. The excise tax has been treated by many historians as a tax on goods produced (and consumed) domestically. The importance of excise tax revenue suggests a central role for revenue generated from domestic economic activity, as opposed to revenue generated from overseas trade passing through customs. The emphasis on domestic taxation also suggests a primary role for an excise bureaucracy described by Brewer (Reference Brewer1989, p. 82) as “a body of men widely regarded as the most proficient revenue officers in government.” These officers traveled the British counties, in contrast to customs officers concentrated in ports. This account rhymes well with a broader literature that considers domestic institutions to be the primary drivers of Britain’s development (e.g., North and Weingast Reference North and Weingast1989; Acemoglu, Johnson, and Robinson Reference Acemoglu, Johnson and Robinson2005; Acemoglu and Robinson Reference Acemoglu and Robinson2012). This perspective continues to influence the literature on the political economy of historical development (e.g., Besley and Persson 2011; Acemoglu and Robinson Reference Acemoglu and Robinson2019; Koyama and Rubin Reference Koyama and Rubin2022; Angelucci, Meraglia, and Voigtländer Reference Angelucci, Meraglia and Voigtländer2022).
In this paper, we challenge the conventional wisdom emphasizing domestic forces and institutions. Although often overlooked, the excise was a tax on goods produced and consumed domestically, and also on goods traded overseas (henceforth, “traded” goods). O’Brien (Reference O’Brien1988) observed that excise revenue included taxes collected on traded goods, but incorrectly believed that this began only around 1790.Footnote 1 In fact, from its inception in the seventeenth century, the excise tax was applied to both domestic and traded goods. Its collection occurred not only in the interior of Britain, but also in its ports—especially the port of London.Footnote 2 Evaluating the role of traded goods in Britain’s increased tax revenues thus requires richer data than those that have been used in the literature. In particular, one needs time series that are more disaggregated than the coarse categories (e.g., “Customs,” “Excise,” “Stamps,” …) reported in the primary source relied on by the reference work on Britain’s fiscal development (Mitchell Reference Mitchell1988; Brewer Reference Brewer1989).Footnote 3
We construct such disaggregated data from sources in the National Archives (TNA) collection “Records of the Board of Customs, Excise and Customs and Excise, and HM Revenue and Customs” (these are referenced under CUST 145).Footnote 4 These sources allow us to calculate yearly excise revenue raised by commodity.Footnote 5 Thus, we can decompose the excise revenue according to whether the good being taxed is produced and consumed domestically (henceforth “domestic”), or instead produced abroad but consumed domestically, or produced domestically but consumed abroad (i.e., goods imported or exported or “traded”). We also construct new disaggregated customs revenue series that allow us to identify customs taxes on traded goods as well as customs taxes on domestically-produced coal. To construct the customs revenue series, we relied primarily on the National Archives collection “HM Treasury – Accounts and Ledgers” as well as the collection “Board of Customs: Statistics: Revenue.”Footnote 6
That domestically-produced coal was taxed at customs is further evidence that the distinction between customs and excise reflected the management of the tax collection process, not the origin of the goods being taxed. This is clear when directly consulting the primary sources. These sources, however, present several challenges that perhaps contributed to historians’ longstanding reliance on secondary, more aggregate sources. The archival sources often present revenues at different levels of aggregation and often have ambiguous labels. For example, CUST 145/22 includes a category labeled “Excise,” which is evidently not all of the traditional excise (i.e., that reported by Brewer (Reference Brewer1989)), because it also lists categories like “soap” and “candles” separately, which are part of the traditional excise. The “Excise” subcategory in CUST 145/22 is disaggregated in CUST 145/12. Yet, it is clear that CUST 145/12 alone is insufficient because it leaves out categories like soap and candles that are reported in CUST 145/22. Thus, constructing a comprehensive excise series disaggregated by product requires careful cross-referencing of categories across primary sources.
In some cases, categories may be too broad to allow unambiguous assignment into domestic or traded categories (e.g., salt and vinegar). We thus construct estimates of disaggregated excise revenue reflecting conservative assumptions regarding the revenue raised from traded goods. For example, we compute revenues collected on salt as domestic, though some salt was certainly imported. Nor do we make an effort to decompose the tax revenue on domestically-produced goods with a traded component to their value added. For example, taxes on domestically processed textiles are treated as domestic taxation even when the main input (e.g., a less processed textile) was produced abroad and represented a significant share of the value added.Footnote 7
Using our newly constructed data, we re-evaluate the contribution of taxes on overseas trade to Britain’s indirect tax revenue.Footnote 8 Even under our conservative assumptions, these data overturn the conventional wisdom regarding the importance of taxes on overseas trade to Britain’s fiscal development. The data in Mitchell (Reference Mitchell1988) and Brewer (Reference Brewer1989) suggest that in the early eighteenth century, taxes on traded goods represented a minority—around 40 percent—of total indirect taxes (i.e., taxes on both traded and domestically produced goods). Over the eighteenth century and into the early nineteenth century, total revenues greatly expanded, and Mitchell (Reference Mitchell1988) and Brewer (Reference Brewer1989) suggest that the tax share of traded goods fell in this period to around 30 percent of total indirect taxes. In contrast, our series show that the tax share of traded goods grew from around 40 percent of indirect taxation early in the eighteenth century to more than 50 percent around 1800. During the first quarter of the nineteenth century, traded goods provided a majority of the revenue from taxed goods. This share further increases if we account for revenues collected from traded goods and then used to subsidize exports and promote other national objectives (i.e., revenues spent on “bounties”).Footnote 9 The increase in revenues from traded goods from 1689 to the early nineteenth century accounts for more than half of the overall increase in indirect tax revenues. Tax revenues from overseas trade thus represented a substantial component of the fiscal expansion that funded Britain’s imperial dominance.
Our analysis makes several contributions to the literature on British and global economic history. Most directly, we contribute new data on British revenues over time that improve upon the standard references (Mitchell Reference Mitchell1988; Brewer Reference Brewer1989). We join Hoppit (Reference Hoppit2017) in arguing against the traditional treatment of excise as taxation of domestic production and provide improved, disaggregated data on both excise revenue and customs revenue from 1689 to 1823. In so doing, we contribute fundamental new evidence to the literature analyzing Britain’s fiscal development in the seventeenth–nineteenth centuries (e.g., O’Brien Reference O’Brien2011; Murphy Reference Murphy2013; Cox Reference Cox2016; Dickson Reference Dickson2017).
Our disaggregation of the excise allows us to connect Britain’s rising fiscal capacity in the eighteenth and nineteenth centuries to specific goods traded overseas. We show that the taxation of products with inelastic demand—so-called “drug foods” (Mintz Reference Mintz1985)—provided a large share of Britain’s rising tax revenue. Trade in many of these products, for example, tea, tobacco, coffee, spices, and sugar, was supported by the application of Britain’s coercive power—whether directed toward the colonized or toward competing powers. Taxation of these “imperial” goods accounted for over 50 percent of revenues collected from traded goods as of 1818.Footnote 10 Thus, we add to a literature that emphasizes the importance of trade and colonies to the development of the modern Atlantic economies (e.g., O’Brien Reference O’Brien1982; Pomeranz Reference Pomeranz2000; Acemoglu, Johnson, and Robinson Reference Acemoglu, Johnson and Robinson2005; Findlay and O’Rourke Reference Findlay and O’Rourke2007; Palma Reference Palma2016; Hersh and Voth Reference Hersh and Voth2022).
More broadly, by placing international trade at the center of the fiscal changes experienced in Britain in the seventeenth–nineteenth centuries, our descriptive evidence has important implications for our understanding of both the domestic and international dimensions of British state development. Domestically, our findings suggest an important role for tax collection by a traditional bureaucracy based in ports, with a particular concentration in London (this reinforces the argument made by Reference Hoppit, Hoppit, Needham and LeonardHoppit (2019)). This is distinct from the narrative in Brewer (Reference Brewer1989), which emphasizes revenue collection by excisemen across Britain’s interior at myriad points of consumption. Internationally, we show that overseas trade contributed substantial means to building the fiscal capacity of Britain during an era in which war among European nations in the sixteenth to nineteenth centuries shaped the rise of modern states (Tilly et al. Reference Tilly1975; Bonney Reference Bonney1999; Dincecco Reference Dincecco2011). Wars matter because they induced investments in fiscal capacity that could then be used to fund a growing state that supported the economy (Besley and Persson Reference Besley and Persson2009). As war became more costly, it was the states able to raise more revenue that prevailed (Gennaioli and Voth Reference Gennaioli and Voth2015; Cantoni, Mohr, and Weigand Reference Cantoni, Mohr and Weigand2022). Identifying the sources of Britain’s fiscal strength is pivotal to understanding the process of the formation of the state that was victorious in this geopolitical competition.
Because much of the trade that shored up Britain’s fiscal capacity was conducted within the institutional context of the British Empire, our work relates to the literature that emphasizes the role of empire and coercion in the historical development of capitalism (e.g., Williams Reference Williams2021; Findlay and O’Rourke Reference Findlay and O’Rourke2007; Beckert Reference Beckert2014; Levy Reference Levy2021; Heblich, Redding, and Voth Reference Heblich, Redding and Voth2022).Footnote 11 These authors consider that a strong fiscal-military state helped Britain dominate trade. Findlay and O’Rourke (Reference Findlay and O’Rourke2007) also propose that trade fed back into the fiscal-military state through the taxable wealth it created. This, they argue, established a mutually-reinforcing relationship between economic activity and the development of the coercive power of the state.Footnote 12 In the case of Britain, the possibility of such a mutually-reinforcing relationship was negated by the conventional wisdom seeing domestic goods as the main contributors to Britain’s fiscal might. Our finding that international trade provided a substantial share of indirect taxes not only counters the conventional wisdom on fiscal matters. Our finding also increases the plausibility of explanations in which empire was a driver of Britain’s military and economic success.Footnote 13
In the second section, we describe the role of excise and customs taxes in funding the British state, particularly in times of war. In the third section, we discuss the existing historical literature on the excise tax. In the fourth section, we describe the historical data sources we rely on to construct new, disaggregated excise and customs revenue statistics. In the fifth section, we present our newly constructed revenue time series. We conclude in the sixth section.
BACKGROUND: WAR AND TAXES IN SEVENTEENTH–NINETEENTH-CENTURY BRITAIN
Britain’s fiscal capacity, like that of many early-modern European states, was developed in a context of recurrent warfare. In the seventeenth to nineteenth centuries, Britain’s wars were increasingly conducted overseas, facilitating Britain’s mercantilist economic policy.Footnote 14
Brecke (Reference Brecke1999) provides comprehensive information on conflicts since 1400. From this data, we constructed time series of Britain’s military activity, as well as that of other Atlantic trading powers: France, the Netherlands, Portugal, and Spain. We also identify which conflicts involve fighting away from the European continent. From the eighteenth century on, Britain became the most belligerent power and the one most frequently involved in overseas wars. In the 1600–1850 period, Britain fought 273 wars compared to 229 for France, the second most belligerent European power during the period. Moreover, England is the nation that shifted most aggressively toward fighting wars overseas. During the period 1600–1700, England fought 39 percent of its wars overseas, but this percentage increased to 65 in the period 1700–1850.
Britain’s empire was built on winning these wars, that were so frequently overseas, with its dominant navy. Glete (Reference Glete1993) provides detailed information on the capacity of Britain’s navy and the navies of its European rivals. We transcribed and harmonized the data on navy strengths in Glete (Reference Glete1993) and found that during the period 1600–1800, when Britain developed its fiscal capacity, fought wars, and expanded its empire, its naval strength overtook that of all of its European rivals. First, it overtook the Dutch in the second half of the seventeenth century, and then the French in the early eighteenth century.
Such naval superiority was expensive. For example, Findlay and O’Rourke (Reference Findlay and O’Rourke2007, p. 256, citing Baugh (Reference Baugh2004, p. 238)), note that “[A] 74-gun ship costing £50,000 to build in 1780 when the largest factory in England cost only a tenth of that amount.” It is thus unsurprising that each major war Britain fought was associated with an increase in its stock of government debt (see Online Appendix Figure B.2). This debt was backed by the promise of government tax revenue, and new taxes were regularly issued in a manner explicitly linked to the demands of war. For example, in 1689, Parliament passed “An Act for granting to Their Majesties a Subsidie of Tonnage and Poundage and other Sums of Money payable upon Merchandizes Exported and Imported” (2 W&M, sess. 1, cap. 4). Parliament passed this bill “for the better enabling your Majestyes to prosecute the present Warr against the French King and for the reduceing of Ireland.”
THE EXCISE: EXISTING SCHOLARSHIP AND AN ASSESSMENT OF HISTORICAL FISCAL MOTIVES
The conventional wisdom on the excise tax is built on three pillars, all of which are well summarized by Brewer (Reference Brewer1989).Footnote 15 First, its domestic scope: Brewer (Reference Brewer1989, p. 56) writes that, “The excise was an indirect commodity tax on domestically produced goods, levied either at their point of production or distribution.” Second, compared to the customs tax, its great and increasing relative importance: Brewer (Reference Brewer1989, p. 80) presents data showing approximately equal levels of excise and customs revenues collected around 1700, and excise revenue levels that are more than double the customs revenues in the late 1700s. Third, its contribution to state development: Brewer (Reference Brewer1989, p. 56) writes that, “Excises became the largest category of taxes, excisemen the biggest body of officials, and the Excise Office a byword for administrative efficiency…. [T]he English Excise more closely approximated to Max Weber’s idea of bureaucracy than any other government agency in eighteenth-century Europe.”Footnote 16 There is some truth in this conventional wisdom: excise revenues did grow throughout the eighteenth century, and the excise administration was an early example of an efficient government bureaucracy.
However, the conventional wisdom is incorrect in viewing the excise tax or the growth in excise revenues as entirely driven by domestic forces. This is evident, qualitatively, in the first excise bill passed by Parliament in 1643, which imposed a tax on, “[A]ll and every the Merchants and Importers of the said Forraign Commodities in the said Schedule mentioned.”Footnote 17 In a history of the excise, the Boards of Customs and Excise describe how “At the Accession of James II [in 1685], the Temporary Excises were renewed for his life, and increased by additional duties on Wine, Vinegar, Tobacco, and Sugar.” Needless to say, Britain did not produce tobacco or sugar domestically in 1685.Footnote 18
To move beyond this initial assessment, we more systematically examine the military motives behind tax bills, as well as the importance of taxes on trade during the later Stuart reigns (those of William and Mary and Queen Anne), when the excise and customs regimes of the eighteenth century were established.Footnote 19 We read and classify every tax bill in 1689–1714 according to its mention of war and/or trade. Roughly 40 percent of bills across both rulers were “Public,” and could involve matters of taxation.Footnote 20 We find that around 80 percent of public tax bills mention military, colonial, or defense (i.e., “war-related”) objectives in their text; during the rule of William and Mary, 36 percent of tax bills mentioned both war and taxes on traded goods, and this simultaneous mention rises to 50 percent during Queen Anne’s reign (see Table 1).Footnote 21
CLASSIFICATION OF TAX BILLS IN 1689–1714: FINANCING WARS AND TAXING TRADE
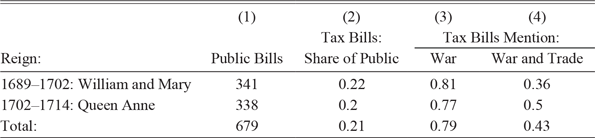
Notes: This table reports the classification of bills passed during the reigns of William and Mary and Queen Anne. The coding is based on the authors’ reading of the bills. Column (1) reports the count of public bills (excluding “private” bills, with circumscribed effects). Column (2) reports the share of public bills that are tax bills, Column (3) reports the share of tax bills that mention military aims, and Column (4) reports the share of tax bills that mention military aims and also include traded goods. Bills from the reign of William III are included in row 1 with William and Mary. See the third section for a discussion of the coding.
Source: Authors’ calculations.
One may still worry that even if many excise bills mentioned trade, traded goods could still have been marginal to the excise. Hoppit (Reference Hoppit2017) has collected evidence suggesting not only that excise taxes were collected on traded goods as Britain’s fiscal capacity expanded, but also that the role of traded goods was substantial and growing. Hoppit (Reference Hoppit2017, p. 293) presents data showing that in 1741, of the excise revenue collected in London (one-third of all British excise), imported tea and liquors accounted for nearly 40 percent. In 1796, imported tea, spirits, wine, tobacco, and snuff accounted for nearly two-thirds of London’s excise revenue. These data points, as well as our analysis of excise legislation, suggest the need to re-examine the historical evidence that sustains the conventional wisdom. As noted previously, such a re-examination requires disaggregated data from archival sources that have not yet been systematically used.
CONSTRUCTING NEW SERIES OF EXCISE AND CUSTOMS REVENUES
Excise Revenues
To construct our disaggregated excise tax dataset, we begin with CUST 145/22. This source is sufficient to construct, by individual good, yearly revenue series from 1788 onward, allowing us to classify revenues as originating in trade or from domestic production (for complete replication materials and more details, see Reference Dal Bó, Karolina Hutkova, Yuchtman and BetzDal Bó et al. (2024)). Prior to 1788, CUST 145/22 is not fully disaggregated. It presents good-level excise and inland revenues for many goods that fall under the traditional heading of “excise.” These include glass, soap, paper, tea, and chocolate, among others (see Figure 1 for an image of CUST 145/22). Unfortunately, CUST 145/22 also includes a category labeled “Excise,” which requires further disaggregation. It is a subcategory of what is traditionally regarded as excise, and it aggregates revenues from different types of alcohol.
EXCISE REVENUES BY TAXED GOOD IN 1756, SAMPLE OF CUST 145/22
Notes: This figure reproduces a sample of the archival records organized under CUST 145/22. These records report excise revenues by taxed good from 1788 forward. For earlier years (e.g., 1756 in this figure), the category of narrow excise (cf. row 1 of this figure) needs to be further disaggregated.
Source: Authors’ photo from the U.K. National Archive.

To disaggregate the “Excise” category from CUST 145/22, we turn to CUST 145/8 and CUST 145/12 for the years up to 1787 (see Figure 2 for an image of CUST 145/12).Footnote 22 These sources include revenues information on various categories of alcohol, which add up to the “Excise” category from CUST 145/22. However, they do not include the other disaggregated revenues that are reported in CUST 145/22 (glass, soap, paper, tea, etc.), meaning that we need to combine information from CUST 145/22, CUST 145/8, and CUST 145/12.
EXCISE REVENUES BY GOVERNMENT ACT IN 1750–55, SAMPLE OF CUST 145/12
Notes: This figure reproduces a sample of the archival records organized under CUST 145/12. These records report excise revenues by government act.
Source: Authors’ photo from the U.K. National Archive.

The next step is to convert the revenues information on various types of alcohol from CUST 145/8 and CUST 145/12 into revenue data by good at a disaggregated enough level to allow assignment to traded or domestic categories. In some cases, for example, “British Spirits,” this can be done directly from the source. However, most of the revenue reported in CUST 145/8 and CUST 145/12 is organized not according to good, but according to the acts under which taxes were collected (e.g., “IX Continued quarto Annae”) or allocated (e.g., “Hereditary and Temporary Excise”).
To convert act-level revenues into revenues by good, we first identify which goods are taxed under a given act. Then, we rely on data on taxed quantities by good and year, as well as tax rates by good and year, to calculate the revenues by good and year that fall under a particular act.Footnote 23 When rates are ambiguous (e.g., imported brandy might be taxed under the French brandy rate or as generic foreign brandy), we assign the lower rate to calculate the revenue from traded goods conservatively.
A final obstacle in identifying revenue from traded versus domestic goods is the temporary revenue category, “P Cent” (a percentage tax temporarily levied on selected commodities). This category of excise appeared in the CUST 145/22 series between 1779 and 1787 and included both traded and domestic goods. To disaggregate the category, we use CUST 145/20, which shows the yearly contributions of each of the goods charged “P Cent” duties (e.g., tea and foreign spirits, among others).
Customs Revenues
The vast majority of customs revenues were collected from traded goods, as one would expect. The primary domestic good that was taxed under customs was coal. In addition, other domestically produced goods were taxed under customs as “carried coastways goods.”Footnote 24 We assign these revenues to domestic production, along with taxes levied on coal.Footnote 25 In addition, from 1786–1806, a tax on windows (under the Commutation Act of 1784) was included in the customs revenues, and we assign these revenues to domestic production as well.Footnote 26
Disaggregated customs revenues data come from multiple historical sources. To disaggregate total customs revenues into revenues from traded goods and revenues from domestically produced goods, we mainly rely on T 35/55, CUST 37/1, T 38/357, and CUST 37/50. These series end in 1806. From 1807 onward, we supplement these sources with detailed tables on revenues by good or by act from the Parliamentary Papers.
Methodological Choices
We first identified goods that were undoubtedly traded internationally and taxed under the excise. Some of these goods, like foreign spirits, are labeled as such. Others are not labeled as foreign, but were certainly produced outside Britain, like tea, coffee, cocoa nuts, tobacco, and pepper. We also treat wine as traded—in contrast with “low wine,” which was recorded separately, and which may have included some domestic production.
This makes for an extremely conservative calculation of revenues from traded goods—a lower bound. When it is possible that a positive share of a good may have been domestic, we assign it to the domestic category. For example, we do not include in our estimated revenues from trade those revenues collected on hides or salt, though some hides and salt were certainly imported. In addition, taxes on domestically processed textiles are treated as domestic taxation even when the raw input (e.g., a less processed textile, or raw materials like silk or cotton) was produced abroad and represents a significant share of the value added.
We follow the approach of Mitchell (Reference Mitchell1988) and Brewer (Reference Brewer1989) in that we report revenues net of: (i) the costs of running the respective tax administrations (i.e., “management costs”); (ii) refunds on import duties paid to re-exporters (called “drawbacks”); and (iii) revenues used directly to subsidize domestic producers’ exports or to pay for other national objectives (called “bounties”) that never reached the Exchequer. To be precise, we collect information on the “Payments into Exchequer” for both customs and excise.Footnote 27 As our goal is to assess the contribution of taxes on traded goods to Britain’s fiscal strength, it is natural to consider revenues net of tax administration costs and net of refunds paid to re-exporters (re-exported imports may not have arrived in the first place without the refund of the import duties).Footnote 28 However, netting out bounty payments, while standard practice, is more questionable: bounty payments may not have reached the Exchequer, but they supported the state’s strategic objectives, nonetheless. For example, bounty revenues were collected by customs officers from traded goods and used to pay domestic corn producers and to support the civil government of Scotland (to give two prominent examples). There is thus a good argument to include these revenues in the contribution of traded goods to revenue. Information on these bounty payments was not available in the primary sources consulted by Mitchell (Reference Mitchell1988) and Brewer (Reference Brewer1989), but we are able to identify this category of revenue. We thus construct separate series of revenues from traded and domestic goods that include the bounty revenues in addition to the “Payments into Exchequer.” In order to keep our exposition as close as possible to that in the received literature, in the main text we focus on revenue series corresponding to “Payments into Exchequer” and include bounties in alternative series reported in the Appendix.Footnote 29
EMPIRICAL PATTERNS
New vs. Old Series: Comparison in the Aaggregate
We begin by comparing our total excise revenue and customs revenue series for the years 1689–1823 with those in Mitchell (Reference Mitchell1988), the standard reference (which is based on the same historical source as Brewer (Reference Brewer1989)). In Figure 3, Panel A, one can see that our construction of total excise revenue closely matches the aggregate excise data reported previously by Mitchell (Reference Mitchell1988).Footnote 30 Including the bounties in our excise data series has a minimal effect (see Online Appendix Figure ). In Figure 3, Panel B, one can see that our construction of total customs revenue again closely matches aggregate data that have previously been collected (Mitchell Reference Mitchell1988). Adding the bounties to our customs data series has a more noticeable effect, but again the broad patterns of total revenue match those in Mitchell (Reference Mitchell1988). It is worth emphasizing that our data come from a different set of far more disaggregated historical sources; it is reassuring that these data yield aggregate patterns that match the established historical data sources.Footnote 31
COMPARISON OF AGGREGATE EXCISE AND CUSTOMS REVENUES WITH MITCHELL (1988)
Notes: This figure compares the aggregate patterns of excise and customs revenues of the British government (in £1,000,000) as calculated by the authors (black, solid lines) with those reported in Mitchell (Reference Mitchell1988) (as grey, dashed lines). Panel A reports the excise revenues for 1689–1823, and Panel B reports the customs revenues for 1689–1818. Gaps in the lines indicate years with missing data. See the fourth section for a description of the data and methodology. See Online Appendix Figure for a version of this figure, which includes revenues spent to finance bounties.
Sources: Authors’ calculations. Refer to the fourth section of the main text for details.

New vs. Old Series: Comparison of Disaggregated Data
We next decompose aggregate revenues into revenues collected from traded goods and revenues collected from domestic goods. Let RevenueTrade t denote the tax revenue raised on internationally traded goods, RevenueDomestic t denote the tax revenue raised on domestic goods, Customs t the tax revenue collected by customs, and Excise t the tax revenue collected as excise, all during year t. The approach in Brewer (Reference Brewer1989) (using the same data as Mitchell (Reference Mitchell1988)) is to assume the following two equalities hold:
 $$RevenueTrad{e_t} = {\rm{ }}Custom{s_t}$$
 $$RevenueDomesti{c_t} = {\rm{ }}Excis{e_t}.$$
Then, following Brewer (Reference Brewer1989), the trade-related share of total indirect tax revenue (i.e., the sum of taxes from traded and domestic goods) would be calculated as:
 $$ShareTrad{e_t} = {\rm{ }}Custom{s_t}/(Custom{s_t} + {\rm{ }}Excis{e_t}).$$
But as we have argued, it is incorrect to equate taxes on traded goods to taxes generated by customs, and taxes on domestic goods to the excise. It is necessary to define CustomsCoal t to denote tax revenue collected by customs on coal (a domestic product), ExciseDomestic t to denote excise taxes raised on domestic goods, and ExciseTrade t to denote excise taxes on traded goods. Then, using our disaggregated excise and customs data, we can calculate:
 $$RevenueTrad{e_t} = {\rm{ }}Custom{s_t} - {\rm{ }}CustomsCoa{l_t} + {\rm{ }}ExciseTrad{e_t}$$
 $$RevenueDomesti{c_t} = {\rm{ }}ExciseDomesti{c_t} + {\rm{ }}CustomsCoa{l_t}.$$
As a result, the trade-related share of total revenue is:
 $$ShareTrad{e_t} = RevenueTrad{e_t}/\left( {RevenueTrad{e_t} + {\rm{ }}RevenueDomesti{c_t}} \right).$$
Importantly, we can construct these time series restricting revenues to those paid to the Exchequer (as in Mitchell (Reference Mitchell1988) and Brewer (Reference Brewer1989)) or including also the revenues used to pay bounties.
In Figure 4, Panel A, we first show the levels of revenues from customs and excise as presented in Mitchell (Reference Mitchell1988) and Brewer (Reference Brewer1989). Revenues are stacked on top of each other to sum to total revenue from indirect taxes. One can see two patterns. First, that excise revenue is substantially larger than customs revenue throughout the time period. Second, in the Mitchell (Reference Mitchell1988) and Brewer (Reference Brewer1989) treatment, taxes on “domestic production”—to be precise, excise revenues—account for the bulk of the enormous increase in revenues in the late eighteenth and early nineteenth centuries.
DECOMPOSITION OF EXCISE AND CUSTOMS REVENUES
Notes: This figure decomposes the excise and customs revenue of the British government (in £1,000,000). Panel A decomposes the revenues as presented in Mitchell (Reference Mitchell1988) and Brewer (Reference Brewer1989) into revenues from customs and excise. Panel B plots the levels of revenues from traded goods and domestic goods as calculated by the authors. Years with missing customs data are linearly interpolated. See the main text for a description of the data and methodology. See Online Appendix Figure B.4 for a version of Panel B, which includes revenues spent to finance bounties.
Sources: Authors’ calculations. Refer to the fourth section of the main text for details.

In Figure 4, Panel B, we show the levels of revenues from traded and domestic goods as we calculate them.Footnote 32 A very different pattern of revenue growth appears. Revenue from traded goods increased, rather than declined in importance as the British state developed over the eighteenth century. At the height of the Napoleonic wars in the early nineteenth century, traded goods provided more revenue than domestic goods. If we take the entire period under study, increasing revenues from traded goods in 1689–1818 account for 54 percent of the overall increase of excise and customs revenues. The growth of the British fiscal-military state was not financed by the taxation of domestic goods alone. Rather, tax revenues from international trade represented a substantial component of the fiscal expansion that funded Britain’s imperial dominance.
In Figure 5, we plot the share of British customs and excise revenue from traded goods calculated using the approach and data in Mitchell (Reference Mitchell1988) and Brewer (Reference Brewer1989) (i.e., treating customs revenue as coming from traded goods and excise as coming from domestic production), as well as the share of revenue from traded goods calculated using our disaggregated data.
REVENUES FROM TRADED GOODS AS SHARE OF EXCISE AND CUSTOMS
Notes: This figure compares the share of British customs and excise revenue from traded goods as computed by the authors with the share as reported in Brewer (Reference Brewer1989) and using the data in Mitchell (Reference Mitchell1988). The grey, dashed line plots the share following Brewer (Reference Brewer1989) in treating customs revenue as coming from traded goods and excise as coming from domestic production. The black, solid line plots the share of revenue from traded goods following the authors’ calculations and using disaggregated customs and excise data. Gaps in the lines indicate years with missing data. See the main text for a description of the data and methodology. See Online Appendix Figure B.5 for a version of this figure, which includes revenues spent to finance bounties.
Sources: Authors’ calculations. Refer to the fourth section of the main text for details.

One can see in the figure that the traditional narrative of a modest and declining role for taxes on traded goods as Britain expanded its fiscal capacity is overturned when examining disaggregated data on the excise. Indeed, our data show that as revenues expanded enormously over the second half of the eighteenth century, the share of revenues from traded goods actually increased and was over 50 percent of total excise and customs revenues in the late eighteenth and early nineteenth centuries. The share of revenues from traded goods reached a peak of over 60 percent in 1800, when additionally considering revenues spent on bounties (see Online Appendix Figure B.5).Footnote 33
What Traded Goods Contributed to Fiscal Revenues?
An obvious threat to the success of the excise tax would have been charging rates that discouraged imports. A standard result in public finance due to Ramsey (Reference Ramsey1927) is that optimal taxes should bear an inverse relationship to the elasticity of demand. To gain insight into what made a high fiscal revenue possible, we examine the nature of the traded goods that were taxed.
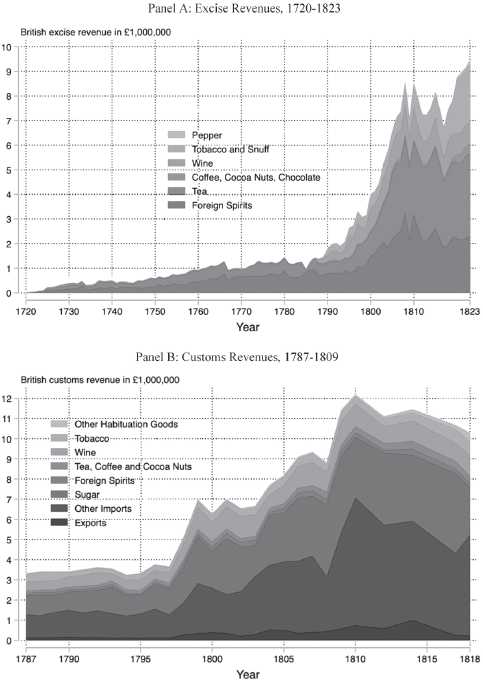
In Figure 6, Panel A, we further decompose, by good, excise revenues from trade.Footnote 34 Tea and foreign spirits were the most important components throughout the eighteenth and early nineteenth centuries, with wine and tobacco playing an increasingly important role in the early nineteenth century. The other goods are cocoa, chocolate, coffee, and pepper. The entirety of traded excise goods are consumption items that create habituation and have been noted to have relatively inelastic demands—actual drugs like alcohol and tobacco, as well as what Mintz (Reference Mintz1985) called “drug foods.”Footnote 35 Figure 6, Panel B, decomposes the customs revenues from traded goods.Footnote 36 The set of goods includes imports that were taxed under both excise and customs (foreign spirits, tea, tobacco, etc.). The most important contributor to customs revenue was sugar, which was not taxed under excise, and which accounted for a third of customs revenues. A majority of customs revenues also came from habituation goods with highly inelastic demand.
DECOMPOSITION OF REVENUES FROM TRADED GOODS
Notes: This figure decomposes British government revenues from traded goods (in £1,000,000). Panel A plots excise revenues by traded good for 1720–1823. Panel B plots customs revenues by traded good for 1787–1818. Excise revenues from tea and wine include revenues from tea and wine licenses. Excise revenues from imported beer have been included with the revenues from foreign spirits, since revenues from imported beer are too small to be visible independently. Customs revenues from other habituation goods come from opium, licorice, pepper, spices, etc. The “Other Imports” category of Panel B includes all the customs revenues from imports other than the habituation goods enumerated in this figure.
Sources: Authors’ calculations. Refer to the fourth section of the main text for details.
These findings help us understand why the combination of taxation and trade activity provided a high volume of fiscal revenue.Footnote 37 They also highlight the importance of Britain’s coercive power in its fiscal expansion. One can see that a substantial share of revenues from traded goods was due to goods whose trade (and, in some cases, production) depended on the application of coercive power against colonized peoples, slaves, and competing European powers.
CONCLUSION
We provide new data on British excise and customs revenues over time that improve upon standard references. The data make clear that: (i) excise taxation was not only a tax on domestically produced goods, but was also a tax on traded goods; (ii) taxes on traded goods were a large share of indirect taxation, ranging from 40 to 55 percent; and (iii) taxes on traded goods were a growing share of total revenues from the early eighteenth century to the early nineteenth century, as Britain’s fiscal-military state developed. These results are evident even under the conservative assumptions guiding the construction of our data.
The patterns revealed by the data we collect should change the narrative regarding the growth of Britain’s fiscal state. First, it had roots in the massive expansion of British trade—especially across the Atlantic and in Asia—that occurred in the seventeenth–nineteenth centuries (as documented by, e.g., Schumpeter (Reference Schumpeter1960) and Davis (Reference Davis1962)). Similar to the change in Britain’s institutional trajectory identified by Acemoglu, Johnson, and Robinson (Reference Acemoglu, Johnson and Robinson2005), overseas trade was a shock that changed the state’s fiscal trajectory as well. Second, it relied to a significant extent on a traditional bureaucracy located in ports—even in the case of the excise.Footnote 38 This shifts both the geographic and administrative dimensions of Britain’s fiscal development. Finally, it depended on war and empire, which facilitated overseas trade in the goods essential to the rise in revenues. The more general implication is that the coercive power of the state was both an input to and an outcome of taxable economic activity.
Appendix
BRITISH EXCISE AND CUSTOMS REVENUES (IN £1,000), 1689–1720

Notes: See Table A4.
Sources: Authors’ calculations. Refer to the fourth section of the main text for details.
BRITISH EXCISE AND CUSTOMS REVENUES (IN £1,000), 1721–1757

Notes: See Table A4.
Sources: Authors’ calculations. Refer to the fourth section of the main text for details.
BRITISH EXCISE AND CUSTOMS REVENUES (IN £1,000), 1758–1794

Notes: See Table A4.
Sources: Authors’ calculations. Refer to the fourth section of the main text for details.
BRITISH EXCISE AND CUSTOMS REVENUES (IN £1,000), 1795–1823

Notes: These tables report the yearly excise and customs revenues of the British government (in £1,000). Columns (1)–(3) report the revenues paid to the Exchequer collected by the excise, and Columns (5)–(7) report the revenues paid to the Exchequer collected by the customs. These exchequer revenues are net of management costs, drawbacks, and bounties or other charges paid out of the revenues. Columns (2)–(3) for excise and Columns (6)–(7) for customs disaggregate the exchequer revenues into those collected from traded and domestic goods. Columns (4) and (8) report the revenues that finance bounties or equivalent charges for national objectives. These revenues never reached the Exchequer and are therefore not included in the totals of Columns (1) or (5). The excise revenues paying for bounties (in Column (4)) are solely derived from traded goods. All the customs revenues paying for bounties (in Column (8)) are collected from traded goods. Cells are left empty whenever data is missing.
Source: Authors’ calculations. Refer to the fourth section of the main text for details.
BRITISH EXCISE REVENUES FROM OVERSEAS TRADE (IN £1,000), 1720–1757

Notes: See Table A8.
Sources: Authors’ calculations. Refer to the fourth section of the main text for details.
BRITISH EXCISE REVENUES FROM OVERSEAS TRADE (IN £1,000), 1758–1794
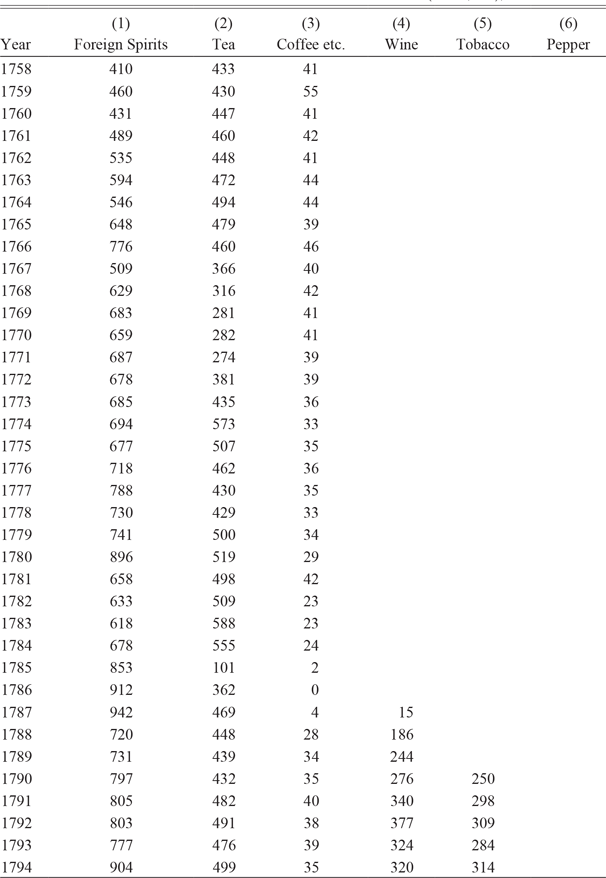
Notes: See Table A8.
Sources: Authors’ calculations. Refer to the fourth section of the main text for details.
BRITISH EXCISE REVENUES FROM OVERSEAS TRADE (IN £1,000), 1795–1823

Notes: See Table A8.
Sources: Authors’ calculations. Refer to the fourth section of the main text for details.
BRITISH CUSTOMS REVENUES FROM OVERSEAS TRADE (IN £1,000), 1787–1818

Notes: These tables decompose British government revenues from traded goods (in £1,000), corresponding to Figure 6 in the text. Tables A.5–A.7 provide excise revenues by traded good for 1720–1823. Table A.8 provides customs revenues by traded good for 1787–1818. Excise revenues from tea and wine include revenues from tea and wine licenses. Excise revenues from imported beer have been included with the revenues from foreign spirits. Customs revenues from other habituation goods come from opium, licorice, pepper, spices, etc. The category of Table A.8 includes all the customs revenues from imports other than the goods enumerated here.
Sources: Authors’ calculations. Refer to the fourth section of the main text for details.


 Open access

