


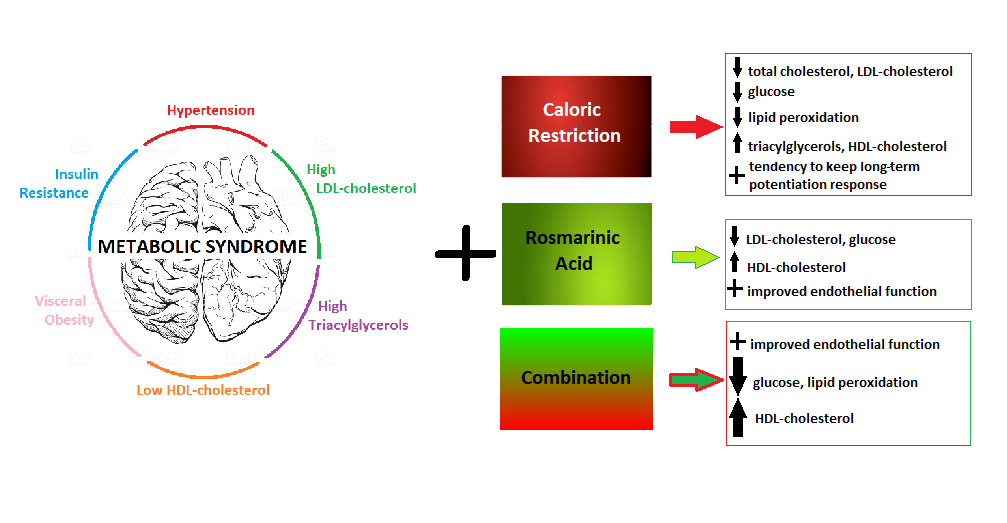
The concept of the metabolic syndrome (MetS) indicates an association between dyslipidaemia, impaired glucose tolerance and inflammation. These factors in conjunction with obesity and hypertension result in the development of the MetS. The development of metabolic diseases is closely related to chronic inflammatory conditions along with oxidative stress. The harmful effect of long-lasting disturbances in lipid and glucose metabolism is manifested first of all as endothelial dysfunction and insulin resistance (IR). Inflammatory signals from the endothelium and IR are probably causative in the chronic metabolic inflammation, precede inflammatory state of the organism and lead to overt symptoms of the MetS(Reference Grandl and Wolfrum1). In the case of cardiovascular complications, the key risk factor besides elevation of blood pressure and serum lipids is atherosclerosis which initiates when the endothelial monolayer becomes inflamed(Reference Libby, Ridker and Maseri2). The MetS and its components have a negative impact even on cognitive functions of the hippocampus. The MetS is associated with a deficit in creating and handling memory tracks, visual-spatial capabilities, executive functioning, information processing speed and overall intelligence(Reference Bokura, Nagai and Oguro3–Reference Hassenstab, Sweat and Bruehl5).
The sedentary nature of jobs and high-energy diets are causes of MetS development and represent the main problems for increasing personal health risks, predominantly in developed industrial countries. Accordingly, modifying lifestyle has attracted the attention of investigators as one of the methods for reducing CVD and cerebrovascular disease(Reference Carroll and Dudfield6,Reference Ahmed, Blaha and Nasir7) . A very important component of healthy lifestyle is a balanced diet. In the past few decades, the availability and consumption of inexpensive tasty foods in modern society led to increased frequency of the MetS in the population. Thus, improvement of eating habits, for example, decreasing high-fat and high-carbohydrate intake, serves as prevention, yet also as a treatment strategy of the MetS and its components.
Due to the multifactorial nature of the MetS, pharmacological treatment is very difficult and could be associated with several side effects of drugs and other morbidities. Identification of novel, effective and easily obtainable remedies affecting several components of the MetS for preventive and adjunctive therapy is a great challenge for modern medicine. It is generally accepted that food rich in fruits and vegetables reduces the incidence and symptoms of CVD, cancer, neurological disturbances and inflammation(Reference Lazarou, Panagiotakos and Matalas8,Reference Pistollato and Battino9) . The biological activity of food of herbal nature is reached also by a large amount of phenolic or polyphenolic compounds, which are effective in reducing metabolic abnormalities. Phenolic or polyphenolic compounds are now widely recognised as strong antioxidant substances that have shown anti-inflammatory properties(Reference Arranz, Chiva-Blanch and Valderas-Martínez10,Reference Rajarathnam, Shashirakha and Mallikarjuna11) . Plant products or plant-derived functional food and nutraceuticals generally provide the best multitarget agents which exhibit a synergistic effect(Reference Prasad, Sung and Aggarwal12). Thus, combined improvement of diet habits and treatment with natural bioactive drugs is assumed to have a protective effect in the prevention and amelioration of the MetS.
Rosmarinic acid (RA) is a natural phenol-carboxylic acid present predominantly in species of the Boraginaceae and Lamiaceae plants, although it is also found in species of other higher plant families and some fern and hornwort species(Reference Petersen and Simmonds13). It is easily absorbed through the gastrointestinal tract as well as through the skin(Reference Baba, Osakabe and Natsume14). RA and Lamiaceae extracts have a wide scale of beneficial effects and are used for their antioxidant and anti-inflammatory effects(Reference McKay and Blumberg15). Anti-inflammatory effects of RA were documented by inhibited progression of atherosclerotic plaques, decreased blood lipid levels and serum levels of proinflammatory cytokines TNF-α and IL-1β (Reference Li, Tian and Xuguo Liang16). Moreover, RA due to its anti-inflammatory properties improved vascular status damaged by type 2 diabetes mellitus(Reference Sotnikova, Okruhlicova and Vlkovicova17). The ability to inhibit inflammatory processes and to scavenge reactive oxygen species makes RA a possible candidate for modifying detrimental effects of the MetS.
The aim of the present study was to evaluate effects of diet improvement and/or RA administration on metabolic as well as on functional vascular and hippocampal changes induced by a high-fat-fructose diet (HFFD) in rats. We were motivated by our previous findings of the RA effect in MetS-like conditions(Reference Michalikova, Tyukos Kaprinay and Sásváriová18) where we studied the effect of energy restriction in combination with RA on plasma lipids in rats fed HFFD. The results showed that changing the HFFD diet to the standard induced a drop of total cholesterol to almost initial levels. HDL-cholesterol decreased by administration of the HFFD diet, tended to return to initial values after both energy restriction and RA, as well as their combination. As expected, LDL-cholesterol levels increased after 5 weeks of HFFD and then decreased when the diet was changed to standard. RA administration also mildly decreased serum LDL-cholesterol and its effect was potentiated with changing HFFD to the standard. These findings of anti-dyslipidaemic effects indicated a possible vascular reactivity improvement; thus, in the present work, we focused on the study of vascular relaxation response, blood pressure changes, anti-inflammatory and antioxidant effects, and glucose tolerance. Putative improvement of the above-mentioned parameters may be associated with protected brain functions; therefore, the hippocampal synaptic plasticity was investigated.
Materials and methods
Animal model and design of experiment
Male Prague hereditary hypertriacylglycerolaemic rats (HTG), from the Department of Toxicology and Breeding of Laboratory Animals, Dobrá Voda (SK CH 24016) of the Centre of Experimental Medicine, Slovak Academy of Sciences, Institute of Pharmacology and Toxicology, were used in the study. The experiments were approved by the State Veterinary and Food Administration of the Slovak Republic (decision No 3853/18-221/3) and the Ethical Committee of the Centre of Experimental Medicine, Slovak Academy of Sciences, Institute of Pharmacology and Toxicology. At the beginning of the experiment, the animals were 10 weeks old (n 50, weight 243 (sd 6 g)). The animals had access to food and water ad libitum and the light cycle was 12/12 (12 h dark, 12 h light).
The animals were divided into five groups (each of ten animals): StD group – HTG rats fed standard diet (StD) for 8 weeks; HFFD8 group – HTG rats fed modified diet (HFFD) for 8 weeks; HFFD5+3 group – HTG rats fed for 5 weeks HFFD followed by 3 weeks lasting StD; HFFD 8+RA – HTG rats fed for 8 weeks HFFD and the last 3 weeks of this diet with RA, biological source Rosmarinus officinalis L., ≥98 % (HPLC) (Sigma-Aldrich); HFFD5+3+RA group – HTG rats fed for 5 weeks HFFD followed by 3 weeks lasting StD with RA. Because the positive effect of RA is most often achieved starting from a dose of 50 mg/kg, to obtain the effect in our experiment, we opted for a dose of 100 mg/kg. RA was administered in water suspension orally once a day on commercial crackers. StD contained certified pellet food for rodents (CCF R/M). Pellets of modified diet are standard pellets (19·10 % of nitrogen substances, 3·60 % of fibre, 5·10 % of oil and fat, 5·85 % of ash and 9·10 % of humidity) containing 1 % cholesterol, 7·5 % pork lard and 10 % fructose.
Food intake measurement
The amount of food consumed was determined. Each cage (five rats) received 200 g of pellets. The next day, unconsumed pellets were weighed, and food was refilled to the amount of 200 g/cage per five rats.
Central adiposity measurement
Abdominal circumference was assessed on the largest zone of the rat abdomen using a plastic non-extensible measuring tape with an accuracy of 0·1 cm. Rats were placed in position on all four paws.
Systolic blood pressure measurement
Blood pressure was measured by non-invasive plethysmography using a tail-cuff. The measurements were performed three times during the whole experiment: before the diet, after 5 weeks of the diet and at the end of the experiment. Systolic blood pressure was calculated as the average of five consecutive pressure spindles of each animal (PowerLab 4/30, AD Instrument).
Glucose tolerance test
Glucose tolerance test (GTT) was performed at the end of the experiment. The basal glucose level was measured in blood taken from the tail after 14 h of starvation. Then, glucose solution (50 %) was applied intraperitoneally to animals in a volume of 0·4 ml/100 g of body weight, that is, 2 g glucose/kg of body weight. Blood glucose levels were repeatedly measured at 30, 60, 90 and 120 min after intraperitoneal administration of glucose. The glucose levels were measured by a glucose meter (Contour, Bayer).
Determination of IL-1β
The proinflammatory IL-1β was assessed in serum by the diagnostic biochemical assay kit with Sandwich-ELISA principle (Elabscience). Serum was obtained from centrifugated blood samples taken after decapitation of animals. Absorbance of the resulting coloured compound was measured spectrophotometrically (Labsystem Multiskan RC).
Determination of oxidative damage
Thiobarbituric acid reactive substances, as a marker of lipid peroxidation, were determined by the double heating method of Drapper & Hadley(Reference Drapper and Hadley19) from serum. The principle of the method is the spectrophotometric measurement of solution staining during the reaction of tertiary butylalcohol with thiobarbituric acid reactive substances. Protein concentration was tested according to Lowry et al.(Reference Lowry, Rosebrough and Farr20).
Functional studies in the aortas
After decapitation of animals, the thoracic aorta was removed from the thoracic cavity, transferred into oxygenated modified Krebs solution (mmol/l): NaCl (118·0), KCl (4·7), KH2PO4 (1·2), MgSO4 (1·2), CaCl2 (2·5), NaHCO3 (25·0) and glucose (11·0), cleaned of adherent tissue and cut into approximately 2-mm-long rings. Special care was taken not to damage the endothelium. Using two hooks of a triangular shape, the rings were mounted on a holder connected to a sensor of tensiometry. They were immersed in a water-jacketed chamber containing modified Krebs solution gassed with a mixture of 95 % O2 and 5 % CO2, pH 7·4 at 37°C. The stabilisation period lasted for 60 min at an optimal tension of 10 mN. During stabilisation, the rings were rinsed several times with modified Krebs solution. The isometric contraction force was measured using data acquisition system (Experimetria). After stabilisation, the rings were contracted by depolarising solution (Krebs solution in which NaCl was equimolarly replaced with 100 mmol/l KCl). After washing the rings, phenylephrine (10−6 mol/l) was added into the solution to induce contraction. After reaching the plateau response, acetylcholine was cumulatively applied in concentrations of 10−8, 3 × 10⁻⁸, 10−7, 3 × 10⁻⁷, 10−6, 3 × 10⁻⁶, 10−5 mol/l to monitor the endothelium-dependent relaxation response. Results are given in percentage of relaxation of maximal phenylephrine-induced contraction. Phenylephrine and acetylcholine were purchased from Sigma Aldrich, and other chemicals were from Slovak commercial sources.
Functional measurement of electrophysiology of the hippocampus
Neurotransmission was determined by recording and digitising electrically induced in vitro responses of the hippocampus. We used artificial cerebrospinal fluid (mmol/l): NaCl (124·0), KCl (3·3), KH2PO4 (1·25), MgSO4 (2·4), CaCl2 (2·5), NaHCO3 (26·0), glucose (10·0), saturated with 95 % O2 + 5 % CO2, at pH 7·4 and temperature about 33 (sd 1)°C). Synaptic plasticity was evoked using high-frequency stimulation (HFS) of Schäffer collaterals. Hippocampal slices (400 µm thick) were stimulated by a bipolar stainless steel wire electrode. Electrically evoked responses were recorded using glass microelectrode filled with artificial cerebrospinal fluid (3–5 MΩ) placed in the stratum radiatum of the rat hippocampus. At the beginning of the measurement, the stimulus intensity was reduced to obtain 30–50 % of maximal excitatory postsynaptic potential at a stimulus frequency of 0·033 Hz as the so-called baseline response. After 10–15 min of a stabilisation period, long-term potentiation (LTP) of neuronal transmission was induced by a single train of HFS (100 Hz, 1 s). After LTP induction, further evoked responses were recorded at baseline stimulus frequency (0·033 Hz) for the next 40 min. Average baseline response recorded during 10 min before HFS was normalised to 1 as a baseline and then all further responses were recalculated to normalised values.
Statistical evaluation
The obtained data were statistically evaluated from individual values using the GraphPad Prism6 software (GraphPad). Data were expressed as means and standard deviations. Two-way ANOVA was used to evaluate the differences among all the experimental groups (using the Bonferroni multiple comparison test). The value of P < 0·05 was considered as a statistically significant difference.
Results
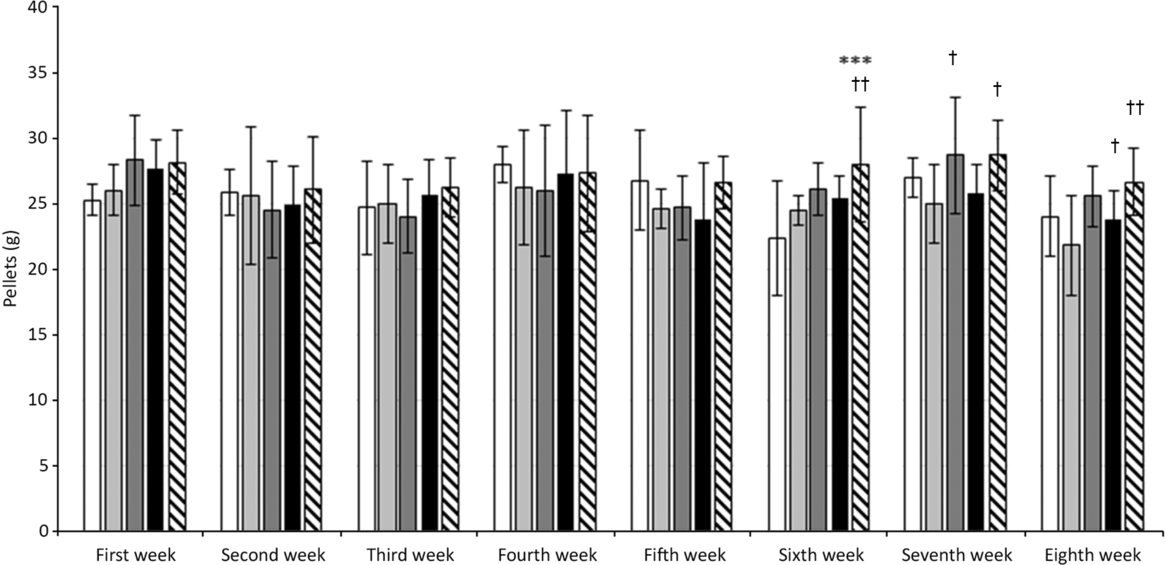
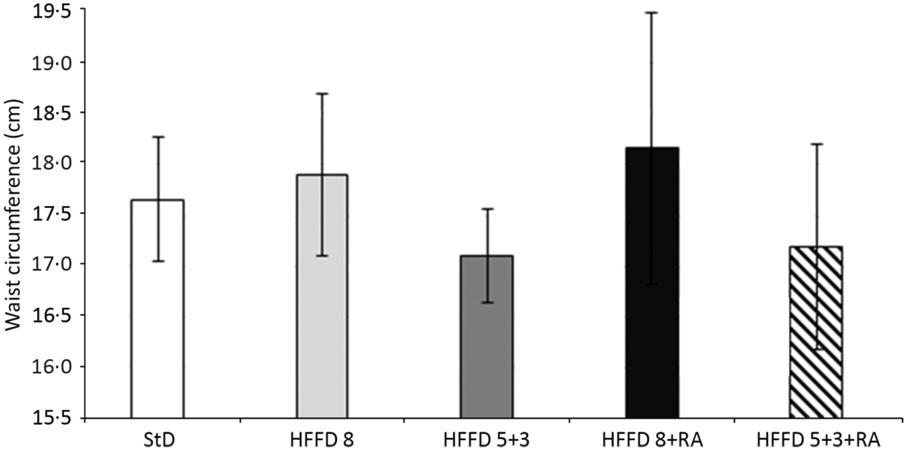
In our experiments on HTG rats, the initial body weight of animals at the beginning of the experiment did not differ between individual groups and was 236–255 g. The weight of all rats increased with age. Dietary change and RA treatment did not affect body weight significantly, but there is a trend indicating a positive effect of energy restriction (after 8 weeks: StD – 362·4 (11·81); HFFD8 – 386·5 (9·27); HFFD8+RA – 385·2 (11·25); HFFD5+3 – 359·3 (6·03); HFFD5+3+RA – 364 (7·56) (g (SD)). We did not detect any differences in the amount of consumed food during the first 5 weeks of the experiment. Since the sixth week, rats that had changed their diet from HFFD to the StD started to consume significantly more food (Fig. 1). We did not find any significant differences in central adiposity measured as waist circumference. There was just a tendency to its decrease in rats after energy restriction. RA did not affect this parameter (Fig. 2). As expected, the systolic blood pressure increased in all groups of animals after consuming the HFFD compared with their values at the beginning of the experiment. After a non-pharmacological or pharmacological intervention, these values decreased significantly while in the control groups (StD as a negative control, HFFD8 as positive control) the values remained unchanged (Fig. 3.)
Effect of rosmarinic acid (RA) and/or energy restriction on food intake. StD – HTG rats fed 8 weeks standard diet (StD); HFFD8 – hypertriacylglycerolaemic (HTG) rats fed high-fat-fructose diet (HFFD) 8 weeks; HFFD5+3 group – HTG rats fed 5 weeks HFFD and then 3 weeks StD; HFFD8+RA – HTG rats fed 8 weeks HFFD and last 3 weeks of this diet with RA; HFFD5+3+RA group – HTG rats fed 5 weeks HFFD and then 3 weeks StD with RA. n 10 rats/group. Data are mean values and standard deviations. *** P < 0·001 against StD in the corresponding week, † P < 0·05 against HFFD8 in the corresponding week, †† P < 0·01 against HFFD8 in the corresponding week. ![]() , StD;
, StD; ![]() , HFFD8;
, HFFD8; ![]() , HFFD5+3;
, HFFD5+3; ![]() , HFFD8+RA;
, HFFD8+RA; ![]() , HFFD5+3+RA.
, HFFD5+3+RA.
Effect of rosmarinic acid (RA) and/or energy restriction on changes in waist circumference. Data represent the change against values at the beginning of the experiment. StD – HTG rats fed 8 weeks standard diet (StD); HFFD8 – hypertriacylglycerolaemic (HTG) rats fed high-fat-fructose diet (HFFD) 8 weeks; HFFD5+3 group – HTG rats fed 5 weeks HFFD and then 3 weeks StD; HFFD8+RA – HTG rats fed 8 weeks HFFD and last 3 weeks of this diet with RA; HFFD5+3+RA group – HTG rats fed 5 weeks HFFD and then 3 weeks StD with RA. n 10 rats/group. Data are mean values and standard deviations.
Effect of rosmarinic acid (RA) and/or energy restriction on changes in systolic blood pressure. Data represent the change against values at the beginning of the experiment. StD – HTG rats fed 8 weeks standard diet (StD); HFFD8 – hypertriacylglycerolaemic (HTG) rats fed high-fat-fructose diet (HFFD) 8 weeks; HFFD5+3 group – HTG rats fed 5 weeks HFFD and then 3 weeks StD; HFFD8+RA – HTG rats fed 8 weeks HFFD and last 3 weeks of this diet with RA; HFFD5+3+RA group – HTG rats fed 5 weeks HFFD and then 3 weeks StD with RA. n 10 rats/group. Data are mean values and standard deviations. * P < 0·05 against the change after 5 weeks *** P < 0·001 against the same group before diet; ††† P < 0·001 against the same group after 5 weeks. ![]() , StD;
, StD; ![]() , HFFD8;
, HFFD8; ![]() , HFFD5+3;
, HFFD5+3; ![]() , HFFD8+RA;
, HFFD8+RA; ![]() , HFFD5+3+RA.
, HFFD5+3+RA.

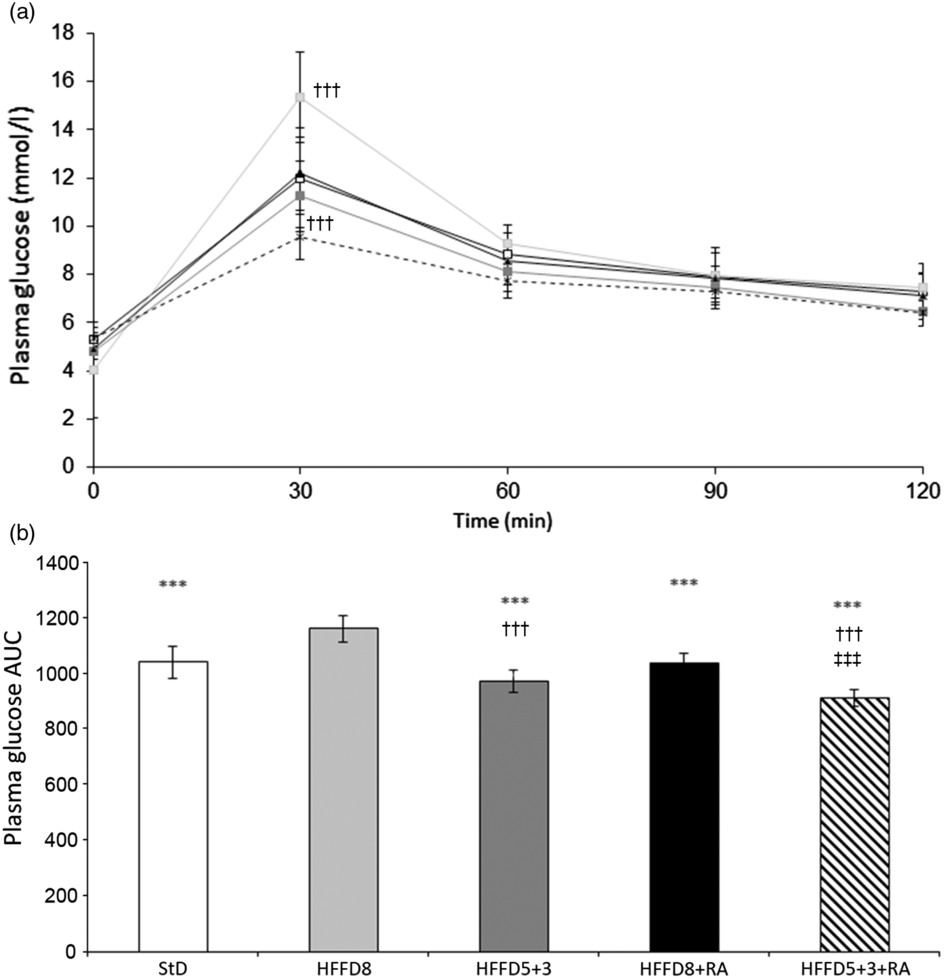
To evaluate the status of glucose metabolism, we used the GTT in individual experimental groups. Results are expressed as the glucose tolerance curves (Fig. 4(a)) and the AUC of the time course of blood glucose levels (Fig. 4(b)). As seen in Fig. 4(a), values at the end of the experiment decreased in the order HFFD8 > StD > HFFD8+RA > HFFD5+3 > HFFD5+3+RA. Thus, RA showed beneficial effect on glucose tolerance, which was further potentiated with dietary improvement, as also shown by AUC (Fig. 4(b)).
Effect of rosmarinic acid (RA) and/or energy restriction on glucose tolerance test. (a) Values expressed as course. (b) Data expressed as AUC. StD – HTG rats fed 8 weeks standard diet (StD); HFFD8 – hypertriacylglycerolaemic (HTG) rats fed high-fat-fructose diet (HFFD) 8 weeks; HFFD5+3 group – HTG rats fed 5 weeks HFFD and then 3 weeks StD; HFFD8+RA – HTG rats fed 8 weeks HFFD and last 3 weeks of this diet with RA; HFFD5+3+RA group – HTG rats fed 5 weeks HFFD and then 3 weeks StD with RA. n 10 rats/group. Data are mean values and standard deviations. (a): * P < 0·05 StD against basal values (time 0); ** P < 0·01 HFFD8+RA against basal values (time 0); *** P < 0·001 HFFD8 against basal values (time 0). ††† P < 0·001 against all other groups at the same time. (b): *** P < 0·001 against HFFD8, ††† P < 0·001 against StD and HFFD8+RA, ‡‡‡ P < 0·001 against HFFD5+3. (a) ![]() , StD;
, StD; ![]() , HFFD8;
, HFFD8; ![]() , HFFD5+3;
, HFFD5+3; ![]() , HFFD8+RA;
, HFFD8+RA; ![]() , HFFD5+3+RA.
, HFFD5+3+RA.
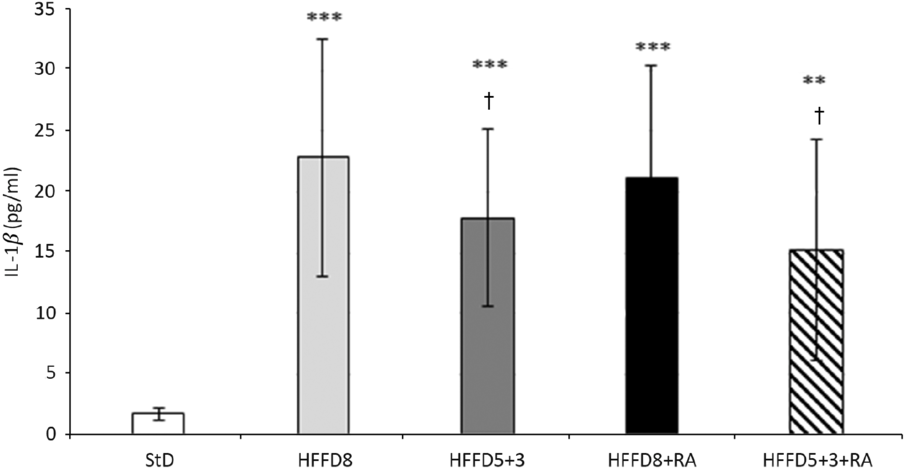
We observed also the effect of HFFD on the inflammatory state of the animals. The adjustment of HFFD on the StD resulted in a reduction of the IL-1β serum levels. The anti-inflammatory effect of RA was more pronounced in the group with the diet change from HFFD to standard than in HFFD8 group (Fig. 5).
Effect of rosmarinic acid (RA) and/or energy restriction on levels of proinflammation marker IL-1β. StD – HTG rats fed 8 weeks standard diet (StD); HFFD8 – hypertriacylglycerolaemic (HTG) rats fed high-fat-fructose diet (HFFD) 8 weeks; HFFD5+3 group – HTG rats fed 5 weeks HFFD and then 3 weeks StD; HFFD8+RA – HTG rats fed 8 weeks HFFD and last 3 weeks of this diet with RA; HFFD5+3+RA group – HTG rats fed 5 weeks HFFD and then 3 weeks StD with RA. n 10 rats/group. Data are mean values and standard deviations. ** P < 0·01 against StD, *** P < 0·001 against StD, † P < 0·05 against HFFD8.
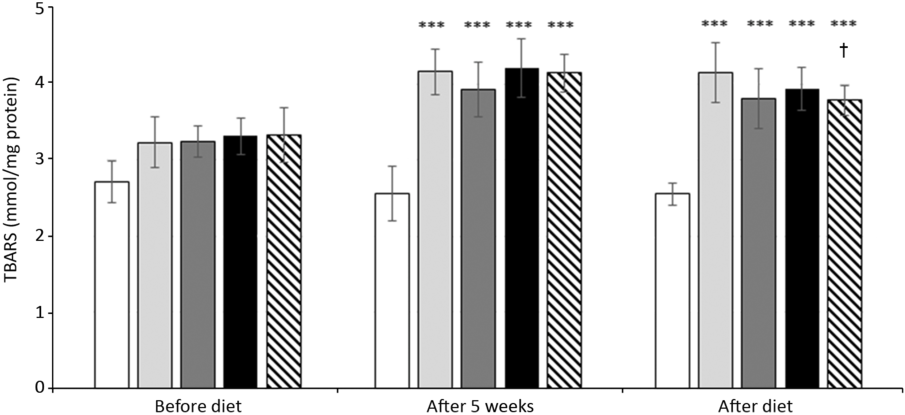
The administration of HFFD led to an increase in the serum thiobarbituric acid reactive substance concentrations in rats of all groups. Change of the diet by itself did not have a significant effect on lipid peroxidation, yet together with RA administration decreased thiobarbituric acid reactive substance levels were found (Fig. 6). In functional studies, the aorta of the animals with administered HFFD for 5 or 8 weeks responded to the endothelium-dependent vasodilator acetylcholine with relaxation, which reached approximately 50 % of the maximal relaxation. RA ameliorated endothelial function in both groups HFFD5+3+RA and HFFD8+RA, which was reflected in improved aortic relaxation achieving approximately values of StD with a maximum of about 80 % (Fig. 7).
Effect of rosmarinic acid (RA) and/or energy restriction on levels of lipid peroxidation marker expressed as thiobarbituric acid reactive substance (TBARS) amount. StD – HTG rats fed 8 weeks standard diet (StD); HFFD8 – hypertriacylglycerolaemic (HTG) rats fed high-fat-fructose diet (HFFD) 8 weeks; HFFD5+3 group – HTG rats fed 5 weeks HFFD and then 3 weeks StD; HFFD8+RA – HTG rats fed 8 weeks HFFD and last 3 weeks of this diet with RA; HFFD5+3+RA group – HTG rats fed 5 weeks HFFD and then 3 weeks StD with RA. n 10 rats/group. Data are mean values and standard deviations. *** P < 0·001 against the same group before diet, ** P < 0·01 against the same group before diet, † P < 0·05 against the same group after 5 weeks. ![]() , StD;
, StD; ![]() , HFFD8;
, HFFD8; ![]() , HFFD5+3;
, HFFD5+3; ![]() , HFFD8+RA;
, HFFD8+RA; ![]() , HFFD5+3+RA.
, HFFD5+3+RA.
Effect of rosmarinic acid (RA) and/or energy restriction on endothelium-dependent relaxation of the aorta expressed as percentage of relaxation induced by acetylcholine after phenylephrine-induced contraction. StD – HTG rats fed 8 weeks standard diet (StD); HFFD8 – hypertriacylglycerolaemic (HTG) rats fed high-fat-fructose diet (HFFD) 8 weeks; HFFD5+3 group – HTG rats fed 5 weeks HFFD and then 3 weeks StD; HFFD8+RA – HTG rats fed 8 weeks HFFD and for the last 3 weeks of this diet with RA; HFFD5+3+RA group – HTG rats fed 5 weeks HFFD and then 3 weeks StD with RA. n 10 rats/group. Data are mean values and standard deviations. * P < 0·05 HFFD5+3 against HFFD5+3+RA group, † P < 0·05 – HFFD8 against HFFD8+RA group; ‡ P < 0·05 HFFD8 and HFFD8+RA against StD. ![]() , StD;
, StD; ![]() , HFFD8;
, HFFD8; ![]() , HFFD5+3;
, HFFD5+3; ![]() , HFFD8+RA;
, HFFD8+RA; ![]() , HFFD5+3+RA.
, HFFD5+3+RA.

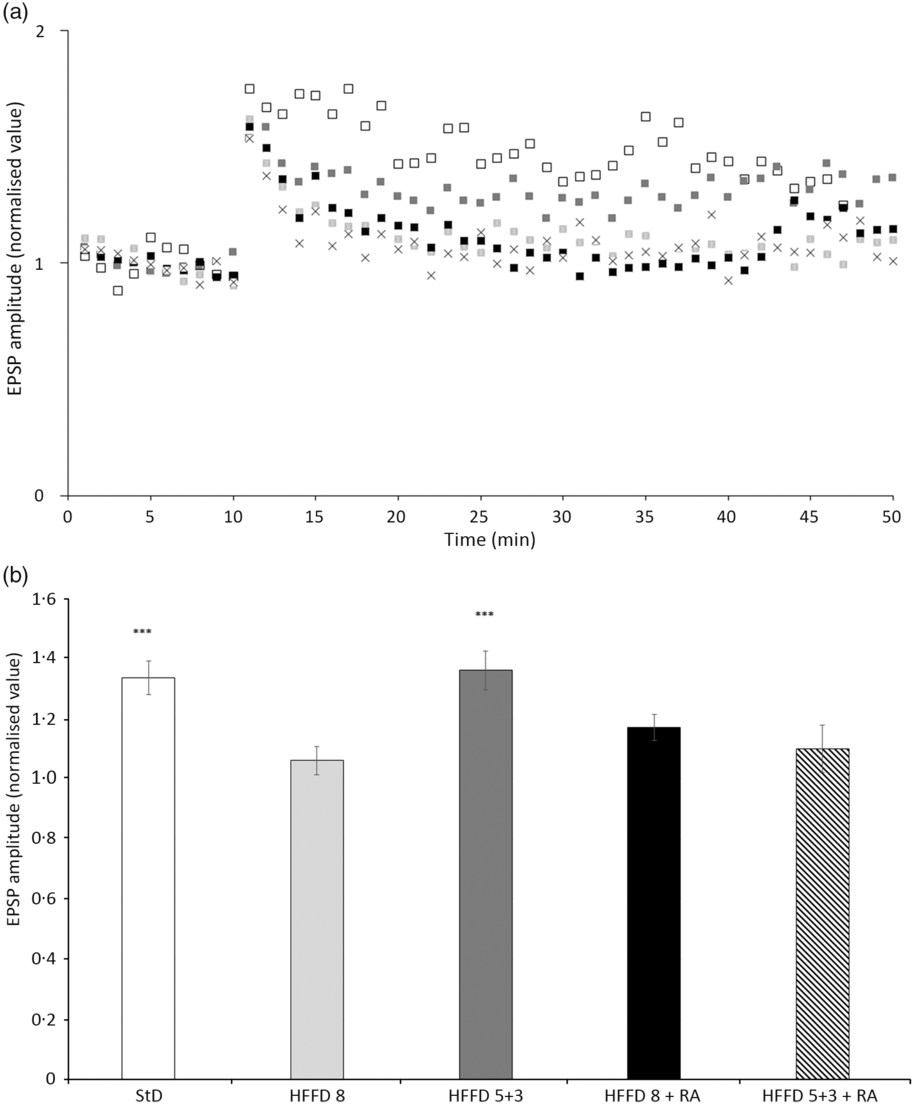
In the experiments on hippocampal slices, we found that the amplitude of the excitatory postsynaptic potential remained increased (136 (sd 21) %) even after 40 min after HFS (100 Hz, 1 s) only in the HFFD5+3 group. For the other groups, the amplitude gradually decreased almost to the baseline values recorded before HFS (HFFD8, 106 (sd 14) %; HFFD8+RA, 117 (sd 25) %; HFFD5+3+RA, 110 (sd 17) %), reflecting a deteriorated course of the LTP and thus a possible worsening of learning (Fig. 8).
The time-dependent effect of rosmarinic acid (RA) and/or energy restriction on long-term potentiation (LTP) of neuronal transmission recorded at the CA3-CA1 synapse in the stratum radiatum of the rat hippocampus. (a) Continuously recorded excitatory postsynaptic potential (EPSP) amplitude values. High-frequency stimulation (HFS; 100 Hz, 1 s) was applied after 10 min of stabilisation. Recordings of neuronal transmission continued for the next 40 min. (b) LTP magnitudes calculated as means from the last 5 min of recordings. StD – HTG rats fed 8 weeks standard diet (StD); HFFD8 – hypertriacylglycerolaemic (HTG) rats fed high-fat-fructose diet (HFFD) 8 weeks; HFFD5+3 group – HTG rats fed 5 weeks HFFD and then 3 weeks StD; HFFD8+RA – HTG rats fed 8 weeks HFFD and last 3 weeks of this diet with RA; HFFD5+3+RA group – HTG rats fed 5 weeks HFFD and then 3 weeks StD with RA. n 10 rats/group. Data are expressed as mean values and standard deviations. *** P < 0·05 against HFFD5+3+RA, HFFD8+RA, HFFD8. (a) ![]() , StD;
, StD; ![]() , HFFD8;
, HFFD8; ![]() , HFFD5+3;
, HFFD5+3; ![]() , HFFD8+RA;
, HFFD8+RA; ![]() , HFFD5+3+RA.
, HFFD5+3+RA.
Discussion
It is well known that unhealthy lifestyle can lead to serious impairment of the organism. Besides lower physical activity, incorrect eating habits often result in the MetS, a cluster of risk factors including obesity, dyslipidaemia, hypertension, oxidative stress, inflammation, elevated glucose levels or IR. Hereditary HTG rats, as used in our study, have been bred for studying relationships between blood pressure and metabolic abnormalities(Reference Zicha, Pecháňová and Čačanyiová21). It is a non-obese model of impaired fatty acid metabolism as well as a model of the MetS(Reference Bohov, Šebőková and Gašperiková22). Kyseľová et al. (Reference Kyseľová, Sotníková and Navarová23) and Bezek et al.(Reference Bezek, Paulovičová and Sotníková24) found in HTG rats increased fasting glucose levels, slightly increased systolic blood pressure and increased levels of TAG compared with normotensive control – Wistar rats. Moreover, dyslipidaemia was associated with an additional rise in blood pressure. HTG rats fed HFD were described by Kyseľová et al.(Reference Kyseľová, Sotníková and Navarová23) and Bezek et al. (Reference Bezek, Paulovičová and Sotníková24) to show also increased levels of inflammatory and oxidative stress markers.
We expected that all these changes due to HFD would be more pronounced after addition of fructose to food. Burgoin et al.(Reference Burgoin, Bachelard and Badeau25) found a detrimental effect of sugar intake increase on the functional state of vessels, reflecting an onset of atherosclerotic structural vascular changes. Therefore, HTG rats fed HFFD were used in our work as a model of non-obese MetS. This model enables us to study the effect of energy restriction and supportive natural treatment on disorders induced by unhealthy food.
Rats susceptible to obesity, like many obese people(Reference Leibel, Rosenbaum and Hirsch26), reduce their basal metabolism during energy restriction and return to their previously high body weight upon discontinuation of restriction(Reference Levin27). In contrast to individuals resistant to obesity, those susceptible to it have a predisposition to IR(Reference Larson, Ferraro and Robertson28), decreased growth hormone secretion(Reference Desprée29) and higher tendency to carbohydrate oxidation to fats(Reference Larson, Ferraro and Robertson28). In our experiments, HTG rats were resistant to the development of obesity after HFFD and the weight of rats was not significantly changed despite energy/energy restriction. Although our experimental model did not develop obesity(Reference Zicha, Pecháňová and Čačanyiová21), we decided to assess abdominal/visceral obesity by measuring waist circumference. Abdominal obesity is the most prevalent risk factor of the MetS(Reference Lauterio and Perez30) and although we did not find significant differences, the tendency of waist circumference to increase in HFFD-fed rats compared with control and energy-restricted groups was obvious. Food intake, however, was increased after HFFD restriction to the StD. It seems that rats refilled the energy deficit by increasing the amount of food, and thus, they maintained their weights due to increased food consumption.
In our work, we did not observe significantly different values of glycaemia among individual experimental groups. In GTT, however, the fat and fructose restriction from the diet was manifested by amelioration of glycaemic curve compared with that when HFFD was administered for 8 weeks. GTT shows the functionality of glucose metabolism and glucose liver production. Glucose uptake contributes to the total glycaemia in GTT. Thus, improvement in GTT reflects the improvement in insulin sensitivity(Reference Larson-Meyer, Heilbronn and Redman31). Our observations are in accordance with Jiang et al. (Reference Jiang, Koike and Li32) who reported an improved GTT in animals with energy restriction or increased physical activity. The simultaneous administration of RA with HFFD resulted in the improvement of the glycaemic curve, similarly, as did fat and fructose restriction. This effect was further potentiated by treating animals with RA during energy restriction. Our results are in agreement with those of Runtuwene et al. (Reference Runtuwene, Cheng and Asakawa33) who found in Wistar rats that RA dose-dependently ameliorated IR by decreasing the expression of phosphoenolpyruvate carboxykinase in the liver and increasing GLUT4 expression in muscles. Moreover, the extract of Lavandula stoechas, containing RA, was reported to have a beneficial effect on glucose metabolism(Reference Kulabas, Ipek and Tufekci34).
The development of metabolic diseases is closely related to chronic inflammatory conditions. Uncontrolled inflammation may produce massive inflammatory cytokines, in which IL-1β plays an important role. It acts primarily extracellularly as a soluble mediator involved in tissue damage and serious disorders, for example, of the cardiovascular system(Reference Libby35). Accordingly, our results demonstrated increased serum levels of IL-1β in HTG rats fed HFFD and their decrease by HFFD restriction. Moreover, this effect was amplified by RA administration, but levels of all HFFD groups remained markedly higher than StD group values. Our experiments confirmed the anti-inflammatory effect of RA, reported by several authors, for example, Ghasemzadeh Rahbardar et al.(Reference Ghasemzadeh Rahbardar, Amin and Mehri36). It is possible that the effect would be more pronounced with longer administration of the substance.
Oxidative stress, along with chronic inflammatory conditions, is generally accepted to accompany the individual components of the MetS and to contribute to redox imbalance and cellular dysfunction, as confirmed by numerous authors, for example, Mahjoub & Masrour-Roudsari(Reference Mahjoub and Masrour-Roudsari37). Therefore, amelioration of the metabolic state by diet modification should be reflected also in the reduction of oxidative stress. The change of HFFD to StD in our experiments slightly reduced serum values of the lipid peroxidation marker, but levels remained elevated compared with controls without HFFD. We assume that RA, by its antioxidative action documented in vitro (Reference Sherratta, Villeneuve and Durand38) and in vivo (Reference Jayanthy and Subramanian39), would be also effective in our experiments. The effect of RA administration was manifested by the potentiation of the action of dietary fat and fructose restriction. However, RA during HFFD8 treatment was not significantly active. This probably resulted from the fact that RA enters spontaneously into lipid membranes with a higher affinity to unsaturated than saturated lipids(Reference Fadel, El Kirat and Morandat40).
Our previous results showed that modification of StD to HFFD was responsible for a decreased endothelium-dependent relaxation in the HFFD group of HTG rats compared with StD group or to that usually found in Wistar rats(Reference Kaprinay, Gáspárová and Lipták41). The combination of hyperglycaemia and dyslipidaemia appears to be associated with injury of the endothelium, which is the first step to vascular atherosclerotic changes(Reference Sima, Stancu and Simionescu42). Further, hypertriacylglycerolaemia is an independent risk factor in the development and progression of atherosclerosis. Because of metabolic disruption, the bioavailability of NO is reduced and reactive oxygen species formation increased, resulting in a reduction of endothelial-dependent vasorelaxation(Reference Bae, Bassenge and Kim43,Reference Török, Babál and Matušková44) . Several authors studied the function of the arteries of diabetic mice and rats after a hyperlipidaemic diet or a diet with a high carbohydrate content. For example, Reil et al.(Reference Reil, Barnard and Kashyap45) found in animals fed high-sucrose diet a significant decrease in endothelium-dependent relaxation and increased vascular sensitivity for vasoconstrictors. The authors found that elevated levels of peroxynitrite were responsible for disrupting the endothelial NO synthase structure and subsequently for endothelial dysfunction. In accordance with these findings are the results of Burgoin et al.(Reference Burgoin, Bachelard and Badeau25) who described a decreased endothelium-dependent relaxation and a decreased endothelial NO synthase expression in muscles and vascular endothelium, as well as increased vascular endothelin content in rats fed high-lipid and high-carbohydrate diets. Moreover, the addition of fructose to HFD led to decreased acetylcholine-induced relaxation of the aorta also in our previous experiments(Reference Kaprinay, Gáspárová and Lipták41). All these findings point to the ability of an even relatively short-term administration of a high-lipid and high-carbohydrate diet to induce IR and endothelial dysfunction. This is in accordance with our present results, as neither the change of HFFD to the StD ameliorated the endothelial dysfunction already induced by unhealthy food. Treatment with RA, because of its hypolipidaemic and vasoprotective effect, resulted in improved endothelial function.
Endothelial injury is one of the pathomechanisms involved in hypertension. Therefore, disturbed aortic endothelium-dependent relaxation can be reflected in elevated blood pressure. HTG rats have a higher blood pressure than Wistar rats. Increased blood pressure of HTG rats is likely to be associated with increased sympathetic nervous system activity(Reference Štolba, Dobešová and Hušek46) and increased insulin-induced release of endothelin(Reference Rubio, Banos and Diaz47). The administration of HFFD to HTG rats led to an increase in systolic blood pressure(Reference Bezek, Paulovičová and Sotníková24). It seems to be a consequence of the effect of fat in food which induces impairment of lipid profile and elevates the degree of lipid peroxidation leading to blood pressure modulation(Reference Nava, Guarner and Posadas48). In our experiments, even energy restriction or RA administration resulted in blood pressure drop, probably as a consequence of anti-inflammatory and antioxidant properties of RA(Reference Nicoll and Henein49) as well as of a beneficial effect of energy restriction(Reference Styshova, Popov and Artyukov50).
In the experiments on hippocampal slices, the addition of fat and fructose to standard pellets caused the worsening of LTP. Krishna et al.(Reference Krishna, Keralapura and Lin51) and Valladolid-Acebes et al. (Reference Valladolid-Acebes, Merino and Principato52) showed also similar results. They found that the administration of HFD caused changes in synaptic plasticity evidenced by reductions in LTP course. We found that LTP was maintained only in the HFFD5+3 group, where values were comparable to the control group course of LTP. Change from HFFD to the StD could cause neuroendocrine responses at levels of the neuropeptide Y, which regulates food intake, blood pressure, body temperature, hormones, neuromodulator release and pain modulation, sexual behaviour, circadian rhythms, memory processing and cognition(Reference Silva, Xapelli and Grouzmann53), and of ghrelin involved in memory and learning, with neuroprotective effect(Reference Ferrini, Salio and Lossi54). Another possible mechanism responsible for the improvement in the LTP course after energy restriction could be that it protects the brain against cognitive decline through the up-regulation of the brain-derived neurotrophic factor. The reduction of brain-derived neurotrophic factor in the hippocampus is one of the features of the MetS(Reference Kishi, Hiroka and Nagayama55). Okada et al.(Reference Okada, Nakanishi and Amamoto56) found a decrease in membrane arachidonic acid as a major causal factor in the impairment of LTP and that energetic restriction seems to increase arachidonic acid levels. Similar results were obtained from the measurement of hippocampal DHA levels, which may show other mechanisms of improvement of neuronal transmission after dietary restrictions. In our work, we confirmed that energy restriction helped protect neuronal transmission in the hippocampus. The course after HFS remained increased even after 40 min, and thus, energy restriction could stop HFFD-caused possible worsening of learning. RA helps to capture reactive oxygen species as well as inhibit leaching of hyaluronidases and β-hexosaminidases(Reference Ito, Yabe and Gamo57). RA has been found to have positive effects in various neurodegenerative diseases. In the case of neurodegenerative disease, where oxidative stress is the root cause, RA has shown a potential use; thus, its assessment as a therapeutic agent in these disorders is justified. Some potential targets of RA are mitochondrial dysfunction, excitotoxicity, apoptosis and oxidative stress as contributing factors to the pathogenesis of various disorders that can be treated or prevented by RA. These factors specifically in the brain lead to neurodegenerative disorders such as Alzheimer’s disease, Parkinson’s disease and Huntington’s disease(Reference Fallarini, Miglio and Paoletti58). RA protects neurons from oxidative stress in the nervous system. RA significantly attenuated H2O2-induced reactive oxygen species production and apoptotic cell death, as found in the human dopaminergic cell line(Reference Lee, Cho and Park59). RA significantly protects neurons. These effects are mediated by the prevention of oxidative stress, intra-cellular Ca2+ overload and c-fos expression(Reference Fallarini, Miglio and Paoletti58). According to studies about the effect of RA on the nervous system, we tested its effect on neuronal transmission in the hippocampus, yet in our work, RA did not cause any changes in LTP magnitude. Glutamate receptor-2 is affected by RA and glutamate receptor-2 affects intra-cellular translocation and folding of AMPA receptor subunits that are involved in learning mechanism(Reference Cull-Candy, Kelly and Farrant60). RA also could reverse inhibition of NMDA receptors caused by the MetS(Reference Morris61). The reason why RA did not have an influence on LTP in our work could be explained by insufficient levels of RA in the brain since its translocation through brain–blood barriers is strongly limited by the number of transfer protein.
In summary, the fat and fructose restriction from the diet resulted in amelioration of indicators of the MetS in rats fed HFFD – the amendment of serum levels of IL-1β as well as of parameters of GTT. Moreover, the aortic endothelial function was improved with an impact on blood pressure. LTP course was deteriorated after HFFD and only energy restriction caused improvement in the course of LTP. RA did not affect this parameter. Oral administration of RA had a supporting effect not only on glucose metabolism and inflammatory factor IL-1β but also on the vascular endothelium.
Based on our results, we suppose that a change in eating habits combined with the supply of antioxidants such as RA could be suitable for the treatment of the MetS.
Acknowledgements
The authors thank Mrs Katarina Vandakova, Mrs Monika Srnova and Mrs Julia Polakova for their technical assistance.
This work was supported by the Slovak national grants VEGA 2/0054/15, VEGA 2/0120/19 and by APVV 15-0308.
D. M.: Conceptualisation, data curation, formal analysis, investigation, methodology, software, validation, visualisation and roles/writing – original draft. B. T. K.: Conceptualisation, data curation, formal analysis, investigation, methodology, software, validation, visualisation and roles/writing – original draft. Z. B.: Inflammation analysis. M. S.: Data curation, formal analysis and writing – review and editing. K. F.: Data curation and formal analysis. E. B.: Data curation and formal analysis. P. K.: Data curation and formal analysis. S. B. F.: Conceptualisation, funding acquisition and resources. T. S.: Data collection and writing – review and editing. R. S.: Conceptualisation, data curation, formal analysis, investigation, methodology, software, supervision, validation, visualisation and roles/writing – original draft. Z. G.: Data curation, formal analysis, funding acquisition, investigation, methodology, project administration, resources, software, supervision, validation and writing – review and editing.
The authors declare that there are no conflicts of interest.


