




Introduction
The sustainable management of water resources is a critical global issue. Accordingly, the United Nations General Assembly identified clean water and sanitation as a key Sustainable Development Goal (SDG 6), emphasising the role of education in promoting sustainable water use (UN-GA, 2015). Water-related topics are therefore essential in school-level environmental education, as early learning shapes students’ environmental awareness and behaviours (Hsu, Reference Hsu2018). However, water resources education is often isolated from students’ daily life experiences and other subject areas, limiting awareness of water use and conservation.
In recent years, educational policies have promoted the integration of digital technology into teaching and learning. Among these technologies, augmented reality (AR) has been widely used to create interactive and contextualised learning environments (Chang, Chen & Liao Reference Chang, Chen and Liao2020). Previous studies have shown that AR positively influences students’ learning effectiveness, particularly in language education, by supporting contextualised materials and vocabulary learning (Chang et al., Reference Chang, Chen and Liao2020; Liu, Reference Liu2009). Despite these advantages, AR remains underexplored in environmental education, especially in water-related contexts.
In Taiwan, the government’s goal of becoming a bilingual nation by 2030 has increased the need for English instruction that connects language learning with students’ daily lives. At the same time, environmental education policies emphasise the importance of water resources and sustainable water use. However, teachers often lack adequate interdisciplinary materials and rely mainly on textbook-based scientific content (Ho, Reference Ho2012). Consequently, everyday issues such as water footprint and personal water consumption are rarely addressed in classroom instruction (Huang, Reference Huang2013).
Augmented reality (AR) offers promising affordances by integrating real and virtual environments, enabling real-time interaction, and visualising abstract phenomena (Chang et al., Reference Chang, Chen and Liao2020). These features make AR well suited to environmental education, where complex concepts such as water conservation can be made more concrete. Nevertheless, AR remains underutilised in water resources education, particularly in relation to water footprint awareness and the development of pro-environmental behaviours.
To address this gap, the present study investigated the effectiveness of integrating an AR-assisted water resources curriculum into English instruction for elementary school students. The study examined how this curriculum influenced Taiwanese sixth graders’ acquisition of water-related knowledge and English vocabulary. By integrating environmental education with language learning through AR, this study contributes to environmental education research by demonstrating an interdisciplinary, technology-enhanced approach to promoting both environmental literacy and language learning. The study was guided by the following research questions. First, what were the effects of the water resources AR-assisted English curriculum on sixth graders’ acquisition of water knowledge? Second, how did the water resources AR-assisted English curriculum affect sixth graders’ vocabulary learning?
Literature review
A commonly used definition describes AR as a system that incorporates three basic features: combining the real and virtual worlds, interacting with the user in the natural world, and being placed in a 3D space (Azuma, Reference Azuma1997). In other words, AR uses the real environment as the background, adds virtual objects to the actual environment, and then shows virtual reality in a 3D mode (Azuma et al., Reference Azuma, Baillot, Behringer, Feiner, Julier and MacIntyre2001). For the present study, the researchers employed the three characteristics mentioned by Azuma (Reference Azuma1997) as the educational basis. Then, the technique was applied to different technologies, including computer and hand-held devices, to generate meaningful virtual knowledge on water conservation in the real-world context, with reference to the elementary school campus.
Since AR is an emerging technology with advantages for teaching and learning, it is gaining much attention in the educational field (Wu, Lee, Chang & Liang, Reference Wu, Lee, Chang and Liang2013). First of all, AR has a beneficial effect on students’ language development (Rozi et al., Reference Rozi, Larasati and Lestari2021; Yilmaz, Kucuk & Goktas Reference Yilmaz, Kucuk and Goktas2017). In Yilmaz et al. (Reference Yilmaz, Kucuk and Goktas2017) research, ten English e-books were developed with AR technology. Each of the stories featured an educational theme and had animated pages. Through scanning the quick response (QR) codes on the computer screen, children could see 3D animations and listen to the audio stories. Participants were eager to scan the AR marker repeatedly to learn more about the materials, which highlighted the effectiveness of the scanning system in enhancing students’ comprehension and listening skills. In another research by Rozi et al. (Reference Rozi, Larasati and Lestari2021), the AR marker was designed as a flipcard. When the students scanned the marker, spoken and written forms of the word would be displayed, which facilitated students in matching the vocabulary and its sound.
Secondly, living pictures in AR are beneficial to students’ English learning outcomes (Rozi et al., Reference Rozi, Larasati and Lestari2021; Solak & Cakir, Reference Solak and Cakır2017; Tsai, Reference Tsai2020). Tsai (Reference Tsai2020) used 3D living objects made based on students’ paintings to enhance fifth graders’ vocabulary learning. The result of the experimental method indicated that using AR is more helpful for word recognition than using the traditional lecture method.
Additionally, various types of AR image have been shown to improve the retention of words (Rozi et al., Reference Rozi, Larasati and Lestari2021; Santos et al., Reference Santos, Lubke, Taketomi, Yamamoto, Rodrigo, Sandor and Kato2016; Solak & Cakir, Reference Solak and Cakır2017; Wu, Lin & Darmawansah, Reference Wu, Lin and Darmawansah2025). For example, Rozi et al. (Reference Rozi, Larasati and Lestari2021) used AR to present the target English vocabulary in the experimental group while using traditional methods in the control group. In the experimental group, vocabulary was first introduced through colourful pictures or animation, and then pronunciation and sentence usage were demonstrated. Fifth graders’ achievement and recall tests proved that the AR application helped students retain new vocabulary longer in the memory than traditional learning methods and making vocabulary learning more effective.
Finally, the information in the real scenes in AR was considered a beneficial tool for making content comprehensible and learning more meaningful (Chang et al., Reference Chang, Chen and Liao2020; Liu, Reference Liu2009). In Liu’s (Reference Liu2009) research, the My Campus curriculum was designed for seventh graders: it included content related to different areas in the school such as the classroom, library, gym, and laboratory. Students in the experimental group used mobile devices and a campus map for campus environment learning, while the control group used printed materials and CD players. Students in the experimental group could click on the zones, listen to English conversations, watch English clips, and practice conversations with a virtual learning tutor (VLT). During the task-based collaborative learning activity, each team created a piece of a story in English about a zone. The posttest showed that the average grade of the experimental group exceeded that of the control group by eight points, proving that practising English in a real-life scenario is particularly effective for students’ English listening and speaking skills in the context of daily dialogue.
Another study carried out by Chang et al. (Reference Chang, Chen and Liao2020) highlighted the benefits that real-life AR scenarios bring to students’ learning effectiveness. In the research, eight AR teaching videos of English airport conversations were created for junior high school students to practice their English listening and communication skills. The researchers concluded that AR techniques in the situational context of the English classroom enhanced not only EFL students’ learning experience but also their English proficiency. A similar conclusion was reached by Chen et al. (Reference Chen, Wang, Zou, Lin, Xie and Tsai2022). AR-enhanced theme-based contextualised learning had positive effects on students’ preferences and learning effectiveness.
Based on the previous studies, AR instructional strategies and materials were found to be beneficial for students’ learning effectiveness in language educational contexts. The use of AR technology in instruction is consistent with the ideas of multimedia learning theory proposed by Mayar (2009) and can be an effective technique to improve learning experiences. AR-assisted instruction supports the contiguity principle of multimedia learning theory by displaying related words and images that are close in time and place. By giving learners visual and auditory information, as well as interactive elements that allow them to manipulate and explore content, AR-assisted instruction can help to improve knowledge retention (Mayer, Reference Mayer2009).
However, with regard to the previous literature on AR in English instruction, few researchers have focused on the topic of water resources education in the domain of natural science. The body of literature on AR-assisted English instruction has been dominated by experimental research (Chang et al., Reference Chang, Chen and Liao2020; Chen et al., Reference Chen, Wang, Zou, Lin, Xie and Tsai2022; Huang, Reference Huang2009; Lai & Chang, Reference Lai and Chang2021; Liu, Reference Liu2009; Tsai, Reference Tsai2020). Students in the experimental group received English instruction through an AR application while students in the control group learned English via the traditional method. Secondly, as for data collection tools, the majority of the research (Chang et al., Reference Chang, Chen and Liao2020; Hsieh, Reference Hsieh2021; Huang, Reference Huang2009; Lai & Chang, Reference Lai and Chang2021; Liu, Reference Liu2009; Tsai, Reference Tsai2020) used a questionnaire after the course to investigate students’ learning motivation and attitudes toward AR-assisted instruction. Previous studies have proved the positive effects of AR on students’ English learning performance and their attitude toward learning. However, the researchers found that most research in Taiwan only focused on AR-assisted instruction on vocabulary recognition rather than word use in meaningful scenarios. Besides, the technology was mostly used to design content based on English textbooks, which was confined to the subject and lacked real-world issues. Moreover, few studies of the application of AR on students’ misconceptions were found in the previous studies. To close the literature gap, the researcher intended to use AR to develop students’ content and vocabulary knowledge regarding water resources education in the domain of natural science, which is listed as one of the crucial SDGs in our modern society.
The conceptual framework of the study (Figure 1) integrates four pedagogical themes of water conservation education: water use, water cycle, water footprint, and water conservation. These themes are combined with an AR-assisted instructional design to enhance learners’ environmental knowledge, personal awareness, and water-conservation behaviours. The framework highlights three key characteristics of augmented reality: combining real and virtual elements, enabling real-time interactivity, and visualising three-dimensional objects. Grounded in Multimedia Learning Theory (Mayer, Reference Mayer2009), the framework proposes that learners process information more effectively when visual and verbal representations are combined. These AR features are theorised to mediate the effects of the water-education themes on learning outcomes, including content knowledge, vocabulary acquisition, environmental awareness, and behavioural intention.
Conceptual framework of the present study.

Recent studies support the use of AR in environmental and science education. Evidence shows that AR improves comprehension of complex processes, increases engagement, and encourages pro-environmental behaviours (Wang, Reference Wang2012; Wang, Chang & Liou, Reference Wang, Chang and Liou2019). By visualising abstract concepts such as the water cycle and water footprint and providing interactive experiences, AR helps learners connect knowledge with personal experience. Integrating AR affordances with water-education themes provides a research-based pathway in which AR-enhanced instruction supports knowledge acquisition, vocabulary learning, environmental awareness, and intentions for water-conservation behaviours, addressing gaps in previous studies that rarely link multiple water-conservation topics with both cognitive and behavioural outcomes.
Methodology
Using mixed methods allows researchers to triangulate data and capture multiple dimensions of a phenomenon, making the findings more robust and comprehensive compared to single-method studies (Creswell & Clark, Reference Creswell and Clark2017). The aim of this design was to obtain diverse perspectives on the phenomenon under study. For quantitative data collection, a pretest–posttest design was applied, while qualitative data were collected through class observations, interviews, and teaching reflections. By combining quantitative and qualitative approaches, the study can provide a more thorough understanding of both outcomes and underlying processes.
Participants and setting
The study was conducted in Spring Elementary School (pseudonym) in the northwest part of Taiwan, by the side of a renovated drain which used to be a stinky sewage place but now a popular check-in spot. The beautified riverside trail is famous for the dancing water and water plants that provide visitors a place to get to know more about water. Moreover, the school attempts to create a quality educational environment for students to explore new things.
The study involved 23 sixth graders (12 males, 11 females), all of whom had received formal English instruction for at least five years, with two periods per week in the first and second grades and three periods in the third, fourth, and fifth grades. Participants were purposefully selected based on prior experience using iPads in learning activities, which was necessary for engaging with the AR-assisted curriculum. While this ensured that all students could use the technology effectively, it may limit the generalisability of the findings to students with less technological proficiency.
The first researcher implemented the AR-assisted water resources English curriculum during the 2022 fall semester across 13 lessons including one class in the first week and two classes per week for the remaining six weeks. The lessons focused on four main themes: water use, water cycle, water footprint, and water conservation. During each session, students used iPads to scan images provided by the researcher, accessing extended learning materials and interacting with 3D animations. To control for potential confounding effects, subsequent website-based tasks were standardised, and students were instructed to use the website solely for completing follow-up activities directly related to the AR lessons. Any influence of the website on learning outcomes was monitored and considered in the analysis.
Data collection
To collect quantitative data on the impact of the AR-assisted water resources English curriculum, pre- and posttests were administered. The tests were adapted from Huang (Reference Huang2013) and Wei (Reference Wei2021) and comprised fifteen multiple-choice questions covering the main curriculum themes. Content validity was established by having two experts in water resources education and English language teaching review the items and provide revision suggestions. A pilot test was conducted with two sixth-grade classes to evaluate item appropriateness, during which the difficulty level and discrimination index of each question were calculated. One item with a low difficulty value (0.22) was deleted. Reliability was assessed using internal consistency, with the final test achieving a Cronbach’s alpha of 0.84, indicating good reliability.
To compare the difference before and after the water resources AR-assisted English instruction in the participants’ learning of target words, a vocabulary test was conducted. The vocabulary test consisted of three parts: written form, spoken form, and form and meaning of the target words from the four themes. To establish the content validity of the vocabulary knowledge test, two experts in English education were invited to evaluate the comprehensiveness and representativeness of the test items. In addition, in order to evaluate the quality of the test in terms of reliability, the difficulty level and discrimination index of the test questions were measured. In the same manner as the water knowledge test, a trial test of the vocabulary knowledge test was conducted in two classes of sixth graders to ensure the appropriateness of the test. The result showed that one of the items had low discrimination (0.14) and this question item was deleted.
The observation checklist was developed based on the research by Chao (Reference Chao2022). In order to gain a deeper understanding of students’ learning situation, the researchers designed items concerning aspects such as class participation, peer interaction, and learning effects. The researchers observed and recorded participants’ active involvement in the AR learning environment.
The interview protocol was designed on the basis of the studies by Chuang (Reference Chuang2021) and Hsieh (Reference Hsieh2021). The individual interviews were conducted during the recess time between classes. Each interview lasted for about five minutes and was conducted in Mandarin to ensure the students were able to express their thoughts clearly and smoothly. Finally, the interviews were recorded and the transcripts were made. Moreover, the first researcher wrote the teaching reflection right after each class focusing mainly on two aspects of the instruction: the students’ reactions and attitudes toward the learning materials and the challenges and difficulties the teacher encountered in the class.
Data analysis
To analyse the quantitative data, descriptive statistics were used in the study. The researchers calculated the number of students answering correctly in the two water knowledge tests and vocabulary tests for the purpose of comparing the difference between pretests and posttests. Pair sample t-test was used to calculate the P-values of the water knowledge and vocabulary tests in the study. In addition, the accuracy rate was calculated for each item to elicit information about the impact of AR on each water concept and the target word.
Thematic analysis was conducted for the qualitative data. The researchers independently read through the data and generated initial codes relevant to the research questions. To ensure coding consistency, interrater reliability was calculated, and discrepancies between coders were discussed and resolved through consensus. The coded data were then grouped, and overarching themes were identified. To enhance the study’s validity and create a more in-depth understanding of the research questions, data were also triangulated across multiple sources. The pre- and post-tests on vocabulary and water knowledge, observation notes, teaching reflections, and interview notes were used to compare and contrast from each other.
Results
The thematical analysis of qualitative data and descriptive analysis of quantitative data revealed the following major results.
Water knowledge test
The findings show the improvement in students’ water knowledge after the AR-assisted water resources English instruction. As presented in Table 1 a significant difference existed between pretest and posttest scores as P-value is below 0.001. Compared to the pretest (M = 9.67), the mean number of students answering correctly for water knowledge in all of the themes increased in the posttest (M = 19.47).
Compare to pretest and posttest in water knowledge test

As revealed in Table 2, among the four themes, students made the most progress in Theme 3, “Water Footprint” (M = 18.75). The second most improved theme is Theme 1, “Water Use” (M = 17.5), while the third is Theme 2, “Water Cycle” (M = 20.75), and the least improved is Theme 4, “Water Conservation” (M = 21.3).
Results of the water knowledge test

As presented in Table 3, it was found that the correct rate in the pretest of Theme 3 was not high, showing that the students were not familiar with the meaning and definition of water footprint before the curriculum. The highest score was attained for Item 6, “grey water” (n = 14), showing that around 60% of the students could relate the colour grey with polluted water.
Number of students answering correctly in water knowledge tests-theme 3

As in Table 3, for item 9, “water footprints of products” (n = 16), a significant difference was observed between the pretest (n = 2) and the posttest (n = 16). While delivering the lesson, the teacher emphasised the relation between water footprints and the products in their daily lives through a PowerPoint.
To increase students’ knowledge about the amount of water consumed to produce a product, the teacher not only designed AR learning materials but also asked students to go to the website for information on water footprint to finish the worksheets, as shown in Figure 2. To complete the worksheet, the students needed to find out to which product the word refers, such as “egg.” Then they drew the product in the corresponding box and wrote down the total amount of water footprints, such as “3,300 liter/kg” for “egg.”
Student’s worksheet of products and the water footprints.

After completing the worksheet, the students chose one product and read the information paragraph beside the product on the internet. The students then drew a pie chart to present the amount each type of water footprint (blue, green, and grey) accounts for that specific product. As revealed in Figure 3, a “tomato” contains fifty percent green water footprints, thirty percent blue water footprints, and twenty percent grey water footprints.
Student’s pie chart of the three types of water footprints.

The results of the interview identified that the students’ response about attending the class on different types of water footprints was positive. Since the students could search for information on their own, they were motivated to learn, as S22, and S23 claimed in the interview:
I think the most interesting part is that we could search the internet for the percentage of blue water footprint, green water footprint, and grey water footprint that a product contains. [230106 Interview notes-22]
I think searching for the water footprints of a product is very interesting. It was exciting that everyone was eager to know the percentage of different water footprints. [230106 Interview notes-23]
The increasing number of students answering correctly in the posttest presented the improvements made by the learners after the instruction. More students could differentiate between the three types of water footprints in terms of the colours and the definitions. Also, they gained a sense of water being used to produce goods and services in their daily lives, which was rarely mentioned in the textbooks.
Word form of vocabulary knowledge test
As presented in Table 4 p-value is below 0.001, showing that the results revealed a significant difference between the pretest and posttest. With regard to the vocabulary test, participants improved in the posttest (M = 16.1) compared to the pretest (M = 7.19).
Compare to pretest and posttest in vocabulary test

As shown in Table 5, compared to the pretest (M = 6), the number of students answering correctly for items concerning vocabulary form and meaning increased in the posttest (M = 15.7). Of the two parts, students showed greater progress in Part 1, improving by 11.1 than 8.8 in Part 3.
Results of the vocabulary knowledge test on form and meaning

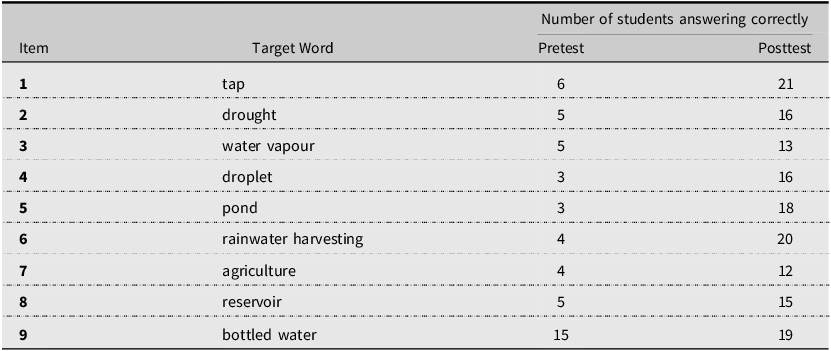
In the water vocabulary test, the number of students answering correctly in the pretest and the posttest for Part 1 is presented in Table 6. In the pretest, except for Item 9, “bottled water” (n = 15), fewer than half of the students answered correctly for the rest of the items. The results showed that the students were not familiar with most of the words before the curriculum.
Number of students answering correctly in part one of the vocabulary tests

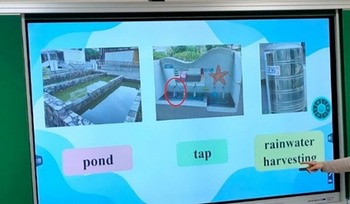
In the posttest, the highest score was attained for Item 1, “tap” (n = 21). Additionally, students improved the most for Item 6, “rainwater harvesting” (n = 20), followed by Item 5, “pond” (n = 18). During the class, the teacher introduced on PowerPoint slides the three words “pond,” “tap,” and “rainwater harvesting” with images taken in the school as presented in Figure 4.
Images of the target words taken in the school.

According to the observation note, as presented in Figure 5, the students’ responses were positive to the school-based learning materials. Some students claimed that they had seen the objects in the school before (#1). When the teacher taught the word “pond,” S10 even shared the experience of seeing a turtle in the pond when he played around (#2). The results showed that the images in the contextualised scenario had positive effects on students’ learning.
Observation notes of students learning effects.

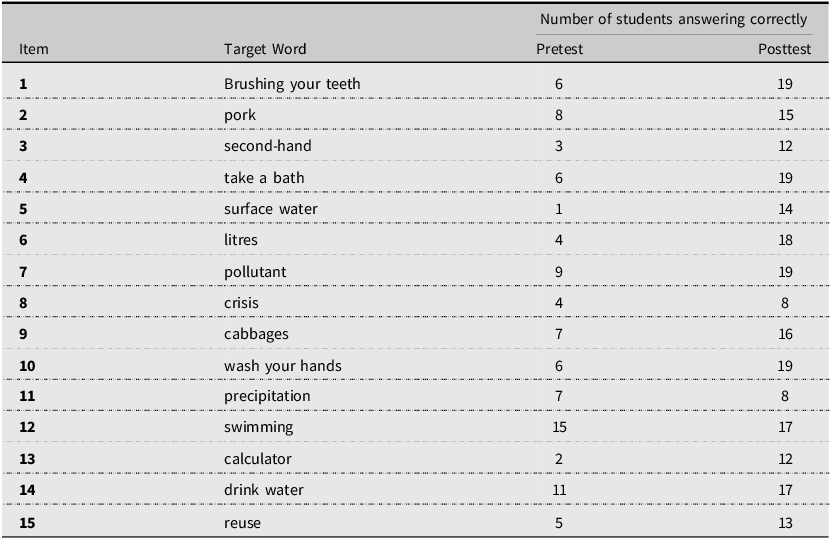
As revealed in Table 7, in the posttest, the number of students answering correctly for the items in this part all increased. Compared to the pretest (n = 4), the students made the most progress in answering Item 6, “liters” (n = 18). In the worksheet mentioned above in Figure 3, the students had to practice writing the unit for at least six times. Besides, the teacher circled the first letter “l” and emphasised that it is the abbreviation for a litre in their maths class. The results of the tests reflected that the methods were effective for students’ learning.
Number of students answering correctly in part three of the vocabulary tests

The highest score was for Item 1, “brushing your teeth” (n = 19), Item 4, “take a bath” (n = 19), Item 7, “pollutant” (n = 19), and Item 10, “wash your hands” (n = 19). At the end of the class, the students were asked to draw a group poster about water resources. As revealed in Figure 6, the best work voted by the class was the one presenting the topic of water-use activities, such as “brushing my teeth,” “taking a shower,” and “washing my hands.” The group members were invited by the teacher to lead the class to read the words and sentences on the poster.
Group poster about water use.

As for Item 7, the students used the iPads to view a virtual city and learn the three types of water footprints. They operated the device to walk around the city and see places with grey (polluted) water, as presented in Figure 7. The students tapped the buttons on the screen to learn the vocabulary with the images, to watch short clips about the concept, and to listen to the pronunciation of the target words such as “polluted,” “pollutant,” and “footprint.”
AR materials about grey water.

The results of the interview indicated that the students had positive perceptions of the use of AR. They considered the insertion of pictures and animation in the context beneficial for learning the English words. For instance, S14 claimed that clear images and spellings were helpful media to acquire the target words. Her claim is as follows:
I think AR is helpful for learning English vocabulary. In it, I can tap the buttons to see the images, spellings, and animations of the words to learn. [230105 Interview notes-14]
In brief, multimedia materials were considered by the participants as useful tools to learn target words. AR-assisted learning materials can provide learners with real-time, interactive, and contextual learning experiences.
Spoken form of vocabulary knowledge test
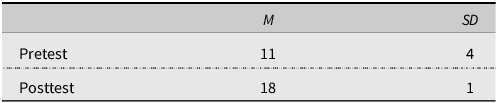
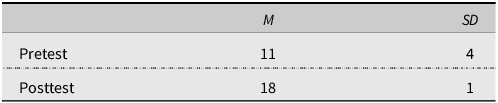
In Part 2 of the water vocabulary test, the participants were asked to recognise the correct spoken form of the target words. The results are presented in Table 8. Compared to the pretest (M = 11), the students made progress in the spoken form in the posttest (M = 18). The highest scores in the posttest were yielded for item 2, “evaporation,” (n = 19) and Item 5, “precipitation,” (n = 19).
The results of part two of the vocabulary test
Simultaneously, the students made the most progress concerning Item 2. In class, when the teacher introduced the terminologies related to the water cycle, she focused on the pronunciation of the words. Figure 8 illustrates how the instructor directed students to split syllables in order to make the words simpler to pronounce. The students were asked to clap hands to sound out syllables, such as clapping 5 times, /e/, /va/, /po/, /ra/, and /tion/, for the word “evaporation.”
Learning materials for pronunciation.

Moreover, the sounds of the target words were recorded in the AR learning material. While the students tapped the word itself, they heard the pronunciation of that word. The advantage of inserting the sounds into the vocabulary was mentioned by the students in the interview. For instance, S23 claimed that it was difficult for her to remember a word if she could not pronounce that word. Thus, she mentioned the positive effects that the audio materials in AR had on her learning:
As I learned the water cycle through AR, I found out that I could hear the pronunciation of the words when I tap the words. The sounds left me with a deep impression of the words so that I could remember them more easily. [230106 Interview notes-23]
As the students heard the pronunciation of the words, they were also required to read the vocabulary aloud. Therefore, the students could keep practising the spoken forms of the water terminologies. According to the results, the effects of the water resources AR-assisted English curriculum on sixth graders’ acquisition of environmental knowledge and vocabulary knowledge proved to be positive for students’ learning outcomes.
Discussion
In order to foster young learners’ water knowledge and vocabulary knowledge, six issues were discussed to effectively integrate augmented reality (AR) into water resources education.
Provision of contextualised scenario via AR for demonstrating the reality and virtuality of water knowledge
In response to the first research question, the results of the tests indicated that the students acquired water knowledge through AR. Compared to the pretest, the learners’ mean scores for water knowledge in the posttest increased by 9.8. The application of the AR technique allowed the participants to learn water resources more effectively in terms of authenticity. In class, the learners acquired the concepts of direct and indirect water use in a virtual kitchen and bathroom. The provision of contextualised environments enhanced students’ comprehension of the knowledge.
The findings of this study align with prior research demonstrating that AR can enhance students’ knowledge acquisition (Chuang, Reference Chuang2021; Yilmaz et al., Reference Yilmaz, Kucuk and Goktas2017; Leitão et al., Reference Leitão, Yao and Guimarães2025). AR merges real and virtual elements, enabling learners to manipulate information in real time and engage with 3D representations, which creates authentic, immersive experiences (Cabero-Almenara & Barroso-Osuna, Reference Cabero-Almenara and Barroso-Osuna2016). Evidence from AR-based educational games suggests additional benefits for attitudes, communication skills, and pro-environmental behaviour (Cai, Pan & Liu, Reference Cai, Pan and Liu2022; Jamrus & Razali, Reference Jamrus and Razali2019; Lynch & Thomas, Reference Lynch and Thomas2024; Leitão et al., Reference Leitão, Yao and Guimarães2025). However, much of the existing research focuses on cognitive outcomes, leaving limited insight into how AR can support environmental awareness and behavioural intentions. This study contributes by integrating water-conservation themes with AR, demonstrating its potential to promote both knowledge and pro-environmental engagement.
Embedding learning within relevant contexts is a key pedagogical strength of AR (Dunleavy et al., Reference Dunleavy, Dede and Mitchell2008). AR scenarios tailored to learners’ needs can guide attention, situating learning in meaningful, real-world contexts (Wu et al., Reference Wu, Lee, Chang and Liang2013). Prior studies have shown that contextualised AR experiences increase engagement and focus on significant issues (Chang et al., Reference Chang, Chen and Liao2020), yet few have examined how such experiences foster environmental awareness or motivate conservation behaviours. By incorporating water-related content within AR scenarios, this study highlights the potential of contextualised AR to connect knowledge with learners’ everyday experiences, enhancing both cognitive and affective outcomes.
AR-enabled interaction on concretisation for learners’ knowledge retention
Regarding the first research question, interactive experiences provided by AR had a positive impact on participants’ learning. In the study, the students played question games when they were in the water-cycle scenario. When the participants scanned the marker, they saw details about evaporation, condensation, and precipitation first. Then they tapped the buttons to answer the questions displayed on the screen. The students discovered that it was a more manageable and efficient way to retain the concepts.
Interactivity is another crucial feature of AR that supports active learning. Previous studies indicate that interactive functions, such as question-posing, allow learners to engage with content more deeply than static media, promoting higher-order thinking and deeper understanding (Cai et al., Reference Cai, Pan and Liu2022; Christou et al., Reference Christou, Vassiliou and Parmaxi2025; Singhal et al., Reference Singhal, Bagga, Goyal and Saxena2012; Lan, Reference Lan2023). Interaction encourages students to observe details carefully and explore underlying concepts (Wu et al., Reference Wu, Lee, Chang and Liang2013). However, prior work has focused largely on general learning outcomes, providing limited evidence of AR’s impact on environmental awareness and behavioural intention. In the current study, interactive AR experiences were integrated with water-conservation content, enabling students to actively explore relevant issues and link learning to real-world behaviour.
By enabling learners to interact with concretised representations of abstract concepts, this study has shown that AR technology can increase students’ learning experiences and retention of knowledge. Thus, the design of AR interaction is suggested for educators to facilitate learners’ achievement and to achieve longer memory retention across a range of subject areas (Perez-Lopez & Contero, Reference Pérez-López and Contero2013; Santos et al., Reference Santos, Lubke, Taketomi, Yamamoto, Rodrigo, Sandor and Kato2016).
AR 3D objects for fostering meaningful learning and transferable knowledge
Concerning the first research question, 3D graphics also had an influence on students’ learning. In the study, the students scanned the marker and saw a 3D city. Walking around the place, the students attained a comprehensive picture of the water footprint network. As a tool, AR promoted students’ active engagement in the learning process and enhanced their water knowledge acquisition.
This is consistent with previous findings (Jamrus & Razali, Reference Jamrus and Razali2019; Lu & Liu, Reference Lu and Liu2014; Lynch & Thomas, Reference Lynch and Thomas2024; Sahin & Yilmaz, Reference Sahin and Yilmaz2020). AR offers a unique opportunity to visualise objects in 3D and explore them comprehensively, which is more effective than traditional 2D representations. Moreover, AR applications that integrate 3D virtual objects into real-world contexts have been shown to facilitate meaningful learning, enhance students’ understanding, and ultimately support improved academic achievement (Cai et al., Reference Cai, Pan and Liu2022; Kaufmann & Schmalstieg, Reference Kaufmann and Schmalstieg2003).
The presentation of 3D objects can create a magical feeling that draws and keeps students’ attention while learning (Yilmaz et al., Reference Yilmaz, Kucuk and Goktas2017). Visualising the information via AR can help students develop meaningful connections between the material and the real world (Santos et al., Reference Santos, Lubke, Taketomi, Yamamoto, Rodrigo, Sandor and Kato2016). Only when new information is linked to previously known knowledge or real-life situations does meaningful learning occur. Learning in real-world contexts improves comprehension of freshly gained information (Chen et al., Reference Chen, Wang, Zou, Lin, Xie and Tsai2022). This can contribute to transferable knowledge that can be applied outside of the classroom.
AR video for word meaning acquisition
In response to the second research question, the results of this study indicated that the use of AR technology had a positive effect on students’ acquisition of the English words. Compared to the pretest, the learners’ mean scores for vocabulary knowledge increased by 9.67 in the posttest. The results indicated that the positive effects of AR on word meaning can be attributed to the interactive nature of the AR video. Students actively engaged with the language material and applied their knowledge in real-world contexts. In the research, the students travelled with characters in the video to experience the process of the water cycle, which enhanced their comprehension and retention of words, such as evaporation, condensation, and precipitation.
AR has been shown to support vocabulary acquisition through visual cues, animations, and repeated exposure (Rozi et al., Reference Rozi, Larasati and Lestari2021; Wu et al., Reference Wu, Lin and Darmawansah2025; Yilmaz et al., Reference Yilmaz, Kucuk and Goktas2017; Solak & Cakir, Reference Solak and Cakır2017; Chang et al., Reference Chang, Chen and Liao2020). Research in EFL classrooms further indicates that AR can enhance learner engagement and self-efficacy during vocabulary learning (Khodabandeh & Mombini, Reference Khodabandeh and Mombini2024). While prior studies have emphasised language outcomes, they rarely integrate domain-specific content such as environmental education. This study demonstrates that embedding vocabulary instruction within AR-enhanced water-conservation lessons can simultaneously support language development, environmental knowledge, and awareness, showing the potential for interdisciplinary, meaningful learning experiences.
AR also offers the advantage of fostering a student-centred approach to learning (Shiue, Hsu, Sheng & Lan, Reference Shiue, Hsu, Sheng and Lan2019). AR technology can be personalised to the individual needs of each student, allowing them to learn at their own pace and level (Chang et al., Reference Chang, Chen and Liao2020). By engaging in active learning through AR, learners are empowered to construct their own knowledge and understanding, which contributes to more meaningful and lasting learning outcomes.
Integration of hands-on activities in learning word forms
With regard to the second research question, the results of the interview data showed that the students acquired the word forms through the integration of hands-on activities in the curriculum. The activities included categorising water footprints and producing water-issue posters. This research showed that providing learners with chances to engage in active, experiential learning can be a powerful tool for improving students’ knowledge of word forms. The findings are in accordance with findings reported by previous studies (Wu, Lin & Darmawansah, Reference Wu, Lin and Darmawansah2025).
Real-time interactivity through AR audio for spoken forms
In response to the second research question, the interview data revealed that the participants acquired vocabulary knowledge of spoken forms by using AR technology during class. In the study, AR provided the students with audio assistance, allowing them to hear how English words were pronounced. The students operated the device to scan the marker, and they could hear the correct pronunciation, making it easier for them to learn and remember the word.
This finding aligns with previous research demonstrating that AR can enhance the learning of spoken English vocabulary (Chang, Tsai & Kang, Reference Chang, Tsai and Kang2015; Chang et al., Reference Chang, Chen and Liao2020; Ho & Suppasetseree, Reference Ho and Suppasetseree2025). Chang et al. (Reference Chang, Tsai and Kang2015) reported improvements in students’ vocabulary retention and oral performance, while Chang et al. (Reference Chang, Chen and Liao2020) found similar benefits for spoken-language practice. AR provides realistic contexts for spoken words, allowing learners to experience language in meaningful, real-life scenarios rather than imagining them (Ho & Suppasetseree, Reference Ho and Suppasetseree2025; Khodabandeh, Reference Khodabandeh2025; Wang, Reference Wang2025). However, most prior studies have focused on general language outcomes, with limited attention to integrating content from other disciplines. The current study extends this work by embedding spoken vocabulary within AR-based water-conservation lessons, demonstrating how interdisciplinary AR experiences can simultaneously support language development and environmental awareness.
AR audio-based interactions can facilitate real-time interactivity (Rozi et al., Reference Rozi, Larasati and Lestari2021). This research demonstrates that by providing learners with interactive and immersive learning experiences, AR technology can effectively engage learners and improve their ability to produce and understand the spoken form of words. Educators can increase learners’ language proficiency and engagement by offering immersive and interactive language-learning experiences through AR audio.
Conclusion
The study investigated the effects of integrating augmented reality (AR) into water-resources education on 23 Taiwanese sixth graders’ water-related knowledge and vocabulary acquisition. It is significant in several ways. First, the study proposed a practical conceptual framework for using AR in water education, helping students visualise abstract water processes and engage in contextualised learning, while providing teachers with an adaptable instructional model. Second, it employed a rigorous mixed-methods design including pre/post-tests, interviews, reflections, observations, and worksheets to triangulate data, strengthening the validity of the findings and offering insights into both learning outcomes and student experiences. Finally, the study contributes to the limited research on AR in environmental education by applying it to water-conservation topics such as water footprint and recycling, demonstrating AR’s potential to enhance environmental literacy and promote responsible water-use behaviours.
Considering the design of the present study, the results were limited in two aspects. First, the research only focused on the effects the AR-assisted instruction had on participants’ water and English vocabulary knowledge. The research design simultaneously involved students’ English proficiency, science abilities, and information technology skills. However, the researcher did not consider students’ core competencies in the three fields on their cognitive load. The study may not accurately capture the cognitive demands of the tasks. Thus, the results may not present the knowledge acquisition of students with different levels of competencies. Further studies can explore the relevance and influence of participants’ subject competencies on their learning performances from a varied angle. Second, the researcher used the app MAKAR to create AR content in the study. The foci were on subject matters and word forms and meaning as well as on spoken forms of the English vocabulary. Future efforts can be coordinated with app developers to create more innovative modes of interaction and a broader variety of learning resources.
Acknowledgements
We gratefully acknowledge elementary school teachers and students for their participation in this study.
Ethical statement
This study was approved by the Institutional Review Board of the authors’ institution.
Financial support
This research received no specific grant from any funding agency, commercial, or not-for-profit sectors.
Author Biographies
Chin-Wen Chien received her Doctor of Education degree from the University of Washington (Seattle, USA). She is a professor in Department of English Instruction of National Tsing Hua University in Taiwan. Her research interests include language education, language teacher education, and curriculum and instruction.
Yan-Tong Wang received her master’s degree from the Department of English Instruction of National Tsing Hua University in Taiwan. Her research interests include language education and curriculum and instruction.









 Open access

