


Introduction
The news media play a powerful role in informing citizens’ judgments of the impact of government activity. This is especially true in relation to evaluations of the economy (Boydstun, Highton, and Linn Reference Boydstun, Highton and Linn2018; Hetherington Reference Hetherington1996)—a massive and multidimensional phenomenon in regards to which direct experience may be of limited relevance (Mutz Reference Mutz1992). Voters’ electoral choices are, in turn, profoundly influenced by their assessments of the state of the economy (Duch and Stevenson Reference Duch and Stevenson2006; Lewis-Beck Reference Lewis-Beck1988). But what is the nature of the economic reality presented by the media? Scholars have made some progress on the issue, exploring the news media’s differential responsiveness to levels and changes of various economic parameters (Soroka Reference Soroka2006; Reference Soroka2012; Soroka, Stecula, and Wlezien Reference Soroka, Stecula and Wlezien2015). What we know little about, however, is whose material welfare the economic news reflects. In particular, how responsive is economic reporting to developments affecting different income groups? When voters turn to the news media for an assessment of economic performance, does the signal that they receive reflect the fortunes of most households or of those located at particular points in the income distribution—whether the middle, the bottom, or the top?
We argue in this paper that the economic news in the United States has, over the last 40 years, painted a portrait of the economy that strongly and disproportionately tracks the welfare of the very rich. Analyzing a vast, original dataset of news articles in 32 high-circulation US newspapers over this period, we uncover clear evidence that reporting on the US economy is descriptively class-biased. Footnote 1 Specifically, the evaluative content of economic news becomes more positive (negative) in periods in which the incomes of the very rich grow (shrink) and is largely uncorrelated with change in the incomes of less well-off Americans, once growth in incomes at the top is taken into account. Put simply, good economic news tracks, above all, the fortunes of the most affluent.
We then seek to understand how this pattern arises. Rather than reflecting a conscious journalistic bias in favor of the interests of the very rich, class-biased economic news, we argue, stems largely from the media’s focus on charting economic performance in the aggregate. Central to our account is the breakdown of the relationship between aggregate economic growth and the welfare of the average American. In the first few decades after World War II, aggregate growth and employment were strongly correlated with the incomes of lower- and middle-income Americans. Since the mid-1980s, however, aggregate economic expansion and contraction have been far more closely tied to the rise and fall of top incomes than to changes in the incomes of the non-rich, likely because of changes in the underlying drivers of growth itself. Moreover, top-end inequality has become a procyclical phenomenon, rising when the economy as a whole is doing well and falling when aggregate performance flags.
This macroeconomic pattern has profound consequences for the informational context in which citizens operate. The fact that the distribution of growth is itself upwardly skewed means that economic reporting focused on economic aggregates yields a news environment that most powerfully reflects gains and losses for the most affluent members of society. Class-biased economic news, in short, emerges from journalistic efforts to track the ups and downs of the business cycle in the context of an economy that distributes income growth in powerfully class-biased ways.
Consistent with our argument, we show that the correlation between economic news tone and growth in top incomes largely disappears once indicators of aggregate expansion and contraction are accounted for. Further, in examining the distribution of media attention to distinct economic phenomena, we find that aggregate expansion—and its correlates, like employment and corporate performance—are far more likely to be mentioned than phenomena related to the distribution of income or wealth. We also show that class-biased dynamics in economic news tone are generic across media outlets varying in ownership structure and partisan orientation. This finding suggests that class-biased economic news reflects a pervasive understanding of the economy as an aggregate phenomenon, rather than a cognitive shortcut for time-pressured reporters in profit-centered newsrooms or an ideological preference imposed by owners, editors, or consumers.
Beyond its direct findings, the analysis below highlights a weak link in the chain of electoral accountability. To the extent that voters’ perceptions of the national economy are shaped by the media (Boydstun, Highton, and Linn Reference Boydstun, Highton and Linn2018; Hetherington Reference Hetherington1996; Nadeau et al. Reference Nadeau, Niemi, Fan and Amato1999; Soroka Reference Soroka2006), the “economy” on which most voters have been voting has, in an important sense, not been theirs. This dynamic helps to explain the puzzling patterns uncovered in previous political economy research. The results suggest an explanation, for instance, of why incumbents presiding over sharp increases in economic inequality in the United States have not been penalized at the ballot box (Bartels Reference Bartels2008; Hacker and Pierson Reference Hacker and Pierson2011; Hicks, Jacobs, and Matthews Reference Hicks, Jacobs and Matthews2016).
To the extent that the paper’s results travel, moreover, they suggest a novel explanation of the broader disconnect between levels of inequality and levels of redistribution (Kelly and Enns Reference Kelly and Enns2010; Kenworthy and McCall Reference Kenworthy and McCall2008; Milanovic Reference Milanovic2000). Where the fruits of economic expansion are captured largely by the most affluent, a news media focused on economic aggregates will spawn an informational environment that directly undercuts non-rich citizens’ pursuit of their distributive interests. This suggests, in turn, important interactions between mass political behavior and comparative political economy. For example, where production regimes (Hall and Soskice Reference Hall and Soskice2001) or growth models (Baccaro and Pontusson Reference Baccaro and Pontusson2016) spread macroeconomic gains and losses broadly, the average citizen may be well served by a news environment that signals how well the economy as a whole is doing. But forms of capitalism that decouple the welfare of most households from aggregate growth create different informational requirements for economic accountability—requirements to which prevailing patterns of economic reporting may be poorly suited.
Mechanisms of Class-biased Economic News Coverage
In referring to “class-biased” economic news, we refer to a differential in the correlation of the valence of economic news with the economic welfare of different socioeconomic groups. Given empirical trends in the income distribution since the 1970s, our specific focus is on news responsiveness to the fortunes of the very rich as compared with the rest of the population. Of particular interest is the possibility of an upward bias: one in which the tone of news coverage of the economy is more strongly associated with the welfare of the very rich than that of the non-rich.
Prior work on bias in news coverage has focused on a range of sources. These include the economic interests of corporate owners (e.g., Gilens and Hertzman Reference Gilens and Hertzman2000; Herman and Chomsky Reference Herman and Chomsky1988), the upper-middle-class composition of the journalistic profession (e.g., Gans Reference Gans2004), and the ideological preferences of news audiences (e.g., Gentzkow and Shapiro Reference Gentzkow and Shapiro2010). A central, shared feature of these varied accounts is their focus on the interests or preferences of producers or consumers of the news. Economic or partisan bias in media content, in these accounts, arises from the disproportionate influence on that content of actors with particular material interests or ideological worldviews.
In contrast, the argument that we advance here focuses on an implicit source of bias in economic news coverage, one that emerges from the interaction between ostensibly neutral journalistic practices and structural biases in the drivers of economic growth.
Covering the “Business Cycle”
We posit the operation among journalists of an understanding—a “mental model”—of the economy that positions the promotion of aggregate expansion as the central, if not exclusive, objective of economic management. In his classic study of American newsrooms, Gans (Reference Gans2004) finds that “responsible capitalism” is among the core values of American journalism and that, in economic reporting, “[e]conomic growth is always a positive phenomenon” (46). “Good” and “bad” economic news, then, are defined by developments that signal or reflect an upturn or a downturn, respectively, in the business cycle—especially in output and its close correlate, employment. In this framework, moreover, distributional questions as such are generally not salient, on the assumption that the benefits of economic growth are typically broadly distributed: as the aphorism goes, “a rising tide lifts all boats.”
Understanding economic performance as a primarily aggregate-level phenomenon, reporters can be expected to focus on broad indicators of economic expansion and contraction, such as GDP growth and the unemployment rate. They may also attend to an array of indicators understood to be predictors or symptoms of aggregate growth. Given a common view of “business conditions” as a core economic foundation, we would expect corporate earnings and valuations (share prices) to receive special attention. The continuous movement of the stock market is likely to be a particular focus of economic coverage given that it seemingly provides a daily update on the overall health of the economy, playing to journalistic interest in novelty and change (Soroka, Stecula, and Wlezien Reference Soroka, Stecula and Wlezien2015). Importantly, reporting on market indices or corporate profits need not be motivated by any specific concern with those most directly affected—for example, shareholders—because these indicators are thought to shed light on the general state of the economy. As Gans (Reference Gans2004) aptly notes, “when anchormen gave the stock market report, even the most detached ones looked cheerful when the market had had a good day, assuming this to be of universal benefit to the nation and the economy” (46).
How might a journalistic focus on economic aggregates generate a class bias in economic news? In principle, it need not. When economic gains and losses are equally distributed, a focus on the business cycle will be equally sensitive to the fortunes of all income groups. However, there is strong reason to believe that, in recent decades, a journalistic tendency to view growth and employment as ultimate yardsticks of economic performance would tend to generate class-biased economic news.
Aggregates and Distribution in the US Economy Since 1980
For much of the postwar era, aggregate growth and employment were relatively closely related to the incomes of the non-rich. Yet this relationship appears to have broken down over the last 35 years. Among the early work recognizing the emerging disconnect was a paper by Cutler and Katz (Reference Cutler and Katz1991), who noted that the economic expansion of 1983–1989 was accompanied by rising inequality in the distribution of income and minimal poverty reduction. For the 1947 to 1989 period, Cutler and Katz find low unemployment to be strongly associated with rising income shares for the bottom three quintiles and falling shares for the top two. However, after 1983, incomes in the bottom quintile fell between 0.5 and 1 percentage points more than macroeconomic variables predicted, given average postwar relationships, while incomes in the top quintile rose by between 1 and 4 percentage points more.
More recent work has confirmed that, over multiple business cycles, it is the very rich whose fortunes rise fastest and fall most steeply with the business cycle. Guvenen, Ozkan, and Song (Reference Guvenen, Ozkan and Song2014) find that in the recessions of 2000–2002 and 2007–2010, while the poor suffered more than those with middle incomes, the (prerecession) richest 1% saw sharper income drops than any group in the bottom 99%. At the trough of the Great Recession, in 2008, percentage losses for the top 1% were about double that for the median earner, whereas losses for the top 0.1% were about three times as large (see also Wiczer Reference Wiczer2014). Since 1985, a 1-percentage-point drop in GDP growth has been correlated with a 4.55% drop in the incomes of the top 0.1% but a 1.08% increase in the income of the median earner. Similar findings hold for unemployment: a 1-point rise in the male unemployment rate is associated with an average income loss of 6.87% for the top 0.1% but only a 1.77% loss at the median (Guvenen, Ozkan, and Song Reference Guvenen, Ozkan and Song2014). The very rich also gain more than the median earner during expansions. During the 1993–2000 and 2002–2007 upswings, the incomes of the top 1% grew by 98.7% and 61.8%, respectively, while the incomes of the bottom 99% grew by only 20.3% and 6.8%, respectively (Saez Reference Saez2016). Bivens and Shierholz (Reference Bivens and Shierholz2018) likewise point to procyclicality in inequality, showing that the wages of the bottom 90% of earners rose as a share of personal income, from 45.8% to 51.1% during the Great Recession and then fell back to 46.6% in 2015 as the economy recovered.
Why have top incomes become exceptionally sensitive to aggregate fluctuations? Explanations are contested, but several studies point to changes in the distribution of demand for skills driven by trade and technical change. Cutler and Katz (Reference Cutler and Katz1991) argue that, during the recovery of the 1980s, while aggregate employment rose—a phenomenon that, on its own, would have benefited lower-paid workers—this aggregate development was overwhelmed by an increase in relative demand for higher-skilled labor, generating a net increase in wage dispersion and income inequality. Aghion, Caroli, and Garcia-Penalosa (Reference Aghion, Caroli and Garcia-Penalosa1999) contend that technological change, especially the spread of general-purpose technologies, has become a key driver of both economic growth and earnings inequality by creating a growing skills premium, particularly as the supply of higher-end skills fails to keep pace with demand (see also Goldin and Katz Reference Goldin and Katz2007; Parker and Vissing-Jorgensen Reference Parker and Vissing-Jorgensen2010). The political economy literature also points to factors such as the increasing financialization of the economy (Lin and Tomaskovic-Devey Reference Lin and Tomaskovic-Devey2013) and the decline of labor unions (Volscho and Kelly Reference Volscho and Kelly2012) that might have simultaneously driven higher rates of economic growth and higher concentrations of income at the top.
It is, moreover, not hard to see why journalists’ prevailing mental models might be insensitive to these recent distributional dynamics. For one thing, making sense of distribution is far more complex than tracking economic aggregates; while aggregates move only up or down, distribution is intrinsically multidimensional. Second, distribution implicates contested values about who should win or lose, and by how much, whereas there has generally been broad consensus on the merits of high growth and low unemployment. Further, for the first decades of the postwar era, a focus on economic aggregates worked: the key indicators of growth and employment had an excellent track record in capturing broad welfare gains and losses (Cutler and Katz Reference Cutler and Katz1991). To the extent that mental models are “sticky,” it is not surprising that journalists’ “growth-is-good” outlook has survived changes in the underlying structure of the economy that were themselves difficult to observe.
In sum, the relationship between the US macroeconomy and distribution over the last quarter century implies that the tone of news focused on economic aggregates, like growth and unemployment, will be characterized by a bias toward the interests of the very rich—even without any conscious intention, on journalists’ part, to deliver a skewed portrait of the economy. To the extent that growth and wage inequality arise from a common source, “good” economic times—understood in aggregate terms—will tend to be accompanied by rising concentrations of income at the top. We should, on this logic, expect economic news focused on the business cycle to more closely track the incomes of the very rich than the incomes of the non-rich, and we should expect the news to become more positive as income inequality—understood as an income skew toward the top—rises. Given the steep concentration of company shareholding among the very rich,Footnote 2 economic assessments tied to corporate or stock market performance will likewise be disproportionately correlated with welfare at the top of the income scale.
This argument does not imply that class-biased economic news emerges apolitically or by pure chance. Political choices in areas such as trade, education, labor relations, and taxation have likely played a major role in tying growth and inequality more closely together in the US in recent decades (see, e.g., Hacker and Pierson Reference Hacker and Pierson2011). Our claim, however, is that class-biased economic reporting itself need not involve any deliberate effort by reporters to overattend to the interests of the rich. Given the underlying distributional biases in the broader political economy, the emergence of class-biased news merely requires that journalists cheer the economy on during periods of aggregate growth and lament its decline in aggregate downturns.
Causal Models
We can usefully formalize our core argument as a simple structural causal model (Pearl Reference Pearl2009):
 $$ NewsTone\leftarrow GrowthAndEmployment\leftarrow \mathbf{X}\to Inequality $$
where X denotes a set of inequality-inducing drivers of growth and employment (e.g., trade or skill-biased technological change). In this model, the drivers of growth simultaneously generate aggregate expansion and higher inequality (i.e., higher income shares for the very rich). Economic aggregates, in turn, drive the positivity of economic news, resulting in a positive correlation between inequality and news tone. Class-biased news arises here from media actors placing a positive value on features of the economy that are systematically correlated with rising inequality, owing to common causes of these features of the economy and rising inequality.
We have further argued that, in search of indicators of the overall health of the economy, journalists are likely to pay particular attention to gauges of corporate performance, such as corporate profits and stock-market developments, yielding the following data-generating process:
 $$ NewsTone\leftarrow CorporatePerformance\to Inequality $$
Again, a positive correlation between news tone and inequality emerges from their common cause, corporate performance itself.Footnote 3
We return to these causal models later in the article when we test the empirical predictions of the “covering the business cycle” mechanism.Footnote 4
Measuring Economic News Tone
The cornerstone of this paper’s analyses is an over-time measure of economic news tone that we develop from a large set of high-circulation US newspapers. Here we describe the construction and validation of this measure.Footnote 5
We measure the tone of the economic news reported in newspapers because of the availability of a longer time series of content for a larger number of sources than would be available for other media, such as broadcast or cable TV news or news websites. Newspapers were selected for inclusion based on three criteria. First, as we wanted to characterize the news environment inhabited by the American voter, our news sources had to collectively capture a substantial share of the media environment. We thus focused on high-circulation newspapers, specifically those in the top 50 in circulation numbers based on data from the Alliance for Audited Media (AAM). Second, the sources had to be available for download as full text via Lexis, Lexis-Nexis Academic, or Factiva. Third, the newspapers had to be available over a sufficiently long period to enable a well-powered time series analysis. Thus, we set a text-availability start-date cutoff of 1994. A total of 32 newspapers met these criteria and entered our sample. Based on historical circulation data from AAM, the newspapers comprising our tone measure accounted for 36.3% of total weekly paid print circulation in 2012.Footnote 6
We began by selecting all stories from these newspapers, across the period for which content was available, that mention the word “economy” or “economic” in the body of the text, along with a mention of the United States or any individual state. The full downloaded sample contained 2,464,089 articles.
Our data allowed us to further restrict the sample of articles in helpful ways.Footnote 7 First, we excluded articles that appeared in the business section because this section (a) is less likely to be read and (b) focuses on the stock market and corporate earnings, which would likely bias results toward a finding of class-biased media responsiveness. Second, we used a machine-learning approach to classify articles as being predominantly about economic developments in the United States, focusing on the headline and first 400 characters of each article (denoted as “Lede-relevant”),Footnote 8 and then restricted the sample on this basis. The objective of this procedure was to reduce the sample’s share of false positives—that is, articles that contained one of our search terms but were not about the US economy.
We measure the sentiment of economic news using a dictionary-based method that evaluates tone by counting negative and positive words. Past work has measured tone in economic news by simply counting the word “recession” (e.g., Blood and Phillips Reference Blood and Peter1995) or by using a small basket of positive or negative economic terms (Hopkins, Kim, and Kim Reference Hopkins, Kim and Kim2017). Our measure of tone was constructed by applying the Lexicoder Sentiment Dictionary (LSD) to our sample (Young and Soroka Reference Young and Soroka2012). This dictionary, which contains 6,016 words coded for positive and negative connotations, together with the Lexicoder program, yields counts of positive and negative words for each article. Each article was given a tone score, defined as $ Tone $
= [(number of positive words) - (number of negative words)]/(total number of words). This score captures the general “charge” of the article, while adjusting for the amount of neutral content. In effect, the approach measures the intensity of positive or negative sentiment by comparing the prevalence of words that are in each category with the prevalence of words that are in the other category and that are neutral in tone. This operationalization rests on the assumption that, within the scope of analysis, the positivity or negativity of words in the dictionary is constant over time and across space and that, in absolute terms, all positive and negative words contribute equally to the tone of the text. Notwithstanding these caveats, the LSD has been found to generate results that are comparable to those produced by human coders when applied to news content (Young and Soroka Reference Young and Soroka2012), and it appears to outperform simpler dictionaries (Soroka, Stecula, and Wlezien Reference Soroka, Stecula and Wlezien2015), although recent work has found that further performance gains are possible with supervised machine learning methods, at least when optimal choices are made regarding the construction of the training set (Barberá et al. Reference Barberá, Boydstun, Linn, McMahon and Nagler2021). Importantly, an LSD-based measure of economic news has also previously been shown to be correlated with the unemployment rate (Soroka Reference Soroka2012).
$ Tone $
= [(number of positive words) - (number of negative words)]/(total number of words). This score captures the general “charge” of the article, while adjusting for the amount of neutral content. In effect, the approach measures the intensity of positive or negative sentiment by comparing the prevalence of words that are in each category with the prevalence of words that are in the other category and that are neutral in tone. This operationalization rests on the assumption that, within the scope of analysis, the positivity or negativity of words in the dictionary is constant over time and across space and that, in absolute terms, all positive and negative words contribute equally to the tone of the text. Notwithstanding these caveats, the LSD has been found to generate results that are comparable to those produced by human coders when applied to news content (Young and Soroka Reference Young and Soroka2012), and it appears to outperform simpler dictionaries (Soroka, Stecula, and Wlezien Reference Soroka, Stecula and Wlezien2015), although recent work has found that further performance gains are possible with supervised machine learning methods, at least when optimal choices are made regarding the construction of the training set (Barberá et al. Reference Barberá, Boydstun, Linn, McMahon and Nagler2021). Importantly, an LSD-based measure of economic news has also previously been shown to be correlated with the unemployment rate (Soroka Reference Soroka2012).
Finally, to generate sample sizes within units that minimize noise and to align with the temporal units for which economic variables are observed, we aggregate article-level Lexicoder scores up to newspaper-quarter mean tone scores. Figure 1 conveys a sense of the temporal variation in the resulting tone variable, plotting the by-quarter circulation-weighted mean of the variable through our sample period.Footnote 9
Time Series Plot of Mean of Standardized, Circulation-Weighted Quarterly Measure of Tone of Newspaper Economic Reporting
Note: Vertical shading indicates recessionary period as defined by FRED database series (USRECQ).

The series has face validity in that it broadly tracks our intuitions about macroeconomic dynamics in the United States during the sample period, with dips around the periods of recession (indicated by vertical shading). In Supplementary Section A2, we provide a more systematic assessment of the validity of our news tone measure. We do so by asking whether the measure is correlated with other phenomena with which it should be correlated. First, we show that the measure is strongly correlated with an independent proxy for economic news tone, a Surveys of Consumers (SoC) item asking about the favorability or unfavorability of information that respondents have recently received about business conditions. Second, using two additional SoC items, we demonstrate that the tone measure is well correlated with phenomena on which a range of prior studies suggests that the economic news has an effect: mass perceptions of business conditions and evaluations of the government’s handling of the economy.Footnote 10 We show, additionally, that these relationships hold not only in “naive” estimations of the correlation but also in a set of models in which we factor out a range of possible alternative sources of a correlation between news tone and the benchmark variables. We demonstrate, further, that the associations between news tone and the benchmark variables are strong not just for the SoC sample as a whole but specifically for respondents in the bottom and middle income terciles—socioeconomic groups of particular normative importance for this paper’s analysis. Finally, we use estimates from a pair of reduced-form vector autoregression models to show that it is very unlikely that the observed association between news tone and economic perceptions is the result of the latter’s effect on the former (cf. Hopkins, Kim, and Kim Reference Hopkins, Kim and Kim2017).
National Descriptive Patterns
We now turn to the paper’s core descriptive concern: does good (bad) economic news tend to appear in periods of broad economic gains (losses) or, rather, in periods when gains (losses) are concentrated on particular income strata? While causal matters occupy our attention in the next section, this prior, descriptive question is of central importance for the workings of democratic accountability. To see why, suppose that voters on average receive more positive economic news in periods of relative gain for the very rich than they do during periods of broadly shared prosperity. If economic news tone affects mass perceptions of the economy and, in turn, votes, then in this situation citizen evaluations and electoral outcomes will tend to reward incumbents who deliver pro-rich economic distributions relative to distributions that allocate gains more equally. The informational environment will be pushing non-rich voters to vote, in effect, against their own income groups’ economic interests. That is the case, moreover, regardless of what forces are causing the correlation between distribution and tone.
To assess the descriptive patterns of interest, we estimate a series of regression models in which economic news tone is the dependent variable and our core regressors are income growth rates in various parts of the income distribution. Specifically, we use growth in pretax income from the World Inequality Database (WID.world) constructed by Alvaredo et al. (Reference Alvaredo, Chancel, Piketty, Saez and Zucman2017). WID.world incorporates the former World Top Incomes Database (Piketty and Saez Reference Piketty and Saez2003), which has been widely used across the social sciences.Footnote 11 WID.world combines administrative data (e.g., personal income tax records), household survey data, and national accounts data (particularly national-income estimates) to provide long time series of information on annual income levels at many points in the US national income distribution, including coverage of top-income categories that are poorly captured in purely survey-based estimates.Footnote 12 We use WID.world measures to construct mean-income growth rates for a large range of income deciles, quintiles, and various subsets of the top decile of the distribution.
The WID.world income variables are measured annually and at the national level. However, we want the evidence presented here to be comparable with analyses later in the paper, where we exploit both between-newspaper variation and variables that are available at the quarterly resolution (as is our dependent variable). Consequently, our unit of analysis is the newspaper-quarter. In order to better match the income data to the unit of analysis, we adopt a procedure akin to that of Palmer and Whitten (Reference Palmer and Whitten1999) whereby we calculate annual growth rates, assign those to the third quarter of each year, and then linearly interpolate the remaining quarterly growth rates. In Supplementary Table B11, we show that the inferences displayed in Figure 2 are unaffected if we, instead, replicate the annual growth rates four times—one for each quarter—for each year.
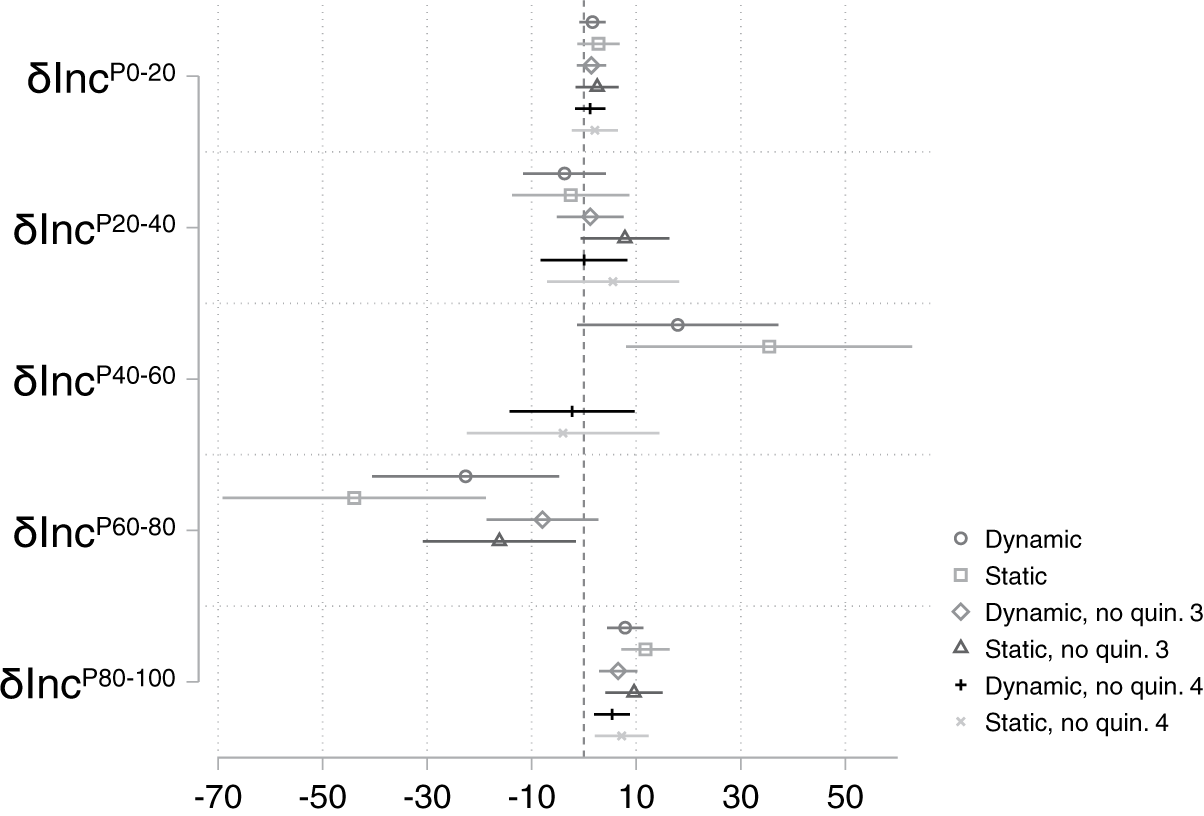
Descriptive Inferences Regarding Association between Economic News Tone and Income Growth for Each Quintile in the Income Distribution
Note: Full results in Supplementary Tables B9 and B10.
Notationally, we refer to growth rates of variables with $ \delta $
and first differences with
$ \delta $
and first differences with $ \varDelta $
. The percentile ranges defining each income group are superscripted. We thus denote the growth rate of, say, the first decile of the income distribution as
$ \varDelta $
. The percentile ranges defining each income group are superscripted. We thus denote the growth rate of, say, the first decile of the income distribution as $ \delta {Inc}^{P0-10} $
.
$ \delta {Inc}^{P0-10} $
.
We employ multivariate analysis so that we can assess the correlation between news tone and each income-growth measure conditional on the other growth measures. This allows us to estimate how closely news tone tracks income growth for one income group beyond its correlation with income growth for other groups. However, this analytical goal, together with the structure of our data, raises the potential for inferences to be undermined by either or both of temporal and spatial autocorrelation in the errors. A common approach to dealing with temporal autocorrelation is to introduce one or more lagged dependent variable (LDV) terms. An LDV is justified if we believe that the tone of economic news is path dependent such that news tone at $ t $
affects news tone at t + 1. At the same time, there are concerns about this kind of specification in the presence of unit fixed effects (Plümper and Troeger Reference Plümper and Troeger2019), which we believe belong in the model. An alternative approach is to treat the two types of autocorrelation as nuisance to be corrected for, thus removing the need for inclusion of LDVs. Under both approaches, corrections can also be applied to account for spatial autocorrelation.
$ t $
affects news tone at t + 1. At the same time, there are concerns about this kind of specification in the presence of unit fixed effects (Plümper and Troeger Reference Plümper and Troeger2019), which we believe belong in the model. An alternative approach is to treat the two types of autocorrelation as nuisance to be corrected for, thus removing the need for inclusion of LDVs. Under both approaches, corrections can also be applied to account for spatial autocorrelation.
As we do not wish our inferences to be driven by model specification choices in this regard, we present results from both (a) a heavily dynamic specification, with four lags of the DV, and (b) a static specification that explicitly adjusts standard errors for correlation across panels and autocorrelation up to four lags.Footnote 13 We provide a more extended discussion of estimation issues in Supplementary Section B2.
The analysis proceeds in three steps. First, we examine the association of economic news tone with income growth for each income quintile in the population. Next, we zero in on top incomes and assess the correlation between news tone and income growth for the highest income quantiles as compared with and conditional on income growth at the bottom and middle of the income spectrum. Finally, we conduct a formal statistical test for the presence of pro-rich bias in the economic news.
Tone–Growth Associations by Income Quintile
We begin by regressing tone on the growth rates of each income quintile, allowing us to observe the partial correlation between tone and growth in one part of the distribution conditional on growth in all other parts. As will become apparent, there are some very high correlations between these by-quintile growth rates,Footnote 14 so we take care to estimate models that do not yield inferences driven by multicollinearity-inflated standard errors. Most importantly for our core goal, the distinctiveness of change in the fortunes of those with the highest incomes means that our inferences regarding these groups suffer much less from this problem.
An initial set of descriptive results, from models that include income-growth rates for each income quintile, are presented in Figure 2. We display here separate estimates from our dynamic and static specifications.Footnote 15 While estimates vary by model specification, several patterns emerge.
We start by focusing on the top two estimates for each quintile, which represent models (dynamic and static, respectively) in which all five quintiles are included. First, we find no evidence that the income growth of the poorest 40% of the population has any association with the tone of economic news. Second, we observe evidence of a positive association between income growth around the median (third quintile) and news tone, together with a negative association for the income growth of the fourth (i.e., second-richest) quintile. These two results, however, must be interpreted with caution because of an exceptionally high bivariate correlation between income growth for the third and fourth quintiles $ \left(r=0.96\right) $
. This very high correlation likely explains the particularly wide confidence intervals for these two sets of estimates and makes it doubtful that the partial correlations for these two quintiles can be reliably separated from one another when both are included in the model. We thus reestimate the associations with models that exclude, one at a time, each of the third and fourth quintiles. These models yield more precise point estimates for these two quintiles. The estimates for these quintiles, furthermore, are either indistinguishable from zero or, in the case of quintile-4 growth in the static model, negatively signed.
$ \left(r=0.96\right) $
. This very high correlation likely explains the particularly wide confidence intervals for these two sets of estimates and makes it doubtful that the partial correlations for these two quintiles can be reliably separated from one another when both are included in the model. We thus reestimate the associations with models that exclude, one at a time, each of the third and fourth quintiles. These models yield more precise point estimates for these two quintiles. The estimates for these quintiles, furthermore, are either indistinguishable from zero or, in the case of quintile-4 growth in the static model, negatively signed.
Finally, across all specifications, income growth for the top quintile displays a reliably positive association with news tone. Indeed, it is the only quintile for which this—or anything even close to it—is true. Note, too, that the top-quintile point estimates appear small only because they are plotted on a scale that must accommodate the wide confidence intervals on other estimates. The correlations are, in fact, substantively large: depending on the specification, a standard-deviation difference in income growth for the top quintile (0.03%), holding growth in the other income groups constant, is associated with a 14–21% of a standard-deviation difference in news tone (instantaneously). To give a sense of scale, economic recession is on average associated with a 43% of a standard-deviation drop in news tone during this period.Footnote 16
Tone–Growth Associations for Top-Income Groups
The analyses presented so far simplify interpretation by assessing how economic news tone relates to the welfare of a set of equal-sized income groups collectively covering the entire income spectrum (except where noted). Given the extreme concentration of incomes at the high end of the income scale in recent decades, however, we might wonder whether the association between top-quintile income growth and news tone is in fact driven by income growth at the very top of the distribution—that is, in the topmost slice of the top quintile (say, the top 5% or top 1%). A question of key normative importance is whether the economic news more closely tracks the fortunes of the very rich, in particular, than the fortunes of other income groups.
As a first step in answering this question, we seek to get a good estimate of the association between top-income growth and news tone, for various slices of the top end of the distribution. We do so by estimating a set of models including growth rates for different top-income quantiles. As we saw in Figure 2, there are nontrivial issues of multicollinearity across the income-growth measures for various parts of the income distribution. Our primary interest for this next set of analyses is in assessing tone associations with top-income growth rather than estimating the (multicollinearity-afflicted) associations of news tone with growth for each of the other parts of the income distribution. Consequently, to mitigate multicollinearity issues, we adopt a core specification that includes bottom-quintile growth and middle-quintile growth and then add the various top-income growth measures across different models. We exclude fourth-quintile growth because of the severe multicollinearity issue that arises when including both this quintile and the middle-quintile; this choice maximizes the prospects of finding an association between news tone and growth at the theoretically important median. We also exclude the second quintile given the evidence of noisy estimates for this quintile in Figure 2;Footnote 17 lower incomes are thus represented in these models by the bottom quintile. Finally, as the evidence from Figure 2 indicates that inferences are not meaningfully driven by the use of the dynamic versus the static specification of our models, for presentational simplicity we adopt only the former from this point.
Figure 3 shows the core estimates from these top-income models. In each of the four models, we include a different top-end income quantile: top 10%, top 5%, top 1%, or top 0.1%. These results strongly suggest that the top-quintile growth association with news tone is in fact driven by income growth within the top decile.Footnote 18 Indeed, there is remarkable stability in the estimated top-income coefficients as we move through models focusing on increasingly small top-end income groups. To give a sense of magnitude, a one-standard-deviation change in income growth rates for the top 1% is associated with an (instantaneous) change in news tone of 11% of a standard deviation, compared with 43% for a recession. Moreover, we continue to see in these models no statistically significant association between middle- or bottom-quintile income growth and news tone. In short, Figure 3 provides fairly robust evidence that top-income growth is consistently statistically associated with news tone—and no such evidence for income growth of the poor or an approximation of the median income earner.
Descriptive Inferences Regarding Association between Economic News Tone and Income Growth at Various Points in the Income Distribution
Note: Full results in Supplementary Table B14.

Assessing Pro-Rich Bias in News Tone
Having assessed the partial correlations between top-end, median, and low-end income growth rates and news tone, we turn now to assessment of the presence and degree of income-group bias in news-tone movements.
We note first that the above results cannot directly address this issue. One reason is that, in a normative sense, the coefficients for the different income groups should be rescaled to reflect the relative sizes of the populations to which they correspond. We can see the issue most clearly if we think of the relationship between news tone and groups’ welfare as akin to one of representation. Let us assume a normative democratic ideal in which every resident’s economic welfare should receive equal weight in any account or assessment of the state of the economy. Under this normative standard, we would expect the material well-being of equal-sized groups to receive roughly equal “representation” in reporting on the economy; and we would, likewise, expect larger groups to receive greater weight in the economic news than smaller groups. Thus, for instance, if we observed that the economic news was roughly as well correlated with welfare changes for the top 1% as with welfare changes for the bottom 20%, we would, against this normative benchmark, be observing a descriptive bias in the economic news in favor of the top 1% relative to the bottom fifth.
In Supplementary Section A4, we demonstrate this logic algebraically. That analysis also shows that the relevant inference when comparing the strength of the association between news tone and income growth at two different parts of the income distribution is not whether the coefficients are statistically distinguishable from each other in magnitude but rather whether their ratio is statistically distinguishable from the ratio of the underlying proportions of the population captured by each part of the income distribution. When comparing income quintiles (i.e., where the income groups are equally sized), this collapses to a comparison of the raw coefficients. However, when comparing the income growth of, say, the top 1% against the bottom 20%, we must account for the fact that the latter group is 20 times larger than the former, and so, under a normative baseline of equal tone-responsiveness across income groups, should have a coefficient that is 20 times larger. Given this logic, we focus on presenting the estimated ratios of relevant coefficients, rather than the raw coefficients themselves (which are available in Supplementary Table B16).
On this basis, we estimate models that allow us to assess the degree of descriptive pro-rich bias in news tone. The core specification that we adopt here contains income-growth rates for three income groups: the bottom 20%, the top X%, and the broad middle from the 20th percentile to the lower threshold of the top-X% group—where we estimate models with $ X\in \left\{\mathrm{10,5,1,0.1}\right\} $
to assess the robustness of the inferences to progressively narrower conceptions of “top income.” This core specification allows us to achieve coverage of income growth across the full income distribution, ensuring that the proof for the inferential test of coefficient ratios (derived in Supplementary Section A4) applies while avoiding the high levels of multicollinearity that arise from including a large number of income groups. Breaking out the bottom 20% from the broad middle, further, allows the opportunity for a normatively interesting comparison of the relationship between news tone and top-income, broad-middle-income, and bottom-income growth, respectively.
$ X\in \left\{\mathrm{10,5,1,0.1}\right\} $
to assess the robustness of the inferences to progressively narrower conceptions of “top income.” This core specification allows us to achieve coverage of income growth across the full income distribution, ensuring that the proof for the inferential test of coefficient ratios (derived in Supplementary Section A4) applies while avoiding the high levels of multicollinearity that arise from including a large number of income groups. Breaking out the bottom 20% from the broad middle, further, allows the opportunity for a normatively interesting comparison of the relationship between news tone and top-income, broad-middle-income, and bottom-income growth, respectively.
We separately present results for a comparison of the broad-middle income growth to the top (Figure 4a) and for a comparison of the bottom to the top (Figure 4b). For each top-income measure, the circle represents the estimated ratio of news tone’s association with income growth for the relevant non-rich group to news tone’s association with income growth for the top-income group. We see that, in Figure 4a, for all four top-income measures, the ratio of tone’s association with middle-income growth to tone’s assocation with top-income growth is statistically indistinguishable from zero. Meanwhile, the diamonds represent the group-size-based normative baseline of unbiasedness for each top-income measure. We do not plot the diamonds for the top-0.1% models because these values (799 for Figure 4a and 200 for Figure 4b) would be located so far to the right that the x-axis scales would be too large to clearly read off the inferences for the other top-income groups. The core message of Figure 4a is that, across all four top-income measures, the estimated ratios are much lower than the normative baseline: in other words, news tone’s association with top-income growth is far stronger, relative to that with middle-income growth, than would be expected on the basis of an equal weighting of the welfare of individuals across the income distribution. As the confidence intervals indicate, the inferences in this regard are extremely clear. Figure 4b displays, with respect to the bottom-top comparison, a remarkably similar pattern of stark overrepresentation of the welfare of the very rich in the tone of the economic news.
Estimated Coefficient Ratios from Models Predicting Economic News Tone with Income Growth for Different Parts of the Income Distribution
Note: Diamonds indicate normative baseline for each coefficient ratio, assuming the normative standard of an equal per capita association with news tone for all income groups. Normative baselines for top-0.1% models not plotted to avoid unhelpful scaling of x-axis. Underlying results in Supplementary Table B16.

Because we have estimated models using national-level economic indicators, one potential concern might be a form of ecological fallacy: the subnational regions in which inequality is rising might not be the regions in which positive economic news is being reported. Compositional effects could thus lead national-level inferences astray if we operate only with national economic measures. In Supplementary Section A5, we show that matching newspapers to state-level distributional income-growth data—calculated using the same methodology as employed for our national data (Sommeiller, Price, and Wazeter Reference Sommeiller, Price and Wazeter2016)—yields the same inferences of pro-rich bias in news tone at the state level as we find using national-level data.
In summary, the descriptive pattern is one in which voters are receiving a portrait of the national economy that, to a stunning degree, overrepresents the economic experiences of those with the highest incomes. Given the stability of this inference across different definitions of the top-income group, the estimations in the remainder of the paper operationalize the top-income group as the top 1% (i.e., $ P99-100 $
). This choice avoids a large proliferation of models while focusing inferences on a subset of the population that is undeniably extremely affluent.
$ P99-100 $
). This choice avoids a large proliferation of models while focusing inferences on a subset of the population that is undeniably extremely affluent.
Explaining Class Bias in Economic News
We turn now to explanations for the normatively troubling association between economic news tone and top-income growth. We focus first on examining empirical implications of the central mechanism we have theorized, in which a journalistic focus on covering the business cycle interacts with the distributional structure of aggregate gains and losses in the economy. We next examine evidence for alternative explanations grounded in the costs of news production and in news producers’ or consumers’ distributional preferences. The models presented in this section all deploy our dynamic panel specification from the previous section, with newspaper-quarters as the unit of observation. Supplementary Section A1 provides full details of the sources of variables used in this section.
Economic News as Business-Cycle Coverage
Can the upward class bias in economic news be explained in part by the news media’s tendency to track the business cycle? We address this question by testing empirical predictions of the two structural causal models presented in the theory section.
Macroeconomic Aggregates
In causal model 1, the drivers of economic growth simultaneously cause aggregate expansion (i.e., growth and employment) and higher inequality. Meanwhile, higher growth and lower unemployment generate more positive economic news.
We can derive multiple predictions from this logic. First, news tone should be positively correlated with inequality. Second, news tone should be correlated positively with GDP growth and negatively with unemployment rates. A third prediction—one more specific to the aggregate-centered-journalism explanation for class-biased economic news—is that any correlation between inequality and news tone should be weaker conditional on the macroeconomic aggregates than it is unconditionally. In the language of Pearl (Reference Pearl2009), conditioning on the macroeconomic aggregates should, under this causal model, “block” the path running between news tone and inequality, eliminating any correlation between the two that arises from this path (while potentially preserving other sources of correlation not captured in the model).Footnote 19
We test these predictions at the national level via a set of models, reported in Table 1.Footnote 20 We begin by translating the descriptive results for quantile-specific income growth rates, reported in the previous section, into a corresponding summary result for change in income inequality. To the extent that the news is more responsive to income gains and losses for the rich than to those for the non-rich, positive news tone should also be positively correlated with changes in income inequality in the form of changing income shares for the very rich. We demonstrate this point empirically in Models 1 and 2. Model 1 shows, consistent with results presented in the last section, that news tone is strongly and positively correlated with income growth for the top 1%, conditional on income growth in the middle and bottom quintiles, and that news tone is uncorrelated with growth at the bottom and in the middle of the income scale. Model 2 then directly estimates the association of news tone with changes in income inequality, defined here as growth in the top-1% income share. Consistent with the first prediction, above, we observe a positive and precisely estimated association between news tone and change in top-end income inequality.
Estimates of Association between Economic News Tone and Aggregate Economic Variables

Note: OLS with panel-corrected standard errors.
In Model 3, we add current-quarter GDP growth to the equation alongside change in top-1% income share. Consistent with the second prediction from the causal model, we see that GDP growth is a powerful, positive predictor of news tone. Further, consistent with the third prediction, we see that conditioning on GDP growth dramatically reduces the original correlation (from Model 2) between news tone and change in top-1% income share, cutting the coefficient in half. In Model 4, we test the same two predictions with respect to GDP growth’s close correlate, the unemployment rate. Placing change in the unemployment rate on the right-hand side of the model, alongside change in top-income share, we see that unemployment change is a strong negative predictor of news tone (second prediction) and that its inclusion in the model similarly slashes the correlation between news tone and top-income share in half (third prediction). In Model 5, we include both macroeconomic indicators in the model, achieving a further reduction in the tone-inequality association.
We also note that the estimated effect of GDP growth is substantially reduced by the inclusion of unemployment in the model. One possible reason is that unemployment coverage swamps GDP coverage because the unemployment rate is officially reported more frequently (monthly) than the growth rate (quarterly). A second possibility is that the effect of GDP growth on news tone is partly mediated by change in unemployment. Journalists might directly attend more to employment because of its seemingly more direct relationship to households’ material welfare.
To be clear, the model estimates that we present cannot tell us whether journalists are reporting on either of the particular indicators in our analyses. They may well be doing so. Yet the results are also consistent with journalistic coverage of any number of close correlates of aggregate expansion and contraction, such as business or consumer confidence, retail sales, manufacturing activity, inventories, interest rates, or corporate performance. When reporters cite these auxiliary measures, they are typically doing so in an effort to characterize the overall state of the economy. Whether journalists have taken their cue from growth or unemployment figures themselves or from various “leading” or “lagging” indicators, they appear to have been tracking aggregate processes of recession and recovery that, at least in recent decades, have been concentrating losses and gains, respectively, at the very top of the income scale.
Corporate Performance
To the extent that journalists seek to report on aggregate economic expansion or contraction, they are likely to attend closely not only to macroeconomic aggregates but also to corporate performance. A thriving corporate sector is commonly seen as a key pillar of economic success. In turn, corporate performance, particularly as reflected in share values, is likely to be much more strongly correlated with the fortunes of the rich than with those of the rest of the population, given the strong upward skew in the distribution of share ownership. We have captured this underlying logic in causal model 2.
Causal model 2 has two distinctive empirical implications: (1) corporate performance should be correlated with news tone and (2) controlling for corporate performance should reduce the size of the correlation between top-end inequality and news tone, as conditioning on corporate performance blocks a path connecting these two variables. We capture corporate performance using stock-market indices, for two reasons. First, leading stock-market indices are likely to capture the performance of those corporations whose earnings are most likely to be newsworthy. Second, as discussed above, financial-market developments are likely to be accorded special weight by novelty-seeking news media because they are the most frequently measured national economic phenomena.
In our primary analyses, we measure stock market performance using the New York Stock Exchange Composite Index (NYSEt ).Footnote 21 Table 2 reports tests parallel to those we performed for macroeconomic aggregates. For ease of reference, we provide under Model 1 the previously reported baseline national-level descriptive association between news tone and change in top-1% income share. In Model 2, we introduce NYSE growth and observe a strong, positive, and precisely estimated effect. Further, the parameter point-estimate for top income-share change drops by around one third. These results are consistent with a mechanism in which financial-market movements both drive news tone and generate part of the association between news tone and top-end inequality.
Estimates of Association between Economic News Tone, Change in Top-1% Income Share, Growth in NYSE Composite Index, GDP Growth, and Change in Unemployment

Note: OLS with panel-corrected standard errors.
Given that financial market developments are likely to be correlated with growth and unemployment, we cannot assume that each provides independent explanatory purchase on the class bias in economic news. Thus, in Models 3 and 4 we add, successively, GDP growth and change in unemployment to the model. In Model 4, inclusion of both macroeconomic aggregates further reduces the point estimate for the coefficient on change in top-income share; more than 60% of the unconditional association is now gone while the associated standard error remains stable throughout. Meanwhile, both unemployment change and NYSE growth remain strong predictors of news tone; the coefficient on each variable is unaffected by the inclusion of the other.Footnote 22
In sum, we find considerable evidence of the operation of a mechanism in which stock-market gains generate both higher concentrations of income at the top and more positive economic news. We emphasize, further, that we are picking up all effects strictly outside of business sections, where we might reasonably expect a focus on financial markets and developments favoring the most affluent.
Finally, in Supplementary Section A5, we estimate parallel models for macroeconomic aggregates and corporate performance using state-level data. Results for the former are consistent with those using national-level data. For the latter models, we find that a third of the unconditional association between state-level inequality and state-level news tone disappears when NYSE growth is added to the model. Strikingly, all of the unconditional association between state-level inequality and state-level news tone disappears when stock market movements and state-level macroeconomic aggregates are included together.
Topic Salience
The analysis of mechanisms to this point has focused on implications relating to expected conditional correlations between news tone and various economic developments. We turn now to a distinct form of evidence, asking whether the distribution of media attention across economic topics is consistent with our argument.
Figure 5 displays, for a key set of topics, the results of human coding of a random subsample (n = 2,000) of our sample of economic news articles.Footnote 23 Each article was coded for whether it mentioned each of a wide set of economic phenomena; coding was such that a given article could be coded as mentioning multiple phenomena.
Scatter Plots of the Proportion of Newspaper Articles Mentioning Various Topics, as Categorized by a Human Coder, by Quarter
Note: Lowess curves are shown to smooth noise in each series.

The figure’s four panels report results for the four economic developments that have featured on the right-hand side of the statistical models in this paper, displaying for each the proportion of articles over time that mention that topic. Comparing overall levels of attention, we see that employment, corporate performance, and the economy-in-aggregate feature prominently in economic reporting, consistent with our inferences from the models. Most striking, and of central importance to our theoretical claims, is the predominance of references to the economy as an undifferentiated aggregate. Moreover, we see that inequality—defined as any mention of the distribution of or disparities in material resources—receives vanishingly little attention. We extend the analysis in Supplementary Section A6, showing results for a set of additional economic phenomena with distributional implications—average, median, or low-end earnings; poverty and material need; and executive compensation. Of these categories, only poverty and material need are consistently mentioned in more than 10% of the sample, and all are far less prominent than mentions of the aggregate economy or corporate performance (see Supplementary Figure A3). On the whole, patterns of topic salience lend considerable support to a theory of economic reporting in which journalists cover the business cycle while failing to attend to who loses or gains as the economy expands and contracts.
Alternative Mechanisms
As we previously noted, prior work on skewed patterns of reporting has focused on the interests or preferences of those actors who produce or consume the news. We lack micro-level measures of the distributional preferences of newspaper owners or reporters, which would allow direct tests of these mechanisms. A reasonable proxy for those preferences, however, is the measure of newspaper “slant” developed by Gentzkow and Shapiro (Reference Gentzkow and Shapiro2010). These authors estimate the similarity between the language used by a news outlet and the language employed by Republican as compared with Democratic lawmakers in the Congressional Record. To the extent that the news reflects owners’, journalists’, or readers’ distributional preferences, those preferences should also be reflected in partisan alignments, given the two parties’ widely differing stances on distributional issues. Put differently, if class-biased news derives from less-egalitarian motives or attitudes among those who direct, produce, or consume the news, that class bias should be stronger among more Republican-aligned newspapers than among more Democratic-aligned newspapers.
In Supplementary Section A7, we report analyses testing for the moderating effect of partisan slant on class bias in economic news coverage. We find no evidence that Democratic-leaning newspapers are less likely to deliver class-biased economic news than are Republican-leaning outlets, suggesting it is unlikely that class-biased reporting arises from editorial or owner preferences that favor the interests of the rich.
We might also consider a variant of our “covering the business cycle” logic that focuses more on the costs of news production than on pervasive understandings of the economy. Growth-oriented reporting might emerge from editors’ and reporters’ need to economize on time and other resources. Just as Dunaway and Lawrence (Reference Dunaway and Lawrence2015) argue that “game frame” campaign reporting is less costly than issue-oriented reporting (45), it may be cheaper for news rooms to track aggregate economic developments than to dig into distributional dynamics beneath the surface. Reporters may, thus, operate on a “covering the business cycle” model not because of its strong postwar track record or deep cognitive embeddedness but because it is a low-cost method of summarizing economic complexity.
We can test for this possibility by exploiting variation in the strength of economizing pressures across newspapers and over time. Dunaway and Lawrence (Reference Dunaway and Lawrence2015) argue that news organizations that are owned by publicly traded corporations—under pressure to meet earnings targets and boost share values—face stronger short-run profit-seeking imperatives and cost-cutting pressures than privately-held outlets. Thus, if class-biased reporting emerges from a focus on aggregates as a lower-cost news-production model, we should expect this bias to be stronger for newspapers owned by publicly traded companies than for privately held companies. We should further expect the bias, and the conditioning effect of ownership, to be stronger after about 2000, when the sector as a whole saw a reversal of fortune as print revenues began to plunge.
We report details and results of national- and state-level models, interacting public-company ownership with aggregate economic indicators and top-income shares in both the full period and post-2000, in Supplementary Section A7.Footnote 24 Across the specifications tested, we see little evidence that a focus on aggregates is concentrated among newspapers under greater cost-cutting or profit-maximizing pressures. The one exception appears to be a greater focus on state-level mean-income growth among newspapers owned by public companies (Models 3 and 4, Supplementary Table A19). This greater focus on mean income, however, does not cash out as greater class bias for this group of newspapers, as we see in the lack of an interaction with state-level top-income shares in Supplementary Table A19 (Models 3 and 4). These results as a whole provide little support for the notion that class-biased news emerges from cost-cutting journalistic methods.
Conclusion
A class-biased informational environment, shaped by skewed economic news, may partially reconcile the fact of rapidly mounting economic inequality with nominal political equality. More specifically, the paper’s findings provide a possible explanation for the puzzling pattern of class-biased economic voting in the US (Bartels Reference Bartels2008). It is not terribly surprising that non-rich voters more strongly support incumbents overseeing rising income concentrations at the top if the favorability of the news environment systematically tracks the relative welfare of the rich.Footnote 25
The argument also has implications for the longer-term dynamics of inequality, pointing to a mechanism of positive feedback that could perpetuate distributional biases. The starkly skewed distribution of the fruits of economic growth in the US is, at least partially, the outcome of political battles won by groups representing the interests of the richest Americans (Hacker and Pierson Reference Hacker and Pierson2011; Saez and Zucman Reference Saez and Zucman2019). Yet the more unequally growth is distributed, the less informative aggregate-focused economic news becomes about economic developments affecting lower- and middle-income voters. Non-rich voters are likely, in turn, to become less well informed about their distributional interests, facilitating further downstream political victories by the most affluent.
Importantly, the preceding logic cuts both ways: whereas aggregate-focused economic news may compound the prior political victories of the most affluent, distributionally sensitive economic reporting has the potential to undo those same dynamics. Economic data to support such reporting exist, including Census Bureau estimates of median incomes and poverty rates. Yet distributional indicators are released infrequently—often only annually—which, in a news environment biased toward change, disadvantages these data by comparison with, for instance, the unemployment rate (released monthly) or the stock market (tracked continuously each business day). More frequent releases of distributional measures by government statistical agencies would likely facilitate economic reporting that is better attuned to the welfare of low- and middle-income households.
One possible way of building on the present analysis would be further geographic disaggregation within the US. While we have established national- and state-level relationships, inequality time series at lower levels are emerging.Footnote 26 Their extension, together with content from a broader set of local newspapers, would enable examination of how local reporting responds to differential material gains and losses of local income groups and provide additional leverage for causal inference.
A second direction would investigate whether class-biased economic news explains a disconnect between distributional outcomes and citizen demands in a broader set of capitalist democracies (Hicks, Jacobs, and Matthews Reference Hicks, Jacobs and Matthews2016; Kenworthy and McCall Reference Kenworthy and McCall2008; Milanovic Reference Milanovic2000). Findings from Parker and Vissing-Jorgensen (Reference Parker and Vissing-Jorgensen2010) suggest that the relationships we uncover in the US might unfold in other countries, but to varying degrees. Across a set of 10 countries, they find that growing top-1% income shares are associated with the increasing procyclicality of top-1% incomes. If top-end procyclicality and growing income differentials indeed travel together, the implications for distributional politics are sobering: a media that covers the business cycle will generate a stronger pro-rich skew in news content precisely in those contexts where class-biased reporting will be most misleading—where the fortunes of the rich diverge most sharply from the fortunes of the rest.
Supplementary Materials
To view supplementary material for this article, please visit http://dx.doi.org/10.1017/S0003055421000137 (for Supplementary Materials A) and Jacobs et al. (Reference Jacobs, Matthews, Hicks and Merkley2021) on APSR Dataverse (for Supplementary Materials B).
DATA AVAILABILITY STATEMENT
Replication files and Supplementary Materials B are available at the American Political Science Review Dataverse: https://doi.org/10.7910/DVN/Q9E8RF.
ACKNOWLEDGMENTS
We are grateful to Keith Banting, Erik Bleich, Martin Gilens, Aaron Hoffmann, Torben Iversen, Mark Kayser, Paul Kellstedt, Mark Pickup, Jonas Pontusson, David Rueda, Stuart Soroka, Katerina Tertytchnaya, Laurel Weldon, and Lori Young for very helpful comments on earlier drafts. We also benefited greatly from feedback from audiences at the 27th Annual Conference of the Society for the Advancement of Socio-Economics, London (2015), the American Political Science Association Annual Meeting, Philadelphia (2016), a workshop on “Social and Political Inequality” at the Vienna University of Economics (2016), the Canadian Political Science Association Annual Meeting, Vancouver (2019), the University of Gothenburg, the University of Zürich, the University of Konstanz, the University of Cologne, the University of Mannheim, the Hertie School of Governance, and Simon Fraser University. Alberto Alcaraz, Emily Beatty, Rachel Darby, Abu Kamat, Emil Lauritsen, Katie Lay, Leise Sandeman, Arian Zand, and Amy Zhang provided invaluable research assistance. We thank Johanna Dunaway for access to her newspaper ownership data.
FUNDING STATEMENT
The authors acknowledge the generous support of the Social Sciences and Humanities Research Council of Canada (Grant #435-2014-0603). Hicks gratefully acknowledges financial support from a Leverhulme Trust Research Fellowship (RF-2017-227\7).
ETHICAL STANDARDS
The authors affirm this research did not involve human subjects. The authors declare no ethical issues or conflicts of interest in this research.


 Open access
Comments
No Comments have been published for this article.