


Statement of Research Significance
Research Question(s) or Topic(s):
This study aimed to explore whether three cognitive patterns, or “clinical pearls,” of executive dysfunction could be confirmed in a large group of people with Parkinson’s disease (PD). The focus was three key cognitive pearls: letter < category fluency, delayed recall of a word list < story recall, and delayed recall < recognition.
Main Findings:
Statistically, the findings supported these patterns on average. However, significant variation was seen across individuals and the effect sizes were small for two pearls. This variability highlights the complexity of cognitive changes in PD.
Study Contributions:
This research emphasizes the need to carefully evaluate common patterns of cognitive weaknesses in Parkinson’s disease before routinely using them in clinical settings. These patterns may serve as supportive indicators of executive dysfunction in PD and should be a part of a more comprehensive cognitive assessment when identifying executive function problems in individuals with PD.
Introduction
Clinical decision-making in neuropsychological assessment often involves two complementary interpretive approaches. The first examines absolute impairment, typically through comparison to normative data, though this method has limitations related to individual variability and contextual factors. A more individualized approach assesses change relative to estimated or documented premorbid functioning, capturing meaningful decline that may not meet traditional impairment thresholds. The second approach focuses on intra-individual patterns of strengths and weaknesses across cognitive domains, aiding in the differentiation of global versus selective deficits. Together, these interpretive strategies enhance diagnostic precision and inform targeted intervention planning.
In this study, we examined whether individual differences in three specific neuropsychological patterns, commonly observed in Parkinson’s disease (PD), are present in a large PD sample and how these patterns relate to executive functioning. Executive dysfunction is one of the most well-recognized cognitive sequelae of PD, often emerging early due to dopamine depletion and degeneration within frontal-subcortical circuits, particularly the associative loop connecting the basal ganglia and prefrontal cortex (PFC) (Alexander et al., Reference Alexander, DeLong and Strick1986; Brown et al., Reference Brown, Hakun, Lewis, De Jesus, Du, Eslinger, Kong and Huang2023; Hirano, Reference Hirano2021). The PFC itself consists of multiple subregions that may be differentially affected in PD, contributing to varied profiles of executive dysfunction (Foerde & Shohamy, Reference Foerde and Shohamy2011). Despite substantial functional overlap among these regions, differences in vulnerability likely underlie the considerable heterogeneity observed in executive dysfunction across individuals with PD (Arrigoni et al., Reference Arrigoni, Antoniotti, Bellocchio, Veronelli, Corbo and Pisoni2024; Devignes et al., Reference Devignes, Lopes and Dujardin2022; Kehagia et al., Reference Kehagia, Barker and Robbins2010). While traditional, standard executive function tests are used in neuropsychological assessments to gauge cognitive impairment in PD (e.g., Wisconsin Card Sorting Test, WCST) (Heaton & Staff, Reference Heaton and Staff1993), previous research has identified certain performance patterns that may indirectly reflect executive dysfunction in PD and offer additional interpretive value beyond traditional executive tasks.
One neuropsychological pattern researched in PD is the differential performance on letter versus category fluency tasks (Azuma et al., Reference Azuma, Cruz, Bayles, Tomoeda and Montgomery2003; Pettit et al., Reference Pettit, McCarthy, Davenport and Abrahams2013). Both types of verbal fluency have been localized to regions within the frontal and temporal lobes, but not equally: letter fluency is more dependent on frontal executive processes, whereas category fluency relies more heavily on temporal-lobe-based semantic retrieval (Troyer et al., Reference Troyer, Moscovitch, Winocur, Alexander and Stuss1998). This dissociation is supported by findings that frontal lobe damage disproportionately impairs letter fluency, while temporal lobe damage – as seen in Alzheimer’s disease – more strongly affects category fluency (Monsch et al., Reference Monsch, Bondi, Butters, Paulsen, Salmon, Brugger and Swenson1994; Rosser & Hodges, Reference Rosser and Hodges1994; Troyer et al., Reference Troyer, Moscovitch, Winocur, Alexander and Stuss1998). Structural and functional neuroimaging support this distinction, with letter fluency activating primarily frontal regions and category fluency involving both frontal and temporo-parietal areas (Tupak et al., Reference Tupak, Badewien, Dresler, Hahn, Ernst, Herrmann, Fallgatter and Ehlis2012; Vonk et al., Reference Vonk, Rizvi, Lao, Budge, Manly, Mayeux and Brickman2018). In PD, even without dementia, frontal dysfunction is thought to underlie worse performance on letter fluency compared to category fluency (Azuma et al., Reference Azuma, Bayles, Cruz, Tomoeda, Wood, McGeagh and Montgomery1997). However, findings have been mixed, with some studies reporting equivalent or even greater impairment in category fluency – often in older studies lacking cognitive stratification or normative comparison (Auriacombe et al., Reference Auriacombe, Grossman, Carvell, Gollomp, Stern and Hurtig1993; Azuma et al., Reference Azuma, Bayles, Cruz, Tomoeda, Wood, McGeagh and Montgomery1997; Henry & Crawford, Reference Henry and Crawford2004).
A second observed cognitive pattern in PD is a performance discrepancy in delayed recall between word list and story memory tasks. Differences in these tasks are also thought to relate to frontal versus temporal localization of functions. Delayed recall of stories benefits from built in organization through semantically-related information, which is largely supported by temporal lobe structures (Helmstaedter et al., Reference Helmstaedter, Wietzke and Lutz2009; Lezak, Reference Lezak2004; Tremont et al., Reference Tremont, Halpert, Javorsky and Stern2000). In contrast, word-list learning and recall rely more on self-generated organizational strategies of semantically related or unrelated words, which are more dependent on frontal lobe executive functions (Broadway et al., Reference Broadway, Rieger, Campbell, Quinn, Mayer, Yeo, Wilson, Gill, Fratzke and Cavanagh2019; Kopelman & Stanhope, Reference Kopelman and Stanhope1998; Tremont et al., Reference Tremont, Halpert, Javorsky and Stern2000). As Cummings (Reference Cummings1990) noted, individuals with subcortical dementias like PD are thought to perform better with structured information, whereas individuals with cortical dementias may not show a difference in performance with structured vs unstructured information recall. Accordingly, individuals with PD typically show greater impairment on word list recall due to executive dysfunction, while story recall remains relatively preserved (Helkala et al., Reference Helkala, Laulumaa, Soininen and Riekkinen1989; O’Brien et al., Reference O’Brien, Wadley, Nicholas, Stover, Watts and Griffith2009; Zahodne et al., Reference Zahodne, Bowers, Price, Bauer, Nisenzon, Foote and Okun2011).
The third cognitive pattern concerns the difference between delayed free recall and recognition memory. Poor performance on both often suggests encoding or storage deficits, associated with a “cortical” memory profile. Conversely, impaired recall with preserved recognition has been viewed as a “retrieval deficit,” suggesting intact storage but difficulty accessing information without cues – a pattern often described in PD (Cummings, Reference Cummings1990). Squire, Wixted, and Clark (Reference Squire, Wixted and Clark2007) challenged this view however, noting that intact recognition does not equate to intact encoding or storage as recognition may rely on familiarity-based processes that demand less robust encoding than the recollection for recall. Thus, preserved recognition can occur with shallow encoding, complicating the attribution of poor recall solely to retrieval deficits. Indeed, studies have found both encoding deficits and impaired recognition in PD (Beatty et al., Reference Beatty, Ryder, Gontkovsky, Scott, McSwan and Bharucha2003; Hartikainen et al., Reference Hartikainen, Helkala, Soininen and Riekkinen1993; Higginson et al., Reference Higginson, Wheelock, Carroll and Sigvardt2005; Tanner et al., Reference Tanner, Mareci, Okun, Bowers, Libon and Price2015). Nonetheless, the more typical pattern in PD involves impaired delayed recall with relatively preserved recognition (E. Helkala et al., Reference Helkala, Laulumaa, Soininen and Riekkinen1988), reflecting frontostriatal dysfunction affecting both encoding strategies and retrieval, rather than medial temporal lobe-related storage impairments (Carlesimo et al., Reference Carlesimo, Taglieri, Zabberoni, Scalici, Peppe, Caltagirone and Costa2022; Weintraub et al., Reference Weintraub, Moberg, Culbertson, Duda and Stern2004).
Although these three neuropsychological performance patterns have been frequently described in the literature, findings have been inconsistent - likely due to differences in methodologies and small sample sizes. Despite inconsistent empirical support, this “trifecta” of patterns has been described anecdotally in clinical practice and may be informally referenced as “clinical pearls” to support hypotheses of executive dysfunction. We clarify that our use of the term “trifecta” refers to commonly seen and practically useful patterns in clinical work with individuals with PD, not to formally established or universally accepted diagnostic criteria. The informal use of these patterns highlights the need for stronger empirical validation. Therefore, the primary aim of this study is to evaluate each of the three neuropsychological patterns in a large sample of individuals with PD. We also aimed to quantify the extent to which this “trifecta” of patterns co-occurred within individuals with PD. Specifically, we aimed to assess the percent of patients who exhibit these patterns overall, examine the degree of severity in the observed differences in test performance, and determine whether clinically meaningful differences are common within these neuropsychological patterns. Lastly, we explored the relationship between this “trifecta” and other executive function tests and other PD characteristics.
Materials and methods
Design
This study involved a retrospective chart review of individuals diagnosed with idiopathic PD who were seen at the University of Florida (UF) Health Norman Fixel Institute for Neurological Diseases. Study procedures were approved by the UF Institutional Review Board, with informed consent obtained in accordance with the Declaration of Helsinki and University and Federal standards. Data included demographic, clinical, and neuropsychological information.
Participants
Participants included a clinical convenience sample of 772 individuals with idiopathic PD drawn from a large IRB-approved prospectively acquired clinical-research database (INFORM). Most participants were candidates for deep brain stimulation (DBS) surgery, indicating that motor symptoms were sufficiently bothersome and not well controlled by medication management. Inclusion criteria included: 1) a diagnosis of idiopathic PD made by a fellowship-trained movement disorders specialist and 2) neuropsychological evaluation between 2002 and 2022. Exclusion criteria included: 1) previous brain surgery (e.g., deep brain stimulation, pallidotomy); 2) history of epilepsy, stroke, brain injury, or other neurological diagnosis with ongoing cognitive sequela; and 3) evidence of significant cognitive impairment based on scores below 125 on the Dementia Rating Scale-2 (DRS-2; Johnson-Greene, Reference Johnson-Greene2004). Demographic and clinical data were obtained from the UF INFORM clinical-research database.
Clinical measures
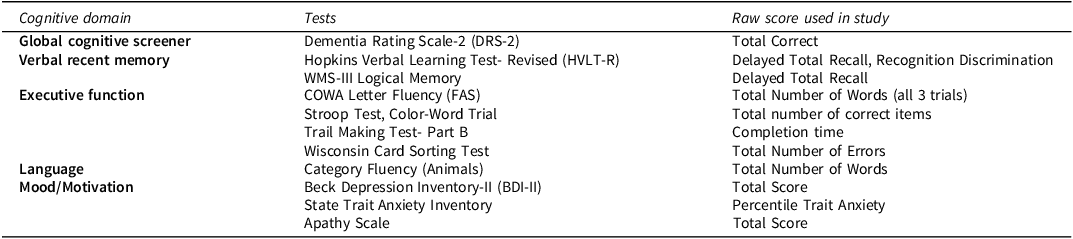
All participants underwent a comprehensive neuropsychological evaluation, including a cognitive screener and measures to assess functioning in multiple cognitive domains. The specific tests drawn from the full neuropsychological assessment for this study are highlighted in Table 1, as well as the raw scores used for analyses. Raw scores were converted to normed z-scores based on test-specific manuals or previously published norms (Heaton, Reference Heaton2004). Self-report mood and motivation scales were also included as part of a standardized neuropsychological battery as listed in Table 1.
Neuropsychological tests and self-report measures within each cognitive domain composite

Note: WMS-III = Wechsler Memory Scale-Version III (Wechsler, Reference Wechsler1997); HVLT-R = Hopkin’s Verbal Learning Test-Revised (Brandt, Reference Brandt1991); Letter Fluency (FAS) (Tombaugh et al., Reference Tombaugh, Kozak and Rees1999); Stroop Test is the Golden version (Golden, Reference Golden1978); TMT-B = Trail Making Test Part B (Reitan, Reference Reitan1992); Wisconsin Carding Sorting Test-64 (hand administration) (Kongs et al., Reference Kongs, Thompson, Iverson and Heaton2000); Category Fluency (Animals) (Tombaugh et al., Reference Tombaugh, Kozak and Rees1999); BDI-II (Beck et al., Reference Beck, Steer and Brown1996; Leentjens et al., Reference Leentjens, Verhey, Luijckx and Troost2000), AS (Leentjens et al., Reference Leentjens, Dujardin, Marsh, Martinez-Martin, Richard, Starkstein, Weintraub, Sampaio, Poewe and Rascol2008; Starkstein et al., Reference Starkstein, Mayberg, Preziosi, Andrezejewski, Leiguarda and Robinson1992), STAI (Knight et al., Reference Knight, Waal-Manning and Spears1983; Spielberger, Reference Spielberger1983).
All participants were “on” dopaminergic medication as part of routine clinical care. Most participants received PD-specific scales for disease staging (Hoehn & Yahr staging) and for gauging motor severity in response to dopamine medications (Unified Parkinson Disease Rating Scale-Part III) (Fahn & Elton, Reference Fahn and Elton1987; Goetz et al., Reference Goetz, Poewe, Rascol, Sampaio, Stebbins, Counsell, Giladi, Holloway, Moore and Wenning2004). UPDRS motor scores should be interpreted in the context of a pre-DBS cohort, in which many participants were referred due to suboptimal response to medication. As such, scores may not fully capture treatment efficacy.
Statistical analyses
All analyses were conducted using SPSS Version 28 (IBM Corp, 2021). Data were examined for normality and outliers. Paired-sample t-tests were used to compare performance within each neuropsychological pearl, and we calculated the percentage of participants showing lower performance (z-difference <0) and clinically meaningful differences at z-score thresholds of ≤ −0.5, ≤ −1.0, and ≤ −1.5, representing increasing levels of severity in intra-individual performance discrepancies. This method, commonly used in the absence of anchor-based criteria, defines minimal clinically important difference as a change of ≥|0.5| SD and provides a standardized way to approximate meaningful intra-individual change. While clinical significance also depends on patient perceptions and score distributions, this approach offers a practical framework for interpretation.
We defined a meaningful difference of −1.0 standard deviation between tests, consistent with procedures for interpreting subtest discrepancies outlined in comprehensive assessments, including the Wechsler Adult Intelligence Scale–Fourth Edition. While comparison of separate tests is not the same as comparing subtests, this procedure aligns with evidence that such differences often exceed what is expected due to measurement error or normal variability, supporting their relevance for identifying significant cognitive strengths or weaknesses. For participants meeting the ≥ −1.0 SD threshold, we used independent t-tests and Chi-square tests to determine if there were demographic or clinical differences between those who did and did not show each neuropsychological pattern. FDR corrections (Benjamini & Hochberg, Reference Benjamini and Hochberg1995) were applied to control for multiple comparisons in analyses comparing demographic and clinical variables between those who did and did not exhibit a ≥ 1.0 SD difference within each cognitive pattern.
Lastly, associations between neuropsychological pearls and executive function were explored via correlations and Chi-squared tests in a sub-sample of participants (N = 548) who had received three “executive” tasks assessing executive processes including cognitive inhibition (Stroop Color-Word (Golden, Reference Golden1978), speeded set-shifting (Trail Making Test, Part B; (Reitan, Reference Reitan1992), and novel problem solving (Wisconsin Card Sorting Test-64 cards (Kongs et al., Reference Kongs, Thompson, Iverson and Heaton2000), total errors). The z-score difference for each individual pearl was correlated with z-score performance on each classic task and an executive function z-score composite, as described in methods. Z-scores from each task were derived from test manuals and averaged to create a total executive function composite z-score. For each neuropsychological pattern, we correlated the z-score discrepancy (within-subject test pair difference) with individual executive task z-scores and a composite executive function z-score (calculated by averaging the three task specific z-scores). All correlation analyses were FDR corrected (Benjamini & Hochberg, Reference Benjamini and Hochberg1995). The multiple correlational analyses between were FDR corrected. Exploratory Chi-squared analyses examined whether the prevalence of each neuropsychological pattern differed across PD clinical characteristics, including disease duration (categorized as early [ ≤ 5 years] vs. late [>5 years]) and Hoehn & Yahr disease stage.
Results
Sample characteristics
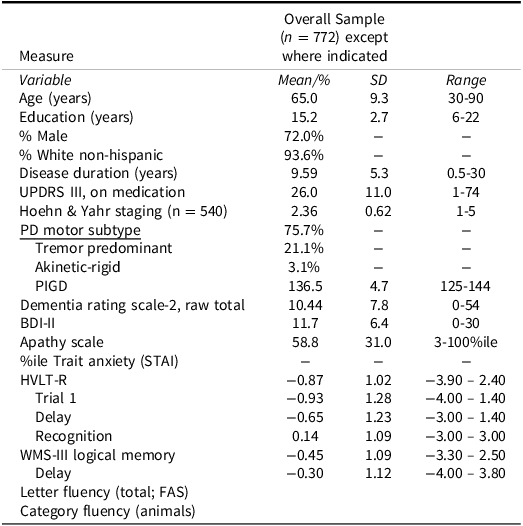
Demographic characteristics, scores on cognitive testing, and disease-related measures of the sample (n = 772) are depicted in Table 2. Overall, participants were largely non-Hispanic White (93.6%), male (72%), well-educated (15.2 ± 2.7), and in their mid-60s (65.0 ± 9.3). Most had tremor-dominant PD at the time of diagnosis with motor symptoms well-controlled with medication (Martínez-Martín et al., Reference Martínez-Martín, Rodríguez-Blázquez, Alvarez, Arakaki, Arillo, Chaná, Fernández, Garretto, Martínez-Castrillo, Rodríguez-Violante, Serrano-Dueñas, Ballesteros, Rojo-Abuin, Chaudhuri and Merello2015). Motor severity, based on Hoehn and Yahr staging (subset, n = 540), ranged from stage 1 to 5 (mean = 2.35, SD = 0.62): Stage 1 (n = 13), 1.5 (n = 8), 2 (n = 289), 2.5 (n = 98), 3 (n = 108), 4 (n = 17), and 5 (n = 7). (Table 3)
Sample demographic, clinical, and cognitive (z-score) characteristics

Note: UPDRS III = Unified Parkinson’s Disease Rating Scale motor scale, BDI-II = Beck Depression Inventory-II, STAI = State Trait Anxiety Inventory, WMS-III = Wechsler Memory Scale-Version III (Wechsler, Reference Wechsler1997); HVLT-R = Hopkin’s Verbal Learning Test-Revised (Brandt, Reference Brandt1991); Letter Fluency (FAS) (Tombaugh et al., Reference Tombaugh, Kozak and Rees1999); Category Fluency (Animals) (Tombaugh et al., Reference Tombaugh, Kozak and Rees1999); BDI-II (Beck et al., Reference Beck, Steer and Brown1996; Leentjens et al., Reference Leentjens, Verhey, Luijckx and Troost2000), AS (Leentjens et al., Reference Leentjens, Dujardin, Marsh, Martinez-Martin, Richard, Starkstein, Weintraub, Sampaio, Poewe and Rascol2008; Starkstein et al., Reference Starkstein, Mayberg, Preziosi, Andrezejewski, Leiguarda and Robinson1992), STAI (Knight et al., Reference Knight, Waal-Manning and Spears1983; Spielberger, Reference Spielberger1983). Cognitive tests scores provided are z-scores as described in methods.
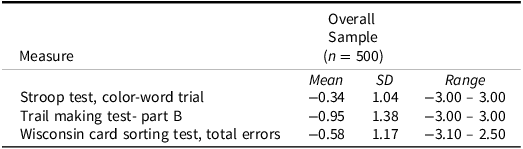
Sample average performance on executive measures (z-scores)

Note: Stroop Test is the Golden version (Golden, Reference Golden1978); Trail Making Test Part B (Reitan, Reference Reitan1992); Wisconsin Carding Sorting Test-64 (hand administration) (Kongs et al., Reference Kongs, Thompson, Iverson and Heaton2000).
Clinical pearls
Pearl 1: letter fluency vs. Category fluency
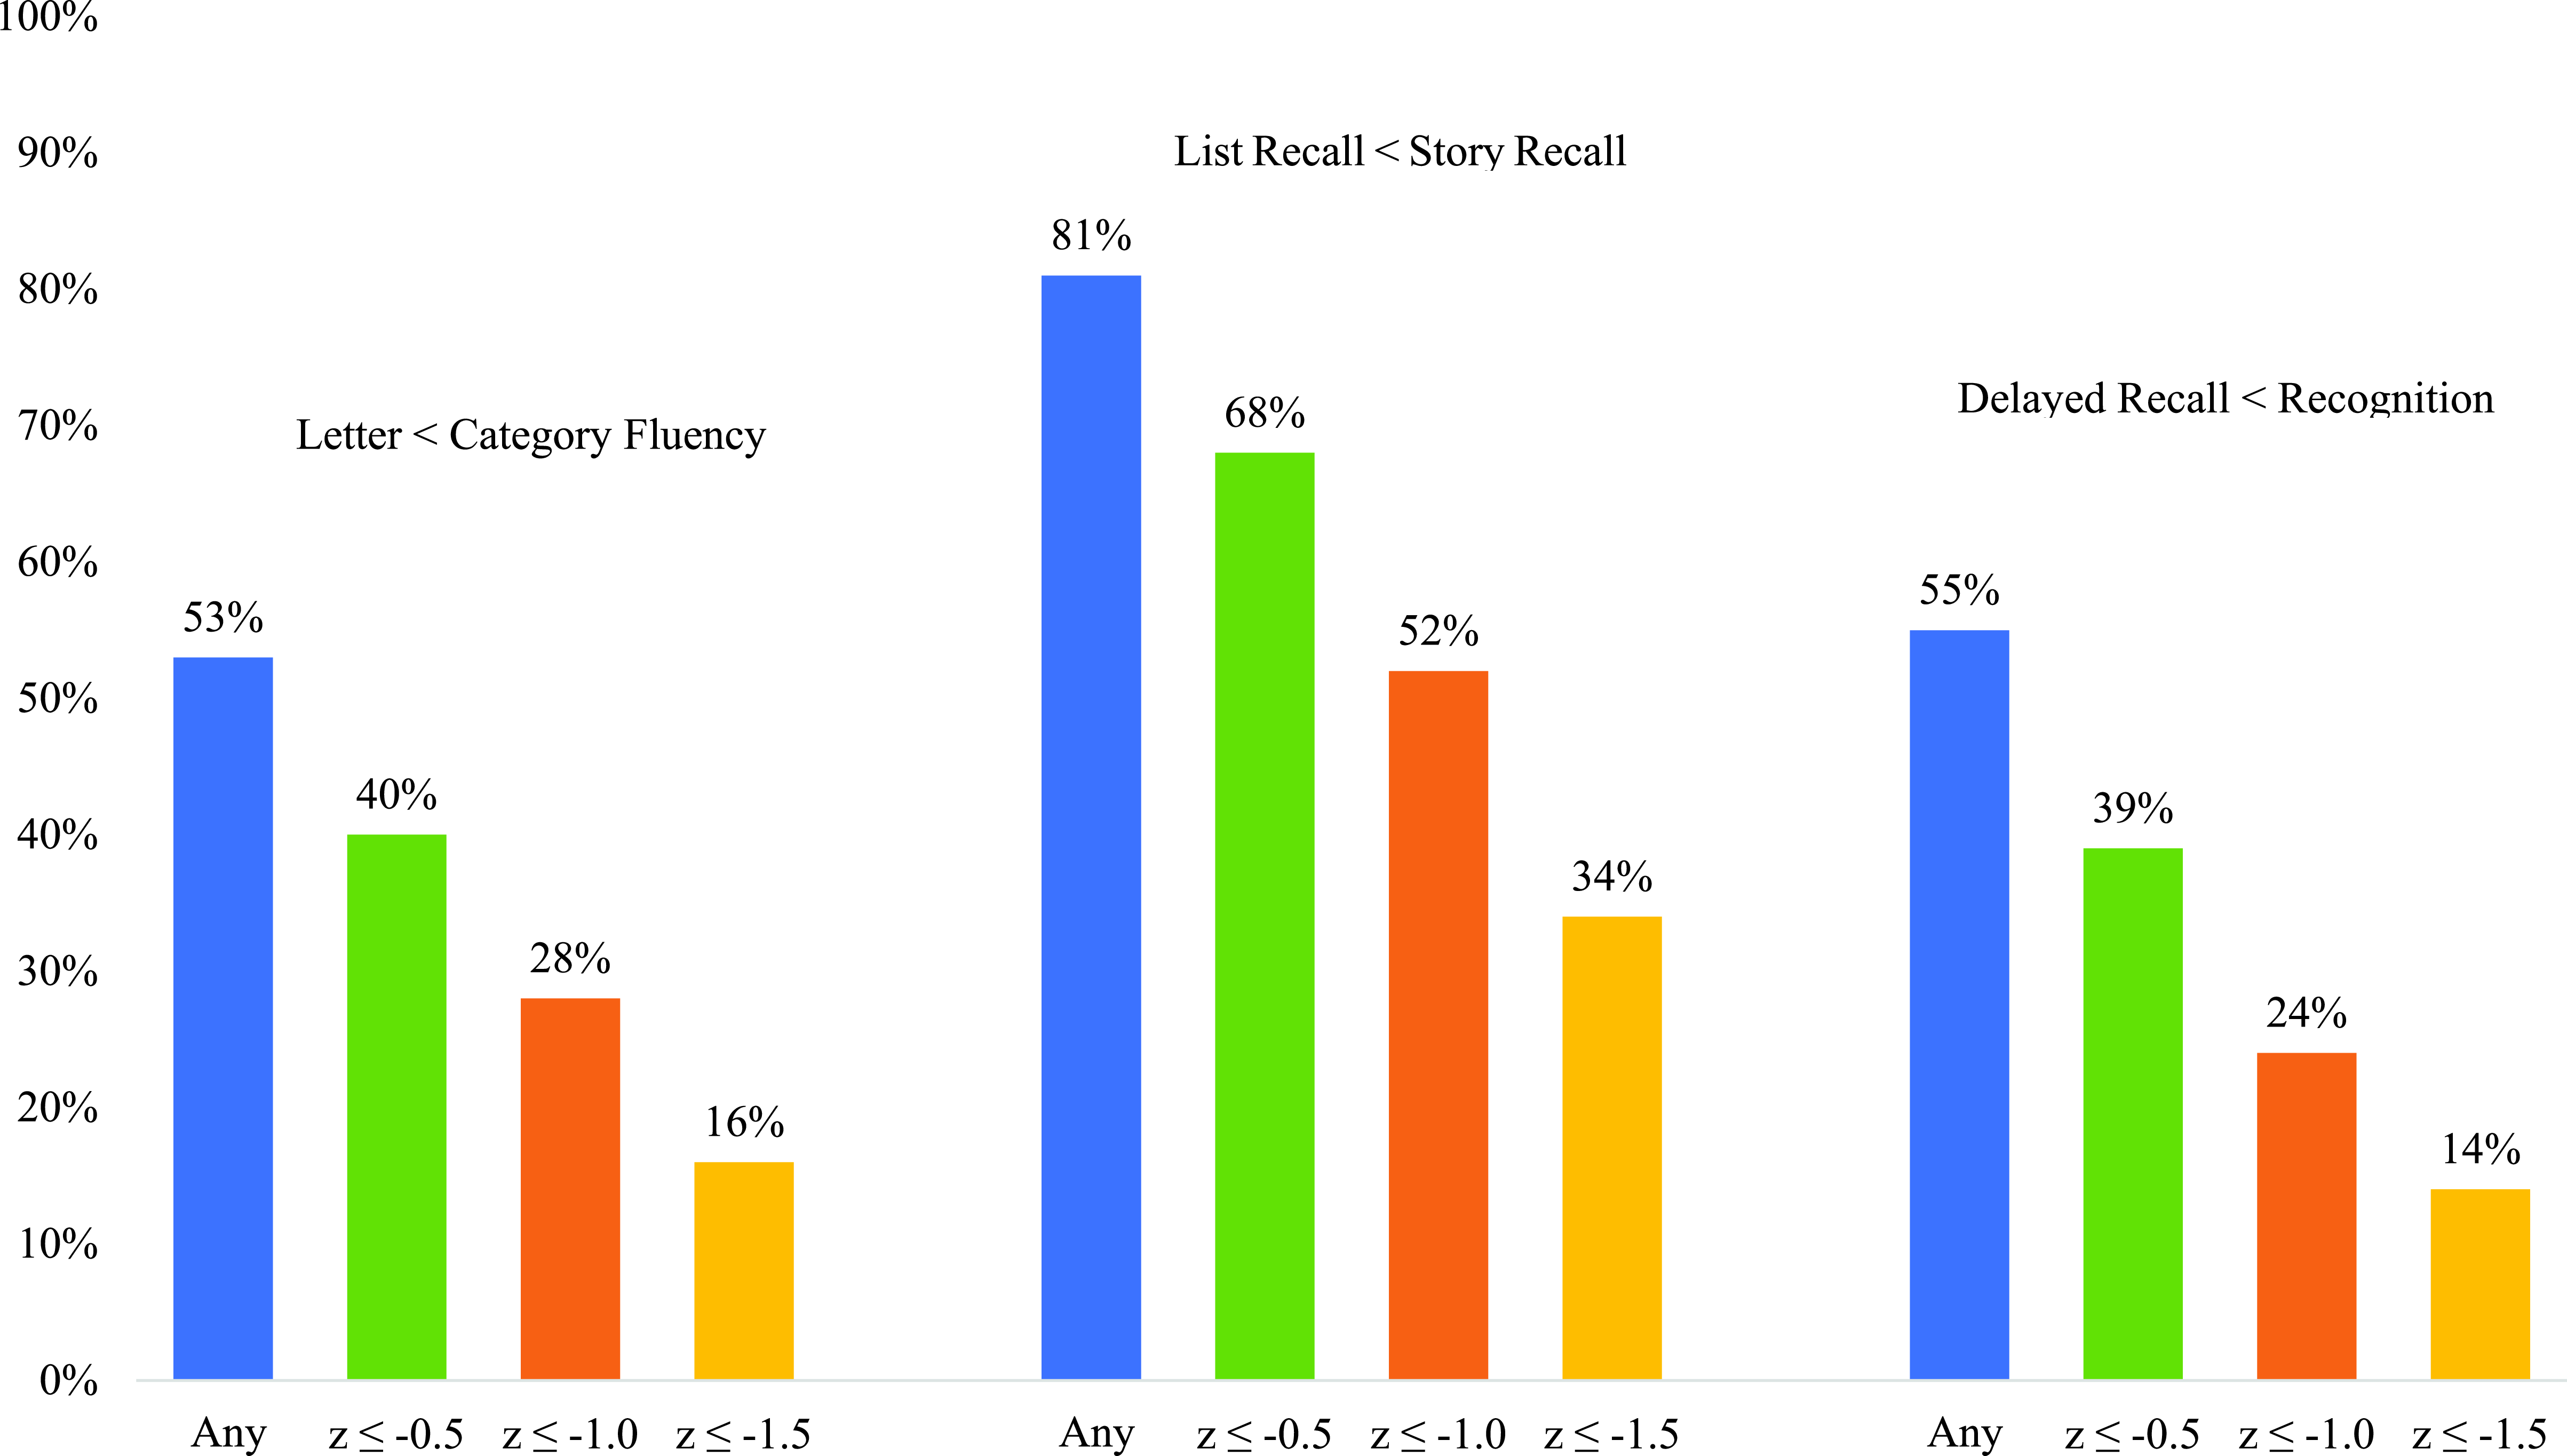
Letter fluency (z = −0.45 ± 1.1) was significantly lower than category fluency (z = −0.29 ± 1.2), though with small effect size (t (765) = −3.4, p = 0.001, Cohen’s d = −0.12). Among the 765 participants with both scores, 53% (n = 408) performed worse on letter than category fluency. Differences of ≤ −0.5 SD, ≤ −1.0 SD, and ≤ −1.5 SD were observed in 40% (n = 310), 28% (n = 212), and 16% (n = 120), respectively. Conversely, 44% (n = 333) performed better on letter fluency, with 28% (n = 214), 17% (n = 133), and 9% (n = 66) showing positive differences of ≥0.5 SD, ≥1.0 SD, and ≥1.5 SD, respectively.
Individuals who showed a ≤ −1.0 SD difference on Pearl 1 were younger at the time of testing (t (764) = 2.6, p = 0.01, d = 0.21) and had fewer years of education (t (764) = 3.2, p = 0.001, d = 0.26). No differences emerged in sex, race/ethnicity, DRS-2 scores, UPDRS motor scores, or self-reported mood symptoms after FDR-corrections (Table 4).
Descriptive characteristics between individuals with and without at least a -1.0 standard deviation difference in performance on pearls 1-3
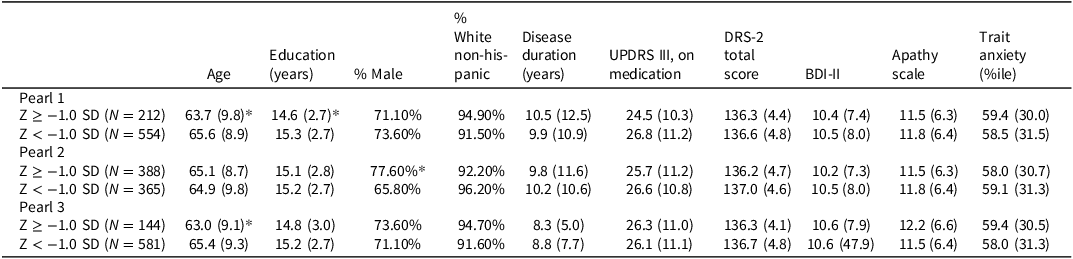
Note: Z refers to z-score difference between tests within each neuropsychological pearl (Pearl 1 = Letter-Category Fluency; Pearl 2 = HVLT-R Delay - WMS-III LM Delay; Pearl 3 = HVLT-R Delay – HVLT-R Recognition).
Pearl 2: delayed word list recall vs. Story recall
Delayed recall of the Hopkins Verbal Learning Test-Revised (HVLT-R) word list (z = −0.93 ± 1.3) was significantly worse than delayed story recall from the WMS-III Logical Memory test (z = 0.15 ± 1.1), with a large effect size (t (752) = 23.7, p < 0.001, Cohen’s d = −0.86). Deficits of ≤ −0.5 SD, ≤ −1.0 SD, and ≤ −1.5 SD were found in 68% (n = 512), 52% (n = 388), and 34% (n = 254) of the 752 individuals with both scores, respectively. In contrast, 17% (n = 130) performed better on list recall, with differences of ≥0.5 SD (n = 79, 11%), ≥1.0 SD (n = 32, 4%), and ≥1.5 SD (n = 10, 1%).
Those with a ≤ −1.0 SD difference on Pearl 2 were more often male (χ2(1, n = 753) = 13.0, p < 0.001). No differences emerged in age, education, sex, race/ethnicity, DRS-2 scores, UPDRS motor scores, or self-reported mood symptoms after FDR-corrections (Table 4).
Pearl 3: delayed recall vs. Recognition discrimination
Delayed recall performance on the HVLT-R (z = −0.93 ± 1.3) was significantly worse than recognition discrimination (calculated as the number of true positives minus false positives) on the yes-no recognition trial (z = −0.65 ± 1.2; t (724) = −6.7, p < 0.001) with small effect size (Cohen’s d = −0.25). Differences of ≤ −0.5 SD, ≤ −1.0 SD, and ≤ −1.5 SD were observed in 39% (n = 286), 24% (n = 172), and 14% (n = 105) of the sample respectively. Conversely, 40% (n = 291) performed better on delayed recall, with 21% (n = 151), 9% (n = 67), and 4% (n = 29) showing higher scores by ≥0.5, ≥1.0, and ≥1.5 SD, respectively.
Group-level analysis revealed that individuals with a ≤ −1.0 SD difference on Pearl 3 were significantly younger (t (723) = 2.8, p = 0.006; Cohen’s d = 0.26) compared to individuals who performed better than −1.0 SD (Table 4). There were no other group differences in demographics of PD clinical variables after FDR-corrections.
Co-occurrence of executive function trifecta
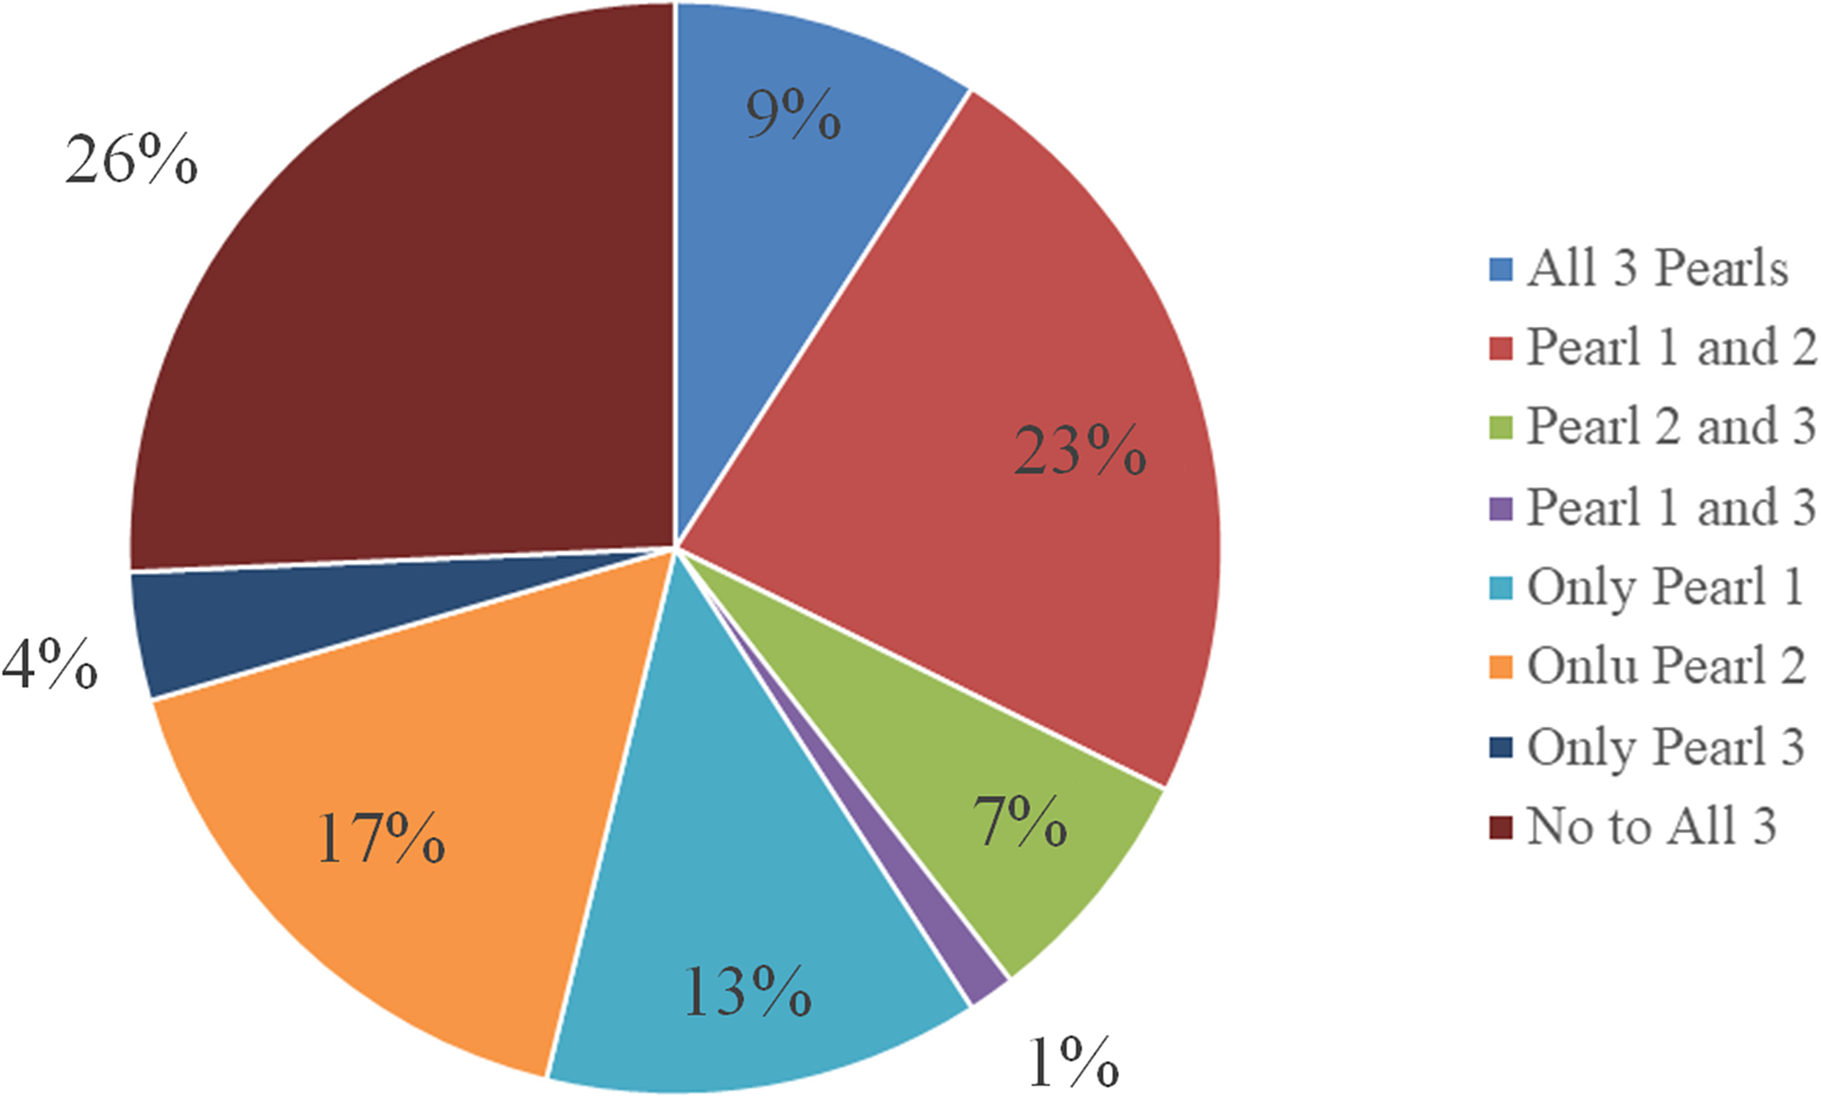
In addition to calculating the percentage of our sample displaying each neurocognitive pearl (Figure 1), we examined the co-occurrence of these three neuropsychological pearls within our sample (n = 716). For consistency, we used a z-score of difference of −1.0 between the two tests as a “yes” or “no” variable to indicate whether they did or did not demonstrate each cognitive pattern. Participants were grouped into all possible permutations, which came to 8 different groups, and we examined the frequency of the different groups (Figure 2). The largest percentage of the sample (28.3%, n = 203) did not demonstrate any of the three cognitive patterns. The second most frequent co-occurrence was for Pearl 1 and 2 (25.5%, n = 183), which appeared to be driven largely by Pearl 2 as 14.2% (n = 102) of this sample demonstrated this pattern only.
Cumulative percentage of the sample (n = 772) demonstrating z-score differences for each neuropsychological pearl.

Frequency of co-occurrence of a trifecta of neuropsychological patterns (n = 716) with −1.0 SD z-score difference.

Comparison to classic executive function tests
A subset of 548 participants completed three executive function tests, the Stroop Color-Word test (average z = −0.34 ± 1.0, range = −3.00 to 3.00), Trail Making Test Part B (TMT-B; average z = −0.95 ± 1.4, range = −3.00 to 3.00), and Wisconsin Card Sorting Test (WCST) total errors (average z = −0.58 ± 1.2, range = −3.10 to 2.50) (Table 3). The distribution of scores across each of these tasks reflects a range from impaired to strong performances. To explore the relationship between performance on these executive function tests and the presence of neuropsychological pearls, we first conducted FDR-corrected correlations between the z-score differences within each pearl, z-score performance on each classic task, and the executive function z-score composite, as described in methods. Only Pearl 3 demonstrated a significant, albeit small, correlation with executive function composite scores (r = 0.132, p = 0.003), suggesting limited overlap.
With this sample subset, we then categorized participants into three groups based on their executive function composite scores: a “low” executive function group (z ≤ −1.0) (n = 148), a “within normal limits” (WNL) group (−1.0<z<1.0) (n = 376), and a “high” executive function group (z ≥1.0) (n = 24). Chi-square tests revealed no significant differences in the proportion of individuals displaying a≥1.0 SD discrepancy in any of the three pearls among the low, WNL, and high executive groups. These findings suggest that traditional executive tasks did not predict the neuropsychological patterns observed in this sample.
Relationship of PD Variables to Executive Function Trifecta
Given that executive dysfunction often emerges early in PD, we explored whether disease duration or severity was associated with the presence of neuropsychological pearls. Disease duration (years since symptom onset) was unrelated to the executive function composite and each neuropsychological pearl’s z-score difference, suggesting that longer disease duration was not associated with greater likelihood of these patterns. When participants were divided into two groups based on disease duration: “early” (≤5 years) and “late” (>5 years), chi-square analyses revealed that a greater percentage of individuals in the early group exhibited Pearl 2 compared to the late group (X2(1, n = 741) = 4.0, p = 0.044).
We also examined pearl prevalence across stages of disease severity using Hoehn & Yahr (H&Y) ratings by dividing participants into “early-stage” (H&Y 1–2) and “mid-stage” (H&Y 2.5–3). Individuals in H&Y stages 4–5 (N = 23) were excluded due to small sample size. Chi-squared tests revealed more early-stage participants demonstrated Pearl 2 compared to mid-stage participants (X2 (1, n = 506) = 3.9, p = 0.049). Together, these results suggest that worse delayed recall of unstructured information compared to structured information is more common in the earlier stages and durations of PD. This may reflect the early impact of executive dysfunction, which may later be overshadowed by broader impairments in memory or other cognitive domains as the disease progresses.
Discussion
This study sought to learn whether a “trifecta” of previously identified neuropsychological patterns could be validated in a large cohort of individuals with Parkinson’s disease. The focus was three key cognitive pearls: letter fluency < category fluency, delayed recall of a word list < story recall, and delayed recall < recognition. Statistically, our results supported these hypothesized cognitive patterns. On average, individuals with PD performed statistically worse on letter fluency, delayed recall of a word list, and delayed recall compared to recognition.
When going beyond statistical significance of average scores, our results revealed that the “trifecta” of neuropsychological patterns or “clinical pearls” were not uniformly present, and many did not show clinically meaningful differences between tests within a given neuropsychological pattern (Figure 1, Figure 2). Indeed, only Pearl 2 (word list vs. story memory) showed a large effect size with at least half the sample showing a clinically meaningful difference (−1SD) in performance. The other two patterns yielded small effect sizes, and only a minority exhibited differences of one standard deviation or greater. This variability suggests that while certain cognitive patterns may emerge at the group level, individual differences in cognitive decline and neuropsychological profiles in Parkinson’s disease are substantial, underscoring the need for individualized assessment.
We further explored how these patterns related to broader executive functioning (Stroop Color-Word, TMT B, WCST). There was marked individual variability in performance across these executive function tasks, in line with recent reports about differing rates of cognitive decline (Fereshtehnejad et al., Reference Fereshtehnejad, Moqadam, Azizi, Postuma, Dadar, Lang, Marras and Zeighami2025). Pearls were either weakly or unrelated to performance on classic executive function tests. This discrepancy may reflect differences in task-specific demands, the multifaceted nature of executive function (i.e., different neural substrates involved in different tasks), and the varied use of compensatory strategies or cognitive reserve. Furthermore, stratifying participants by executive function status revealed no significant differences in the prevalence of any pearl, except Pearl 3 (recall < recognition), which was significantly correlated with executive performance. Notably, Pearl 2 (word list vs story) was more prevalent in individuals with shorter disease duration and lower Hoehn & Yahr stage, suggesting it may be a more prominent early disease marker that diminishes with broader cognitive decline as more diffuse or non-frontal cognitive deficits arise.
Our findings, based on what is perhaps the largest sample of individuals with PD to date, align with the broader literature in emphasizing the complex and heterogeneous nature of cognitive impairments in PD. Prior studies have yielded mixed results, with both confirmative and contradictory findings regarding neuropsychological patterns, particularly in verbal fluency. For example, there are at least eight studies that found worse performance on letter vs category fluency (Barbosa et al., Reference Barbosa, Voos, Chen, Francato, Souza, Barbosa, Chien and Mansur2017; Bayles et al., Reference Bayles, Trosset, Tomoeda, Montgomery and Wilson1993; Gabrieli et al., Reference Gabrieli, Singh, Stebbins and Goetz1996; Galtier et al., Reference Galtier, Nieto, Lorenzo and Barroso2017; Jaywant et al., Reference Jaywant, Musto, Neargarder, Stavitsky Gilbert and Cronin-Golomb2014; Monsch et al., Reference Monsch, Bondi, Butters, Paulsen, Salmon, Brugger and Swenson1994; Rosser & Hodges, Reference Rosser and Hodges1994; Suhr & Jones, Reference Suhr and Jones1998; Troyer et al., Reference Troyer, Moscovitch, Winocur, Alexander and Stuss1998). In contrast, over ten other studies have found the opposite, with better performance on category compared to letter fluency (Auriacombe et al., Reference Auriacombe, Grossman, Carvell, Gollomp, Stern and Hurtig1993; Beatty et al., Reference Beatty, Staton, Weir, Monson and Whitaker1989; Koerts et al., Reference Koerts, Meijer, Colman, Tucha, Lange and Tucha2013; Matison et al., Reference Matison, Mayeux, Rosen and Fahn1982; Raskin et al., Reference Raskin, Sliwinski and Borod1992) or no difference between the two types of fluency at all (Azuma et al., Reference Azuma, Bayles, Cruz, Tomoeda, Wood, McGeagh and Montgomery1997; Dadgar et al., Reference Dadgar, Khatoonabadi and Bakhtiyari2013; Flowers et al., Reference Flowers, Robertson and Sheridan1995; Gurd & Ward, Reference Gurd and Ward1989; Hanlly et al., Reference Hanlly, Dewick, Davies, Playeer and Turnbull1990; McDowd et al., Reference McDowd, Hoffman, Rozek, Lyons, Pahwa, Burns and Kemper2011; Obeso et al., Reference Obeso, Ray, Antonelli, Cho and Strafella2011; Piatt et al., Reference Piatt, Fields, Paolo, Koller and Tröster1999; Troyer et al., Reference Troyer, Moscovitch, Winocur, Alexander and Stuss1998). Notably, a meta-analysis of verbal fluency performance in PD showed more impairment on category fluency than letter, though both were found to be related to psychomotor speed more than executive dysfunction (Henry & Crawford, Reference Henry and Crawford2004), which has been corroborated in at least two other studies (Koerts et al., Reference Koerts, Meijer, Colman, Tucha, Lange and Tucha2013; McDowd et al., Reference McDowd, Hoffman, Rozek, Lyons, Pahwa, Burns and Kemper2011). Some of the aforementioned studies also did not directly compare letter vs category fluency performance within a group, only noting that both verbal fluencies were impaired compared to controls (Azuma et al., Reference Azuma, Bayles, Cruz, Tomoeda, Wood, McGeagh and Montgomery1997; Dadgar et al., Reference Dadgar, Khatoonabadi and Bakhtiyari2013; Gurd & Ward, Reference Gurd and Ward1989; Obeso et al., Reference Obeso, Ray, Antonelli, Cho and Strafella2011; Troyer et al., Reference Troyer, Moscovitch, Winocur, Alexander and Stuss1998). Methodological differences, such as the number of fluency trials, the specific letter or categories tested, and the norming standards use, may account for inconsistent findings across studies. In the current study, participants on average performed worse on three letter fluency trials compared to a single trial of category fluency, which raises multiple possible considerations. One possibility is that the cumulative demand of multiple trials, especially on a task potentially more reliant on executive control, may reveal subtle impairments that a single trial cannot capture. Alternatively, poorer performance across three trials may reflect fatigue or difficulty maintaining verbal output under increasing cognitive load. has shown that in healthy older adults, category fluency typically declines more with age than letter fluency (Gladsjo et al., Reference Gladsjo, Schuman, Evans, Peavy, Miller and Heaton1999) suggesting that the opposite pattern found in our sample is unlikely to be explained by normative aging effects alone. Moreover, both letter and category fluency tasks were co-normed and standardized using the revised Heaton norms, allowing for a direct, demographically adjusted comparison in performance.
At least three studies have demonstrated worse word list delayed memory compared to spared delayed recall of stories in PD (Hartikainen et al., Reference Hartikainen, Helkala, Soininen and Riekkinen1993; Lafo et al., Reference Lafo, Jones, Okun, Bauer, Price and Bowers2015; Zahodne et al., Reference Zahodne, Bowers, Price, Bauer, Nisenzon, Foote and Okun2011) and in individuals with “significant” executive dysfunction (Tremont et al., Reference Tremont, Halpert, Javorsky and Stern2000). A similar study found worse performance on short delay recall of a word list in a group “with executive dysfunction” compared to the group without executive dysfunction, but no difference in long delay (Brooks et al., Reference Brooks, Weaver and Scialfa2006). One PD study did not find a difference in delayed recall performance between list and stories using the Repeatable Battery for the Assessment of Neuropsychological Status (RBANS), but statistical analyses were only conducted using a difference score, rather than directly comparing list and story performances (Beatty et al., Reference Beatty, Ryder, Gontkovsky, Scott, McSwan and Bharucha2003). These mixed findings may in part reflect differences in test sensitivity and normative frameworks across studies. For instance, the California Verbal Learning Test (CVLT) includes more trials, structured semantic categories, and greater demands on learning and retrieval compared to other word list tasks like the HVLT, potentially making it more sensitive to executive dysfunction. Differences in demographic norming between the HVLT-R and the WMS-III Logical Memory may have also influenced performance classification. However, the study by Zahodne and colleagues demonstrated the same pattern (poorer performance on a word list versus stories) when both memory tasks were co-normed together from the same reference group (i.e., Weschler Memory). Nevertheless, discrepancies in memory performance patterns may be shaped not only by underlying cognitive deficits but also by the psychometric properties and normative context of the measures used.
Lastly, at least five studies have provided evidence supporting the third clinical pearl, namely impaired verbal delayed recall with relatively spared recognition (Auriacombe et al., Reference Auriacombe, Grossman, Carvell, Gollomp, Stern and Hurtig1993; Brooks et al., Reference Brooks, Weaver and Scialfa2006; Taylor et al., Reference Taylor, Saint-Cyr and Lang1986, Reference Taylor, Saint-Cyr and Lang1990). Conversely, six studies found similar impairments in delayed recall and recognition compared to controls suggesting additional dysfunction in encoding (Beatty et al., Reference Beatty, Ryder, Gontkovsky, Scott, McSwan and Bharucha2003; Brønnick et al., Reference Brønnick, Alves, Aarsland, Tysnes and Larsen2011; Hartikainen et al., Reference Hartikainen, Helkala, Soininen and Riekkinen1993; Higginson et al., Reference Higginson, Wheelock, Carroll and Sigvardt2005; Tanner et al., Reference Tanner, Mareci, Okun, Bowers, Libon and Price2015). However, most of these studies did not directly compare performances in the PD cohort alone (Beatty et al., Reference Beatty, Ryder, Gontkovsky, Scott, McSwan and Bharucha2003; Brønnick et al., Reference Brønnick, Alves, Aarsland, Tysnes and Larsen2011; Hartikainen et al., Reference Hartikainen, Helkala, Soininen and Riekkinen1993; Higginson et al., Reference Higginson, Wheelock, Carroll and Sigvardt2005; Tanner et al., Reference Tanner, Mareci, Okun, Bowers, Libon and Price2015). Further support for encoding and retrieval difficulties comes from a meta-analysis showing impaired delayed recall and recognition in PD, even in the absence of dementia, though with low effect sizes (Whittington et al., Reference Whittington, Podd and Kan2000). Importantly, Squire and colleagues have cautioned against interpreting preserved recognition as definitive evidence of intact encoding or storage, as recognition memory can often rely on familiarity-based processes that do not require deep or elaborative encoding (Squire et al., Reference Squire, Wixted and Clark2007). Thus, relatively intact recognition can occur even when encoding is shallow, complicating the inference that poor recall reflects a pure retrieval deficit. Moreover, effective retrieval of episodic information is thought to reactivate encoding engrams, underscoring the interdependence of these processes and the challenges in using neuropsychological tests to disentangle them cleanly (Alvarez & Squire, Reference Alvarez and Squire1994; Nyberg et al., Reference Nyberg, Habib, McIntosh and Tulving2000; Squire & Kandel, Reference Squire and Kandel2000).
Overall, the conflicting research findings are likely a result of the interplay of methodological and sample-related factors. Possible methodological differences include the smaller sample sizes, determination of dementia based on varying criteria, use of different neuropsychological tests and process scores to assess memory and verbal learning, and use of varied statistical methods. Sample characteristics may also account for discrepancies observed. Smaller studies, particularly earlier studies, may be constrained by a narrower range of demographic (e.g., age) or PD characteristics (e.g., motor severity, disease duration) and likely lack the statistical power to capture the full diversity of cognitive profiles. In our study, participants’ age ranged from 30–90, which is an exceptionally large age range compared to many studies that focus on older adults with PD. It is believed that young onset PD individuals tend to have less severe motor progression and cognitive impact compared to late onset PD (Diederich et al., Reference Diederich, Moore, Leurgans, Chmura and Goetz2003; Pagano et al., Reference Pagano, Ferrara, Brooks and Pavese2016; Santos-García et al., Reference Santos-García, de Deus Fonticoba, Cores Bartolomé, Feal Painceiras, García Díaz, Íñiguez Alvarado, Paz, Jesús, Cosgaya and García Caldentey2023). As a result, the inclusion of younger individuals in our sample may have diluted the overall prevalence or severity of neuropsychological differences typically observed in older PD cohorts. Additionally, our sample demonstrated relatively mild motor severity and a wide range of executive dysfunction overall, which may also explain the lower frequency of robust or clinically meaningful differences in performance across the patterns we examined. It is also likely that at least some individuals have co-occurring neuropathology like Alzheimer’s disease or limbic-predominant age-related TDP-43 encephalopathy, which could also be impacting the presenting neurocognitive profiles (Fan et al., Reference Fan, Liu and Wu2021; Nelson et al., Reference Nelson, Dickson, Trojanowski, Jack, Boyle, Arfanakis, Rademakers, Alafuzoff, Attems, Brayne, Coyle-Gilchrist, Chui, Fardo, Flanagan, Halliday, Hokkanen, Hunter, Jicha, Katsumata and Schneider2019). Lastly, few studies have examined clinically meaningful differences in neuropsychological patterns to determine the percentage of individuals who display a certain pattern. Our findings suggest that the broader age range and larger sample size employed here allowed for a potentially more comprehensive representation of cognitive variability.
This study has several limitations. First, the use of a convenience sample – primarily individuals undergoing neuropsychological evaluations for DBS candidacy – introduces selection bias. These patients often represent a specific subset of PD (e.g., tremor dominant, less cognitively impaired), limiting generalizability. Second, we lacked data on cognitive diagnoses (e.g., amnestic vs. non-amnestic MCI), which precluded analyses by MCI subtype. Third, we used test-specific normative data consistent with clinical practice, which introduced variation in comparison groups – particularly affecting Pearl 2. The sample was also predominantly non-Hispanic White, well-educated individuals, reducing. This not only significantly reduces applicability of these findings to more diverse sociocultural populations, but future studies in more diverse groups would be potentially limited by the specific normative groups themselves, as these lack consideration of individuals from diverse backgrounds and sociocultural factors that can influence cognitive performance in meaningful ways (Byrd & Rivera-Mindt, Reference Byrd and Rivera-Mindt2022). Additionally, all PD participants were assessed while “on” their standard dopaminergic medications, but their medication usage was not formally tracked during the 2–3-hour evaluation. Variability in medication levels, including potential “wearing off” effects or concerns with excessive dopamine (e.g., overdose hypothesis), may have influenced cognitive performance and should be considered when interpreting the results. Lastly, there is limited research on direct comparisons of tests and common neurocognitive patterns in healthy, cognitively intact older adults. Future studies should prioritize exploring typical patterns of relative strengths and weaknesses in aging to better contextualize findings in PD and other neurodegenerative conditions.
Our findings suggest that incorporating pattern-based interpretation – focusing on within-person variability and relative cognitive strengths and weaknesses – may provide more nuanced insights into the cognitive changes associated with Parkinson’s disease. However, given the lack of robust findings, this study underscores the importance of critically evaluating commonly cited neuropsychological patterns of relative impairment – especially those derived from small or older studies. The presence or absence of these patterns alone should not be viewed as a definitive indicator of cognitive status or diagnosis. Instead, when assessing executive dysfunction in PD, such patterns should be interpreted within the broader context of a comprehensive neuropsychological evaluation.
Funding statement
Funding was provided by the National Institute of Health: T32-NS082168, T32-AG061892, F31-NS131000, F31-AG081047, UF Fixel Institute of Neurological Diseases.
Competing interests
The authors declare that there are no conflicts of interest relevant to this work.


 Open access