

Fatty fish species are in general good sources of the healthy n-3 fatty acids EPA (20 : 5n-3) and DHA (22 : 6n-3) for human consumption. However, there are differences in fatty acid compositions between pelagic fish species. While the North Atlantic fishes capelin and herring contain lower levels of EPA and DHA than the South American sardine, approximately 8 % compared with approximately 23 % of total fatty acids, respectively(Reference Turchini, Ng and Tocher1), they are richer in long-chain (LC) MUFA, in particular cetoleic acid (22 : 1n-11) with approximately 17–22 % compared with approximately 1 % in sardine(Reference Turchini, Ng and Tocher1). EPA and DHA are essential nutrients well known for their beneficial health effects both in salmon and humans(Reference Calder2–Reference Bou, Berge and Baeverfjord4). Compared with EPA and DHA, relatively little is known about the physiological functions and health impact of different MUFA found in fish oils. Some early studies reported that fish oils rich in MUFA may have beneficial effects on CHD in humans(Reference Opstvedt5). The MUFA were assumed to increase the peroxisomal β-oxidation and thereby improve the synthesis of the health-promoting long-chain n-3 fatty acids. Other health benefits of MUFA reported are hypolipidemic and anti-inflammatory effects(Reference Yang, Miyahara and Takemura6, Reference Yang, Miyahara and Iwasaki7). Recently, fish oils rich in MUFA were shown to attenuate atherosclerosis in mouse models(Reference Yang, Bando and Sakurai8). There are however very limited number of studies comparing the effects of different fish oils with the same levels of EPA and DHA and only differing in MUFA, which is required to be able to understand the specific MUFA effects. More studies are therefore required in order to elucidate the potential health impact of specific MUFA as for instance cetoleic acid.
It is known that dietary cetoleic acid is highly utilised as an energy source in salmon and trout(Reference Stubhaug, Lie and Torstensen9, Reference Sargent, Tocher and Bell10). Less is known for mammals, but the finding in rats that 22 : 1 fatty acids can first go through chain shortening by peroxisomal β-oxidation to 20 : 1, and then further to 18 : 1 and 16 : 1 through mitochondrial β-oxidation, indicates that this fatty acid could also be utilised as an energy source in mammals(Reference Bremer and Norum11). LC-MUFA are also found to increase the peroxisomal β-oxidation capacity in rats(Reference Halvorsen, Rustan and Madsen12). Peroxisomal β-oxidation is also responsible for converting 24 : 6n-3 to DHA, the last step in the synthesis of DHA(Reference Sprecher13) and this makes it interesting to study if cetoleic acid influences the capacity in both mammalian and fish species to convert α-linolenic acid (ALA; 18 : 3n-3) to EPA and DHA through the potential stimulation of peroxisomal β-oxidation. Studies have shown that the synthesis of EPA and DHA in Atlantic salmon can be stimulated to a certain degree by bioactive fatty acids from plants like petroselinic acid that stimulates peroxisomal β-oxidation(Reference Randall, Drew and Overland14). The high content of the MUFA petroselinic acid (18 : 1n-12) in coriander oil as supplement in the diet to rainbow trout increased cellular production of DHA in hepatocytes possibly due to increased peroxisomal β-oxidation(Reference Randall, Drew and Overland14). Neither Atlantic salmon nor humans can produce EPA and DHA by de novo synthesis. Both species are dependent on the essential fatty acid ALA, which is the precursor for EPA and DHA. The efficiency of the conversion of ALA to EPA and DHA is quite low in both species but can be improved by different factors. Both diet compositions, life stage, genotype, and growth influence the capacity for EPA and DHA synthesis in salmon(Reference Berge, Østbye and Kjær15–Reference Rosenlund, Obach and Sandberg20). In humans, it is shown that males and females have differences in the conversion capacities(Reference Burdge, Jones and Wootton21). In females, the conversion capacity of ALA to DHA was <10 %, whereas the capacity in males was <3 %(Reference Burdge, Jones and Wootton21, Reference Burdge and Wootton22). Interestingly in pregnant women, the plasma phosphatidylcholine-DHA concentration was increased between weeks 16 and 40 of gestation, possibly to facilitate DHA supply to the offspring(Reference Postle, Al and Burdge23).
EPA and DHA are synthesised through multiple steps from ALA, in a pathway that is relatively well conserved between different species(Reference Sprecher13), with similar enzymes responsible for the different steps in humans (reviewed by Zhang et al. (Reference Zhang, Kothapalli and Brenna24)) and salmon(Reference Hastings, Agaba and Tocher25, Reference Monroig, Zheng and Morais26). The pathway consists of several elongation and desaturation steps, in addition to a chain-shortening peroxisomal β-oxidation step producing DHA. Dietary fatty acids may exert a great influence on the efficiency of the pathway. High dietary levels of DHA inhibit, by feedback inhibition, the n-3 metabolic pathway both in humans and in Atlantic salmon(Reference Thomassen, Rein and Berge27–Reference Emken, Adlof and Duval29), whereas lack of DHA in the diet stimulates the n-3 fatty acid biosynthetic pathway in salmon(Reference Bou, Berge and Baeverfjord3, Reference Bou, Berge and Baeverfjord4, Reference Ruyter and Thomassen30). The DHA status in humans on vegetarian or vegan diets has been shown to be lower than those on omnivore diets (reviewed by Burdge et al. (Reference Burdge, Tan and Henry31)), but there appears to be no evidence of increased DHA biosynthesis in these groups(Reference Salem and Kuratko32). This is in contradiction to what is found in Atlantic salmon, where deficiency in EPA and DHA leads to a significant increase in their innate capacities for EPA and DHA production form ALA(Reference Bou, Berge and Baeverfjord3, Reference Ruyter and Thomassen30).
Because linoleic acid (18 : 2n-6) competes with ALA for the enzymes of the biosynthetic pathway of EPA and DHA, the linoleic acid content in the diet, which is in particular high in human diets, can influence the conversion of ALA to EPA and DHA. Dietary intake of ALA, on the other hand, has in several human studies been reported to increase EPA content in plasma phospholipid, but not increased DHA(Reference Burdge and Calder33). In Atlantic salmon studies, moderate dietary ALA levels have also been shown to increase EPA production(Reference Ruyter and Thomassen30).
Aquaculture production worldwide is expected to increase in the coming years, and at the same time, the availability of fish oil on the world market is stable but limited. This leads to a lack of the valuable n-3 fatty acids for fish feed production by the aquaculture industry, but possibly also for the production of n-3 products for human consumption by the nutraceutical industry if the world human population grows as expected(Reference Shepherd, Monroig and Tocher34). It is therefore of high importance to develop strategies to improve utilisation of existing fish oils by improving different species innate capacities for EPA and DHA production from ALA.
In the present study, the effect of cetoleic acid on the capacities for EPA and DHA synthesis from ALA was studied in vitro in human and salmon hepatocytes and in vivo in Atlantic salmon after dietary intake of fish oil rich in this fatty acid. Improved synthesis of EPA and DHA may have positive health effects in both humans and salmon.
Materials and methods
Materials
Atlantic salmon (Salmo salar, 200 g) for the in vitro study were obtained from NIVA. HepG2 cells (derived from the liver tissue of a patient with hepatocellular carcinoma) were purchased from American Type Culture Collection. NaCl, KCl, HEPES, EDTA, CaCl2, L-15, fetal bovine serum (FBS), sodium bicarbonate, penicillin–streptomycin solution (100×), Trypan blue, bovine serum albumin (BSA), PBS, Tris, peroxidase, FAD, NaOH, 2’7’-dichlorofluorescin diacetate (reduced form), palmitoyl coenzyme A lithium salt (PalmCoA) and 18 : 3n-3 were purchased from Sigma-Aldrich. L-15 Glutamax was obtained from Invitrogen, metacain from Norsk Medisinaldepot, laminin and chloroform from Merck Millipore, collagenase from Worthington, 14C-18 : 3n-3 from American Radiolabel Chemicals Inc., RNeasy Plus Mini Kit from Qiagen, Dulbecco's modified Eagle's medium (DMEM), PureLink Pro 96 RNA Purification Kit, PureLink Dnase set and primers from Thermo Fisher Scientific, SYBR Green I Master mix and LightCycler®480 from Roche Applied Science, TaqMan® Reverse Transcription Reagents from Applied Biosystems, cetoleic acid (22 : 1n-11) from BOC Sciences and lactate dehydrogenase assay from Abcam. Ecoscint A scintillation liquid was purchased from National Diagnostics Inc. The scintillation counter TRI-CARB 1900 TR was obtained from Packard Instrument Co.
Ethics statement
The feeding trial was performed at Nofima Sunndalsøra Research Station, which is approved by the Norwegian Animal Research Authority (NARA). Slaughtering and sampling of fish for both in vivo and in vitro trials were performed in accordance with the Norwegian Animal Welfare act. No NARA approval was required for the feeding trial according to Dr G. Bæverfjord (Nofima), appointed by NARA.
Isolation and culturing of salmon hepatocytes
Hepatocytes were isolated according to the method of Dannevig & Berg(Reference Dannevig and Berg35). The fish were anaesthetised in Metacain, the abdominal cavity exposed, and the vena porta cannulated. The liver was perfused with an EDTA buffer (0·14 m NaCl, 0·01 m KCl, 0·01 m HEPES, 0·02 m EDTA disodium salt, pH 7·4) to remove Ca and thereafter with a perfusion buffer containing collagenase (0·14 m NaCl, 0·01 m KCl, 0·01 m HEPES, 740 000 U/l collagenase, 0·001 m CaCl2, pH 7·4) to digest the tissue. The hepatocytes were subsequently isolated by gentle shaking of the digested liver in L-15 medium, filtered through a 100-μm nylon filter and washed three times in L-15 medium. The hepatocytes were resuspended in L-15 Glutamax culture medium containing 10 % FBS, 9 mm sodium bicarbonate, 1 % penicillin–streptomycin solution and 5 mm HEPES. Cell viability was assessed by staining with Trypan blue (0·4 %). Approximately 107 hepatocytes were plated onto 25 cm2 cell flasks precoated with laminin for the following analysis: capacity for conversion of ALA to EPA and DHA (four replicates), fatty acid composition (three replicates) and acyl-CoA oxidase enzyme activity (three replicates). Doses of 18 : 3n-3 and cetoleic acid are within physiological levels, and incubation time was selected based on experience from previous studies(Reference Bou, Østbye and Berge36). The cells were incubated for 3 h at 13°C prior to the addition of experimental medium containing 0, 20, 40, 60 or 80 μm cetoleic acid in L-15 Glutamax with 2 % FBS, 9 mm sodium bicarbonate, 1 % penicillin–streptomycin solution and 5 mm HEPES. The cells were cultured for 20 h and then added fresh experimental medium, in addition to 14C-18 : 3n-3 (final concentration of 7 μm) in cells designated for analysis of conversion capacity or non-radio-labelled in cells for the other analyses. The fatty acids 18 : 3n-3, 14C-18 : 3n-3 and cetoleic acid were added as a sodium salt bound to BSA (in the ratio 1:2·7). The cells were incubated for 48 h, and then washed twice in 1 % BSA and twice in PBS before harvesting in PBS for analysis of conversion capacity, fatty acid composition and acyl-CoA oxidase enzyme activity. Viability of the cells was assessed by lactate dehydrogenase assay and confirmed that the cells were not negatively affected by the treatment. Both prior to seeding of cells and prior to addition of cetoleic acid, the cells were evaluated in light microscopy. The cells appeared to have a purity of close to 95 % with presence of very few blood cells. Although the hepatocytes were the dominating cell type, we cannot exclude that other cells types naturally present in the liver will be a part of the hepatic cell culture. A mix of different cell types naturally existing in vivo will make the in vitro response more similar to the in vivo response.
Culturing of human HepG2 cells
Human HepG2 cells from three different cell batches were cultured in 25 cm2 cell flasks for the following analysis: conversion capacity (four replicates), gene expression (six replicates), fatty acid composition (three replicates) and acyl-CoA oxidase enzyme activity (three replicates). The cells were cultured in DMEM with 10 % FBS and incubated at 37°C and 5 % CO2. After 4 h, the cells were added experimental growth medium consisting of DMEM with 10 % FBS in addition to 0, 20, 40, 60 or 80 μm cetoleic acid. The same incubation times and doses of 18 : 3n-3 and cetoleic acid were used for the HepG2 in vitro trial as in the salmon hepatocytes study. The same procedure as described for the salmon hepatocytes above was followed. Cell viability, measured by lactate dehydrogenase activity, was not negatively affected by the treatment.
Analyses fatty acid composition and fat content
Total lipids were extracted from cells, feeds, whole fish (five fish prior start of the trial and from each tank at the end) and liver samples by the method described by Folch et al. (Reference Folch, Lees and Sloane Stanley37). The chloroform phase was evaporated to dryness under N2 gas and the residual lipid re-dissolved in chloroform. Methyl esters of fatty acids were made according to a method described by Mason & Waller(Reference Mason and Waller38) and Hoshi et al. (Reference Hoshi, Williams and Kishimoto39). The methyl esters of the fatty acids were thereafter separated in a gas chromatograph (Hewlett Packard 6890 and HP ChemStation software) with a split injector, SGE BPX70 capillary column (length 60 m, internal diameter 0·25 mm and a thickness of film of 0·25 μm) and flame ionisation detector. Helium was used as carrier gas, and injector and detector temperatures were both 280°C. The temperature was raised from 50 to 170°C at a rate of 4°C/min, and then raised to 200°C at a rate of 0·5°C/min, and finally to 300°C at a rate of 10°C/min. The relative quantity of each fatty acid was determined by measuring the area under the peak in the GC spectrum corresponding to that fatty acid.
The radio-labelled fatty acids in the cells from the in vitro trials with salmon and human hepatocytes were determined by reversed-phase HPLC as described by Narce et al. (Reference Narce, Gresti and Bezard40). The mobile phase was acetonitrile–water (85:15, v/v) at a flow rate of 1 ml/min and a temperature of 30°C. The column used was a symmetry 3·5 μm C18 column (Waters) and the fatty acids were detected with a radioactive flow detector A-100 (Radiomatic Instrument & Chemicals). Identification of each fatty acid was done by comparing the sample retention times with the retention times of fatty acid standards (American Radiolabel Chemicals Inc.). The absorbance of the non-radioactive fatty acid standards (Sigma-Aldrich) was measured in a UV detector (Waters 2996 PDA Detector) at 215 nm.
Prior to incubation, aliquots of 10, 20, 40 and 50 μl of the 14C-18 : 3n-3 stock solution were transferred into different vials together with 5 ml of Ecoscint A scintillation liquid in order to count total radioactivity. The specific radioactivity (cpm/nmol fatty acid) was calculated for the 14C-18 : 3n-3 substrate. The samples were counted in a scintillation counter TRI-CARB 1900 TR (Packard Instrument Co.). The total radioactivity for all the detected fatty acids were set to 100 %, and the relative distribution of each fatty acid calculated according to that.
Analysis of acyl-CoA oxidase enzyme activity
Hepatocytes (harvested from 25 cm2 cell flasks) were resuspended in PBS (30 μl) and added 190 μl assay mix (0·710 ml H2O, 0·2 ml 0·5 m Tris pH 8·5, 0·050 ml 1 mg/ml peroxidase, 0·010 ml 60 mg/ml BSA), 3 μl FAD (1·3 mg/ml), 3 μl 2·5mg/ml in 0·01 m NaOH 2′,7′-dichlorofluorescein diacetate and 3 μl 6 mg/ml PalmCoA in Tris 0·1 m buffer pH 8·5. Change in absorbance at 502 was recorded for 3 min. Activity of acyl-CoA oxidase (ACO) was defined as:
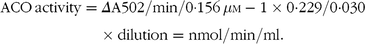 $$\matrix{{{\rm{ACO}}\,{\rm{activity}}} \hfill & = \hfill & {\Delta {\rm{A502/min/0}} \cdot {\rm{156}}{\mkern 1mu} \mu {\rm{M}} - {\rm{1}} \times {\rm{0}}\cdot{\rm{229/0}}\cdot{\rm{030}}} \hfill \cr {} \hfill & {} \hfill & { \times {\rm{ dilution}} = {\rm{nmol/min/ml}}{\rm{.}}} \hfill \cr } $$
Enzyme activities in both cell types were measured at room temperature (20°C), which is higher than the normal body temperature for salmon and lower than the normal body temperature for human cells. However, for both cell types, the method is established for 20°C.
Production of experimental diets for Atlantic salmon
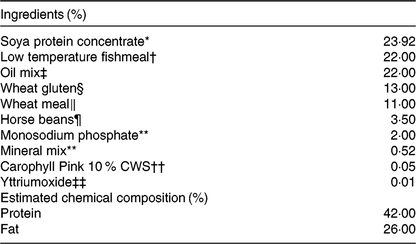
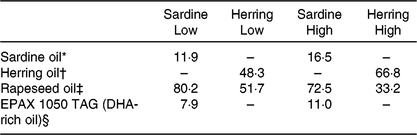
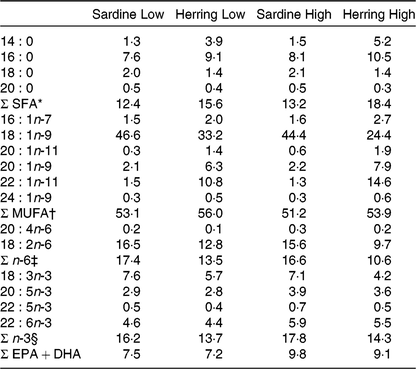
The four diets were designed to contain either sardine oil (low in cetoleic acid) or herring oil (high in cetoleic acid) at two different inclusion levels of the oils (Low Sardine, Low Herring, High Sardine or High Herring). The cetoleic acid content within the Low and High diets therefore varied according to type of fish oil, whereas the EPA + DHA contents were balanced within each fish oil inclusion level with EPAX 1050 TAG oil. Ingredients and chemical composition of the basal diet were adapted to Atlantic salmon from about 100 g (Table 1). All ingredients, except for the oils, were mixed to a basal diet in which soya protein concentrate, low temperature (LT) fishmeal and wheat gluten constituted the primary source of protein. Yttrium oxide was used as marker for determining the digestibility of the nutrients. The mixture was then extruded in a Wenger TX-52 twin screw extruder to produce pellets of approximately 3 mm diameter. The pellets were dried and divided into four equal batches. Each batch was added the various oil mixtures (Table 2) using a vacuum coater. An overview of the fatty acid composition of the diets is given in Table 3 (quantitative values for fatty acid composition of the diets in Supplementary Table S1).
Chemical composition of the diets (%)
* EWOS, Norway.
† Welcon, Egersund, Norway.
‡ See Table 2 for details.
§ Tereos Syral, Belgium.
‖ Norgesmøllene, Bergen, Norway.
¶ Socomac Rouen, France.
** Normin, Norway.
†† DSM, France.
‡‡ VWR, Norway.
Oil mixtures added to the diets (% of total oil added)
* Emmelev, Denmark.
† Vedde, Norway.
‡ Epax AS, Norway.
§ Norsildemel, Norway.
Fatty acid composition of the diets (% of total fatty acids)
* Includes 15 : 0, 17 : 0, 22 : 0, 24 : 0.
† Includes 14 : 1n-5, 16 : 1n-9, 17 : 1n-7, 18 : 1n-7, 20 : 1n-7, 22 : 1n-9, 22 : 1n-7.
‡ Includes 16 : 2n-6, 18 : 3n-6, 20 : 2n-6, 20 : 3n-6, 22 : 4n-6.
§ Includes 16 : 2n-3, 18 : 4n-3, 20 : 4n-3, 20 : 3n-3.
Feeding trial with Atlantic salmon
Atlantic salmon (101–115 g) were randomly distributed into twelve tanks, thirty fish in each tank. The fish were fed one of four feeds, three replicate tanks per feed. All tanks were equipped to collect waste feeds. An estimated excessive feeding of 20 % was practiced, and daily feed intake was recorded in order to measure feed conversion ratio (FCR). The experiment was done in saltwater (31·6 ‰) at an average temperature of 8·4°C. The initial water temperature was 8·2°C, but during the first 6 weeks, the water temperature gradually declined to 7·1°C. Heated water was used the rest of the trial period to improve feed intake and achieve the planned growth. The temperature throughout the final period was at 9·9°C. The experiment lasted 67 d to a final average fish weight of 242 g. At start and at the end of the experimental period, all experimental fish were weighed in bulk. Fish were anaesthetised in MS222 prior sampling. Whole fish were sampled for analyses of whole-body fat content and fatty acid composition (each sample consisting of a pool of five fish per tank). Liver samples for analysis of fat content and fatty acid composition were sampled, quickly frozen in liquid N2 and stored at –80°C until analysis.
Calculation of hepatosomatic index and growth parameters
Hepatosomatic index (HSI, %) was calculated as follows:
 $${\rm{HSI}} = {\rm{liver\,weight/body\,weight }} \times {\rm{100}}$$
The growth rate was calculated as both specific growth rate (SGR) and thermal growth coefficient (TGC). The following formulas were used:
 $${\rm{SGR}}\,\left ( {\% {\rm{d}} - {\rm{1}}} \right) = \left( {{\rm{lnW2}} - {\rm{lnW1}}} \right)\left( {{\rm{t2}} - {\rm{t1}}} \right) - {\rm{1}} \times {\rm{100}}$$
 $${\rm{TGC}} = \left( {{\rm{W}}{{\rm{2}}^{{\rm{1/3}}}} - {\rm{W}}{{\rm{1}}^{{\rm{1/3}}}}} \right){\rm{/}}\left( {\left( {{\rm{t2}} - {\rm{t1}}} \right) \times {\rm{T}}} \right) - {\rm{1}} \times {\rm{1000}}$$
where W1 and W2 are the average weight (g) at the start (t1) and end (t2) of the trial, and T is the average temperature during the period.
FCR was calculated as follows:
 $${\rm{FCR = weight}}\;({\rm{g)}}\;{\rm{of}}{\mkern 1mu} {\rm{feed}}{\mkern 1mu} {\rm{eaten/growth}}{\mkern 1mu} {\rm{of}}{\mkern 1mu} {\rm{biomass}}\;({\rm{g)}}.$$
Total fat content and fatty acid composition in fish and feed, as well as feed intake and growth in each tank, were used to calculate the retention (R) of fatty acids in fish from each group:
 $${\rm{R}}{\mkern 1mu} \left( \% \right) = \left( {{\rm{F}}{{\rm{A}}_{\rm{2}}} - {\rm{F}}{{\rm{A}}_{\rm{1}}}} \right){\rm{/F}}{{\rm{A}}_{\rm{s}}} \times {\rm{100}},$$
where FA2 is amount of fat or fatty acid in whole fish at the end of the experimental period, FA1 is amount of fat or fatty acid in whole fish at start of the trial and FAs are amount of fat or fatty acids eaten during the period.
Statistics
For the in vitro trials, flasks were used as experimental units with three replicates for endogenous fatty acid composition and acyl-CoA oxidase enzyme activity, and four replicates for the conversion capacity of ALA to EPA and DHA. Data from the salmon feeding trial are given as mean values of three replicate units (n 3; three tanks per dietary group, five fish per tank to a total of fifteen fish per dietary group). All data from the in vitro trials, except endogenous fatty acid composition (Table 4), were subjected to one-way ANOVA, and significant differences (P ≤ 0·05) were ranked according to Tukey–Kramer test. Endogenous fatty acid composition in HepG2 and salmon hepatocytes and the data from the in vivo trial were analysed by t test comparing the sardine groups with the herring groups within the Low and High groups, respectively. The software SAS 9.4 (SAS Institute Inc., 2002–2012) and Microsoft® Office Excel were used for the statistical analyses.
Endogenous fatty acid composition (% of total fatty acids) of human HepG2 control cells and salmon control hepatocytes‖
(Mean values and standard deviations, n 3)
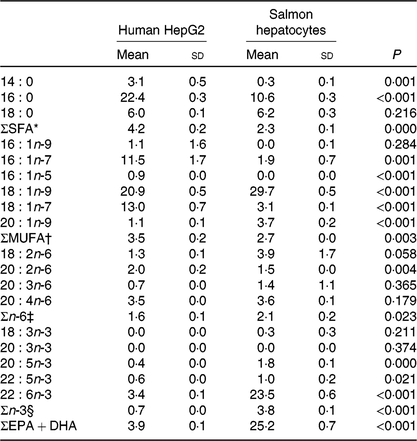
* Includes 12 : 0, 15 : 0, 17 : 0, 20 : 0, 24 : 0.
† Includes 14 : 1n-5, 15 : 1, 16 : 1n-5, 17 : 1n-7, 18 : 1n-11, 20 : 1n-7, 20 : 1n-11, 22 : 1n-9, 22 : 1n-7, 24 : 1n-9.
‡ Includes 18 : 3n-6.
§ Includes 18 : 3n-3, 18 : 4n-3, 20 : 3n-3.
‖ Significant differences (P < 0·05) were ranked according to t test.
Results
Endogenous fatty acid composition of human HepG2 cells and salmon primary hepatocytes
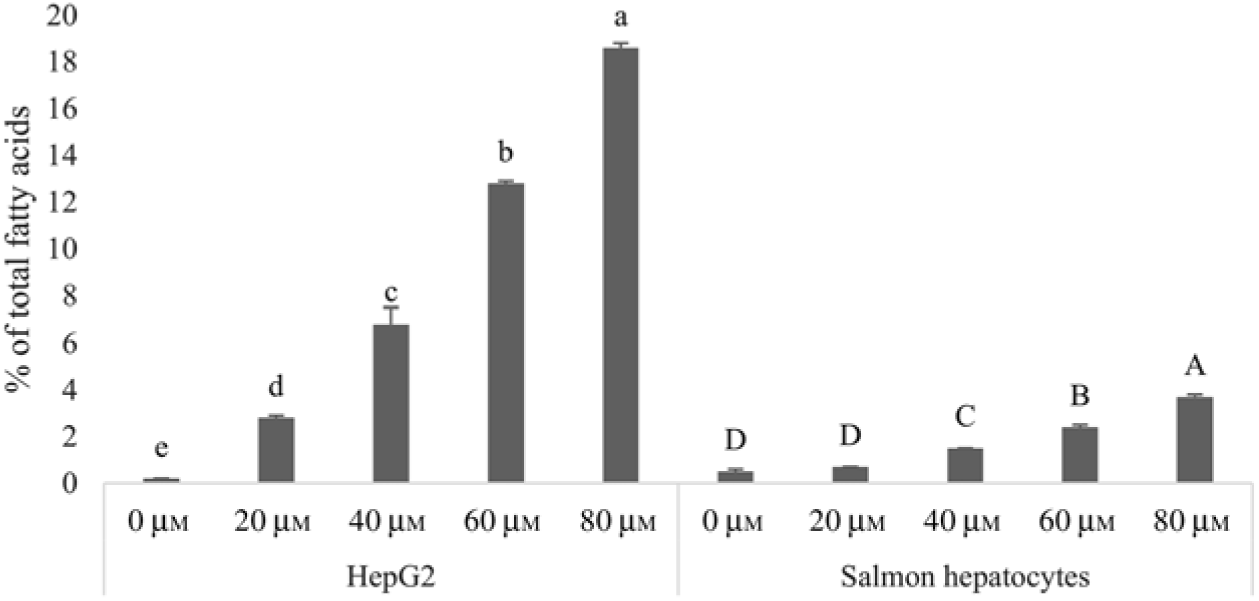
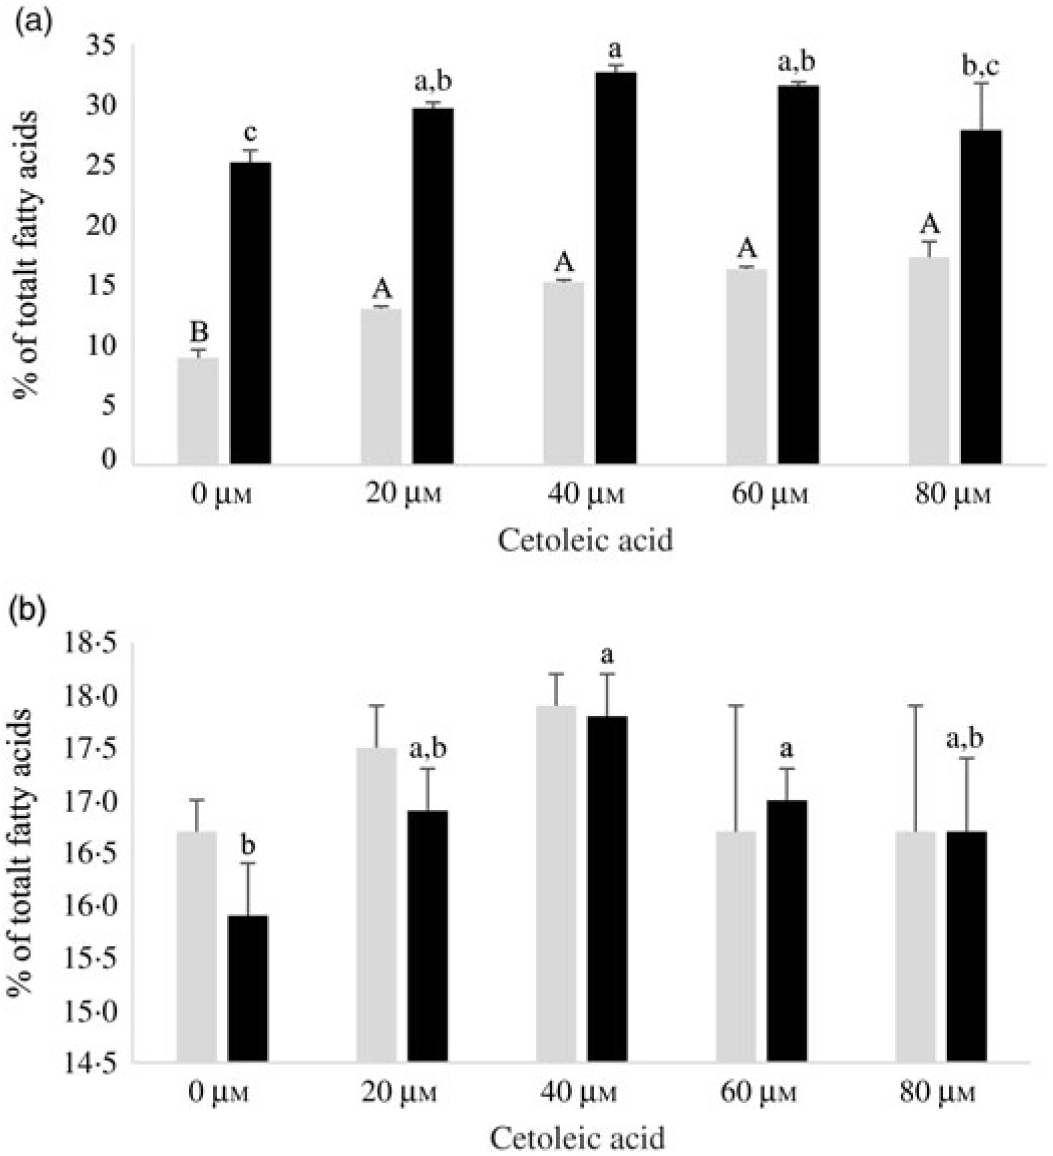
Human HepG2 cells and primary hepatocytes from Atlantic salmon differed in endogenous fatty acid compositions, prior to enrichment with cetoleic acid, as shown in Table 4. The salmon hepatocytes had a 7-fold higher percentage of EPA + DHA than human HepG2 cells. The HepG2 cells, however, had higher percentages of fatty acids known to be part of the de novo lipogenesis, 14 : 0 and 16 : 0, and their Δ-9 desaturation and elongation products 16 : 1n-7 and 18 : 1n-7. The salmon cells had approximately 1·5 times higher percentage of 18 : 1n-9 and three times higher 18 : 2n-6 compared with human HepG2 cells. Salmon hepatocytes contained only low levels of 18 : 3n-3, whereas the fatty acid was not detected in HepG2 cells. When both cell types were supplemented with increasing doses from 0 to 80 μm of cetoleic acid to the culture media, the endogenous concentrations of cetoleic acid increased from 0·2 to 18·6 % (of total fatty acids) in HepG2 cells and from 0·5 to 3·7 % in salmon hepatocytes (Fig. 1).
Cetoleic acid (% of total fatty acids) in HepG2 and salmon hepatocytes incubated with different doses of cetoleic acid (0–80 μm). Values are means (n 3), with standard errors represented by vertical bars. a,b,c,d,e Mean values for HepG2 with unlike letters were significantly different (P ≤ 0·05, Tukey–Kramer test). A,B,C,D Mean values for salmon hepatocytes with unlike letters were significantly different (P ≤ 0·05, Tukey–Kramer test).
Capacity to convert 14C-18 : 3n-3–14C-20 : 5n-3 and 14C-22 : 6n-3 in human HepG2 cells and salmon hepatocytes
Both HepG2 cells and salmon hepatocytes were incubated with the 14C-18 : 3n-3 substrate in order to study how different endogenous concentrations of cetoleic acid influence the n-3 metabolic pathway in the cells. There were only minor differences in total cellular nmol of radio-labelled fatty acids recovered in the different treatment groups in the two cell types after the incubation period, showing similar uptake of 14C-18 : 3n-3 substrate (online Supplementary Table S2). There was an increasing production of 14C-20 : 5n-3 and 14C-22 : 6n-3 from 14C-18 : 3n-3 in both cell types with increasing concentrations of cetoleic acid up to 40 µm in culture media, and thereafter the production levelled off or decreased (Fig. 2). Of the total radioactive products recovered in HepG2 control cells, the main fatty acids were 14C-20 : 5n-3 (25 %), 14C-20 : 4n-3 (11 %) and 14C-22 : 6n-3 (9 %), while in salmon control hepatocytes, the main products were 14C-22 : 6n-3 (17 %), 14C-20 : 5n-3 (16 %) and 14C-20 : 3n-3 (6 %) (Fig. 2 and 3, online Supplementary Table S2). While the salmon cells produced almost equal amounts of 20 : 5n-3 and 22 : 6n-3, the HepG2 cells produced approximately 3-fold more 20 : 5n-3 than 22 : 6n-3 in the control cells (Fig. 2). The high proportion of 20 : 4n-3 in addition to 20 : 5n-3 in the HepG2 indicates that the further desaturation and elongation to 22 : 6n-3 is more limited than in Atlantic salmon cells, where more equal amounts of 20 : 5n-3 and 22 : 6n-3 are produced (Fig. 3).
EPA (14C-20 : 5n-3; ![]() ) and DHA (14C-22 : 6n-3;
) and DHA (14C-22 : 6n-3; ![]() ) in HepG2 (a) and salmon hepatocytes (b) incubated with different doses of cetoleic acid (0–80 μm). Values are means (n 4), with standard errors represented by vertical bars. a,b,c Mean values for EPA with unlike letters were significantly different (P ≤ 0·05, Tukey–Kramer test). A,B Mean values for DHA with unlike letters were significantly different (P ≤ 0·05, Tukey–Kramer test).
) in HepG2 (a) and salmon hepatocytes (b) incubated with different doses of cetoleic acid (0–80 μm). Values are means (n 4), with standard errors represented by vertical bars. a,b,c Mean values for EPA with unlike letters were significantly different (P ≤ 0·05, Tukey–Kramer test). A,B Mean values for DHA with unlike letters were significantly different (P ≤ 0·05, Tukey–Kramer test).

14C-20 : 3n-3 (![]() ) and 14C-20 : 4n-3 (
) and 14C-20 : 4n-3 (![]() ) in HepG2 (a) and salmon hepatocytes (b) incubated with different doses of cetoleic acid (0–80 μm). Values are means (n 4), with standard errors represented by vertical bars. a,b,c Mean values for 14C-20 : 4n-3 with unlike letters were significantly different (P ≤ 0·05, Tukey–Kramer test). A,B Mean values for 14C-20 : 3n-3 with unlike letters were significantly different (P ≤ 0·05, Tukey–Kramer test).
) in HepG2 (a) and salmon hepatocytes (b) incubated with different doses of cetoleic acid (0–80 μm). Values are means (n 4), with standard errors represented by vertical bars. a,b,c Mean values for 14C-20 : 4n-3 with unlike letters were significantly different (P ≤ 0·05, Tukey–Kramer test). A,B Mean values for 14C-20 : 3n-3 with unlike letters were significantly different (P ≤ 0·05, Tukey–Kramer test).
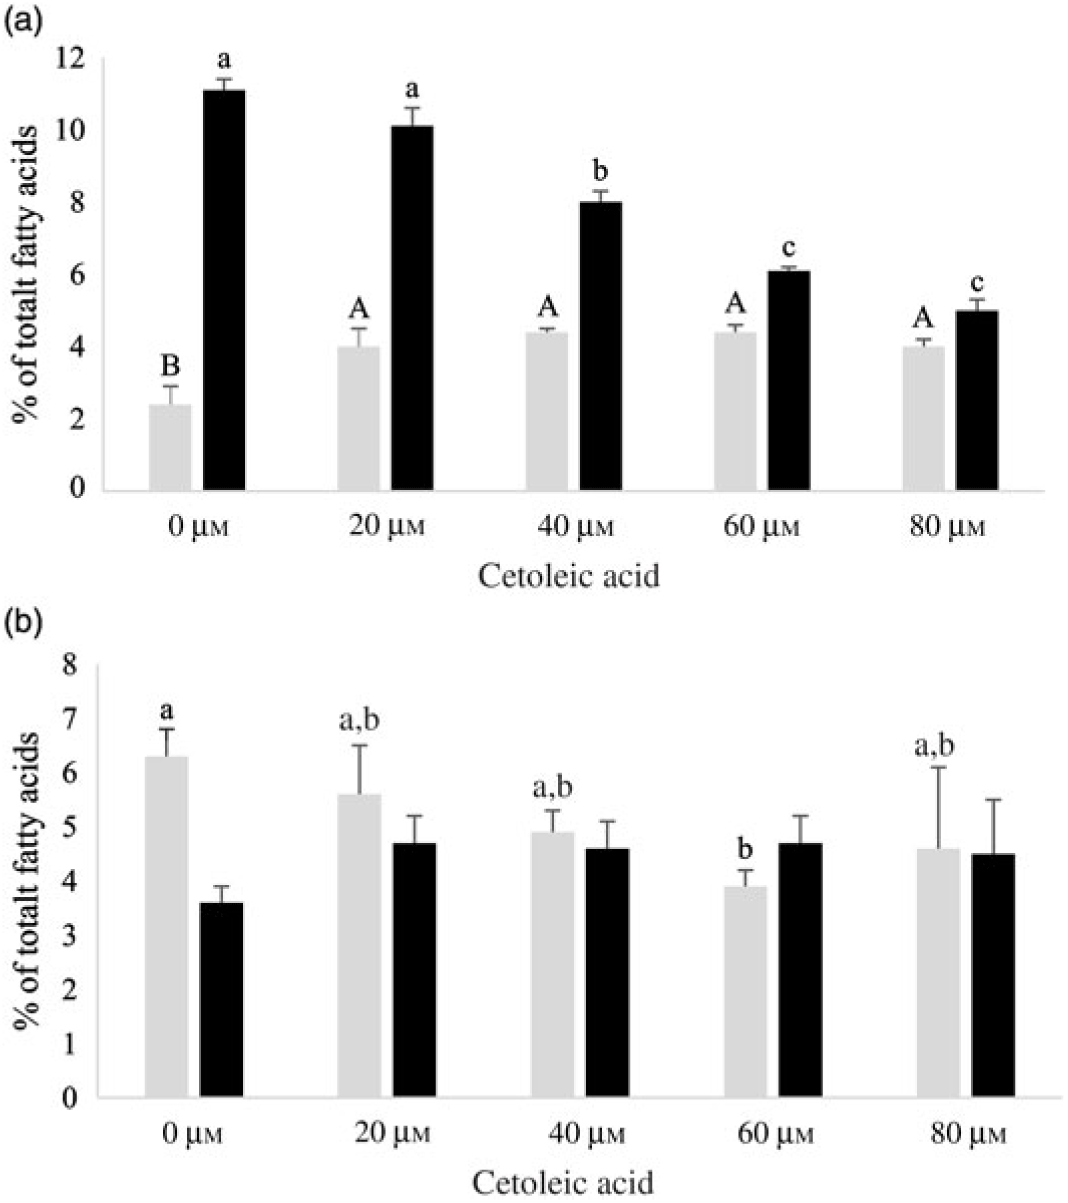
In HepG2 cells, increasing endogenous levels of cetoleic acid led to significantly higher productions of both 14C-20 : 5n-3, 14C-20 : 3n-3, and 14C-22 : 6n-3, with 1·3 times more 14C-20 : 5n-3 in the cells cultured with 40 μm cetoleic acid and almost two times more 14C-22 : 6n-3 in the cells cultured with 80 μm cetoleic acid than in the control cells (Fig. 2 and 3). Probably as a result of this increased conversion to 14C-20 : 5n-3 and 14C-22 : 6n-3, the levels of 14C-20 : 4n-3, 14C-22 : 5n-3 and 14C-24 : 6n-3 were lower in HepG2 cells with cetoleic acids than in the control cells (online Supplementary Table S2). Approximately 2–4 % of the radio-labelled substrate in HepG2 cells was found as 14C-20 : 3n-3, which is part of the alternative route to 20 : 4n-3, by-passing 18 : 4n-3. The level of 14C-20 : 3n-3 was up to 1·8 times higher in HepG2 cells with cetoleic acid compared with the control cells.
In salmon hepatocytes, up to 2·9 times higher level of 14C-18 : 4n-3, 1·4 times of 14C-20 : 4n-3 and 1·2 times of 14C-20 : 5n-3 were measured in cells cultured with cetoleic acid compared with the control cells (Fig. 2 and 3, online Supplementary Table S2). The synthesis of 14C-22 : 6n-3 was not different between the groups, but there was a tendency towards higher level of 14C-22 : 6n-3 in cells stimulated with 20 and 40 μm cetoleic acid. In salmon hepatocytes, between 4 and 6 % of the radio-labelled substrate was converted to 14C-20 : 3n-3, involved in the alternative pathway. The control cells had the highest level of 14C-20 : 3n-3, whereas cells added the higher doses of cetoleic acid showed 0·6–0·7 times of the level in control cells.
Compared with the salmon hepatocytes, the human cells showed a higher conversion to 14C-20 : 5n-3; 25–33 % v. 16–18 % of total fatty acids, irrespective of endogenous level of cetoleic acid (Fig. 2). The level of 14C-22 : 6n-3 synthesised was nearly 2-fold higher in salmon control cells compared with HepG2 control cells, but with increased endogenous level of cetoleic acid the production in HepG2 was similar to the maximal production in salmon hepatocytes, 9–17 % in human hepatocytes v. 17–18 % in salmon hepatocytes. Interestingly, this was reflected in the ratio between 20 : 5n-3 and 22 : 6n-3 which was approximately 3:1 in the HepG2s control cells and almost 2:1 in the cells cultured with cetoleic acids. In salmon hepatocytes, this ratio was close to 1:1 for all groups.
Acetyl-CoA oxidase enzyme activity in human and salmon hepatocytes
There were no significant differences in peroxisomal acetyl-CoA oxidase activity between control cells and cells cultured in cetoleic acid for both cell types (data not shown). The enzyme activity in HepG2 stimulated with 20 μm cetoleic acid was however higher than in cells stimulated with 60 and 80 μm of cetoleic acid. In human HepG2 cells, the enzyme activities varied between 0·6 and 0·8 nmol/min per mg protein, whereas in salmon hepatocytes the enzyme activities were nearly 2-fold higher; 1·1–1·6 nmol/min per mg protein. Enzyme activities in both cell types were measured at room temperature at 20°C, indicating higher capacities in salmon liver cells than in human liver cells.
Fatty acid compositions of diets in feeding trial with Atlantic salmon
In order to study if cetoleic acid influences the n-3 metabolic pathway when given in the diet, Atlantic salmon were fed either sardine oil low in cetoleic acid or herring oil high in cetoleic acid at two inclusion levels (Low or High) that were balanced for EPA + DHA content. Table 3 shows the fatty acid composition of the four different diets. The two sardine oil diets contained approximately 1·4 % cetoleic acid, whereas cetoleic acid accounted for 10·8 and 14·8 % of total dietary fatty acids in the Low and High Herring oil diets, respectively. The EPA and DHA were approximately equally balanced with a sum of EPA + DHA of 7·5 % in the Sardine Low and 7·2 % in Herring Low, 9·8 % in Sardine High, and 9·1 % in Herring High. The SFA (mainly 16 : 0 and 14 : 0) were higher in the Herring diets (16–18 %) than in the Sardine diets (13–16 %). The Herring diets, however, had a lower level (1·4 %) of 18:0 compared with the Sardine diets (2·0–2·1 %). The n-6 fatty acids, mainly 18 : 2n-6, were 1·3 times higher in Sardine Low than in Herring Low, and 1·6 times higher in Sardine High than in Herring High.
Growth and feed conversion ratio of salmon
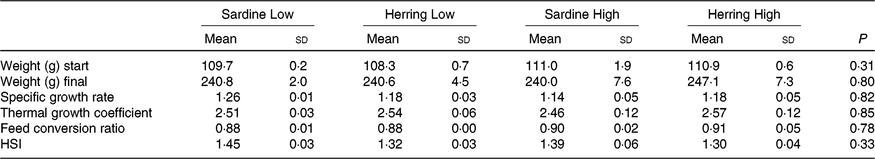
The experimental fish in all dietary groups more than doubled their weight during the 2 months feeding trial from approximately 110 to approximately 240 g (Table 5 ). There were no differences in growth rate between the four dietary groups with specific growth rate of 1·15–1·18 and thermal growth coefficient of 2·46–2·57. The FCR was between 0·88 and 0·91 and there were no differences between the dietary groups. There was low mortality in the trial; only one dead fish was registered.
Growth parameters and hepatosomatic index (HSI) of salmon-fed diets based on two different levels (Low and High) of sardine or herring oil (Mean values and standard deviations, n 3; three tanks per dietary group, five fish per tank to a total of fifteen fish per dietary group)
Hepatosomatic index, fat percentage and fatty acid composition of salmon liver
There was a tendency towards lower level of liver fat (%) in the Herring Low compared with Sardine Low (8·4 v. 11·6 %), and in Herring High compared with Sardine High (6·6 v. 9·5 %) (Table 5). There were no significant differences in HSI between the dietary groups, but numerically lower HSI in the groups fed a diet containing herring oil (HSI at 1·3) v. the groups fed the corresponding diet containing sardine oil (HSI at 1·4–1·5) (Table 5). The level of cetoleic acid (%) in the liver reflected the fatty acid composition of the diets with 6–7 times higher level in the Herring groups compared with their corresponding Sardine groups (Table 6; quantitative levels of fatty acids in liver are shown in online Supplementary Table S3). There was no difference in the level of cetoleic acid between the Sardine groups, but the Herring High group had approximately 1·4 times higher level than the Herring Low group.
Fat (%) and fatty acid composition (% of total fatty acids) in liver of salmon-fed diets based on two different levels (Low and High) of sardine or herring oil, respectively‖
(Mean values and standard deviations, n 3; three tanks per dietary group, five fish per tank to a total of fifteen fish per dietary group)
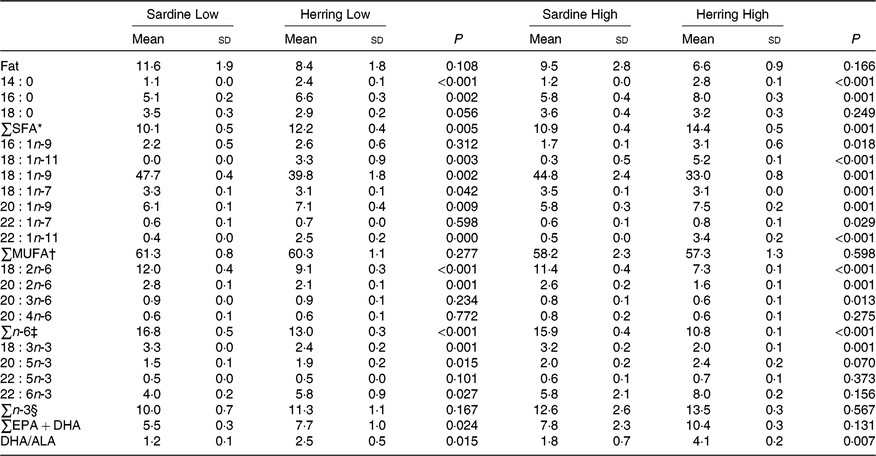
* Includes 17 : 0, 20 : 0, 22 : 0.
† Includes 14 : 1n-5, 15 : 1, 16 : 1n-7, 16 : 1n-5, 17 : 1n-7, 18 : 1n-9T, 20 : 1n-11, 20 : 1n-7, 24 : 1n-9.
‡ Includes 16 : 2n-6, 18 : 3n-6.
§ Includes 18 : 4n-3, 20 : 4n-3, 20 : 3n-3.
‖ Significant differences (P ≤ 0·05) were ranked according to t test within Low and High groups, respectively.
The level of EPA was significantly higher in the Herring Low compared with the Sardine Low group (1·9 v. 1·5 %), and almost in the Herring High compared with the Sardine High group (2·4 v. 2·0 %, P = 0·070). Herring Low also showed significantly higher level of DHA compared with Sardine Low (4·0 v. 5·8 %); however, there was no significant difference between the two High groups. The sum of EPA + DHA was more than 1·3 times higher in the Herring High group (10 %) than in the other groups (6–8 %). The DHA to ALA ratio may be considered as an indicator of bioconversion capacity from ALA to DHA in the liver, and this ratio was approximately 2-fold higher in the Herring groups compared with in their corresponding Sardine groups.
Interestingly, although not available in any of the diets, 18 : 1n-11 accounted for 3 and 5 % of total fatty acids in the Low and High Herring groups, respectively. The level of 18 : 1n-11 was close to 0 % in the livers of the Sardine groups.
The total SFA and total n-6 fatty acids more or less reflected the dietary composition with a higher level of total SFA in the Herring groups and higher level of n-6 fatty acids in the Sardine groups.
Fat content, fatty acid composition and retention in whole body of salmon
There were no differences in total fat content of whole body between the dietary groups. The EPA content was nearly significantly higher (P = 0·06) in whole body of the Herring High group than in the Sardine High group (3·1 v. 2·7 %), whereas the EPA level in the Herring Low group was not different from that in the Sardine Low group (Table 7; quantitative levels of fatty acids in whole body are shown in online Supplementary Table S4). There were no significant differences in the level of DHA or total n-3 fatty acids between the Sardine Low and the Herring Low groups, or between the Sardine High and the Herring High groups. Despite of a lower dietary DHA content in the Herring groups compared with those in the corresponding Sardine groups, equal or even higher DHA percentages were observed in the whole body from salmon receiving the Herring diets. Both Herring groups had significantly higher levels of SFA than the Sardine groups, 17·0–18·4 v. 15·5–16·0 %. The fatty acids 18 : 0, 16 : 0 and 14 : 0 were the main contributors to the measured level of SFA, reflecting the composition of these fatty acids in the diet. The Sardine groups had significantly higher levels of total n-6 fatty acids than the Herring groups (1·2–1·3 times higher), with 18 : 2n-6 being the most prominent fatty acid. The level of cetoleic acid reflected the composition of the diet, with approximately three times higher levels in the Herring groups compared with the Sardine groups, and Herring High with the highest level (1·3 times higher than Herring Low). The liver level of cetoleic acid (in mg/g) was approximately 2 times higher for the Herring groups and almost 1·3 times higher for the Sardine groups than in the whole body. The main contributor to the MUFA level, 18 : 1n-9, was significantly higher in the Sardine groups (37 % in the High and 35 % in the Low groups) compared with the Herring groups (26 % in the High and 31 % in the Low groups). The ratio DHA to ALA was significantly higher for both Herring groups than in the comparable Sardine groups, indicating increased synthesis capacity of the n-3 pathway in these groups.
Whole-body fat level (%) and fatty acid composition (% of total fatty acids) of salmon-fed diets based on two different levels (Low and High) of sardine or herring oil, respectively‖
(Mean values and standard deviations, n 3; three tanks per dietary group, five fish per tank to a total of fifteen fish per dietary group)
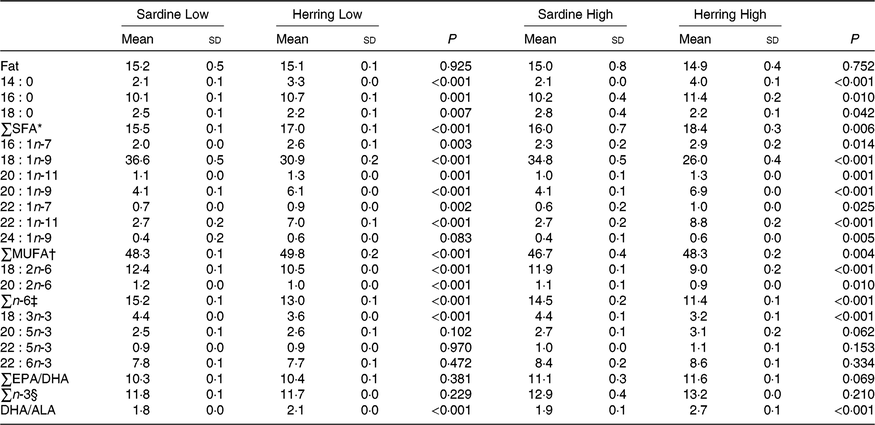
* Includes 20 : 0.
† Includes 20 : 1n-7.
‡ Includes 18 : 3n-6, 20 : 3n-6, 20 : 4n-6, 22 : 4n-6.
§ Includes 20 : 4n-3, 20 : 3n-3.
‖ Significant differences (P ≤ 0·05) were ranked according to t test within Low and High groups, respectively.
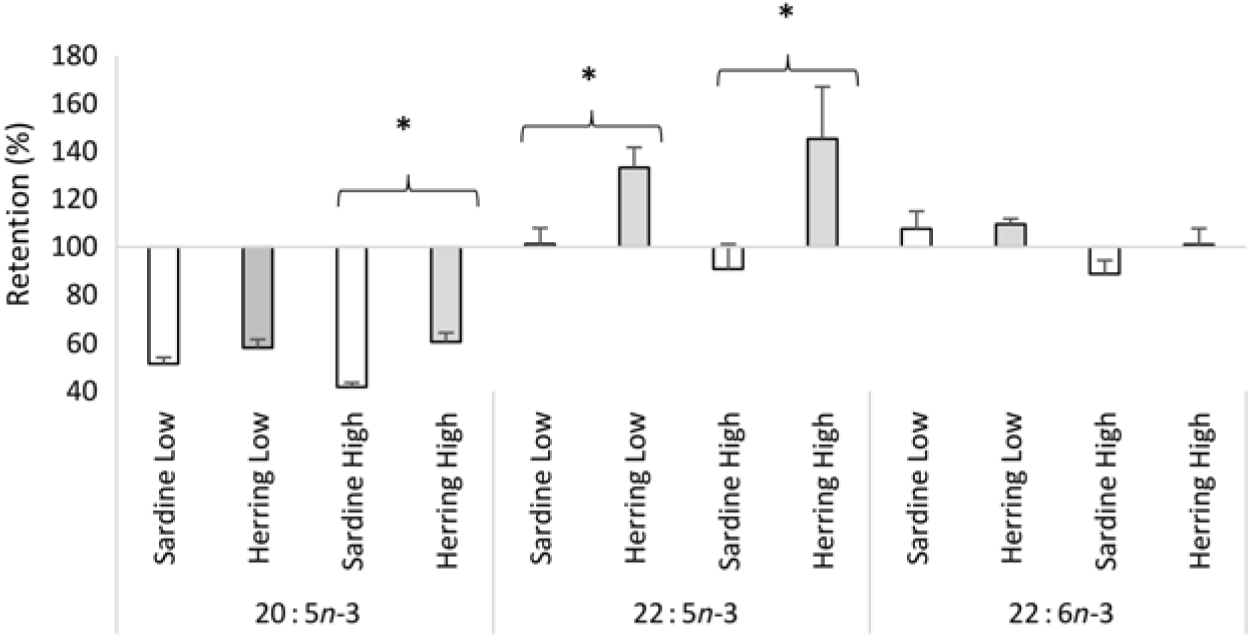
Whole-body apparent retention of EPA, 22 : 5n-3, and EPA + DHA was significantly higher in fish fed the highest dietary content of herring oil compared with sardine oil (Table 8, Fig. 4). The Herring High group had approximately 15 % points higher retention of EPA + DHA compared with Sardine High. There was also significantly higher retention of 22 : 5n-3 and nearly significantly higher retention of EPA (P = 0·059) in Herring Low compared with Sardine Low. The retention of cetoleic acid was not different between the dietary groups.
Retention of fat and fatty acids (%) in whole body of salmon-fed diets based on two different levels (Low and High) of sardine or herring oil, respectively* (Mean values and standard deviations, n 3; three tanks per dietary group, five fish per tank to a total of fifteen fish per dietary group)
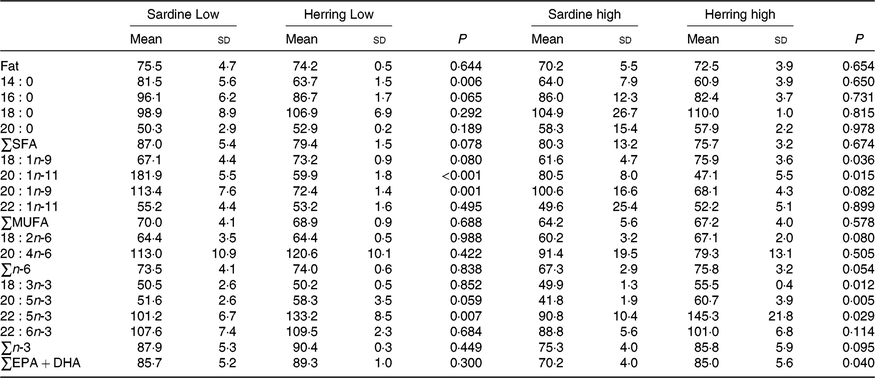
*Significant differences (P ≤ 0·05) were ranked according to t test within Low and High groups, respectively.
Retention of EPA, docosapentaenoic acid and DHA in Atlantic salmon-fed diets based on two different levels (Low and High) of sardine or herring oil, respectively. Values are means (n 3; three tanks per dietary group), with standard deviations represented by vertical bars. * Significant difference between sardine and herring groups (P ≤ 0·05, t test).
Discussion
In the present study, we demonstrate for the first time that cetoleic acid, either provided from herring oil in the diet of Atlantic salmon or as supplementation in pure form to growth media of human and salmon cell models, resulted in higher capacities of all experimental systems to convert ALA to EPA and DHA. Interesting species-specific differences were revealed when comparing human HepG2 cells with salmon hepatocytes. Although DHA is known to inhibit the n-3 metabolic pathway(Reference Thomassen, Rein and Berge27–Reference Emken, Adlof and Duval29) and the salmon cells had almost 10-fold higher endogenous level of DHA than the human HepG2 cells, more radio-labelled DHA was produced from ALA in salmon cells than in HepG2 cells. Also, a higher ratio of EPA to DHA of 3 : 1 in human HepG2 cells compared with a more equal ratio (1:1) in salmon hepatocytes indicates a more restricted further desaturation and elongation from EPA to DHA in HepG2 cells than in salmon hepatocytes, implying that the last steps in bioconversion from EPA to DHA is a limiting step in the n-3 metabolic pathway in the human cells. This is in agreement with previous findings showing that increased dietary intake of ALA in humans, led to increased EPA content in plasma phospholipid, but not increased DHA, indicating a limited capacity for DHA production from EPA(Reference Burdge and Calder33).
The reason for the higher capacity to produce DHA even at relatively high endogenous levels of DHA in salmon cells, was recently discussed in a study by Bou et al. (Reference Bou, Østbye and Berge36), and may be due to elongation of ALA to 20 : 3n-3 via elongase 5, and thereby bypassing the Δ6 desaturase step of the pathway converting ALA to 18 : 3n-4 (which is inhibited by DHA). Previously, 20 : 3n-3 was considered as a dead-end product of the LC-PUFA synthesis pathway. However, both in mammals and teleosts, there is an alternative Δ8 pathway for the synthesis of LC-PUFA(Reference Monroig, Li and Tocher41–Reference Stroud, Nara and Roqueta-Rivera43). By the Δ8 desaturase activity, 20 : 3n-3 is converted to 20 : 4n-3, a precursor for EPA. This pathway represents an alternative route to synthesise EPA independently of Δ6 desaturase activity. The regulatory mechanisms for neither elongation or desaturation of ALA, nor for the Δ8 desaturase activity, are known. The cellular DHA content, however, seems to have a major effect modulating the activity of the pathway by regulating the conversion of ALA to either 20 : 3n-3 or 18 : 4n-3(Reference Bou, Østbye and Berge36). Salmon hepatocytes with high cellular level of DHA had enhanced the production of 20 : 3n-3(Reference Bou, Østbye and Berge36, Reference Ruyter, Rosjo and Einen44–Reference Stubhaug, Tocher and Bell46).
However, stimulation of the cells with cetoleic acid in our study demonstrates a potential to improve the conversion capacity from ALA to DHA in HepG2 cells, since cetoleic acid reduced the ratio EPA:DHA from 3:1 to 2:1 and increased 2-fold the production of DHA compared with control cells. At increasing dietary doses of cetoleic acid, the ratio of 20 : 3n-3 to 20 : 4n-3 was also reduced, maybe indicating that this bypass route gets more important with cetoleic acid in the diet and thereby one possible factor explaining the increased DHA production in HepG2 cells enriched with cetoleic acid.
Although the cell line HepG2 has maintained a functional n-3 fatty acid metabolic pathway(Reference Wu, Su and Cui47), it still may differ to some extent in metabolic properties from primary human hepatocytes(Reference Zeilinger, Freyer and Damm48). In order to fully determine the effects of cetoleic acid in humans, studies with primary human liver cells reflecting the functional performance of the organ in vivo are required in future studies. However, it is a strength that the overall effects of cetoleic acid on the n-3 metabolic pathway in HepG2 is similar to the response in salmon primary liver cells, even if there are some species differences.
The higher production of DHA in salmon cells relative to HepG2 cells, even though they contained a much higher DHA level, may not only be due to bypassing the Δ6 desaturase step to 20 : 3n-3 that is shuffled back into the pathway alone, but also due to a higher peroxisomal β-oxidation capacity in these cells. Peroxisomal β-oxidation is involved in the last step of the n-3 metabolic pathway shortening 24 : 6n-3 to DHA. LC-PUFA, including DHA, are known to stimulate the capacity of the peroxisomal β-oxidation pathway(Reference Willumsen, Hexeberg and Skorve49), which may explain the higher conversion from EPA to DHA in salmon cells than in HepG2 cells. The activity of acyl CoA-oxidase, the first enzyme in peroxisomal β-oxidation pathway, in salmon cells was nearly 2-fold higher than in HepG-2 cells. This may indicate a higher peroxisomal activity in salmon cells compared with human cells. It is known that carnivore coldwater fish species in general have high peroxisomal β-oxidation capacity due to their adapted to a diet rich in LC-PUFA(Reference Moyes, Crockett, Hochachka and Mommsen50). However, cetoleic acid did not influence the activity of acyl CoA-oxidase in any of the cell types contrary to one of the hypotheses of the present study. Previous studies with rodents fed a diet based on MUFA reported an increased EPA level and a slightly induced peroxisomal β-oxidation, in liver(Reference Bremer and Norum11, Reference Halvorsen, Rustan and Madsen12, Reference Halvorsen, Rustan and Christiansen51). Opstvedt(Reference Opstvedt5) hypothesised that LC-MUFA would lead to increased peroxisomal β-oxidation and thereby increased synthesis of n-3 LC PUFA. Even though the measured activity of acyl co-A oxidase was not different for the HepG2 and salmon hepatocytes cultured in different doses of cetoleic acid, addition of cetoleic acid increased the synthesis of 14C-22 : 6n-3 in human hepatocytes, indicating a higher peroxisomal conversion of 24 : 6n-3 to DHA. However, we have only measured the first enzyme in the peroxisomal β-oxidation pathway. In order to verify the higher capacity of the pathway, the peroxisomal β-oxidations end products need to be determined in future studies.
Other studies have also shown that the LC-PUFA synthesis pathway can be stimulated by different bioactive compounds like the MUFA petroselinic acid(Reference Randall, Drew and Overland14, Reference Bou, Østbye and Berge36). Trout hepatocytes exposed to petroselinic acid increased the elongation and desaturation of 14C-18 : 3n-3 to DHA, possibly through stimulated peroxisomal β-oxidation capacity (with more acetate produced, a product of the pathway)(Reference Randall, Drew and Overland14). Thus, cetoleic acid might be having a similar effect in HepG2 cells and salmon hepatocytes in this experiment.
In our study, a salmon feeding trial was put up to investigate if dietary cetoleic acid, provided in herring oil, would have the same effects in vivo as those observed in the in vitro cell trials. The finding of higher apparent retentions in whole body of EPA, 22 : 5n-3, and EPA + DHA in the Herring High group compared with the Sardine High group, as well as of EPA and 22 : 5n-3 in Herring Low compared with Sardine Low, indicated that the level of cetoleic acid in the dietary herring oil indeed led to higher metabolic conversion of dietary ALA to EPA and 22 : 5n-3. The retention of 22 : 5n-3 in the Herring groups at 130–145 % and more than 1·3–1·6 times higher than in the Sardine groups further supports the assumption of increased n-3 metabolic pathway in the Herring dietary groups due to their cetoleic acid content. The higher retention of EPA and DHA may also be influenced by the low retention of 22 : 1n-11 pointing to the high utilisation of this fatty acid as an energy source, which may spare LC-PUFA from β-oxidation. Despite the lower EPA + DHA level in the Herring High feed compared with the Sardine High feed (9·1 v. 9·8 % of total fatty acids), there was nearly significantly higher level of EPA (P = 0·062) in whole-body mass of the Herring High than in Sardine High. Further, the DHA to ALA ratio, indicating increased synthesis capacity, was significantly higher in the Herring groups than in the Sardine groups. This supports the hypothesis that the cetoleic acid content of herring oil stimulates the salmons’ capacity to synthesise EPA and DHA from dietary ALA. In the in vivo trial, the peroxisomal β-oxidation capacity was not measured and can therefore not be used to explain the salmon results. In earlier studies with rodents, diets high in LC-MUFA and low in PUFA also resulted in increased levels of EPA and DHA levels in both plasma and liver(Reference Yang, Miyahara and Iwasaki7, Reference Yang, Bando and Sakurai8, Reference Halvorsen, Rustan and Madsen12, Reference Yang, Miyahara and Mori52), although the mechanisms for this effect was not shown. Nevertheless, earlier feeding trials with rats have shown that diets based on marine oils (capelin) or rapeseed oil, that are rich in the LC-MUFA (like the 22 : 1 fatty acids), caused increased peroxisomal β-oxidation(Reference Neat, Thomassen and Osmundsen53, Reference Neat, Thomassen and Osmundsen54).
The fatty acid composition of the livers from fish in the feeding trial further supported the findings from the in vitro trials and whole-body fatty acid data. In the liver, the percentage of EPA and DHA was significantly higher in the Herring Low group compared with the Sardine Low, and the level of EPA was nearly significantly higher in the Herring High than in the Sardine High. Both relative and quantitative values showed significantly increased, or a trend towards increased, DHA in the liver of the Herring groups compared with the Sardine groups, even when the Herring groups had approximately 30 % lower fat content than the Sardine groups. In addition, the DHA:ALA ratio in the Herring groups more than doubled when compared with the Sardine groups, indicating a higher conversion of dietary ALA to DHA in the livers of the Herring High groups, since the dietary level of DHA was similar. Although not significant, there was a strong tendency to reduced fat percentage in the livers in the Herring group compared with Sardine groups, which may indicate that cetoleic acid leads to reduced fat accumulation in the liver. Erucic acid (22 : 1n-9) has previously been linked to cardiac lipidosis in rats fed diets containing rapeseed oil high in this fatty acid(Reference Beare-Rogers55). This has however not been reported for cetoleic acid. Further, mice fed a diet enriched in saury oil high in MUFA showed increased levels of n-11 MUFA in plasma and organs, suppressed genes related to adipogenesis and induced genes involved in fatty acid oxidation(Reference Yang, Miyahara and Takemura6, Reference Yang, Inoue and Taniguchi56). Herring oil is rich in MUFA, which have been reported to stimulate peroxisomal β-oxidation(Reference Bremer and Norum11, Reference Halvorsen, Rustan and Madsen12, Reference Flatmark and Christiansen57). The higher endogenous EPA level in the Herring High group may also explain the differences in liver fat content between the different groups. In previous studies, EPA was shown to inhibit lipid secretion from salmon hepatocytes, however, increased the mitochondrial area and proliferation, indicating stimulatory effect on mitochondrial β-oxidation(Reference Vegusdal, Gjøen and Berge58, Reference Kjær, Vegusdal and Gjøen59). Reduction of liver fat content was also observed in mice fed a diet rich in LC-MUFA(Reference Yang, Miyahara and Takeo60). This was explained by down-regulation of hepatic genes involved in cholesterol and lipid synthesis.
Interestingly, there was a significant difference in the level of cetoleic acid in whole-body v. in liver. The content of cetoleic acid in the liver in mg/g tissue was approximately 2 times higher than in the whole body of the Herring groups and more than 1·2–1·3 times higher for the Sardine groups. This may indicate that cetoleic acid is deposited to a higher degree in the liver than in muscle. Further, the liver profile showed accumulation of 18 : 1n-11 in the Herring groups, whereas almost nothing was identified in the Sardine groups. This fatty acid is not found in the diets and is probably a chain-shortening product of cetoleic acid. Accumulation of this fatty acid was also seen in organs and carcasses of rats fed cetoleic acid(Reference Craig and Beare61), but the impact of the fatty acid is unknown. This shows the potential for health beneficiary effects of aquaculture salmon rich in cetoleic acid for human consumption.
Conclusion
In conclusion, cell trials showed that cetoleic acid stimulates the synthesis of EPA and DHA in human HepG2 and of EPA in salmon hepatocytes. Further, feeding Atlantic salmon a herring oil-based diet rich in cetoleic acid increased hepatic content of EPA and DHA and whole-body retention of EPA, docosapentaenoic acid and EPA + DHA. The results show that cetoleic acid, in addition to EPA and DHA, contributes to the health beneficiary effects of fish oils both in human diets, and as dietary ingredients for the aquaculture industry.
Acknowledgements
We would like to acknowledge Inger Øien Kristiansen, Målfrid Bjerke and Silje Kristine Bergum for excellent work in the laboratory.
This work was supported by The Norwegian Seafood Research Fund (FHF) – project number FHF901017.
T.-K. K. Ø., B. R., G. M. B. and O. H. R. designed the study, T.-K. K. Ø., M. B. and G. M. B. performed the analyses, T.-K. K. Ø. and B. R. wrote the manuscript, T.-K. K. Ø., B. R., G. M. B., M. B., A. N. and O. H. R. reviewed and edited the manuscript.
The authors declare that there are no conflicts of interest.
Supplementary material
For supplementary material/s referred to in this article, please visit https://doi.org/10.1017/S0007114519001478


 Open access