

Introduction
The turn of the twenty-first century has witnessed the rapid diffusion of a number of cool but controversial language variants in various European communities. Scottish vernacular, for instance, has adopted London sounds, such as [f] for th in think (Stuart-Smith, Pryce, Timmins, & Gunter Reference Stuart-Smith, Pryce, Timmins and Gunter2013), Netherlandic Dutch has acquired novel pronouns (the object form hun ‘them’ for subject pronouns; Grondelaers & van Hout Reference Grondelaers, van Hout, Kristiansen, Franco, Pascale, Rosseel and Zhang2021), and the Dutch of young Flemings has adopted features from Citétaal, a multi-ethnolect that was born in the vicinity of the former coalmines in the easternmost province of Flemish Limburg (Marzo Reference Marzo2016). Although each of these diffusions has been associated with local and supralocal social meanings in the literature, the empirical substantiation of such subjective correlates continues to be a challenge, if only because it has proven difficult to pinpoint the precise nature and especially the exact status of these triggers: do they merely correlate with diffusion, or is their role more causal?
This article tackles these issues by experimentally tracking the evaluation of four Citétaal features in a speaker evaluation experiment, in order to pick up Citétaal's social meaning correlates ‘in vitro’. Next, we turn to Twitter to track the diffusion of the major Citétaal shibboleth (the palatalised pronunciation of /s/) in a Twitter corpus, and to pinpoint the ‘production proxies’ of the social meanings found in the experiment: which variables do tweeters who want to stylise themselves as non-posh and streetwise rely on? By adding these variables to our regression model of the diffusion of palatalised /s/, finally, we are able to gauge the relevance of social meaning-making and stylisation for rapid diffusion.
In the next section, we zoom in on the challenges of studying the relationship between social meaning and diffusion. Then, in The vitality of Citétaal, we report the state of the art in research on ethnolectal varieties, and on the Flemish ethnolect in focus. Study 1 reports a speaker evaluation experiment in which we investigate whether diffusing Citétaal features are positively evaluated, and which type of prestige—if any—is involved. Study 2 is dedicated to a Twitter-based corpus investigation to track the diffusion in time and space of a Citétaal feature, and to document the (subjective) factors that constrain its spread. The final section explores the theoretical consequences of our empirical findings.
Social meaning as a driving-force
Does modern prestige boost the diffusion of linguistic features?
A considerable number of studies in diverse corners of sociolinguistics have found that diffusing features are linked to ‘dynamic’ social meanings, pertaining to non-posh urban cool and streetwise toughness (see the studies in Foulkes & Docherty (Reference Foulkes and Docherty1999) for a number of early examples). In their study of th-fronting and l-vocalisation in the urban dialect of Glasgow, Stuart-Smith and colleagues (Reference Stuart-Smith, Pryce, Timmins and Gunter2013:505) found that it was the development of ‘a local Glaswegian street style’ which accelerated the changes, but also a more general supralocal ideology of ‘streetwise urban toughness’. In connection with the wave of consonantal changes across the UK, Stuart-Smith and colleagues (Reference Stuart-Smith, Pryce, Timmins and Gunter2013:527) suggest that ‘[w]herever these features are proliferating in the UK, they are linked with a bundle of overlapping social meanings of being “us”, “not posh”, “(cool) youth”, and “urban tough” ’.
The crucial role of ‘tough’ associations for linguistic diffusion is confirmed in Sneller & Roberts (Reference Sneller and Roberts2018). In an experimental computer-game setting (in which respondents who had to learn an ‘alien language’ were assigned to two fictive species, soft Wiwos or tough Burls), they investigated whether the social meaning of a feature impacted its rate of adoption. Crucially, weaker Wiwos adopted features from the Burls much more readily when these features were associated with ‘tougher aliens’. More precisely, features were shown to diffuse more easily when they indexed a clearly perceived trait of a group—in this case toughness—which is socially relevant for other speakers.
Not only single diffusions have been linked to non-posh dynamic meanings. Slower macro-structural shifts have also been correlated with language-ideological changes which transpire in the upgrading of stigmatised but vital modern varieties on traits like ‘non-posh’, ‘hip’, ‘cool’, and ‘assertive’. Grondelaers & Van Hout (Reference Grondelaers and van Hout2016) have argued that it is this dynamic or modern prestige which supports the vitality of modern varieties like Kobenhavensk in Denmark (Kristiansen Reference Kristiansen2009) or Tussentaal in Flanders (Rosseel Reference Rosseel2017), whereas it is the traditional superiority of a high level of education, professional competence, and a large income, which is the ideological correlate of the conservative standards in these communities.
The dynamism dimension under which all of the non-posh social meanings in the previous paragraphs have been subsumed, has always been present in some form and under various names as a pivotal factor in the earliest work on social perception dimensionality (such as Osgood, Suci, & Tannenbaum Reference Osgood, Suci; and Tannenbaum1957). The measures used in these studies were later pooled in Zahn & Hopper's (Reference Zahn and Hopper1985:118) Speech Evaluation Instrument, in which the items ‘active-passive’, ‘talkative-shy’, ‘aggressive-unaggressive’, ‘enthusiastic-hesitant’, ‘strong-weak’, ‘confident-unsure’, and ‘energetic-lazy’ correlated into a dynamism dimension. But how do we reconcile Zahn & Hopper's (Reference Zahn and Hopper1985) original dynamism correlates ‘strong’ and ‘aggressive’ with Kristiansen's (Reference Kristiansen2009) traits ‘self-assured’, ‘fascinating’, ‘cool’, and ‘nice’? Are these American and Danish evaluations indeed instantiations of a more encompassing dynamism dimension?
The question becomes all the more important when we move our focus to the diffusion of ethnolectal features in European majority languages. These features initially emerged in multi-ethnic areas as part of the lingua franca of the first generation of immigrants. They were picked up by the next generation, who developed them as a means of shaping group cohesion, and they are now spreading beyond the original speech communities (Nortier & Svendsen Reference Nortier and Svendsen2015) as ingredients of mixed varieties—called ‘contemporary urban vernaculars’ (Rampton Reference Rampton2011)—which are also used by local youngsters without a migrant background (e.g. Cheshire, Kerswill, Fox, & Torgersen Reference Cheshire, Kerswill, Fox and Torgersen2011 for Multilingual London English; Hinskens Reference Hinskens, Kern and Selting2011 for the Netherlands). The spread of these vernaculars is a remarkable evolution, because their popularity is offset by explicit condemnation from both linguistic gatekeepers and laymen who continue to stigmatise them as deficient ways of speaking by ‘foreign’ youngsters (see, amongst others, Milani Reference Milani2010).
In Study 1 we pressure-test the hypothesis that the success of urban vernaculars in the face of this public stigmatisation is determined by social meanings like ‘young’, ‘cool’, ‘urban’ and ‘streetwise’, which instantiate a subtype of dynamism which matches Zahn & Hopper's (Reference Zahn and Hopper1985) ‘tougher’ version. Provisional experimental evidence for this claim can be found in Grondelaers & Van Gent (Reference Grondelaers, van Gent, Rosseel and Grondelaers2019), who found significant upgrading for the Moroccan accent of Netherlandic Dutch on the scales hip, stoer ‘tough’, and zelfverzekerd ‘confident’, which approximate Zahn & Hopper's set. Grondelaers & Van Gent (Reference Grondelaers, van Gent, Rosseel and Grondelaers2019) have argued that it is this ‘macho’ version of dynamic prestige which accounts for the increasing popularity of Moroccan-accented Dutch among rappers of Surinamese descent, but also among speakers without a migrant background. Since this macho prestige resembles the toughness-propagator of diffusion in Sneller & Roberts (Reference Sneller and Roberts2018, see above), but also converges with Sneller's (Reference Sneller2020) account of the role of ‘street smartness’ in the diffusion of AAVE features among white speakers in South Philadelphia, we henceforth refer to it as streetwise prestige.
Evidential force of social meaning: Correlation or causation?
In addition to uncertainty about the exact nature of the non-posh social meanings that are linked to different types of diffusions, a second impediment to a wider recognition of evaluation factors in the study of diffusion is the fact that even scholars who explicitly argue for a causal relation between evaluation and diffusion almost never have the evidence to back up causation in the strictest sense. It is interesting to note that the wording of the relation between evaluation and diffusion often oscillates between weaker and stronger versions of causation. A tell-tale example is Hawkey's (Reference Hawkey2019) corpus study of the impact of evaluations of Catalan on supralocal Catalan variant use in French Catalonia, in which he captures the alleged causality in weaker terms—‘evaluations align with supralocal use’ (Reference Hawkey2019:1) and ‘language attitudes do indeed function as statistically significant correlates of variation’ (Reference Hawkey2019:16, emphasis added)—but also stronger terms, as he ‘aim[s] to provide quantitative evidence of how attitudes may function as motivators of language variation and change’ (Reference Hawkey2019:5, emphasis added).
At this point it is worthwhile to ruminate on a crucial theoretical question. What would constitute valid evidence that accelerated diffusion is caused by a change in evaluation? In actual scientific practice, scholars first notice and empirically substantiate an increase in the frequency of some feature, after which they investigate whether a change in evaluation has taken place which may have prompted or at least facilitated the increase. A rare exception is Pinget's (Reference Pinget2015) large-scale study of the potential factors, including evaluation, which account for the actuation of two incipient fricative devoicing patterns in Dutch. Although she found only a weak link between positive evaluation and production vitality, she concluded from her data that ‘the positive evaluation of a change…seems to arise when the system of speech production is already undergoing the change. Language attitudes, which were shown to develop during the process, seem to be a reinforcing mechanism of sound change’ (Pinget Reference Pinget2015:153, emphasis added). This evidence aligns with earlier suggestions that sound changes are induced by a phonetic mechanism, whereas their spread is supported by social means (Ohala Reference Ohala, Masek, Hendrick and Miller1981), and that language change can only occur when the social conditions are suitable (Nettle Reference Nettle1999; Sneller & Roberts Reference Sneller and Roberts2018).
In order to examine the evidential force of evaluation for diffusion, we track the regional and diachronic dissemination of the written proxy of the principal Citétaal shibboleth—the palatalised production of sibilants—in a Twitter corpus, and we investigate the evaluation of this feature in a speaker evaluation experiment with a respondent panel which is stratified similarly as in the corpus study. If we can prove that positive evaluations of Citétaal features match their diffusion, we can argue more plausibly that they stratify the production findings.
There is, however, a better way to demonstrate that language evaluation and diffusion are causally related. Since it is the hearer who decides whether a speaker is tough and cool, streetwise prestige evaluations are typically elicited experimentally, in response to a range of speech stimuli in which varieties (viz. the Moroccan accent) or features which conjure up the streetwise image according to the researchers are included. Crucially, speakers or tweeters who wish to stylise themselves as ‘streetwise’ in their speech or tweets, follow a similar course of action as the researchers who compile the stimulus set for their speaker evaluation experiment: they spruce up their speech or tweets with features they know or surmise to be associated with streetwise prestige. We use the term stylisation in the narrow sense of Rampton (Reference Rampton2001:85), ‘the intensification or exaggeration of a particular way of speaking for symbolic and rhetorical effect’, which ‘calls forth special attention… to the act of expression and the performer’. If we can prove that tweets in which tweeters stylise themselves as cool and streetwise persons manifest a higher preference for the Citétaal than for the standard variants, we have evidence that it is a specific social meaning which (co)determines the use of these features. To be sure, not even this evidential switch from evaluation to stylisation can support the evaluation → diffusion causality in the strictest sense of the term, if only because it can reveal no more than a stance-propagated preference for the investigated features in a specific context. In this study, positive corpus evidence would entail only that the Citétaal forms are imbued with enough of the desired social meanings (cool, expressive, rebellious, etc.) to be an evident stylisation tool for tweeters who want to profile themselves in that way.
Be that as it may, a crucial advantage of this investigative switch from the perception to the production of streetwise prestige, is that it allows us to include streetwise prestige as a predictor in a regression analysis of the preference for Citétaal features. We propose that Twitter is eminently suited for our purpose of documenting both traditional change predictors and more subjective factors. As a computer-mediated communication (CMC) tool, to begin with, Twitter is characterised by ‘conceptual orality’ (Androutsopoulos Reference Androutsopoulos, Kristiansen and Coupland2011:149; Hilte, Vandekerckhove, & Daelemans Reference Hilte, Vandekerckhove and Daelemans2018). Tweets imitate casual speech features, and they are littered with non-standard orthography which is either the result of error, or—more interestingly—of expressive or indexical resourcefulness (Coats Reference Coats2016:188). Twitter shares with authentic colloquial speech the presence of phonetic, lexical, and morphosyntactic cues which systematically reveal identities and stances of tweeters. More generally, the use of non-standard language on Twitter ‘is often seen as a form of identity work, signalling authenticity, solidarity, or resistance to norms imposed from above’ (Eisenstein Reference Eisenstein, Vanderwende, Daumé and Kirchhoff2013:362). Crucially, Twitter distributions of investigated variants align so well with traditionally observed or elicited distributions (see Huang, Guo, Kasakoff, & Grieve Reference Huang, Guo, Kasakoff and Grieve2016; Grieve, Montgomery, Nini, Murakami, & Guo Reference Grieve, Montgomery, Nini, Murakami and Guo2019 for lexical evidence, Haddican & Johnson Reference Haddican and Johnson2012; Strelluf Reference Strelluf2019 for syntactic confirmation; Van Halteren, van Hout, & Roumans Reference Van Halteren, van Hout and Roumans2018 for a dialect-geographical application) that Twitter is highly appropriate to probe variation patterns which would otherwise require an unfeasibly large data collection effort.
In addition to conceptual orality, Twitter is a typical CMC-outlet in terms of the ubiquity of ‘expressive compensation’ strategies (Androutsopoulos Reference Androutsopoulos, Kristiansen and Coupland2011) inserted to counterbalance the absence of intonation and gestural expression cues. Apart from obvious examples such as emoji, a recurrent example of expressive non-standard orthography is the lengthening of a word by repeating one or more of its characters (as in wellllllllll), a feature that has been analysed as an affective discourse strategy (Bamann, Eisenstein, & Schnoebelen Reference Bamann, Eisenstein and Schnoebelen2014; Coats Reference Coats2016).
We argue in the Twitter-based corpus analysis in Study 2 that expressive lengthening is a pivotal feature in the toolbox of strategies that tweeters can exploit for streetwise stylisation. With this claim, we go against a number of Twitter-based studies which refrained from coding for this specific speaker attitude. Bohmann (Reference Bohmann2016:154), in particular, has suggested that the preposition because's recent inclination to take adjectives (early morning gym because fat) has been glossed as ‘aggressively casual and implicitly ironic’. While this association patterns well with our streetwise cool, Bohmann found it difficult to quantify, because it is ‘not so much an indicator of a generally casual style as a resource that is exploited in the stylisation of casualness’ (Bohmann Reference Bohmann2016:175). In Study 2, we code for expressive lengthening and other expressive compensation markers as production proxies of a streetwise style.
The vitality of Citétaal
Citétaal is an excellent case to explore the relation between evaluation and diffusion. Citétaal is used by linguists and laymen as a term for the urban vernacular which emerged in the 1970s (Marzo Reference Marzo2016) in the ghettoised areas (cités) associated with the former coalmines in the easternmost Flemish province of Limburg. As other urban vernaculars in Europe, Citétaal does not represent a distinct variety but rather a stylistic practice. Its principal shibboleths are the palatalisation of /s/ + consonant (e.g stijl ‘style’ pronounced as [ʃtɛil], often spelled as <sh> or <sj>, as in shtijl or sjtijl) and the generalisation of the definite article de and demonstrative pronoun die (de or die meisje instead of het or dat meisje ‘the/that girl’). Crucially, recent studies (Marzo, Zenner, & Van De Mieroop Reference Marzo, Zenner, Van De Mieroop, Zenner, Backus and Winter-Froemel2018) have shown that /s/-palatalisation has begun to diffuse beyond the multi-ethnic area of its birth.
Marzo & Ceuleers (Reference Marzo and Ceuleers2011) have claimed that Citétaal has undergone an enregisterment process—‘whereby speech features come to be socially recognised (or enregistered) as indexical of speaker attributes by a population of language users’ (Agha Reference Agha2005:38)—which resembles the development of ‘Pittsburghese’ (Johnstone, Andrus, & Danielson Reference Johnstone, Andrus and Danielson2006). In this process, Citétaal has abandoned its ethnic ‘first-order’ index—that is, the association with the migrant communities living on the mining estates—and now indexes the more global ‘second-order’ social meaning of belonging to the city of Genk. It should be noticed that Genk started to flourish only with the discovery of coal (in 1902), and that it was ethnically diverse almost from its onset. Genk is therefore eminently suited to sustain a field of modern and young evaluations which partly overlap with the stereotypes surrounding some of its migrant communities (particularly Italian). We propose that the second-order Citétaal associations are now being reinterpreted or extended to index a ‘third-order’ set of even more delocalised social meanings, viz. the dynamic associations of cool, young, non-posh, streetwise, fun-loving, entertaining, expressive, and masculine.
An early speaker evaluation study on the evaluation of Citétaal (Marzo Reference Marzo2016) confirmed some of this third-order indexicality. While Citétaal was found to elicit low status evaluations, it was regarded as highly attractive by Flemish listeners. Additional discursive analysis of Citétaal evaluations on (social) media corroborated this double-headed image: whereas Citétaal is generally associated with low proficiency and the concomitant professional underdevelopment and meagre career prospect stereotypes (Svendsen & Marzo Reference Svendsen and Marzo2015:6), it is also considered to be humorous and likeable by many listeners. However, Marzo (Reference Marzo2016) did not elicit evaluations in terms of streetwise dynamism, the only prestige dimension on which Moroccan-accented speech in the Netherlands was upgraded (see Grondelaers & Van Gent Reference Grondelaers, van Gent, Rosseel and Grondelaers2019). One of this article's main ambitions is therefore to test the proposed third-order indexicalities in a speaker evaluation experiment which includes measures to adequately probe them.
A societal phenomenon which renders Citétaal extra attractive as a case to study social meaning-induced diffusion, is that its national popularity has skyrocketed after 2012, the year in which Marzo's (Reference Marzo2016) experiment took place. This success was first of all triggered by a number of popular television series and movies, carried by actors with Italian and Turkish roots. The most important case in point is Matteo Simone's rendition of the role of ‘soft macho’ safety enforcer Smos in the television series Safety First (a persona that drew heavily on the use of Citétaal features). Concomitant with this growing media popularity was the introduction of Citétaal in the local Limburgian rap scene, in particular by Belgian-Italian rapper Don Luca, born and raised in the mining areas, who uses Citétaal to flavour his output (Marzo Reference Marzo2019:115). Following this media boom, local authorities began to exploit the growing popularity of Citétaal in several political and commercial campaigns to evoke a modern and urban identity. A case in point was opposition party PRO Genk's 2011 campaign slogan Genk: stad van de sjtijl ‘Genk, city of shtyle’. It goes without saying that this urban identity strongly converges with the (third-order) dynamic social meanings we believe to be responsible for the diffusion of Citétaal outside its original biotope.
In what follows, we report two studies in answer to three research questions.
-
Research question 1
(a) Does Citétaal correlate with modern prestige evaluations?
(b) If so, are we dealing with the type of ‘yuppie’ prestige which has been claimed to be a driving-force in Danish, or rather with the streetwise prestige that was found to correlate with the Moroccan accent of Netherlandic Dutch?
(c) Are modern prestige evaluations for Citétaal, if they obtain, awarded by the Limburgian respondents (who are arguably most familiar with the variety), or does the diffusion of Citétaal forms across Flanders align with positive evaluations by all of the Flemish?
(d) Should modern prestige evaluations indeed obtain for Citétaal, are they indexically linked to the Cité and its cool ethnic residents, or are they the second- or third-order reinterpretations of the original association?
-
Research question 2
(a) Can we document the propagation of the principal Citétaal shibboleth—which is essentially a spoken feature—on the basis of written Twitter data?
(b) Can we extract the social meanings purported to accelerate Citétaal from the expressive compensation features hypothesised to index non-posh stylisation?
-
Research question 3
-
Is the dissemination of Citétaal a gradual diffusion sustained by dynamism-induced imitation-in-interaction, or is it rather the synchronic, simultaneous effect of nation-wide broadcasting?
-
Study 1: An experimental investigation of the social meanings of Citétaal
Method
Speech stimuli
We decided not to contrast Citétaal with Belgian Standard Dutch, because the latter has been shown to elicit ultra-conservative language-ideological reactions and a virtually automatic condemnation of all non-standard variants and varieties (some background on the hyperstandardisation of Belgian Dutch can be found in Jaspers & Van Hoof Reference Jaspers and Van Hoof2013). Instead, we rely on ecologically more valid stimulus materials by building exclusively on Limburgian samples, ranging from an indigenous Limburgian accent in Standard Dutch (henceforth ‘Limburgian’ or L), over Italian- and Turkish-accented Limburgian speech (henceforth IL and TL), to Italian- and Turkish-accented Limburgian speech with a number of well-known Citétaal features (henceforth IC and TC). Turkish and Italian but not Moroccan accents were implemented because the main protagonists of the recent mediatisation of Citétaal are all of Italian and Turkish descent.
L samples featured colloquial near-standard Dutch with an audible Limburg accent and a number of non-standard variants (notably t-deletion in function words). TL and IL samples featured essentially the same variety but produced by speakers of Italian and Turkish descent with an audible ethnic accent. TC and IC guises were identical to the TL and IL guises, but they were complemented with four Citétaal features: (i) the palatalisation of /s/ in first syllable position (e.g. stijl ‘style’, pronounced as [ʃtɛil]), (ii) the bilabialisation of /w/ as [uw] (e.g. waar ‘where’ [uwa:r]), (iii) the overgeneralisation of common gender in the article de ‘the’ (instead of neuter het) and demonstrative die ‘that’ (instead of neuter dat) as in de/die meisje ‘the/that girl’, and (iv) the use of the adjective vies (originally ‘dirty’) as an intensifier (e.g. vies mooi ‘very nice’).
In order to ensure a broader empirical basis for each of the guises, we created ten stimuli in total, viz. two samples for each variety; respondents evaluated only one of these. Stimuli were based on small texts which were scripted to be spoken, and which contained slightly different descriptions of the popular Flemish television quiz show De Slimste Mens ter Wereld ‘The Smartest Human in the World’. Stimuli were produced by five male speakers from the city of Genk who are L1 speakers of Dutch, aged between twenty-eight and forty: an endogenous Limburgian Fleming for the L samples, two Limburgian males with a second-generation Turkish background (one of whom produced the TL samples, while the other performed the TC samples), and two Limburgian males with a second-generation Italian background (one responsible for the IL samples, the other for the IC samples).
All in all, six text versions were created for the ten samples: texts for the a and b variants of the TL and TC guises were identical, as were the texts for the a and b variants of the IL and IC guises. This was done to factor out undesirable confounds as much as possible. For the sake of clarity, Table 1 shows the distribution of the texts across the various samples.
Distribution of the texts across experimental samples.

All samples were digitally normalised by means of Peak Normalisation, and in a first pretest, they were played to a panel of thirty-four student respondents with the same demographic characteristics as the listener-judges in the eventual experiment. It turned out that our test panel was perfectly able to determine the regional background and the migrant descent of the stimulus speakers. They were, however, generally unable to indicate the correct ethnic origin—Italian or Turkish—of the speaker.
Evaluative scales and factor analysis
Scales in this experiment were Likert statements complemented with 7-point scales; they were mainly adapted from Marzo (Reference Marzo2016), although the selection of the dynamism scales was inspired by the experiments reported in Kristiansen (Reference Kristiansen2009), and especially Grondelaers & Van Gent (Reference Grondelaers, van Gent, Rosseel and Grondelaers2019). In order to include the optimum scale-set in the eventual experiment, and to investigate whether modern prestige evaluations—if they apply—surface as yuppie or rather streetwise dynamism, we carried out a second pretest with a larger set of measures than usual in this design. For superiority, we originally included (the Dutch translation of) this person has ‘good grades’, ‘a well-paid job’, ‘a lot of professional experience’, ‘rich parents’, is ‘a good leader’, is ‘punctual’, and for integrity Dutch translations of this person is ‘honest’, a ‘good father’, ‘friendly’, ‘generous’, ‘committed’, ‘warm’. For dynamism we originally included scales in function of a yuppie interpretation in the sense of Kristiansen (Reference Kristiansen2009)—this person is ‘confident’, ‘hip’, ‘cool’, ‘easy-going’—and a streetwise interpretation in the sense of Grondelaers & Van Gent (Reference Grondelaers, van Gent, Rosseel and Grondelaers2019) —this person is ‘loud’, ‘macho’, ‘tough’, ‘sarcastic’, ‘provocative’.
These scales were subsequently tested in a dry run with all of the experimental samples of the eventual experiment and a panel of forty-nine pupils in their final year of secondary education at a school in Hasselt (the capital of the Limburg province). They were all enrolled in what is called Algemeen Secundair Onderwijs or ASO ‘General Secondary Education’, which prepares for higher education. Factor analysis on the ratings (with varimax-rotation and factor selection criterion Eigenvalue > 1) confirmed the envisaged three-factor solution, explaining 57% of the variation. The scales ‘committed’, ‘easy-going’, and ‘sarcastic’ were removed because they loaded on more than one dimension; ‘generous’ was removed on account of a disproportionate number of neutral scores.
Respondents
In the eventual experiment, we tested a regionally stratified panel of 161 listener-judges, sampled from the five Flemish provinces: Limburg (n = 39), Antwerp (n = 34), Flemish Brabant (n = 31), East Flanders (n = 19), and West Flanders (n = 38). All respondents were pupils in their final year of secondary school; they had an average age of 17.47. Most of them were enrolled in ASO (see above); one group of respondents in the province of Antwerp (n = 16) was enrolled in a technical-scientific vocational programme. Since we wanted to focus on evaluations by endogenous Flemings, we elicited their parents’ and grandparents’ regional and ethnic descendance. We also extracted respondents’ province of birth and childhood residence to ensure that their regional provenance matched the province in which the experiment was carried out. 104 respondents were female, 54 male; three respondents preferred not to disclose their gender.
Procedure
The experiment was run on computers in the participating schools’ ICT labs. It was programmed in LimeSurvey to ensure balanced presentation of the a and b samples for all of the guises (82 respondents rated the a samples, 79 the b samples). The general instruction provided for all respondents was that they were participating in an experiment concerned with how people rate unknown persons they can only hear, not see (Lambert, Hodgson, Gardner, & Fillenbaum Reference Lambert, Hodgson;, Gardner; and Fillenbaum1960). Following the scaled questions, we extracted direct judgments from the respondents pertaining to their degree of familiarity with Citétaal, and their evaluation of that variety. On a final series of questions, we elicited the demographic features fleshed out above.
Results
On the ratings matrix, a series of factor analyses was carried out (factanal in R, with factor selection criterion eigenvalue >1 and varimax rotation) which all yielded a three-factor solution. Initial models were rejected because the scales ‘good father’, ‘hip’, and ‘macho’ loaded on two factors, and the scale ‘confident’ manifested an overly high uniqueness value (0.72). Reanalysis without these scales resulted in the solution diagrammed in Table 2, which explained 59% of the variance in the ratings and contained three factors that can straightforwardly be labeled superiority, dynamism, and integrity.
Factor loadings per variable and per dimension.

In order to investigate the impact of our manipulations, we computed a score (per factor) which averaged over the scores on the scales that received the highest loadings on a component (the shaded scales in Table 2); average scores were rescaled to z-scores with the scale-function in R. In order to verify whether we could aggregate evaluations over the a and b samples, we used the least-squares means function to investigate significant differences between the samples on the three factors. Evaluations of the a and b sample for the Italian Citétaal guise turned out to differ significantly on superiority (p < .05) and integrity (p < .01), though only in evaluations by the Limburgian respondents. Since we are mainly interested in the dynamism evaluations (in light of the purpose of this article), we decided to aggregate evaluations over the a and b samples, and focus on the five main guises in the subsequent analyses.
Three linear mixed-model regression analyses were carried out to determine the impact of the manipulated variables on the averaged superiority, dynamism, and integrity ratings (R-packages lmer and lsmeans). Respondent ID was added as a random effect to all analyses, and the fixed effects that were taken into consideration included Speaker Guise (L vs. IL vs. TL vs. IC vs. TC), Respondent Region (Limburg vs. the central Brabantic area including the provinces of Flemish Brabant and Antwerp vs. the Flanders area including the provinces of East- and West-Flanders), and Respondent Familiarity with Citétaal (elicited on a 7-point Likert scale but recoded as an ordinal variable with levels unfamiliar/somewhat familiar/familiar). Statistical differences between fixed effect levels were determined on the basis of post-hoc Tukey contrasts (lsmeans package in R).
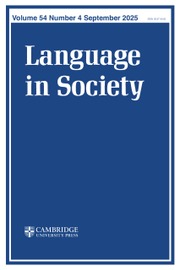
On superiority we found a significant main effect of Guise (F (4, 640) = 129.29 p < .0001), with a noticeably declining trend along the continuum from the Limburgian to the Citétaal guises: whereas the Limburgian variety is awarded the highest scores (average of 0.6), and the Italian Limburgian (IL) and Turkish Limburgian (TL) varieties receive significantly lower positive scores (0.37 for IL; 0.15 for TL), we find the predicted downgrading of Citétaal (-0.46 for IC; -0.66 for TC). A post-hoc contrast Tukey test indicated significant differences between all the varieties (p < .0001, except between Limburgian and Italian Limburgian (p = .0148), between Italian Limburgian and Turkish Limburgian (p = .0250) and between Italian and Turkish Citétaal (p = .0449)). A main effect of Guise was also found on the integrity dimension (F(4, 640) = 42.657 p < .0001): it is Italian Limburgian (0.34) which gets significantly higher scores than all the other guises (p < .0001).
On the dynamism factor, crucially, we found the mirror image of the superiority ratings, with a main effect of Guise which surfaces as a significantly increasing trend from left to right (F (4, 640) = 102.58 p < .0001), and an outspoken upgrading for the Citétaal samples. While all post-hoc Tukey contrasts manifest significantly higher scores (p < .0001) for the Citétaal samples than the other guises, there is no significant difference this time between the Italian (0.49) and the Turkish (0.38) Citétaal guises. Figure 1 visualises the ratings for the three dimensions.
Z-scores and confidence intervals for the five guises on superiority (left) and dynamism (right), with red shading for negative z-scores, and green shading for positive z-scores.
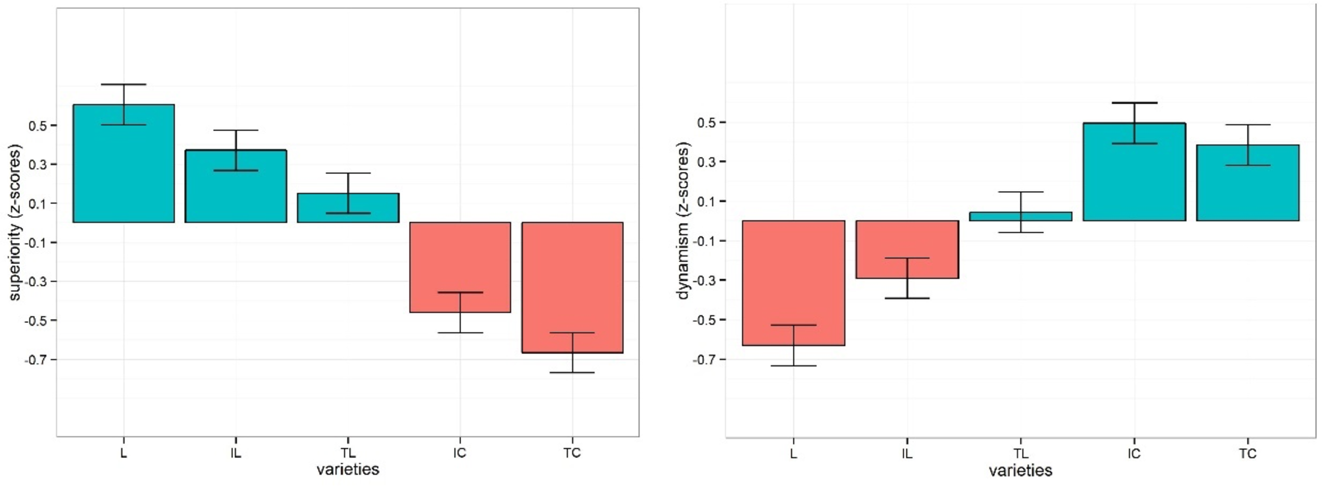
In order to find out how stable Citétaal evaluations are across Flanders, we have stratified ratings on the three dimensions according to Respondent Region. From the absence of significant interactions between Respondent Region and superiority (F (8, 632) = 1.18; p = .3), and Respondent Region and integrity (F (8, 632) = 0.33; p = .9), we can infer that these evaluations persist for the most part from the Limburgian heartland of Citétaal, over the central Brabantic region to the westernmost East- and West-Flanders provinces. The significant interaction between Respondent Region and dynamism (F (8, 632) = 2.19; p = .026) pertains to the fact that respondents from the Flanders area rate the Turkish Citétaal guise as significantly less dynamic (0.16) than respondents from the Limburg area (0.63, p = .001). Italian Citétaal, by contrast, is considered highly dynamic in all regions (with scores of 0.66 for Limburg, 0.43 for Brabant and 0.44 for Flanders). Figure 2 visualises the dynamism ratings over the provinces.
Z-score transformed dynamism scores as a function of Respondent Region, with red shading for negative z-scores, and green shading for positive z-scores.
Unsurprisingly, the familiarity ratings partly cross-classify with Respondent Region. While Limburgian respondents are evidently more familiar with Citétaal—55% report high familiarity vs. only 16% of respondents from the Brabant, and 28% from the Flanders areas—this familiarity does not affect the hierarchisations in any sense: there are no significant interactions between Respondent Familiarity and superiority (F (8, 632) = 1.43; p = .1), dynamism (F (8, 632) = 0.73; p = .6) and integrity (F (8, 632) = 1.03; p = .4).
Discussion
Experiment 1 was designed in answer to the four issues formulated in Research question 1. Observe, first, that our experimental findings perfectly align (Research question 1a) with the wealth of evidence which correlates linguistic diffusion with non-posh cool. Inspection of the factor analysis data in Table 2, however, suggests that the brand of modern prestige which boosts Citétaal is closer to the streetwise prestige that was argued to be the driving-force for the diffusion of the Moroccan accent of Netherlandic Dutch beyond Moroccan neighbourhoods (Research question 1b). In the present experiment, Citétaal was extolled on the scales ‘cool’, ‘loud’, ‘tough’, and ‘provocative’, which represent a close approximation of Zahn & Hopper's (Reference Zahn and Hopper1985) ‘tough’ and ‘aggressive’ brand of dynamism. We believe that the term streetwise prestige is perfectly justified for the modern prestige attested in the present experiment.
The fact that familiarity with Citétaal does not seem to stratify our findings much, entails that the qualities ‘loud’, ‘provocative’, ‘tough’, and ‘streetwise’ are also attributed to the Citétaal samples by respondents who have no or only little knowledge of its original socio-demographic indices ‘originating from the Cité’ and ‘originating from the city of Genk’. This suggests that the reinterpretation process from first-order indexicality (ethnic) and second-order indexicality (local), to third-order indexicality (streetwise prestige associations) is more or less complete (Research question 1d). The national availability of this third-order indexicality is a more plausible diffusion booster for the Citétaal features than the original indexical link between Citétaal and migrant workers on the former mining estates (Research question 1c). In much the same way, the political appropriation of Citétaal in Genk, stad van de sjtijl (see above) builds on the image of no-nonsense modern urban cool, rather than on the association with Genk's mining past. More generally, our evidence corroborates similar findings (notably in Stuart-Smith et al. Reference Stuart-Smith, Pryce, Timmins and Gunter2013 and Sneller & Roberts Reference Sneller and Roberts2018) that the propagation of new features is sustained by supralocal ideologies like ‘non-posh is attractive’ and ‘tough is attractive’, rather than by local group associations.
The evidence we have collected in Study 1 confirms that the propagation of Citétaal features across Flanders aligns with nationally available modern prestige evaluations for these features. While it is attractive to interpret this outspoken match between positive evaluation and propagation in terms of causality, the available data as such do not prove that streetwise prestige associations have boosted the spread of Citétaal features in Flanders. Recall from the introduction that causality is in any case difficult to attest with synchronic data, and that a methodological impediment to the study of subjective motivations of linguistic diffusion is the unavailability of a single integrated method which tracks the actual diffusion in time and space, and which documents all the kick-starters and boosters of the change. In the next study we take the causality issue one step further by proposing a method to include social meaning as a predictor (not correlate) of the diffusion of the principal Citétaal shibboleth in a diachronically and regionally stratified corpus of tweets.
Study 2: A Twitter-based analysis of SHTIJL
Materials
From the Dutch Twitter corpus TwiNL, we extracted a dataset of all the tweets (in a time frame ranging from 2012 until 2016) which feature the standard spelling stijl and all non-standard allographs (sjtijl, shtijl, shhhtijl, etc.) of the most iconic Citétaal shibboleth—sibilant palatalisation—in its most typical lexical realisation. This specific query for stijl initially yielded a dataset of 1,411 tweets, from which we subsequently removed the spurious hits (misspelled references to the homophonous steil ‘steep’, or references to steil haar ‘straight hair’), as well as hits from Netherlandic instead of Flemish tweeters. The resulting dataset totaled 700 tweets, of which 152 (or 21.7%) featured palatalised spellings.
In order to identify the socio-demographic factors (see small caps) which determine the choice for the non-standard spellings, we used the location data to classify tweeters’ region in the wider Limburg province vs. the central provinces of Flemish-Brabant and Antwerp vs. the provinces East- and West-Flanders, and we inferred the sender's gender from the user-profile (building on user name and profile picture, when available).
All tweets in the dataset were subsequently hand-coded for a number of linguistic predictors (small caps). We first coded for the meaning of stijl and distinguished between its use as a lexical synonym of cool and all of the other uses. We then classified all attestations in terms of their use, to distinguish between the predicative use of stijl which is synonymous with cool, as in (1), and other uses such as the adverbial or the idiomatic exploitations in (2) and (3).
(1) Zijn nieuw jasje is wel shtijl (predicative adjective)
‘His new jacket is surely cool’
(2) Deze fantastische dag afsluiten in stijl! (adverbial)
‘End this fantastic day in style’
(3) Ik mis u oook, dringend moet ik nog is gaan shtijl make in antwerpe met mijne draak (idiomatic)
‘I miss you tooo, I urgently have to make style once again in antwerp with my dragon’
By way of production proxy for the streetwise social meaning of Citétaal we found in Study 1, we classified tweets in terms of whether or not they contained expressive compensation strategies (Androutsopoulos Reference Androutsopoulos, Kristiansen and Coupland2011; henceforth expressiveness), with levels neutral versus expressive. We propose that typical CMC-manifestations of the expressive compensation principle, viz. the fact that the absence in Twitter of non-verbal speech features is compensated with different types of expressive writing strategies (Androutsopoulos Reference Androutsopoulos, Kristiansen and Coupland2011), qualify as resources tweeters can use to stylise themselves as informal, cool, funny, non-conformist, and streetwise. These strategies include orthography which mimics prosody—the use of capitals, as in (4), or expressive lengthening, as in (5)—swear words, as in (6), repetitions, as in (7), excessive punctuation marking, as in (8), and adverbial intensifiers such as vies, gans…, as in (9).
(4) Bent heeft echt DE stijl waar ik van hou
 hmmmm #tvvv
‘Bent really has THE style that I love
hmmmm #tvvv’(5) Wist ik wel, mo das echt shhhtijl eh
‘I know that, but it is really shhhhtyle eh?’
(6) Van stijl naar swag. wtf.
‘From style to swag. wtf’
(7) Wij wille sjtijl make wij wille sjtijl make
‘We want to make style, we want to make style’
(8) kapotjaloers. Arambol stijl!!!
‘Absolutely jealous. Arambol style!!!’
(9) Vies veel shtijl jong…
‘A dirty (‘awful’) lot of style, dude…’
 hmmmm #tvvv
 hmmmm #tvvv’
 Although the emoticon  in (4) is an evident expressiveness marker, the presence of emoticons and emoji's was coded on a separate variable, because the standard smiley has been around for such a long time that we expect its expressive charge to have weakened.
In order to verify to what extent the palatalised variant of stijl is recruited for explicit stylisation purposes, we coded all non-standard (palatalised) tokens for the presence or absence of hashtags like ‘#shtyle’, which signal that the tweeter is aware of the social meaning of the Citétaal variant, as a result of which (s)he more consciously exploits it. Since qualitative scrutiny of our data suggested that the palatalised variant is occasionally used in official Twitter accounts of, among others, radio and tv channels, we also coded whether a Twitter account was a private or an official account.
Results
We first checked the impact of the speaker variables and the linguistic predictors separately (in Table 3) and then collectively, in a random forest model and a regression tree.
Proportions of standard and palatalised spellings of stijl as a function of eight predictors.

Several predictors significantly (p-values in separate Chi-squared analyses < .0001) determine the preference for palatalised /s/, including its predicative use or presence in idiomatic constructions, its lexical meaning of ‘cool’, its region of use and tweeters’ inclination to stylise themselves expressively. Other significant effects (p-value for Chi-square < .001) include gender, official account, and year of the tweet.
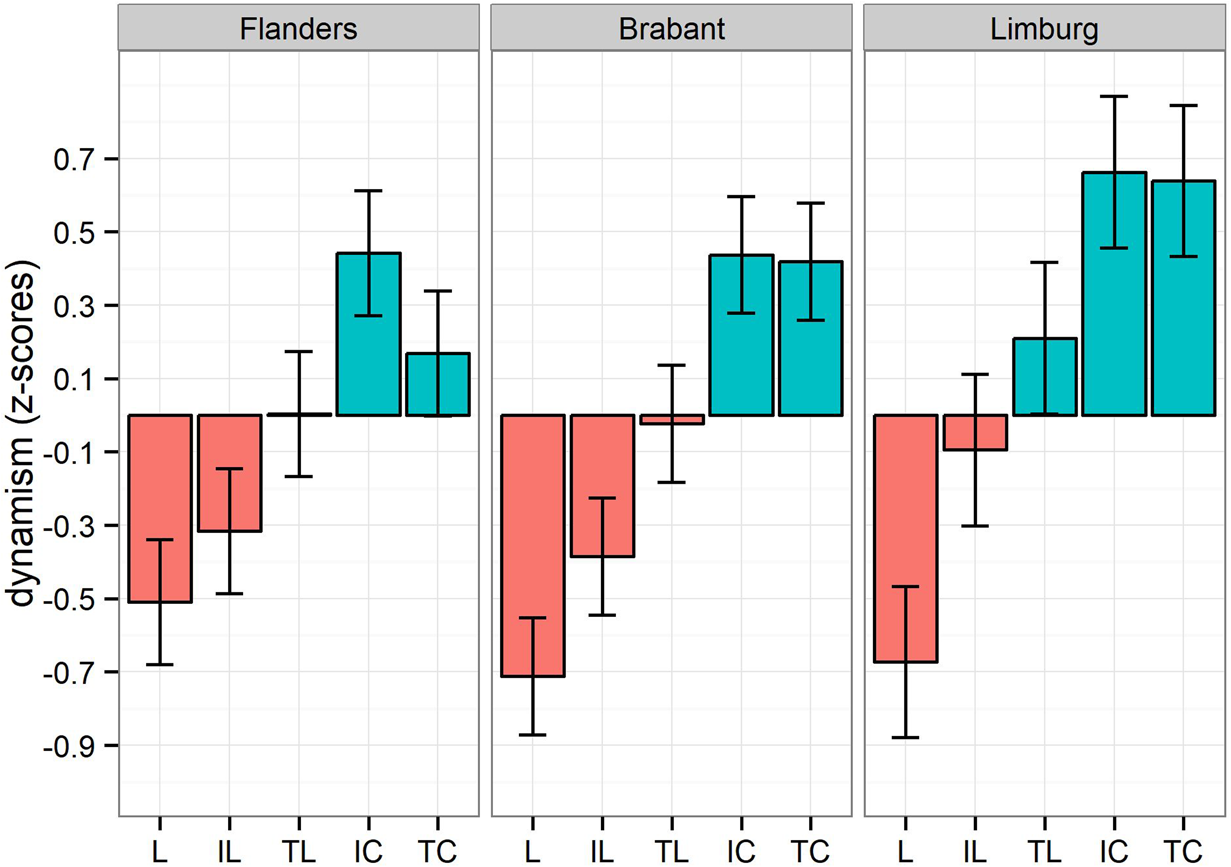
The regional distributions plotted in Figure 3 clearly indicate that the palatalised use of shtijl has left its original habitat in Limburg, not only in speech but also on Twitter: there is evidence for substantial Citétaal usage in the Brabant (20,96%) and Flanders (19,17%) areas.
Proportions of standard and palatalised spellings of stijl as a function of region.
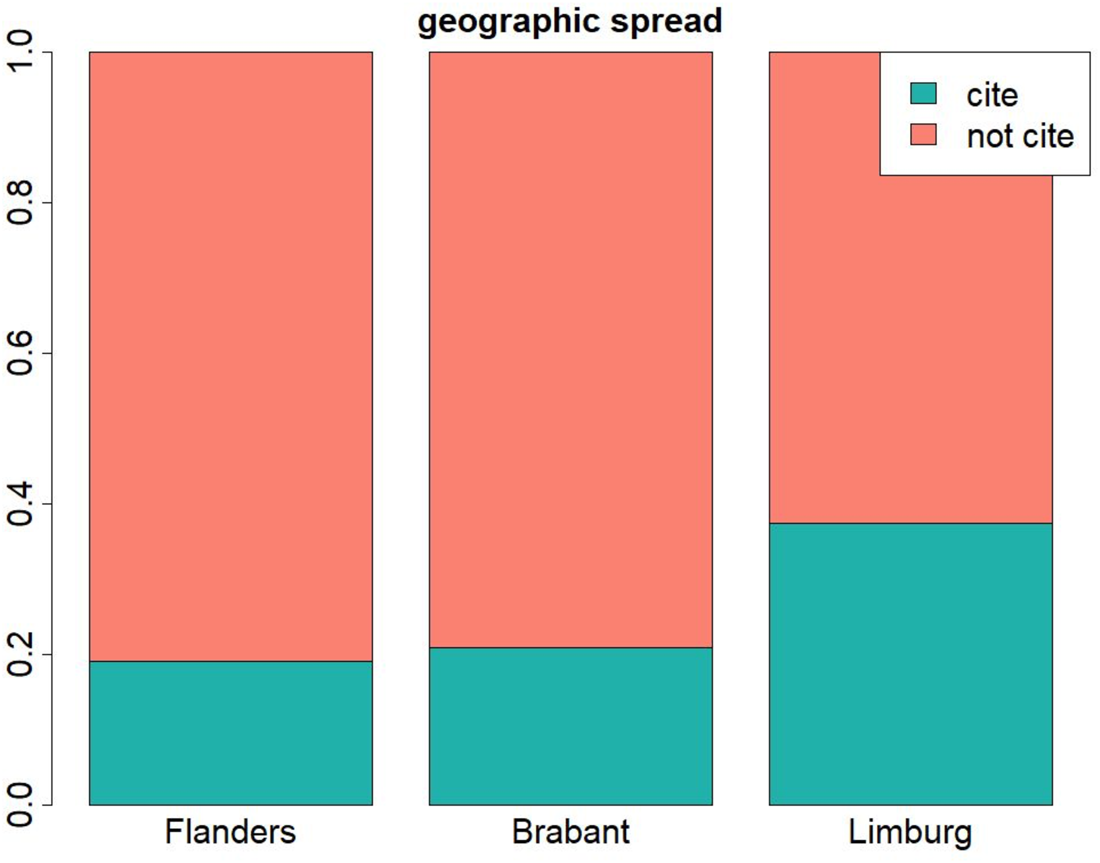
Figure 4 diagrams the diachronic diffusion of the palatalised variant between 2012 and 2016 and allows us to verify whether palatalisation proportions manifest the direct effect of the intense mediatisation of Citétaal. The Flemish sitcom Safety First aired for the first time on October 30, 2013, enjoyed a second season in 2014, and was made into a movie in 2015. If we go by the print media—Flemish newspapers dedicated long features to the success of Citétaal-speaking protagonist Sjmos in December 2013—the peak of the success of Safety First must have been around the end of 2013 and in 2014. In Limburg, the heartland of the cités and Citétaal, we notice a steady increase in palatalisation proportions up to 2015, without any media-induced peak in 2014 (neither would we expect one in view of the fact that Limburgians do not need national television to be familiar with Citétaal and its social meanings). In the ‘export’ regions Brabant and Flanders, however, proportions reveal a modest peak in 2014 which may reflect the influence of mediatisation, though the effect arguably did not persist given the noticeable declines in 2015. Crucially, while proportions in Limburg and Brabant suggest saturation and decay, the diffusion in Flanders, the area furthest removed from the cradle of Citétaal, manifests a peak in the final stage. We therefore propose, somewhat cautiously, that the diachronic data in Figure 4 reveal a gradual and ongoing spreading scenario.
Proportion of palatalised spellings of stijl as a function of year and region.

In order to better understand the relation between the factors which determine the preference for the palatalisation of /s/ in our Twitter corpus, we have carried out two multifactorial analyses. As our dataset presents a high level of data sparseness on different levels, and an uneven distribution of independent variables, we have opted to construct random forests and conditional inference trees (Tagliamonte & Baayen Reference Tagliamonte and Baayen2012), which are less sensitive to these defects. Random forests provide information about the predictive power of the variables and generate a dotplot as in Figure 5, which shows the relative importance of the different predictors included in a model. In order to report on the interactions between the predictors, we turn to conditional inference trees which visualise how multiple predictors co-operate. These trees provide estimates of the likelihood of the value of the response variable (in our case palatalised vs. non-palatalised /s/) on the basis of a series of binary questions about the values of predictor variables. The algorithm splits the data into binary subsets in consecutive runs until further splitting is no longer justified (in other words, until no statistically significant patterns remain). The result of these binary splits is visualised in the conditional inference tree in Figure 6.
Variable importance plot for palatalisation.

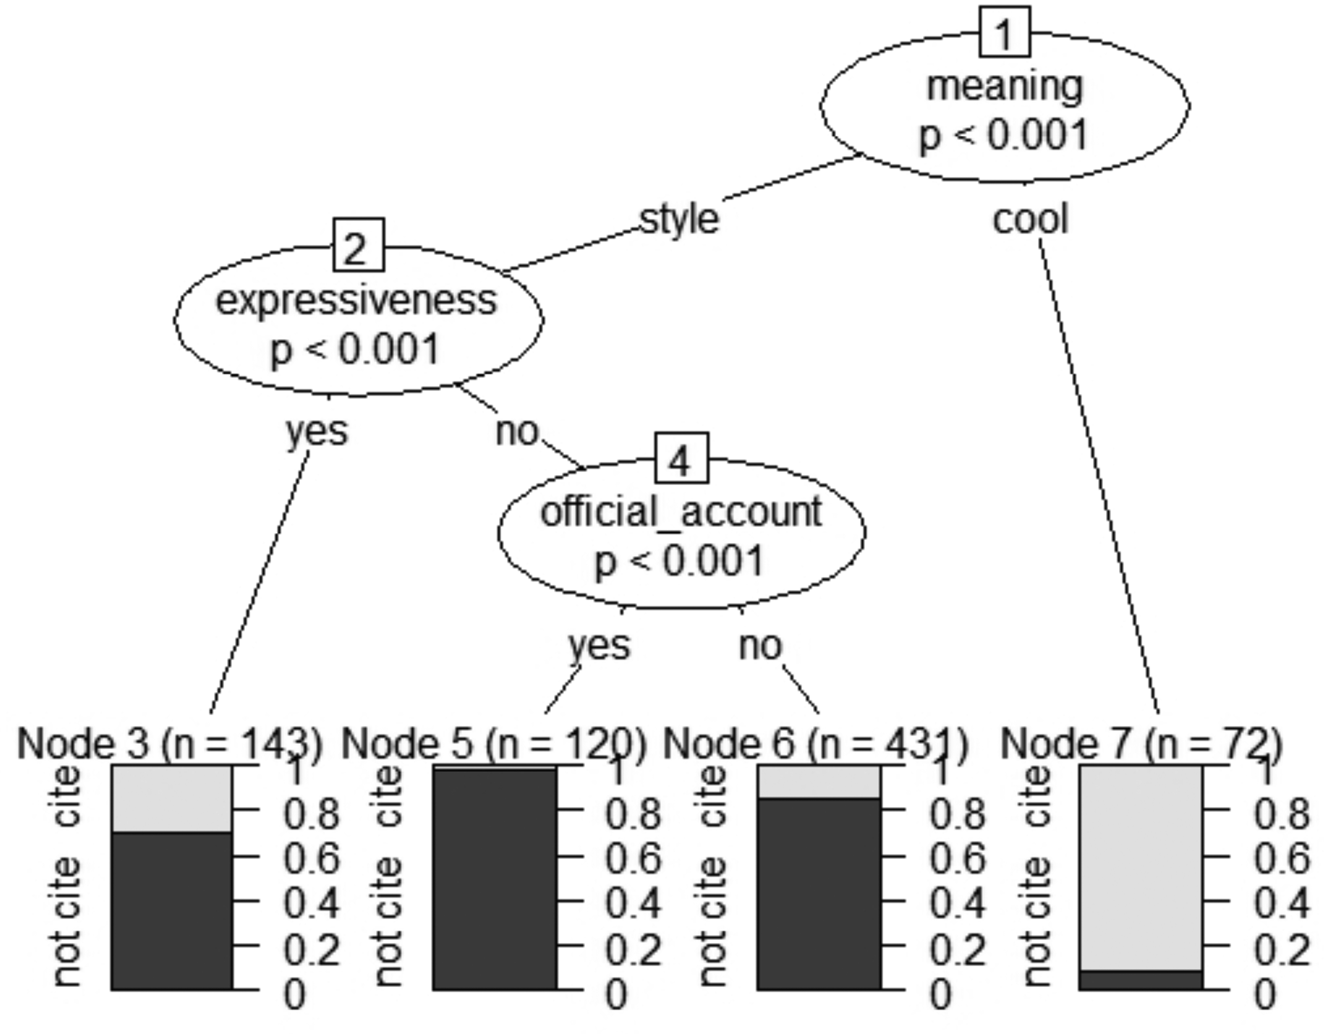
Conditional inference tree for palatalisation.
For the analysis of our dataset, we made use of the implementation of random forests and inference trees available in the party and partykit packages in R. Of the eight parameters we coded for, the random forest selected seven that predict the non-standard option, as shown in the variable importance plot in Figure 5.
Predictor variables are plotted on the y-axis. The x-axis displays the mean decrease in node impurity, viz. a measure of how the predictor variables contribute to the purity on each node in a tree and thus of how important they are in estimating the occurrence of palatalisation. As such, meaning most strongly predicts the use of palatalised /s/, followed by use as the second-most important predictor and expressiveness as the third most important predictor. Other important predictors are, in order of importance, year, gender, region, type of account, and emoticons (which is actually non-significant as it coincides with the zero threshold). The model has a good C value of 0.86 and it has a high predictive power of 73% (compared to the 58% of the baseline model).
The conditional inference tree diagrammed in Figure 6 highlights the interactions between the most important predictors. The tree shows that expressiveness (which is highly significant, but selected only in a second step) is relevant only in tweets which feature the original meaning of stijl/shtijl (viz. ‘style’), not the extended ‘cool’ meaning. Official account is a significant determinant only in the subset of tweets without expressiveness markers. In those cases, the use of palatalised /s/ increases when tweets are posted by non-official accounts.
What the conditional inference tree shows first and foremost is that both the lexical and social (viz. expressive) meaning of ‘cool’ are pivotal predictors of the Citétaal form: palatalisation is predominant in tweets featuring the cool-meaning of stijl, and it is significantly more frequent in the other tweets which enact humorous, ironic, rebellious, rude, or other intensified styles as indexed by expressive compensation strategies. These strategies clearly pattern with the expressive use of palatalised -s, which is exploited as a resource in the stylisation of the social meanings associated with Citétaal, viz. informality, cool, street toughness, or rebelliousness. We argue that within the toolbox of strategies available to tweeters to stylise themselves as ‘non-posh’, palatalised -s is a tool to add a shade of ‘streetwise’ or ‘tough’ to a modern, jocular, or casual image.
Discussion
Let us discuss our Twitter findings in terms of Research questions 2 and 3. To start with Research question 3, our data clearly illustrate that the palatalisation of /s/ has left its original habitat to diffuse across the whole of Flanders. When we focus on the nature of the diffusion, it appears to be more compatible with a gradual, estafette-like change model than with a synchronic nation-wide mediatisation boost through television (as in Sayers’ Reference Sayers2014 Mediated Innovation Model): there is little in the diachronic evolution of the preference for palatalisation which suggests any outspoken, let alone lasting impact of the media attention for Citétaal. While a mediated innovation effect would have showed up in the form of a palatalisation peak in 2014, our data show a continuous presence of the palatalised forms, and some evidence for gradual increase at the extremities of the territory in the Flanders provinces. In further support of our claim that there is little evidence for the Mediated Innovation Model, only 10% of the tweets in the dataset contain hashtags and none of them refer to #safetyfirst or #shtyle.
The answer to Research question 2a is clearly affirmative: it is possible to document the propagation in time and space of an essentially oral Citétaal feature like /s/ palatalisation on the basis of a corpus of Twitter data. So is the answer to Research question 2b: we can extract the social meanings purported to accelerate the diffusion of Citétaal from tweets. Our evidence suggests that tweeters who profile themselves as cool dudes and gals by pimping their tweets with linguistic and non-linguistic expressiveness resources, also have palatalisation in the toolbox as a stylising option. This indicates that palatalisation has been associated sufficiently frequently with modern streetwise prestige for it to be available as a conventionalised stylising resource. In the general discussion we return to this issue.
A crucial question which can also be answered at this point is to what extent the regional stratification of the experimental evaluation data in Study 1 and the regional stratification of the production data in Study 2 align. Recall from the introduction that one of the reasons why it is difficult to establish a causal relation between the production vitality of features and their social meaning is the paucity of data which confront the actual diffusion of an emergent or ongoing change with the evaluation of that change by potential adopters of the new feature. The data from Study 1 and 2 represent a rare exception to this lacuna, and if we compare the regionally stratified dynamism scores in Figure 2 with the regional diffusion of sibilant palatalisation in Figure 3, we observe an almost perfect match between the height of the dynamism scores and the relative frequency of Citétaal preference: the fact that respondents from the Limburg area evaluated Citétaal as the most dynamic guise is mirrored in the highest usage proportion of the Citétaal variant in Limburgian tweets; for the other regions, evaluation and propagation data also manifest outspoken alignment. If anything, this perfect alignment is strongly indicative of the impact of positive evaluation on propagation.
General discussion and conclusion
In the remaining part of this article we explore some of the theoretical ramifications of our findings. We zoom in on three important issues, two theoretical and one methodological.
The first pertains to the question how linguistic variants acquire their indexicalities, and what the exact role of mediatisation may be in that evolution. Preston (Reference Preston, Rosseel and Grondelaers2019) describes the process which underlies the conventionalised association of a form with a specific social meaning. In the case of Citétaal, Preston's account would go, hearers notice the palatalised pronunciation of stijl and correctly classify the producer as originating from one of Limburg's cités; they access the body of stereotypes associated with these cités and those beliefs ‘imbue’ the palatalised variant. Repeated imbuing leads to an iconic link between variant and social meaning. While mediatisation in the form of televised and cinematic exposure does not seem to have any direct impact on the propagation of new forms, what it probably does effect is a progressive strengthening of the iconic link, and a wider availability of the link than the Limburg area. More importantly, we believe that the strengthened iconic link loses its original association with the housing estates and its ethnic inhabitants when it is exported outside the Limburg area. What is eventually transferred is the second- or even more likely the third-order association between palatalisation and streetwise cool. We propose that televised mediatisation accelerates second- and third-order reinterpretations of indexical links by transmitting to a wider audience the positive elements of the original Cité profile (young, cool, streetwise) and demoting the more negative attributes of the original users (including machismo and lack of sophistication).
The nationally transmitted and strengthened iconic link between the Citétaal variants and an array of attractive third-order social meanings, motivates adolescents or young adults to adopt the variant(s) in interaction with other adolescents who do not belong to the socio-demographic group that initially used it, but who have credibly appropriated the variant and successfully exploit it to stylise themselves as streetwise and cool. Hence, the actual diffusion may take place interactionally, but it is facilitated through mediatisation. The driving-force, in any case, is social meaning.
Second, we hope to have demonstrated that the synchronicity of the production and the evaluation evidence for a change such as sibilant palatalisation, makes it arguably plausible that evaluation, if not prompted, then at least facilitated the change. Still, the fact that positive evaluation can be shown to drive, or facilitate, or boost change does not invalidate the more mechanic interactional frequency and network density accounts of the Labovian thinkers. But does Bloomfield's principle of density (Reference Bloomfield1933:476) really suffice to account for change? Why do speakers adopt variants from other speakers in interaction? Why does only a limited number of innovations spread throughout a community? Sneller & Roberts (Reference Sneller and Roberts2018) convincingly argue that the diffusion of linguistic phenomena is driven by a combination of neutral mechanistic processes (such as interactional frequency) and the availability of alienable social meaning. Sibilant palatalisation is a textbook example of the latter. It has acquired an attractive social meaning, and it has become alienable: the feature is no longer inherent to a specific population—viz. the migrant community of Limburg—but it can be appropriated by other speakers in order to express urban cool.
Whether palatalisation is going to persist in the Flemish repertoire is another matter. Both the speaker evaluation data and the Twitter dataset were collected in 2016, and in the meantime the diffusion of our Citétaal features seems to have lost some of its vigour, if only because the decreasing media attention has reduced their visibility. For the purposes of this article, however, the fact that non-standard features can diffuse (in defiance of a militant standard language ideology) when their social meaning (and probably also media) conditioning are optimal, is the crucial finding. In order to persist in Belgian Dutch, however, Citétaal features may need more than just the ability to portray their users as cool dudes and gals. As a case in point, compare the nearly completed diffusion of subject-hun in Netherlandic Dutch (Grondelaers, van Gent, & van Hout Reference Grondelaers, van Gent, van Hout, Christensen and Jensen2022): like Citétaal's, the propagation of hun has been carried by cool associations, but its continuation in Dutch is plausibly co-determined by an extra, grammar-internal benefit, viz. the fact that it has a function its standard competitor does not have (to the same extent).
On a final methodological note, we hope to have shown the merits of Twitter as an invaluable data source for the integrated study of rapid linguistic diffusion. In addition to being available in gigantic quantities, and allowing for some diachronic depth, Twitter features phonetic, lexical, and morphosyntactic cues which systematically reveal the regional and social identity of tweeters, but also their self-stylisations as superior, educated, intelligent or modern, cool, streetwise, and so on. As a consequence of these qualities, we hope to have shown, Twitter is a privileged field laboratory for the large-scale investigation of the impact of any conceivable predictor (including social meaning factors) on any type of variable. It is the optimum tool for investigating whether and to what extent (modern) prestige evaluations kick-start, boost, or facilitate the emergence and diffusion of novel forms. At present, there is no better explanation for the rapid diffusion of Citétaal across Flanders than its streetwise prestige.


 Open access